Article

Sustainability of China’s Singles Day Shopping Festivals: Exploring the Moderating Effect of Fairness Atmospherics on Consumers’ Continuance Participation

1
School of Management and E-business, Zhejiang Gongshang University, Hangzhou 310018, China
2
School of Computer and Information Engineering, Zhejiang Gongshang University, Hangzhou 310018, China
3
Financial Department of Zhejiang Gongshang University, Hangzhou 310018, China
4
Hithink Royalflush Information Network Co., Ltd., Hangzhou 310023, China
*
Author to whom correspondence should be addressed.
Sustainability 2020, 12(7), 2644; https://doi.org/10.3390/su12072644
Submission received: 24 February 2020 / Revised: 17 March 2020 / Accepted: 20 March 2020 / Published: 26 March 2020

Abstract

:
Singles Day Shopping Festival (SDSF) is one of the most influential online sales events in China. As a big production and even a well-known brand, SDSF has its own design, image, performance, and life cycle. Consumer satisfaction and continuous participation play an important role in the sustainable marketing of SDSF. This study empirically examined the antecedents of continuous participation intention by employing both expectation-confirmation theory (ECT) and stimulus-organism-response (SOR) model to reveal that promotion scale and social interaction have positive and significant effects on participants’ emotional satisfaction-as-trust and -pleasure, which subsequently lead to continuous participation behaviors. This study investigated participants’ perception of fairness atmospherics and its moderating effects on the positive links between promotion scale/social interaction and satisfaction, and the relationships between satisfaction and continuous participation intention. This study suggested that spending more money on jubilant festival buildings will not always exert more influence on participants’ satisfaction as expected. Alternatively, creating a good and fair trading environment will reach the same goal and promote the sustainability of SDSFs. More detailed findings and implications are also discussed at the end of the paper.

1. Introduction

Singles Day Shopping Festival (SDSF) is one of the most influential online sales events in China. The Alibaba Group, one of China’s e-retail giants, created again a new record of RMB 268.4 billion (US $ 30.8 billion) in gross merchandise volume (GMV), during 24 h on 11 November 2019 [1]. The date was chosen as Alibaba’s annual sales day because the co-occurrence of four “1”s has the symbolic meaning of loneliness for young individuals. Alibaba initialized the SDSFs with the slogan: “shop when you feel alone” since 2009. From then on, SDSF witnessed the average year-on-year growth of 230.70 % [1]. In fact, Alibaba regards SDSF as a huge product, which has its own design, plan, advertisement, promotion, budget, and performance assessment [2]. Moreover, Alibaba regards SDSF as a valuable brand and once even wanted to register a trademark for SDSF.
One objective of sustainable production is to create products or services by following the processes and systems that are economically viable, and socially, creatively rewarding for consumers. Some studies pointed out that large scale sales (e.g., Black Friday) are not economically efficient [3]. Thomas and Peters [4] and Lennon et al. [5] mentioned that consumers scramble for items sold at heavy discounts during Black Friday, which leads to the chaos in the store. Luo revealed that consumers will buy more items and pay more money when they shop with their friends [6]. Chen et al. argued that consumers are highly possible to perform impulsive shopping when they shop via social connections [7]. In addition, Dospinescu et al. mentioned that generation-Z expects benefits when using bank cards leading to impulsive shopping behaviors [8].
SDSF is indeed successful in marketing. However, the criticism of SDSF is always connected to luring consumers towards impulsive shopping. As SDSF attracts a large participant population and sells so many items that may cause environmental problems. Participants buy items they may not want causing waste materials. What is most important is how to keep SDSF developing sustainably and how to promote participants to consume rationally. Klimas and Shaffer found that as a holiday gift, individuals may feel more balanced between welfare gain and environmental burden when they receive paperback books rather than DVDs and hardcover books [9].
Regarding businesses, the demand for sustainable consumption drives entrepreneurs to develop new sustainability-derived products and services to improve sustainability within communities [10]. Alibaba tried to fulfill its social responsibilities. SDSF’s purpose is to bring comprehensive benefits to both sellers and buyers. Meanwhile, SDSF hopes to increase participant shopping enjoyment [2]. Therefore, according to Jayaratne et al. [10], the values underpinning sustainability entrepreneurship include fairness, responsibility, altruism, and integrity. Craig et al. mentioned that large companies have a responsibility to transit to a more sustainable future. Sustainable norms transmission can help large enterprises to meet their requirements [11].
As SDSF is a successful product, it is an important challenge for Alibaba to keep it running well. At the very beginning of SDSF, large discounts are a major incentive to attract consumers to participate. However, year by year, consumers are becoming tired of the discount games. What do they want? How can one make SDSF improve sustainably? How can one increase the efficiency of SDSF both in economics and society? To our best knowledge, there are still scant studies on these themes in the literature. Even more, there are rarely studies conducted on large scale online sales events. Lots of scholars may think that online shopping events are just the same as promotional events. The nature of such kinds of sales events had been investigated intensively as a promotion mix. However, some studies focused on non-economic factors. Xu et al. revealed that consumers participating behaviors in OSFs are positively related to externally informational incentives and social influence, inducing collective herd behaviors [12]. The bandwagon effect is another theory used to interpret individual consumers intentions to think and act in conformity with the collective under social pressure, rationally or irrationally [13].
It is extremely important for Alibaba to know how to promote the SDSFs to benefit buyers, sellers, communities, and organizations for the long term. Kolter started the literature stream retailing atmospherics. The term “atmospherics” is coined to refer to the intended atmosphere settings the retailers established to attract consumers [14]. To SDSF, the shopping festival atmospherics is one important part of the product’s environmental design. Besides the physical cues, cultural cues, and online cues, another important cue is the atmospheric dimension of fairness. Alibaba is the rule maker and the regulator in this huge sales event. To what extent, and how the fairness atmospherics influences participants’ intention? To our best knowledge, there are no previous studies yet. To fill the gap for the literature, this present study investigated the motivations of consumers’ continuance participating in SDSFs by employing both the expectation-confirmation theory (ECT) and the stimulus-organism-response (SOR) model. In addition, the moderating effect of fairness atmospherics is verified.
The rest of the paper is organized as follows. In Section 2, after reviewing the academic studies on shopping festivals and festival shopping, we briefly introduce the expectation-confirmation theory and the stimulus-organism-response framework used in this study and define the stimulus, organism, and response variables. We develop a set of structural hypotheses to investigate the relationships between variables and the moderating effect of fairness atmospherics in Section 3. Measure design and questionnaire data analysis are presented in Section 4 and Section 5, respectively. At last, conclusions and both theoretical and practical implications are given in Section 6.

2. Literature Review and Theoretical Background

2.1. Shopping Festival vs. Festival Shopping

The bazaar, the primary form of regional market, has a long history in Asia [15]. It is a small-scale shopping festival in a certain sense. Pedlars and residents periodically converge to exchange materials and products without intensive ceremonies and advertising, just because of demand and custom [16]. People in most countries have the custom of gift exchanging in major festivals, such as Christmas [17,18], Chinese New Year Festival [19], etc. As times passes, the requirement for festival shopping facilitated the formation of shopping festivals. Except for cultural factors, extant studies show that sex, gender-role attitudes, gender identity [17], and marketing mix strategy of price, product, and promotion [19] impacts on consumers’ festival shopping behaviors. Shopping atmospherics, such as decorations, music, and other situational variables, also influence consumers’ festival shopping decisions and entertainments [18,20]. What is more, consumers even have misbehaviors in Black Friday due to the competition design of promotion [4,5]. The initial purpose of Alibaba’s SDSF was to meet the demands of gift shopping for singles. Alibaba hopes to build festival atmospherics to establish consumers’ loyalty. However, as an informal and unpopular festival, to what degree can the cultural factors of Singles Day promote SDSF sustainably is still in doubt. In fact, perceived crowding is not always a good experience in retailing scenarios [21,22]. Therefore, in this study, the authors try to identify the atmospheric cues and investigate to what extent they influence consumers’ continuance participation intention, which subsequently promote the sustainably development of SDSFs.

2.2. Expectation-Confirmation Theory (ECT) and Consumers’ Continuance Behaviors

Expectation-confirmation theory (ECT) explores that consumer satisfaction is the antecedent of consumers’ post-purchase and continuance purchase behaviors [23]. Consumer satisfaction refers to consumers’ experience-based attitude change after perceiving disconfirmation between expectations and the performance of a product, service, or activity [24]. Outperforms result in positive disconfirmation, consequently positively influence consumer satisfaction, which determines their intention to repurchase products or reuse services, while underperforms go along in the opposite direction [24].
However, satisfaction judgment may have variety of emotional patterns rather than something at least as good as supposed [25], such as satisfaction-as-pleasure, -novelty, -contentment, -surprise, -relief, -trust, etc. [26]. Consumers’ cognitive and affective responses have separate influences on their satisfaction formation. Emotionally-based satisfaction is a better predictor of consumers’ future behavioral intentions [27,28] and consumer loyalty [29] than cognitively based satisfaction.
Participants are attracted by deep discount and large-scale promotions in SDSFs. What they expect most is to buy admired items with favorable prices as well as taking pleasure from their purchases. Therefore, identifying the effect of emotional confirmation and satisfaction of participants’ responding to sustainable SDSFs on their future continuous behaviors is another motivation of this study.

2.3. The Stimulus-Organism-Response (SOR) Framework

The Stimulus–Organism–Response paradigm borrowed from environmental psychology explains that environmental stimuli (S) affect internal states of organisms (O), and subsequently drive their behavioral responses (R) [30,31]. In the context of consumer behavior, stimuli are external to the person and consist of marketing mix variables and other environmental inputs, while organisms are the inner states of perceptions, feelings, and thinking exercises [32].
The SOR framework is appropriate for this study because of three reasons. First, SDSFs exert varieties of external stimuli to potential participants, including advertisements, promotions, social interactions, etc. The SOR framework has been extensively and successfully used in previous studies on consumers’ behavioral responses to marketing promotions [33,34].
Second, the shopping festival atmospherics built by Alibaba is another type of environmental stimulus. We need a systemic framework to help distinguish in which actual positions the atmospheric cues take effect. In fact, the SOR framework has been used to investigate the moderating effect of atmospheric cues on consumers’ intention, e.g., the ambiance of theme restaurants [35], and the aesthetic design of the home page [36].
Finally, the atmospheric cues also play a major role in the sustainability of SDSFs, both cultural and non-cultural ones. Xia and Monroe argued that consumers concerns about the fairness of promotions more than the economic value [37]. Wang et al. revealed that consumers with high personal environmental commitment have more perception of fairness to green offerings [38]. Because SDSF is the intermediary platform rather than the trader or even the stakeholder, participants need a fair trading environment [10].

2.4. Promotion Campaign as Stimuli (S)

Sales promotions, as one element of marketing mix strategy [39], are temporary incentive events targeted directly at consumers to stimulate quicker and greater purchases [40]. Many studies have reported that consumers will change their shopping behaviors (e.g., impulse shopping [41], brand switching [42] after either monetary or non-monetary promotional activities.
However, the SDSF is different from any store-level, retailer-level, or brand-level promotional event in two aspects: promotion scale and social interaction. Few studies in the literature have addressed the impact of promotion scale on consumer behaviors. Similar concepts include distribution intensity [43], promotion intensity [44], and advertising spending [45,46]. The SDSF launches the promotion campaign, by combining a variety of communications, with a wide coverage of brands and items, in a large volume of deals and supplies, and generating the supply-side economics of scale. Therefore, the comprehensively large scale of SDSF promotion campaign is a stronger stimulus to participants, because they expect to have more choices, more chances, and more benefits.
On the other side, social interaction is the demand-side stimulus, referring to the communication, recommendation, and imitation among participants’ social connections [47]. Thanks to the high penetration of social media, participants are more likely to be exposed to the promotion campaign via their friends. However, social interaction is reciprocal in the SDSF context [12,48]. Anastasiei and Dospinescu revealed that the volume and valence of the electronic word-of-mouth online are both predictors of the sales for online retailers [49].

2.5. Emotional Satisfactions as Organism (O)

According to the ECT theory, satisfaction is regarded as consumers’ judgment outcome from the comparison process of product performance and expectation performance [23]. More generally, the concept of overall satisfaction is regarded as “an overall evaluation based on the total purchase and consumption experience with a good or service over time” [50]. Further, festival satisfaction is regarded as “overall satisfaction based on overall festival value evaluated by the composite of quality dimensions” [51].
Tastes differ. Every consumer participating in SDSF may have his/her own goals and expectations. One may be satisfied while another may not in a similar situation. Tanford and Jung revealed that festival activities (program, entertainment, and thematic activities), environment (atmosphere, convenience, and facilities), and attendees’ perception of cost/value are the most important determinants of satisfaction and loyalty [52]. Participants’ satisfaction judgment may take a long period, covering all the services for plan, comparison, negotiation, shopping, communication, and delivery [53]. Participants may evaluate whether the price discounts they obtain are worthy of the time cost and efforts they put on shopping [54].
It is too complicated to identify, classify, and measure participant satisfaction in one study. If we look at SDSF as a big innovation product as a whole, providing large-scale dealing services, or a new brand of sales events, SDSF may have its own quality and performance for participants. Alibaba keeps promising and declaring to bring good deals with large discounts to participants and it seems to have put lots of efforts into this goal [2]. The functional design and statement of the shopping festival helps consumers form initial expectations and guide their satisfaction judgments.
Emotionally-based satisfactions may be more suitable in the SDSF context [26,27,28,29], because lots of consumers change their shopping schedule, prepare a shopping list several weeks ahead of SDSF, and wait for the arrival of SDSF. For simplicity, we only consider two kinds of them: satisfaction-as-trust and satisfaction-as-pleasure.
Satisfaction-as-trust is regarded as the overall satisfaction of attention-related disconfirmation. Consumer trust is a broad concept referring to reliance, credibility, honesty, benevolence, confidence, trustworthiness, little risk in dealing with expertise, and perceived competence [55]. The dimension of expertise and competence refers to the ability perceived by consumers to fulfill promises [56,57] and meet commitments [58,59]. Satisfaction-as-trust is about participants’ emotional judgment on whether the benefits they might get meet the promises or commitments by SDSF.
On the other hand, satisfaction-as-pleasure is regarded as the overall satisfaction of process-related disconfirmation. Hedonic consumption relates to “the multisensory, fantasy and emotive aspects of shopping experience” [60]. The shopping pleasure comes from both “the product or event and the consumer’s personal experience with or interpretation of the product or event” [61]. Thus, satisfaction-as-pleasure in this study is about participants’ emotional judgment on whether they feel happy, pleased, excite, interesting, etc. [62,63,64] during SDSF, because Alibaba puts lots of efforts into establishing carnival atmospheric settings and declares “Retail as Entertainment” as one aspect of its so-called “New Retail” strategy.

2.6. Continuance Participation Intention as Response (R)

Continuance participation intention indicates an individual’s willingness to attend the same festival or event, based on his/her previous experiences [65]. Continuance behaviors sometimes are related to habit [66], loyalty [51,52], and culture [18]. In addition, repeat visitors are more likely to spread positive word-of-mouth about the festival than occasional visitors [67]. In the SDSF context, continuance participation intention may include deliberate preparation behaviors for the SDSFs in advance. The continuance participating population is the element of the sustainability of SDSFs.

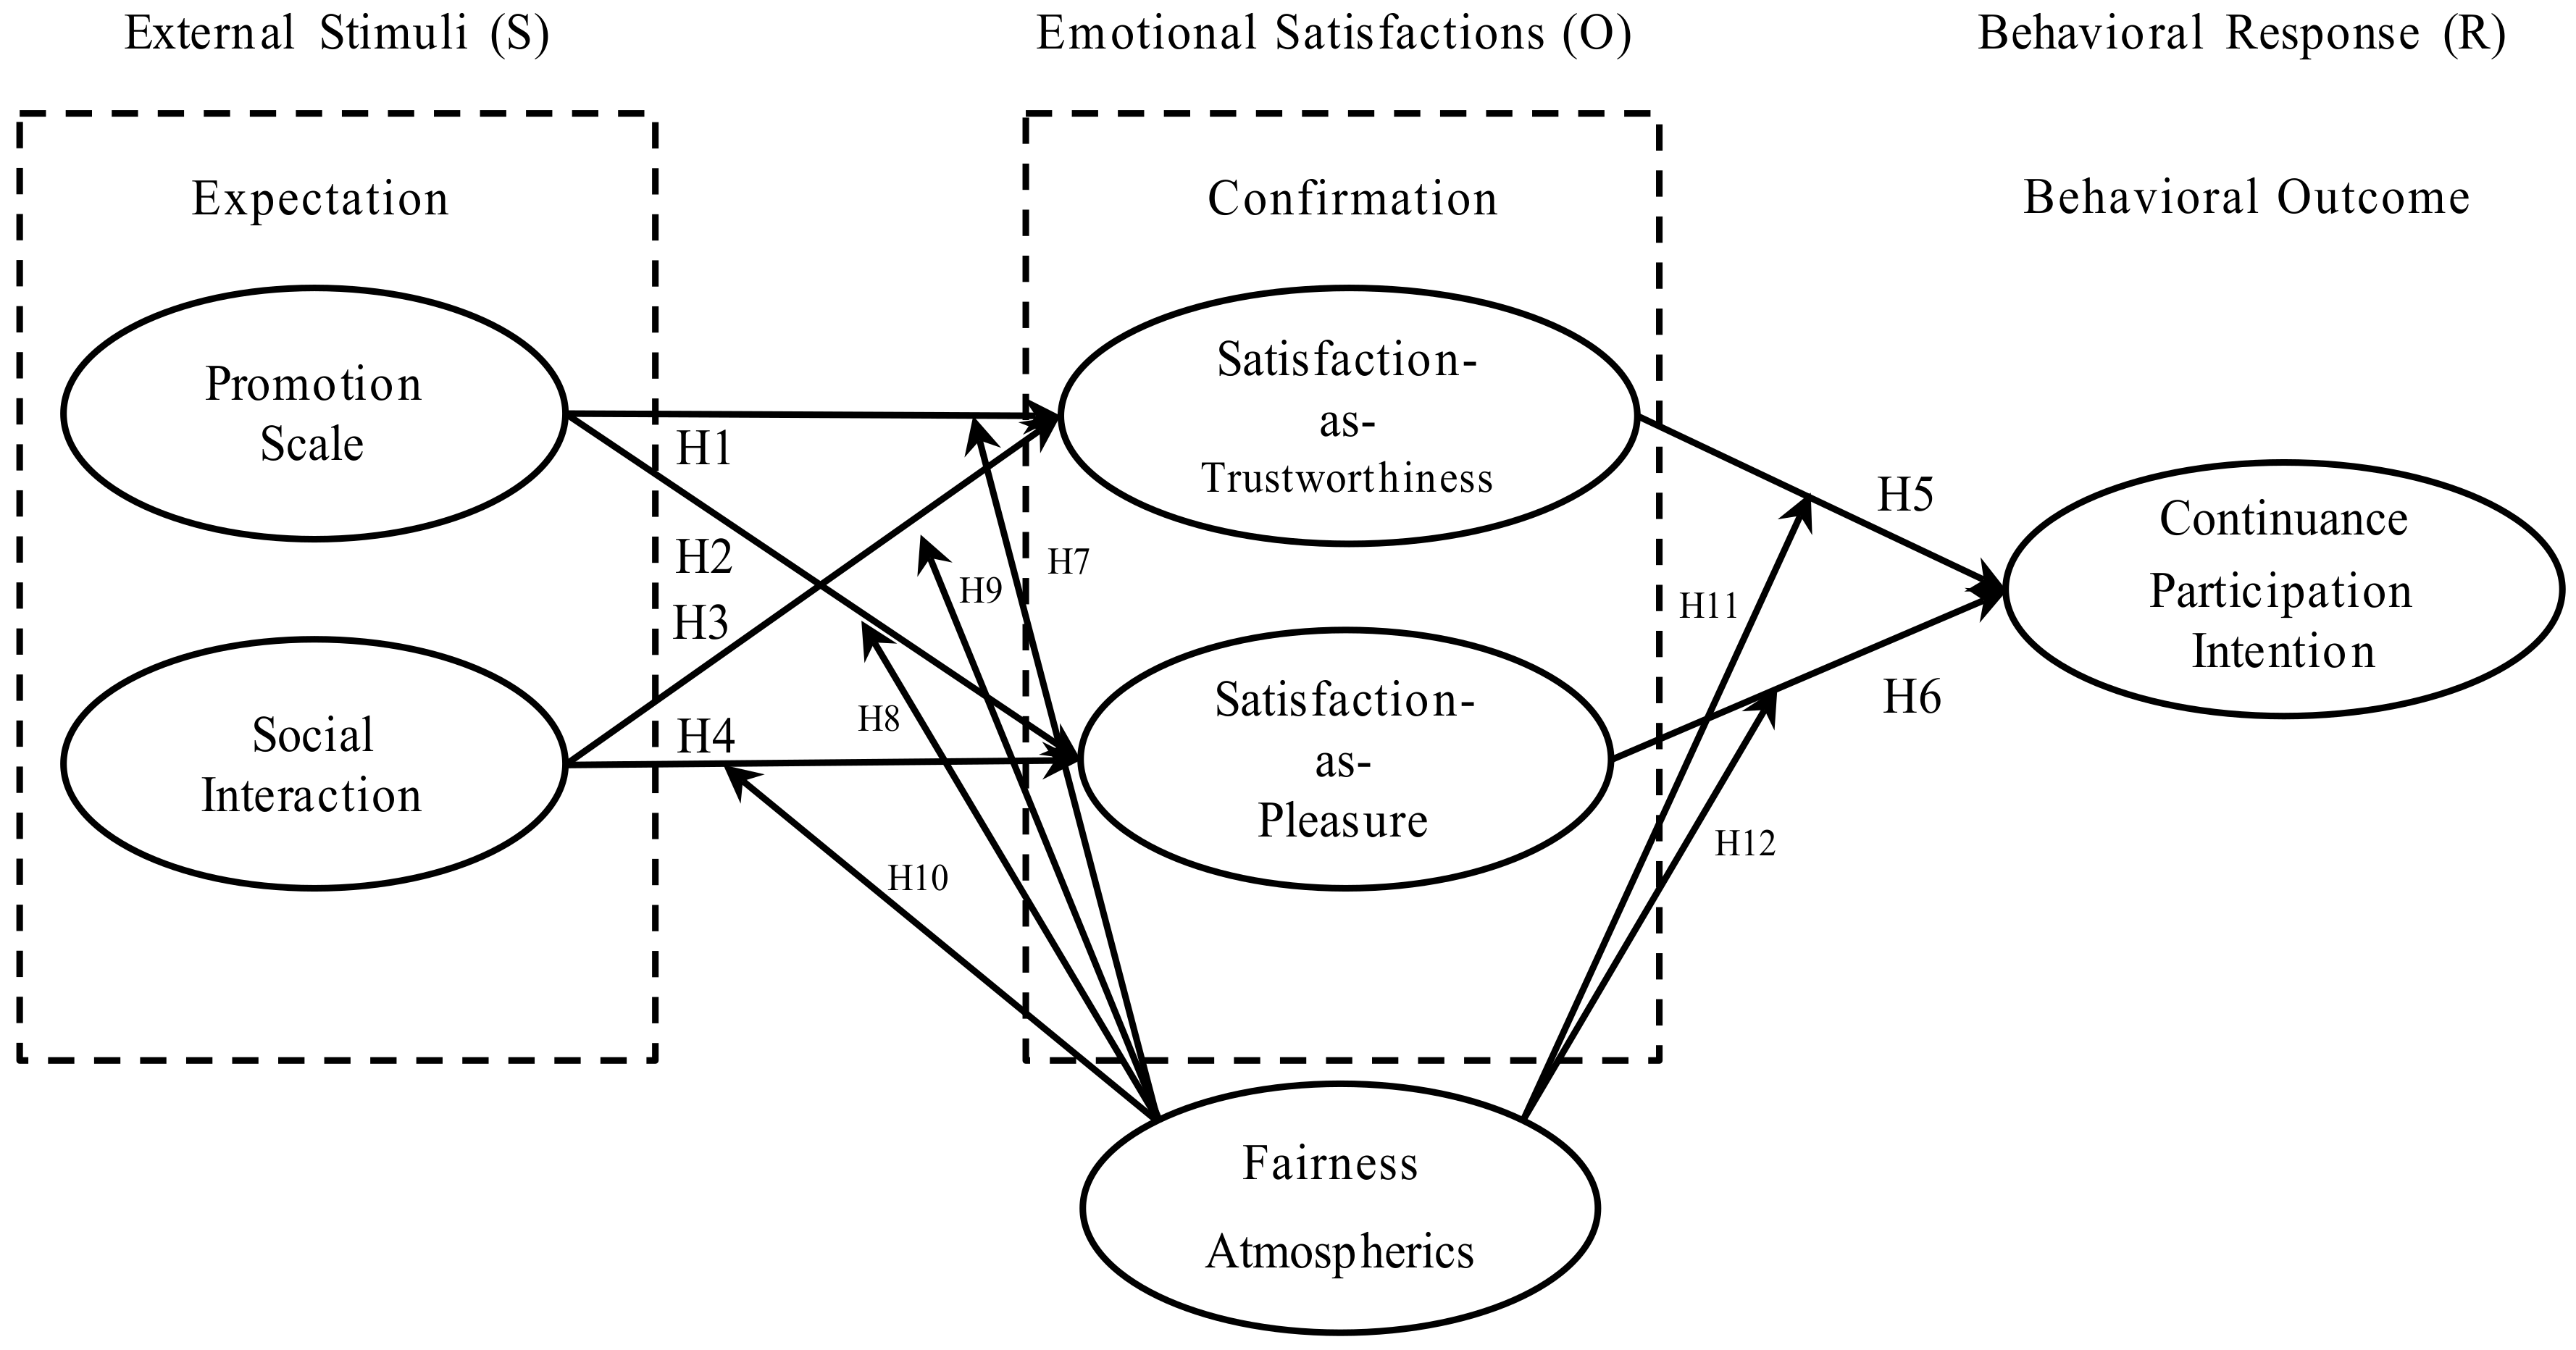
3. Research Model and Hypotheses Development

The authors develop an integrated SOR-ECT model (as shown in Figure 1), which identifies determinants of continuance participation intention to SDSFs, and the actual effect of fairness atmospherics for SDSF.

3.1. Relationship between Promotion Scale (S) and Satisfaction (O)

13666678850 Consumers may have preconceived ideas that the more items they buy at one time, the more price reduction they can get [68]. Consumers may also think on instinct that the larger the promotion scale, the fiercer the competition among sellers because of information transparency, and the more benefits they can obtain [69,70]. In addition, Swilley and Goldsmith demonstrated that consumers participate on Cyber Monday because of their perception of convenience, usefulness, and effectiveness [71]. The large promotion volume organized by SDSF may improve shopping convenience and effectiveness. Participants may expect that they have more chances to get what they want with lower prices than ordinary, and more choices to avoid constraints for discounted items they want, and finally achieve more benefits from SDSF.
Size is always what consumers matter in forming trust [72]. Intensive distribution of promotion gives consumers more time and place utility and makes them perceive more value for the product, leading to greater consumer satisfaction [73]. Greater concentration in distribution of promotion expands consumers’ awareness of the brand and/or its reputation and signals the brand’s strength and commitment to serving the market [43]. The large promotion scale helps consumers confirm that Alibaba has technical abilities, financial competencies, supply chain resources, logistics networks, and human resources to fulfill her promises and commitments of SDSF and realize consumers expectations [57].
In summary, trust and satisfaction have close connections [52,58,59] and are both triggered by the positive disconfirmation through the large promotion scale of SDSF. Therefore, this study proposed the following hypothesis:
Hypothesis 1.
Large promotion scale will positively affect participants’ satisfaction judgment as trust of SDSFs.
Swilley and Goldsmith reported that US consumers agree the shopping experience during Cyber Monday is fun, exciting, and enjoyable [71]. Participants expect to have more chances to get coupons, patronage rewards, red envelopes, etc. and to have a more pleasant experience during SDSF. The so-called limited time or limited offer with an ultra-low price stimulates participants to wait for the very moment to snatch up the item. Extra discounts come after spending a certain amount. Participants may receive red envelopes—Chinese monetary incentives, via social network services (SNS) [2]. Further, celebrities, fashion leaders, endorsers, sellers, and consumers are all welcome to take part in interactive games [12]. Renard showed that consumers’ flow experience of online promotional games will positively impact their word-of-mouth diffusion [74]. All these kinds of incentive activities and games are scarce in ordinary promotions.
Shopping crowdedly is not always a good experience in the retailing environment [21,22]. However, as Alibaba had improved its IT systems and logistics system to meet the peak demand during SDSF, participants need not worry about the service quality again [2]. Herd effect enhances participants’ positive disconfirmation of pleasure [12]. The larger the promotion scale, the higher opportunity to have pleasure in SDSF. The positive disconfirmation of the pleasure experience triggers participants’ satisfaction judgment. Thus, this study proposed the following hypothesis:
Hypothesis 2.
Large promotion scale will positively affect participants’ satisfaction judgment as pleasure of SDSFs.

3.2. Relationship between Social Interaction (S) and Satisfaction (O)

Good social interaction between retailers and consumers can help trust formation [47]. Alibaba spent a lot on advertising to build a good image of SDSF, making participants expect to have good deals and experience. Ou and Davison showed that the effective buyer-seller communication at Taobao.com can improve the trust of Chinese buyers [75]. On the other hand, interpersonal interaction among participants seems more important in the Internet 2.0 era. In collectivist cultures, such as China, social interaction is a crucial way to form collective trust [48]. First of all, the discount messages received by participants from their connections via online social networks give them initial cues to expect good chances from SDSF [76]. Meanwhile, these messages make them believe that they will get benefits from SDSF as same as many friends of them. Second, the interaction during attending makes participants confirm Alibaba has the competencies to fulfill her promises and commitments of SDSF. Finally, other participants’ positive word-of-mouth of shopping experiences enhance the positive disconfirmation of trustworthiness on SDSF [77].
In fact, in the context of social commerce, consumers place more trust in social interaction. Kim and Park found that WOM referrals positively impact consumers’ trust formation in social commerce as the same as the firm’s reputation [78]. Subjective norm is another antecedent of consumer trust [79]. Social presence of interaction on the social media gives consumers a good image of integrity, benevolence, and competence, and results in a satisfaction judgment of trust [80]. Therefore, this study proposed the following hypothesis:
Hypothesis 3.
Social interaction will positively affect participants’ satisfaction judgment as trust of SDSFs.
Many studies show that shopping with others is happier than shopping alone [6,12,61]. As a hot event, SDSF provides participants the chance to socialize. Social shopping is a collective activity “focusing on people being altruistic, cohesive, and seeking acceptance and affection in interpersonal relationships” [81]. Further, In collectivist cultures such as China, “the more collectivistic customers, the more enjoyment they will get from online social interaction” [48].
SDSF makes participants expect to have hot topics for talking about in their online circle. Participants may feel pleased in sharing messages of price reduction, recommending others discount packages, teaching others the techniques for snatching up time-limited items, posting pictures of good deals, and waiting for others to click “like”, etc. [12]. They may feel happy when they are looked like smart shoppers. The responses from and reciprocal communication with others will lead to the positive disconfirmation of shopping pleasure, and consequently affect their satisfaction judgment. Thus, this study proposed the following hypothesis:
Hypothesis 4.
Social interaction will positively affect participants’ satisfaction judgment as pleasure of SDSFs.

3.3. Relationship between Satisfaction (O) and the Continuance Behavior (R)

As mentioned above, satisfaction directly leads to consumers’ continuance behaviors [52,64]. Trust is always the construct accompanying satisfaction gives a stronger prediction of future continuance behaviors [56,57,58]. Because Alibaba is the e-commerce giant of China, participants have the reason to believe the SDSF can be a far larger scale promotion than any store-level, retailer-level, or brand-level promotion. The positively disconfirmation of the external stimuli from large promotion scale and social interaction makes them be satisfied and decide to continuously participate in. On the other hand, the hedonistic shopping experience always arouses participants’ emotional satisfaction [25,52,59,66]. Although participants may have positive or negative comments after each SDSF, their continuance intention derived from two kinds of satisfactions can be used to partially explain the ever increasing participating population and sales volume in the past eleven years. Therefore, this study proposed the following two hypotheses:
Hypothesis 5.
Participants’ satisfaction judgment as trust will positively affect their continuance participation intention.
Hypothesis 6.
Participants’ satisfaction judgment as pleasure will positively affect their continuance participation intention.

3.4. The Moderating Role of Fairness Atmospherics

In this study, we employed the concept of “fairness atmospherics” as the trading environment Alibaba built to attract consumers to participate in, including the specific website design, intensive advertisements on mass media and social media, and delicately designed incentive games, etc. In general, shopping atmosphere has two kinds of effects on consumer behavior. One is the direct effect. The atmosphere and environment of physical stores or restaurants include ambient factors, design factors, and social factors [82,83,84]. The atmospheric cues, such as color, lighting, music, temperature, decoration, furniture, etc. will directly affect consumers’ shopping intentions. Harmonious environments facilitate consumers’ pleasure judgment [85]. The aesthetic design of webpages, such as graphics, color, links, menu, etc. will also directly affect consumers shopping intention in the e-commerce context [86,87]. Necula et al. argued that the e-commerce quality can be improved by 356 semantic web technologies which enhances the consumers’ shopping convenience [88]. In addition, eye-ball tracking analysis revealed that consumers’ eye-balls move frequently back and forth between the elemental controls of the e-commerce site [89]. As a big sales event, trade fairness should include price fairness, procedure fairness, and transaction fairness [37]. Participants’ perception of fairness has moderating effects on their perception of economic value and behavioral outcomes [38]. To distinguish what effect will the fairness atmospherics take at the specific position, we proposed the following hypotheses:
Hypothesis 7.
Fairness atmospherics moderate the relationship between promotion scale and participant satisfaction judgment as trust.
Hypothesis 8.
Fairness atmospherics moderate the relationship between promotion scale and participant satisfaction judgment as pleasure.
Hypothesis 9.
Fairness atmospherics moderate the relationship between social interaction and participant satisfaction judgment as trust.
Hypothesis 10.
Fairness atmospherics moderate the relationship between social interaction and participant satisfaction judgment as pleasure.
Hypothesis 11.
Fairness atmospherics moderate the relationship between participant satisfaction judgment as trust and continuance participation intention.
Hypothesis 12.
Fairness atmospherics moderate the relationship between participant satisfaction judgment as pleasure and continuance participation intention.

4. Measurement Development and Data Collection

4.1. Measurement Development

All of the constructs and the corresponding measure items are listed in Table 1. Each of the items was measured with a seven-point disagree-agree Likert scale (1 represents “strongly disagree” while 7 represents “strongly agree”). The six constructs were all adapted or modified from the previous literature to fit the context of this study. Specifically, the items measuring promotion scale were adapted from Yoo et al. [73] and Florence et al. [44]. The items measuring social interaction were adapted from Arnold and Reynolds [81] and Xu-Priour et al. [48]. The items measuring satisfaction-as-trust and satisfaction-as-pleasure were combined with trust, pleasure, and satisfaction, respectively. As items measuring satisfaction are adjectives of cognitive or emotional judgments [23], which have close meanings in Chinese, we only varied the items of trust and pleasure for simplicity. The items measuring trust were adapted from Flavián and Guinalíu [57], Loureiro and González [58], and Loureiro et al. [59]. The items measuring pleasure were adapted from Babin et al. [62], Childers et al. [63], Jones et al. [64], and Kim et al. [90]. The items measuring fairness atmospherics were adapted from Xia and Monroe [37] and Wang et al. [38]. Finally, the items measuring continuance participation intention were adapted from Kim and Park [78], Choo et al. [67], and Fang et al. [91].

4.2. Data Collection

The data collection was outsourced to a third-party company: wjx.cn (https://www.wjx.cn/), one of the largest online survey companies in China. The service provider of wjx.cn had deposited a lot of respondents and volunteers over years, including college students, white collars, urban residents, etc. With the rapid popularization of intelligent mobile phones and wireless communication networks, responders were recruited to answer the questionnaire everywhere. We hoped that wjx.cn could take advantage of her large respondent pool to make samples more random and ensure our study is more representative. We paid wjx.cn about $ 1 for one questionnaire and collected data twice. We used the first-time data for the exploratory factor analysis. And then, we simplified the structural model and measure items according to the responses of the first-time sampling. We collected 351 questionnaires after one week’s waiting for the second time. 19 of them we determined to be invalid. The demographics of the respondents were listed in Table 2. It was worth noting that nearly 95.18 % of respondents had participated in SDSFs several times. Only 16 respondents ( 4.82 % ) had never participated in SDSFs. This was why the participant population increased in a snowball growth for the last eleven years.

5. Data Analysis and Results

To test our measurement and structural model, we employed structural equation modeling (SEM) using IBM SPSS AMOS (version 21.0) add-on software. SEM is considered as a powerful tool combining principal components analysis and regression to estimate the measurement and the structural model with the graphical interpretation [92]. López-Bonilla and López-Bonilla mentioned that covariance-based SEM (CB–SEM) approach is sometimes different from the partial least squares SEM (PLS–SEM) approach [93]. The authors observed a model including attitude in technology acceptance model (TAM) is better explained by the PLS–SEM approach while a model excluding attitude in TAM is better explained by the CB–SEM approach. In fact, the SOR model is a well-verified model and hypotheses in the present study are not of exploration. Therefore, we use the CB–SEM methodology to verify our model. In addition, we used SPSS (version 22.0) to verify the moderating effects in this study.

5.1. Measurement Model Validation

We examined the measurement model by running a confirmatory factor analysis (CFA) with the maximum likelihood estimation. Specifically, we assessed the measurement model by testing content, convergent, and discriminant validities, respectively. As mentioned above, by literature reviewing and analyzing the responses from the first-time exploratory sampling, we confirmed that the improved instrument of the second-time confirmatory model is content validity. Convergent validity was assessed by testing the values of factor loading, average variance extracted (AVE), composite reliability (CR), and Cronbach’s Alpha. The results are listed in Table 3. The results show that all item loadings are above 0.7. The threshold levels for AVE, CR should be 0.5 and 0.7 [94], respectively. The threshold level for Cronbach’s alpha is 0.7 [95]. Therefore, all of the values of item loadings, AVE, CR, and Cronbach’s alpha are considered satisfactory. Finally, the discriminant validity determines whether a construct is different from other constructs. To evaluate the discriminant validity, we adopted two methods [96]. First, according to Fornell and Larcker [94], we evaluate the discriminant validity by comparing the correlations among constructs and the square root of the AVE of constructs. As shown in Table 4, the square roots of the AVE are higher than the correlations among constructs, indicating good discriminant validity. Second, we examined the items in the item loadings and cross-loadings to construct the correlations. As shown in Table 5, all the item loadings of the corresponding constructs are higher than the cross-loading value of other potential variables, supporting the sufficient discriminant validity.

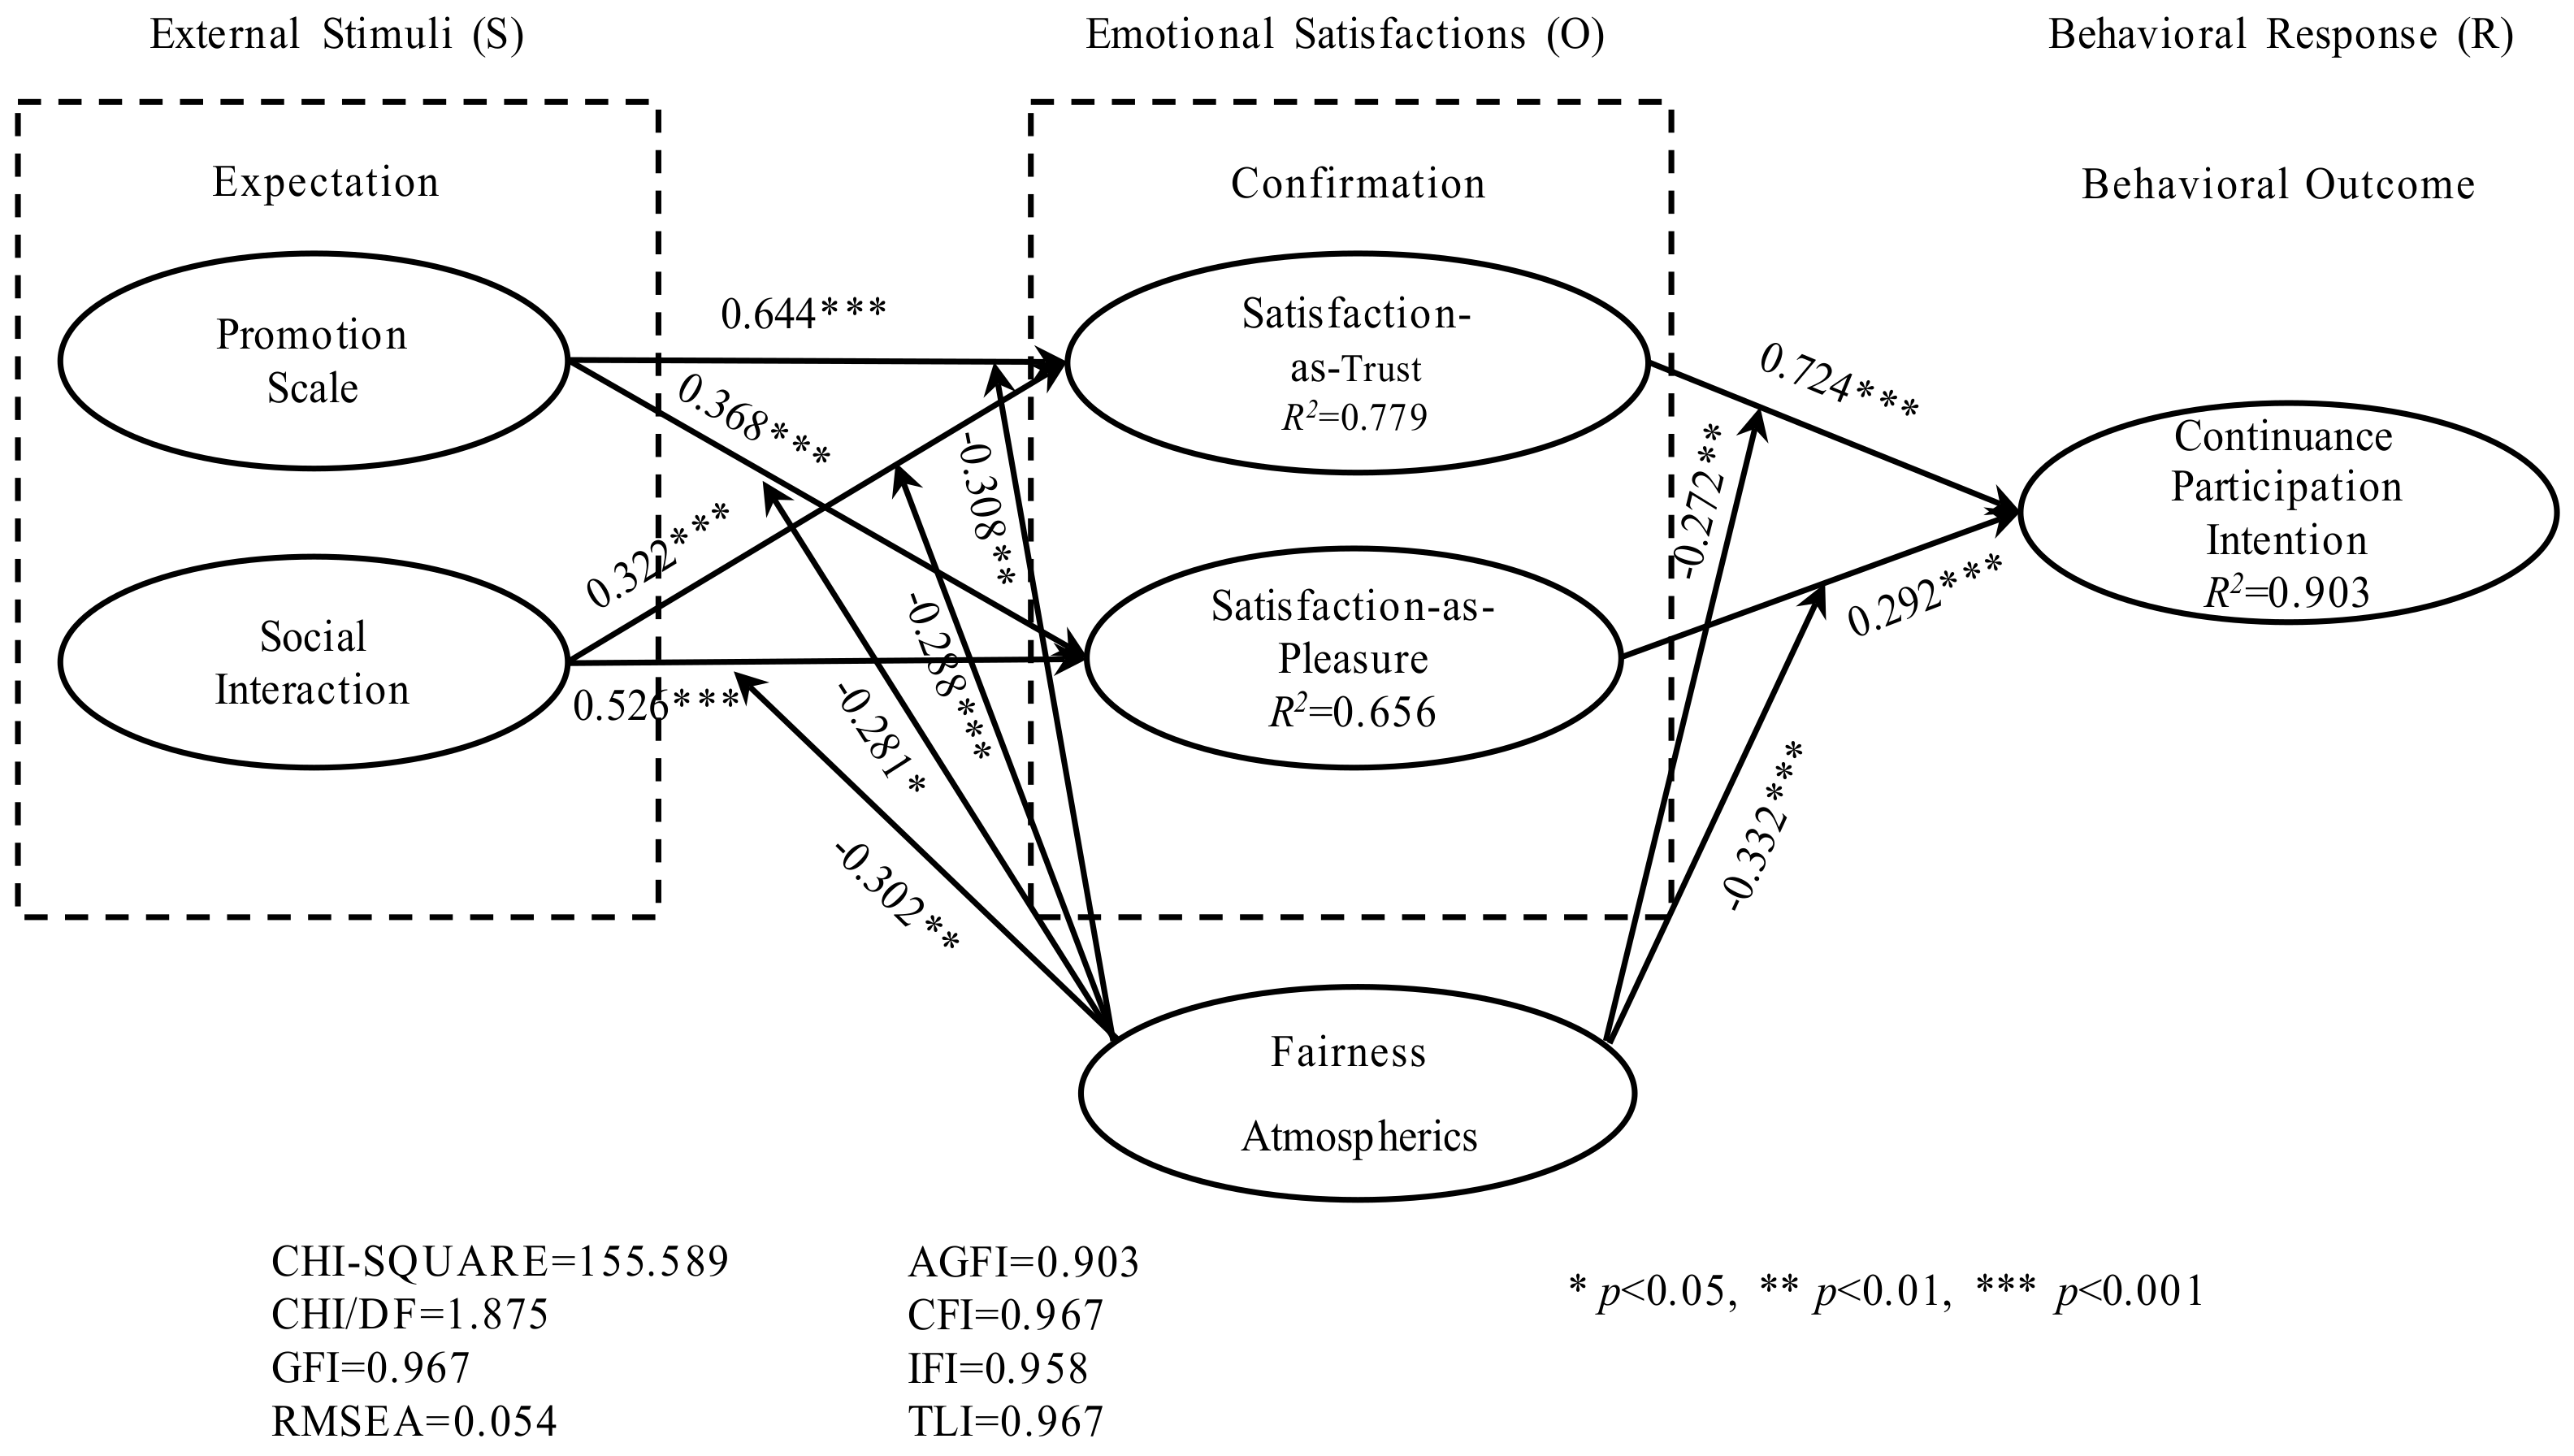
5.2. Structural Model with Results

We employed AMOS to test the hypotheses proposed in Section 3. Figure 2 shows the results of the structural model, including the standardized path coefficients, significance, and variance explained (R2). The overall fit indices for the model are acceptable as they are within the commonly accepted values. Chi-square/df is 1.875 , RMSEA is 0.054 , GFI is 0.967 , IFI is 0.958 , TLI is 0.967 , AGFI is 0.903 , and CFI is 0.967 . The calculating results show that the path coefficients are all significant. The results indicate that promotion scale has a significantly positive effect on satisfaction-as-trust (H1: b = 0.644 , p < 0.001 ) and satisfaction-as-pleasure (H2: b = 0.368 , p < 0.001 ). Therefore, H1 and H2 are accepted. Social interaction has a significantly positive effect on satisfaction-as-trust (H3: b = 0.322 , p < 0.001 ) and satisfaction-as-pleasure (H4: b = 0.526 , p < 0.001 ). Thus, H3 and H4 are accepted, too. In addition, the results indicate that satisfaction-as-trust has a significantly positive effect on repeat participation intention (H5: b = 0.24 , p < 0.001 ). Satisfaction-as-pleasure has a significantly positive effect on repeat participation intention (H6: b = 0.292 , p < 0.001 ). Thus, H5 and H6 are accepted.

5.3. The Moderating Effect of Fairness Atmospherics

5.3.1. The Hierarchical Regression Analyses

To test the moderating effects of participants’ perceptions of fairness atmospherics, the hierarchical regression analyses were performed. First of all, we split respondents into two groups using a factor score for the perception of fairness atmospherics. Specifically, we used the Anderson–Rubin factor score function provided by SPSS to synthesize the three-item variable of fairness atmospherics into a one-dimensional standardized score with zero mean and unit variance. Thus, respondents with a factor score of less than zero were assigned to the group with a lower perception of fairness atmospherics (139 respondents). Conversely, respondents with a factor score of greater than zero were assigned to the group with a higher perception of fairness atmospherics (193 respondents) (as listed in Table 6). Then, according to the hierarchical regression analyses, the independent variable, the moderating variable, and the interaction term were entered into the model in three steps, respectively. If the interaction term was significant, it could be determined that participants’ perceptions of fairness atmospherics had the moderating effect [97]. The model can be specified as follows:
Y = β 0 + β 1 X 1 + β 2 D + β 3 X 1 × D + ϵ .
where Y is satisfaction-as-trust or -pleasure in the analyses of moderating effect on the relationships between external stimuli and emotional satisfactions, and Y is continuance participation intention in the analysis of moderating effect on the relationships between emotional satisfaction and continuance participation intention, D is a dummy variable for the perception of fairness atmospherics (i.e., 1: high FA perceived group and 0: low FA perceived group), X 1 × D is the interaction term, β i represents regression coefficients, and ϵ is an error term.

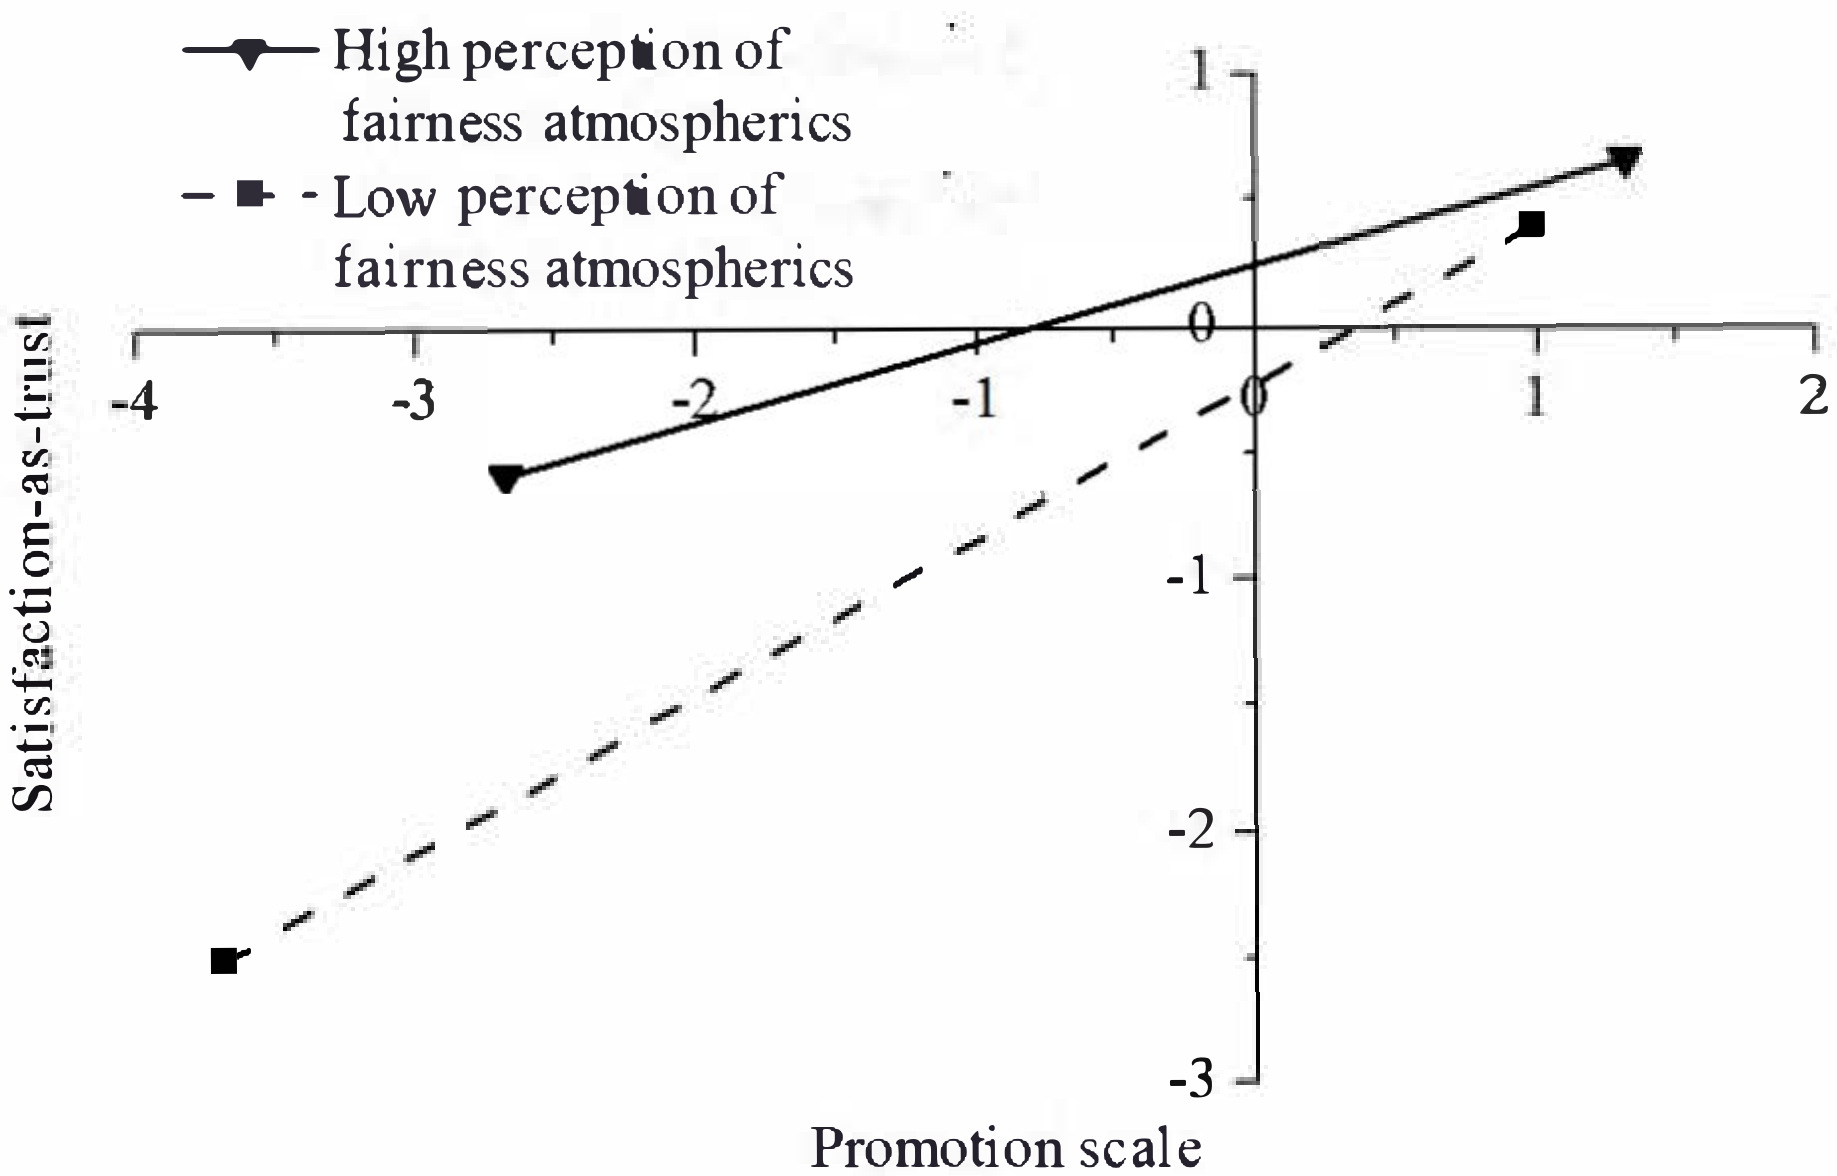
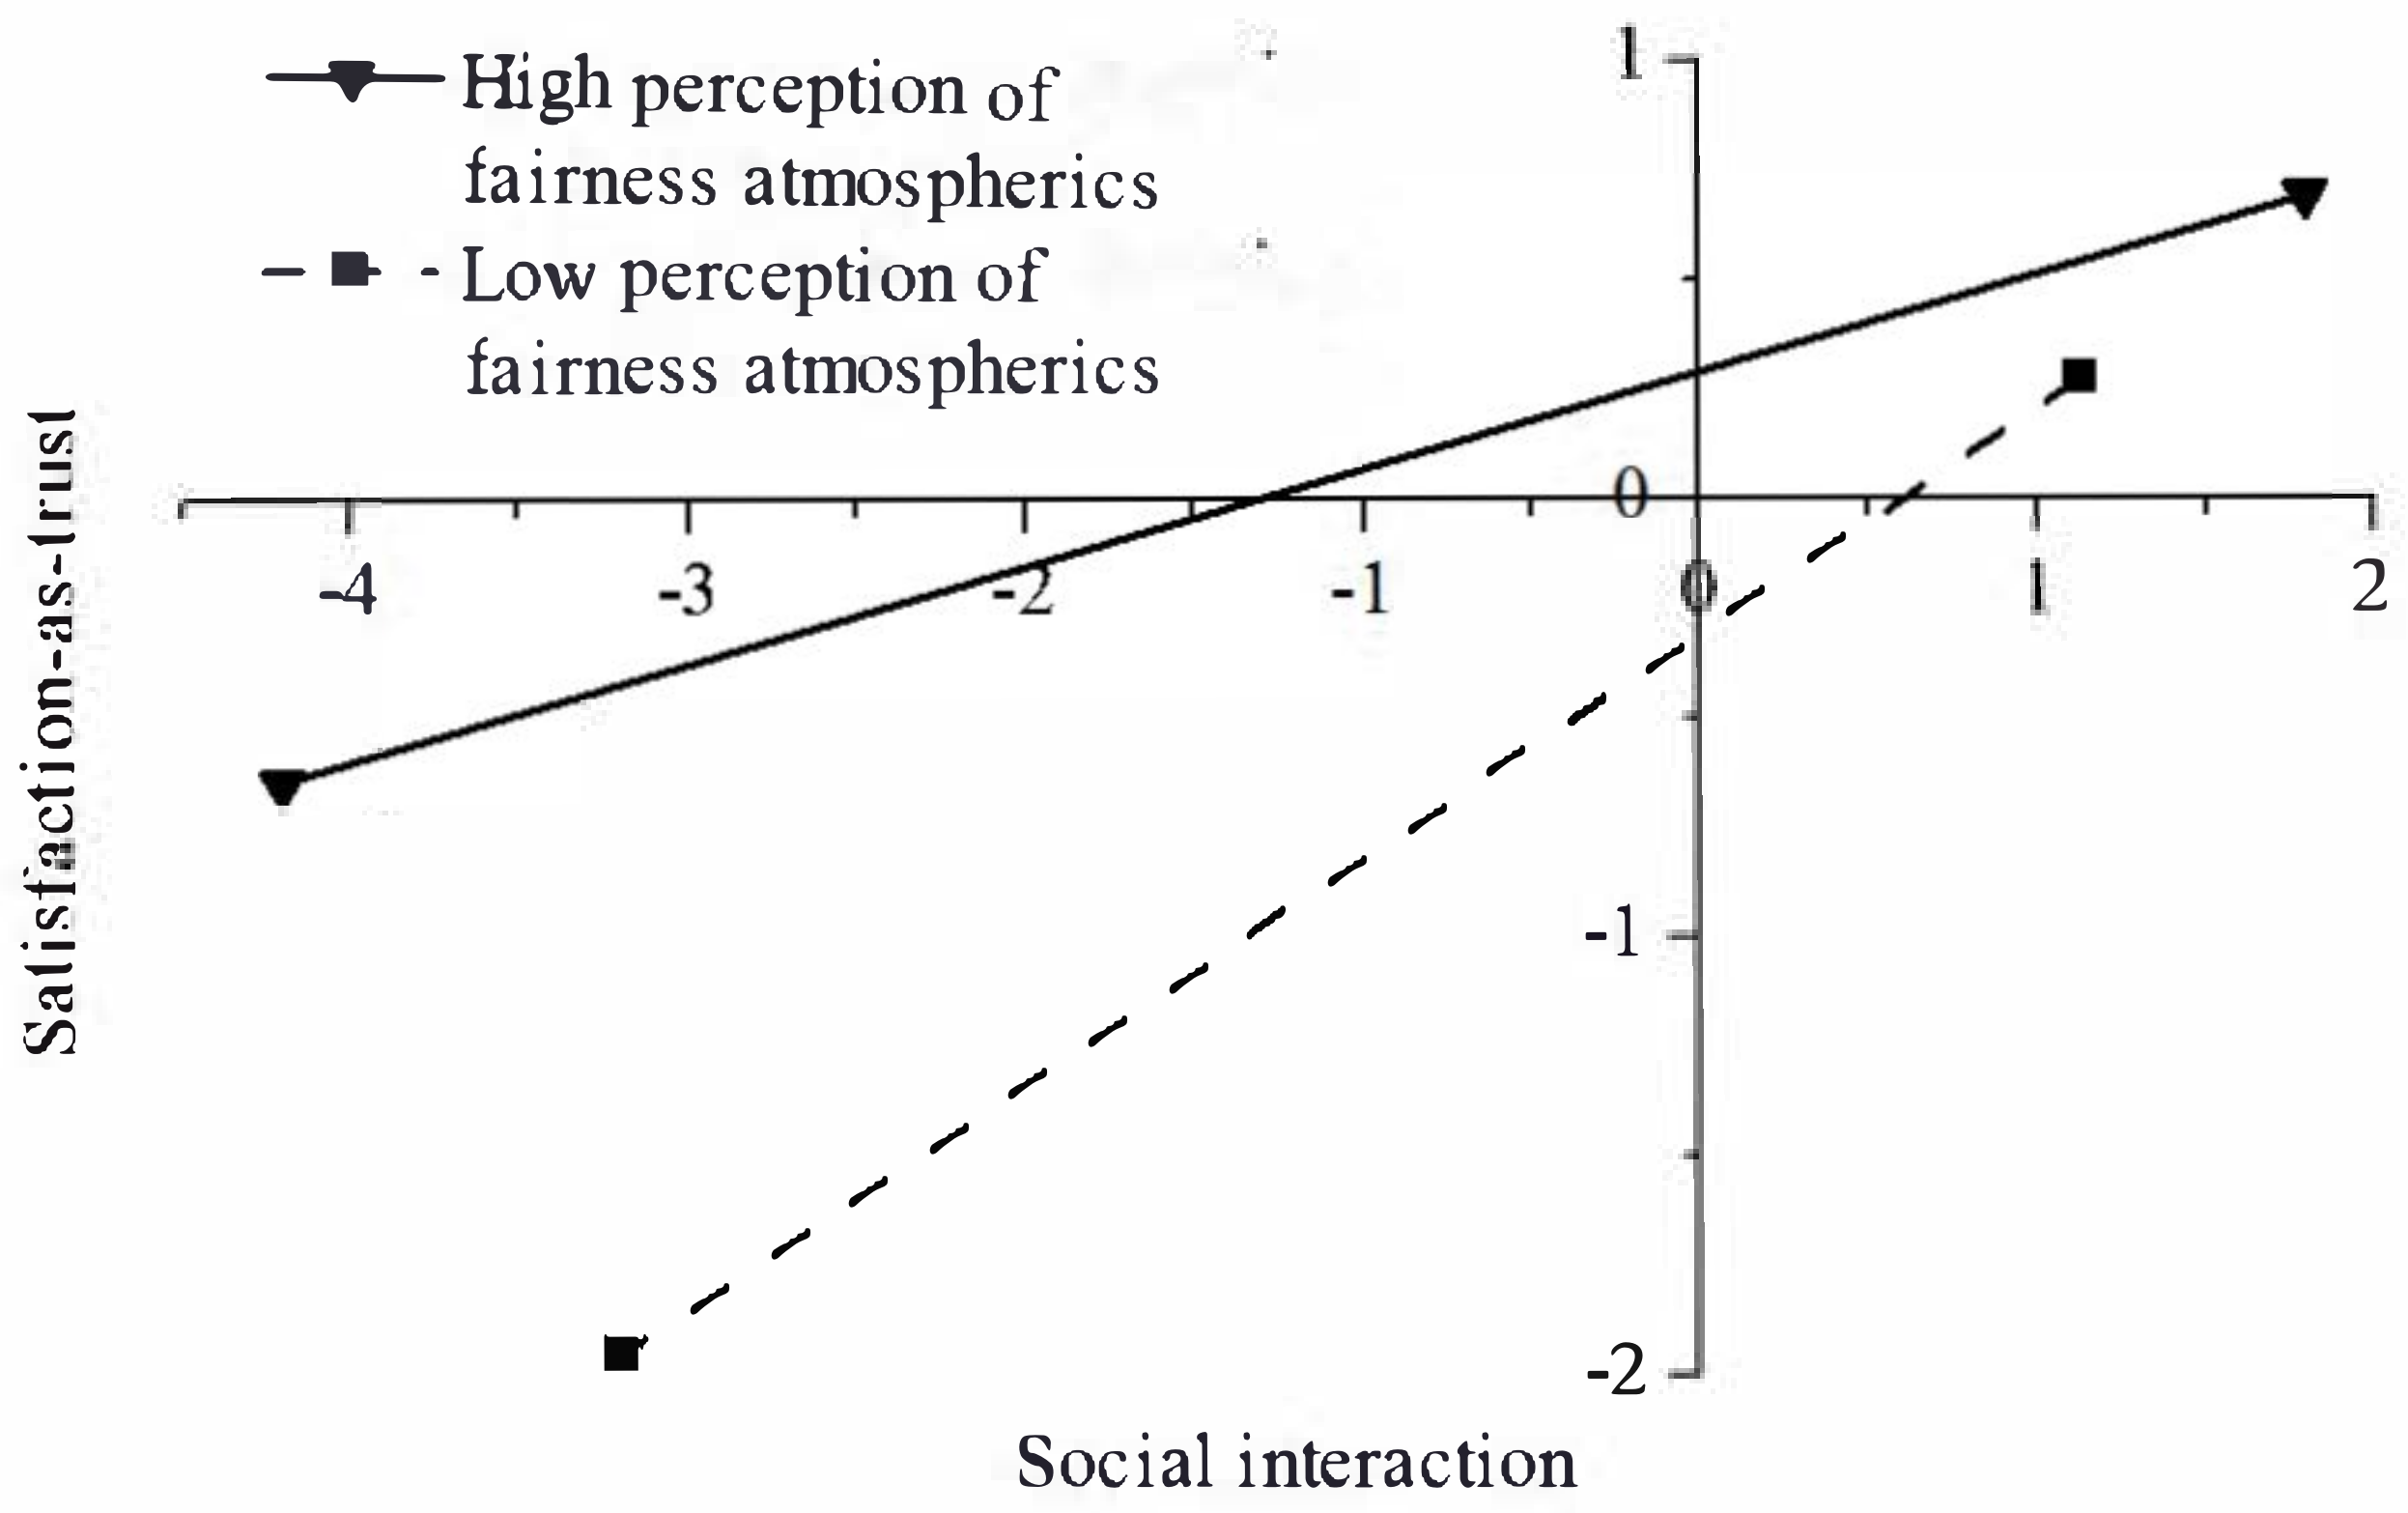
5.3.2. External Stimuli and Emotional Satisfaction-as-Trust

Table 7 shows the results of hierarchical regression analysis for the main effects of promotion scale and social interaction on participants’ emotional judgment of satisfaction-as-trust and the moderating effect of fairness atmospherics on the promotion scale/social interaction and satisfaction-as-trust. In this procedure, the Hypotheses of H1, H3, H7, and H9 were tested. The results of the first step, promotion scale, and social interaction were found to directly influence participants’ satisfaction-as-trust, supporting H1 and H3. This result is the same as that of Section 5.2, suggesting that the promotion scale and social interaction are two major factors for participants forming their satisfaction by making them believe Alibaba has the ability and competence to organize such a large scale promotion, and they have more chances and choices to buy what they want with low prices. The result of the second step showed the direct effect of fairness atmospherics on participants’ satisfaction-as-trust.
The interaction terms between promotion scale/social interaction and perceived fairness atmospherics were estimated in the third step. Both interaction terms were significant, supporting H7 and H9. However, the standardized coefficients of the interaction terms were negative. To understand the negative sign in the moderating effect, we plotted the linear regression lines in Figure 3 and Figure 4. Two groups of high and low perception of fairness atmospherics were plotted by using a solid line with triangles and a dash line with rectangles, respectively.
As shown in Figure 3 and Figure 4, for all levels of promotion scale/social interaction, participants in the high perception group had consistently higher levels of satisfaction-as-trust than those in the low perception group. This suggests that high intensity of fairness atmospherics would be useful in increasing participants’ satisfaction as trusting Alibaba’s ability and commitment. However, it was also revealed that the difference in participants’ satisfaction between the high perception group and the low perception group was diminishing as the promotion scale or social interaction increased. This indicated that the promotion scale or social interaction would be the alternative factor to increase participants’ satisfaction for the low perception group.
In summary, we found that the fairness atmospherics had a significant effect on moderating the relationship between promotion scale/social interaction and participants’ satisfaction-as-trust. In addition, it is more efficient to Increase the fairness feeling of the low perception population as well as to increase participants’ satisfaction by improving the quality of SDSFs, including bringing more opportunities and benefits to participants and providing more channels for their social interaction.

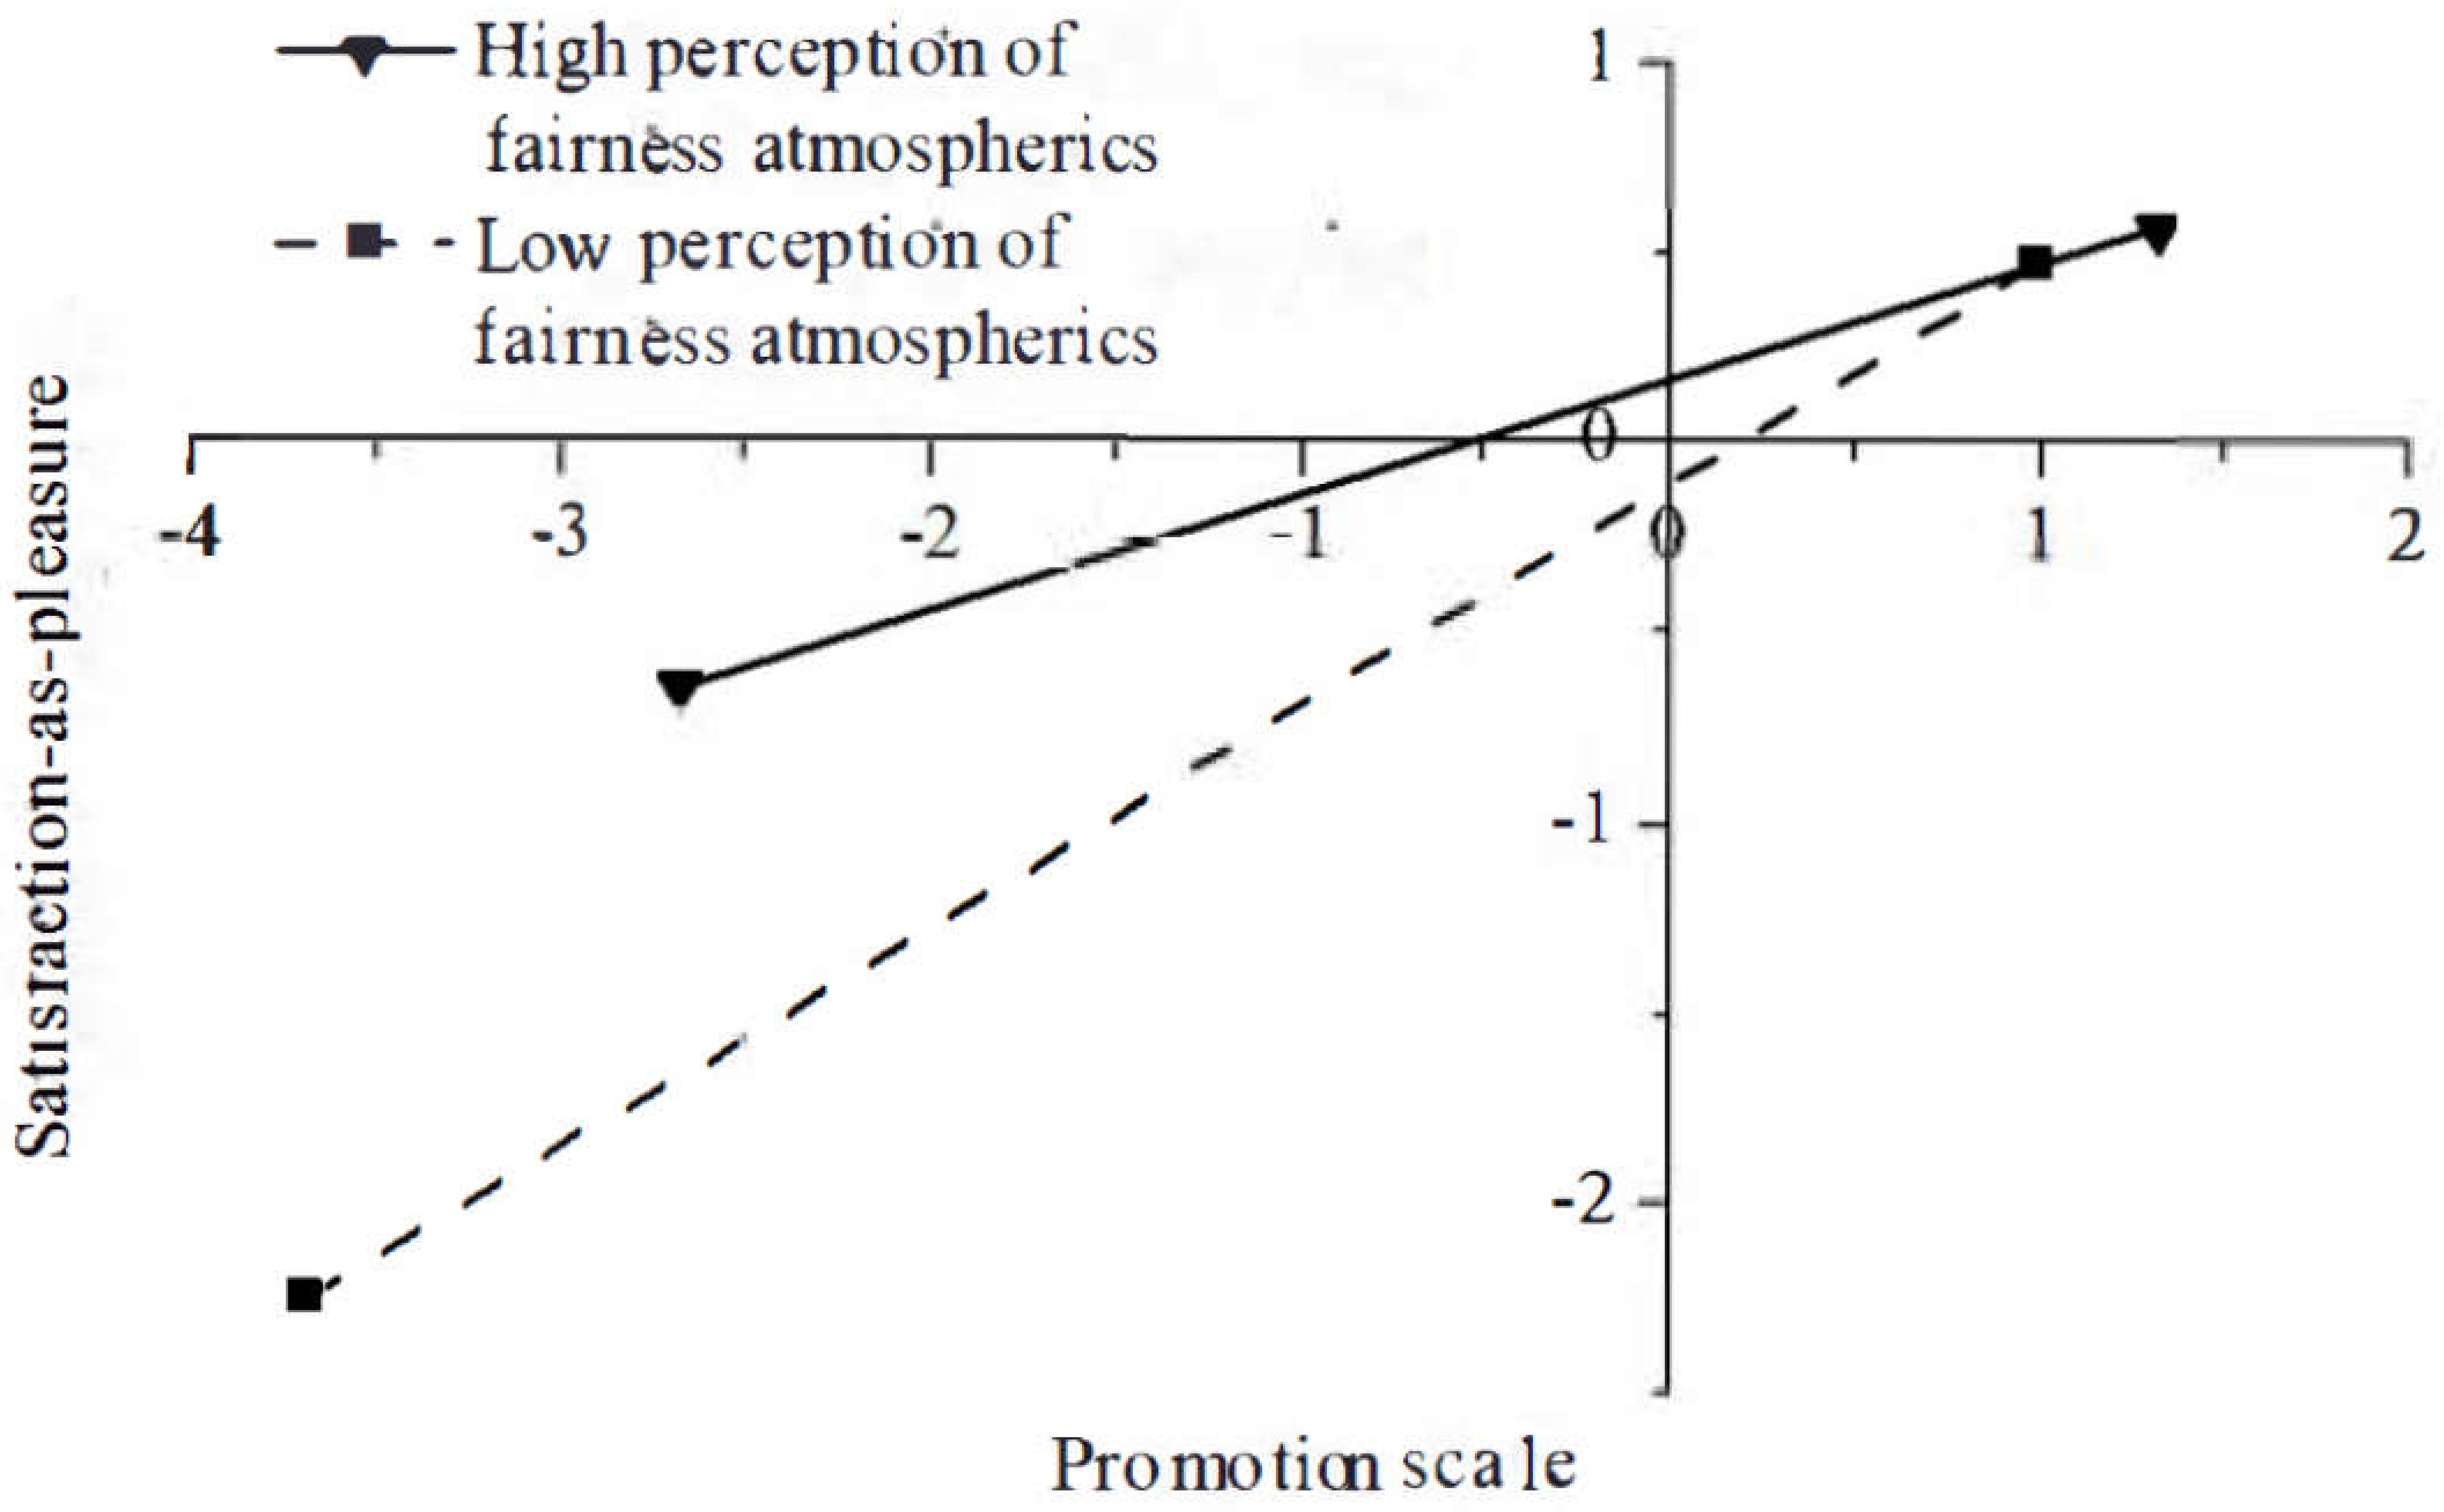
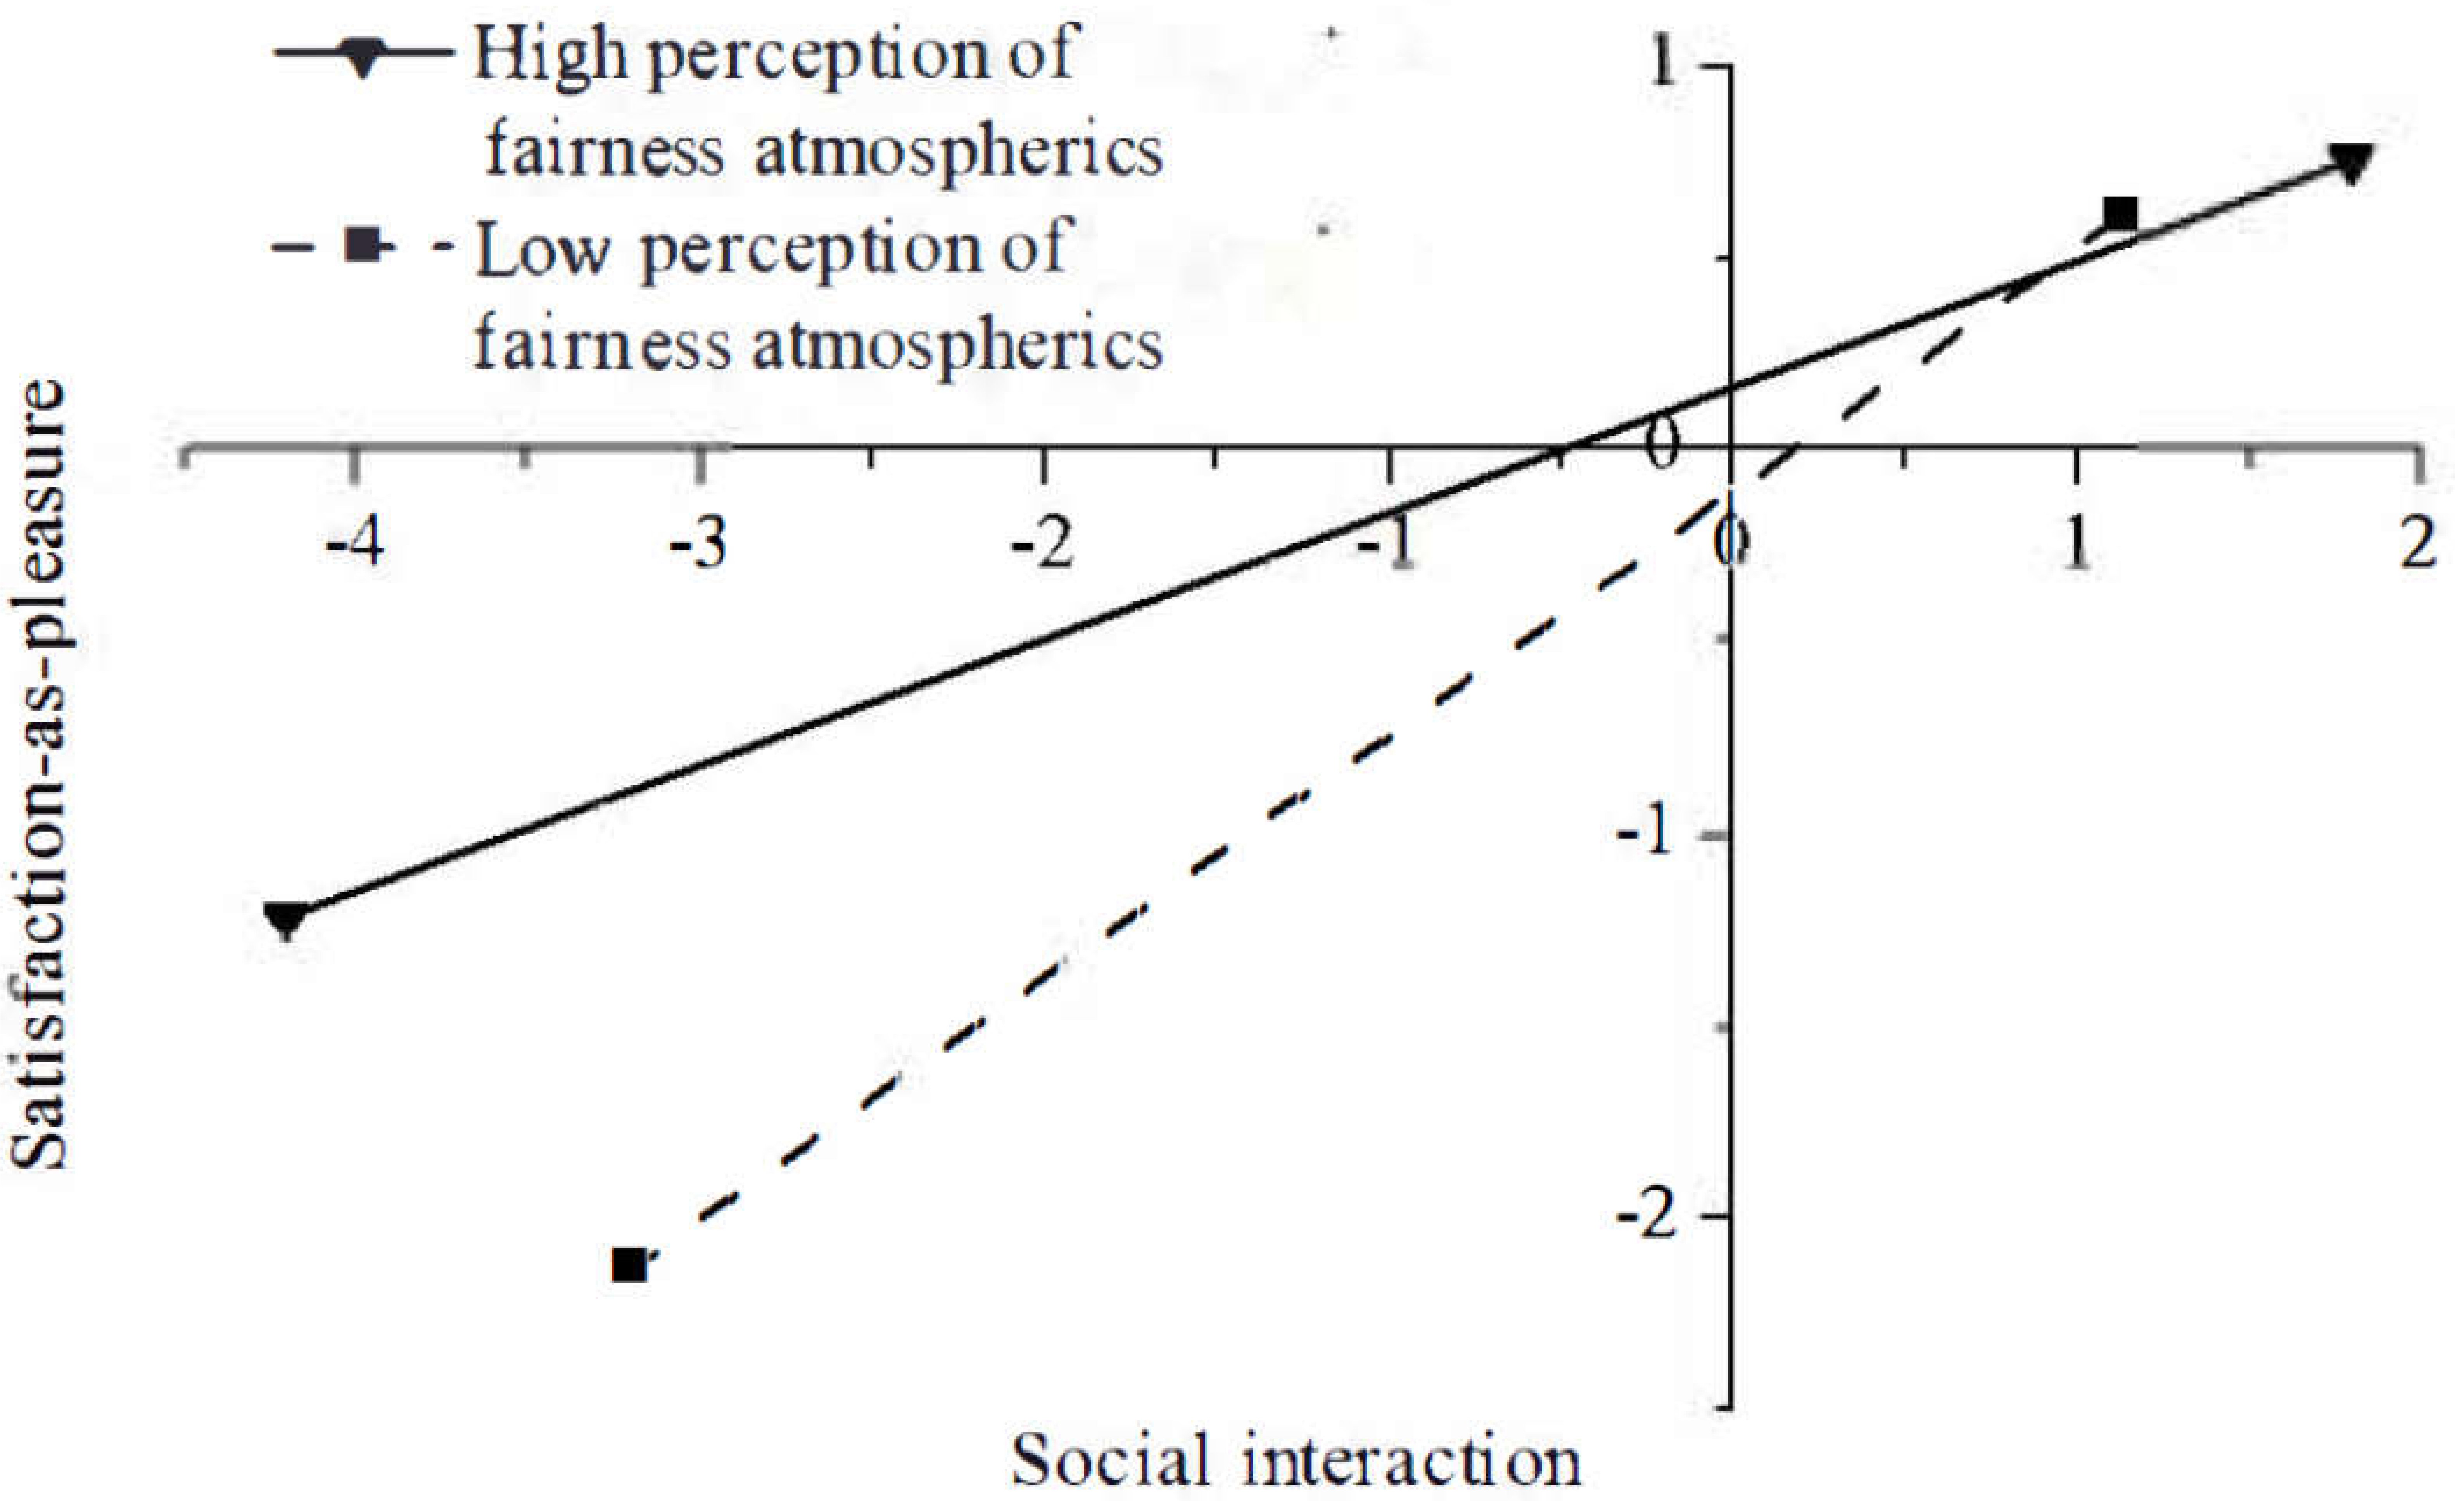
5.3.3. External Stimuli and Emotional Satisfaction-as-Pleasure

Table 8 shows the results of hierarchical regression analysis for the main effects of promotion scale and social interaction on participants’ emotional judgment of satisfaction-as-pleasure and the moderating effect of shopping festival atmosphere on the promotion scale/social interaction and satisfaction-as-pleasure. In this procedure, Hypotheses of H5, H6, H11, and H12 were tested.
Similarly, with the first two steps, H2 and H4 were supported, suggesting that the promotion scale and social interaction are two major factors for participants forming their satisfaction as they are pleased in shopping and interaction. In the third step, both interaction terms were significant, supporting H8 and H9. The standardized coefficients of the interaction terms were negative, too. We also plotted the linear regression lines in Figure 5 and Figure 6, by the solid line with triangles representing the high perception group and the dashed line with a rectangle representing the low perception group. For almost all levels of promotion scale/social interaction, participants in the high perception group had higher levels of satisfaction-as-pleasure than those in the low perception group. This suggests that high intensity of fairness atmospherics would be useful for increasing participants’ satisfaction as the pleased feeling in shopping and interaction. The difference in participants’ satisfaction between the high perception group and the low perception group was diminishing as the promotion scale or social interaction increased. This indicated that the promotion scale or social interaction would be the alternative factor to increase participants’ satisfaction for the low perception group. In summary, we found the same conclusions as Section 5.3.2.

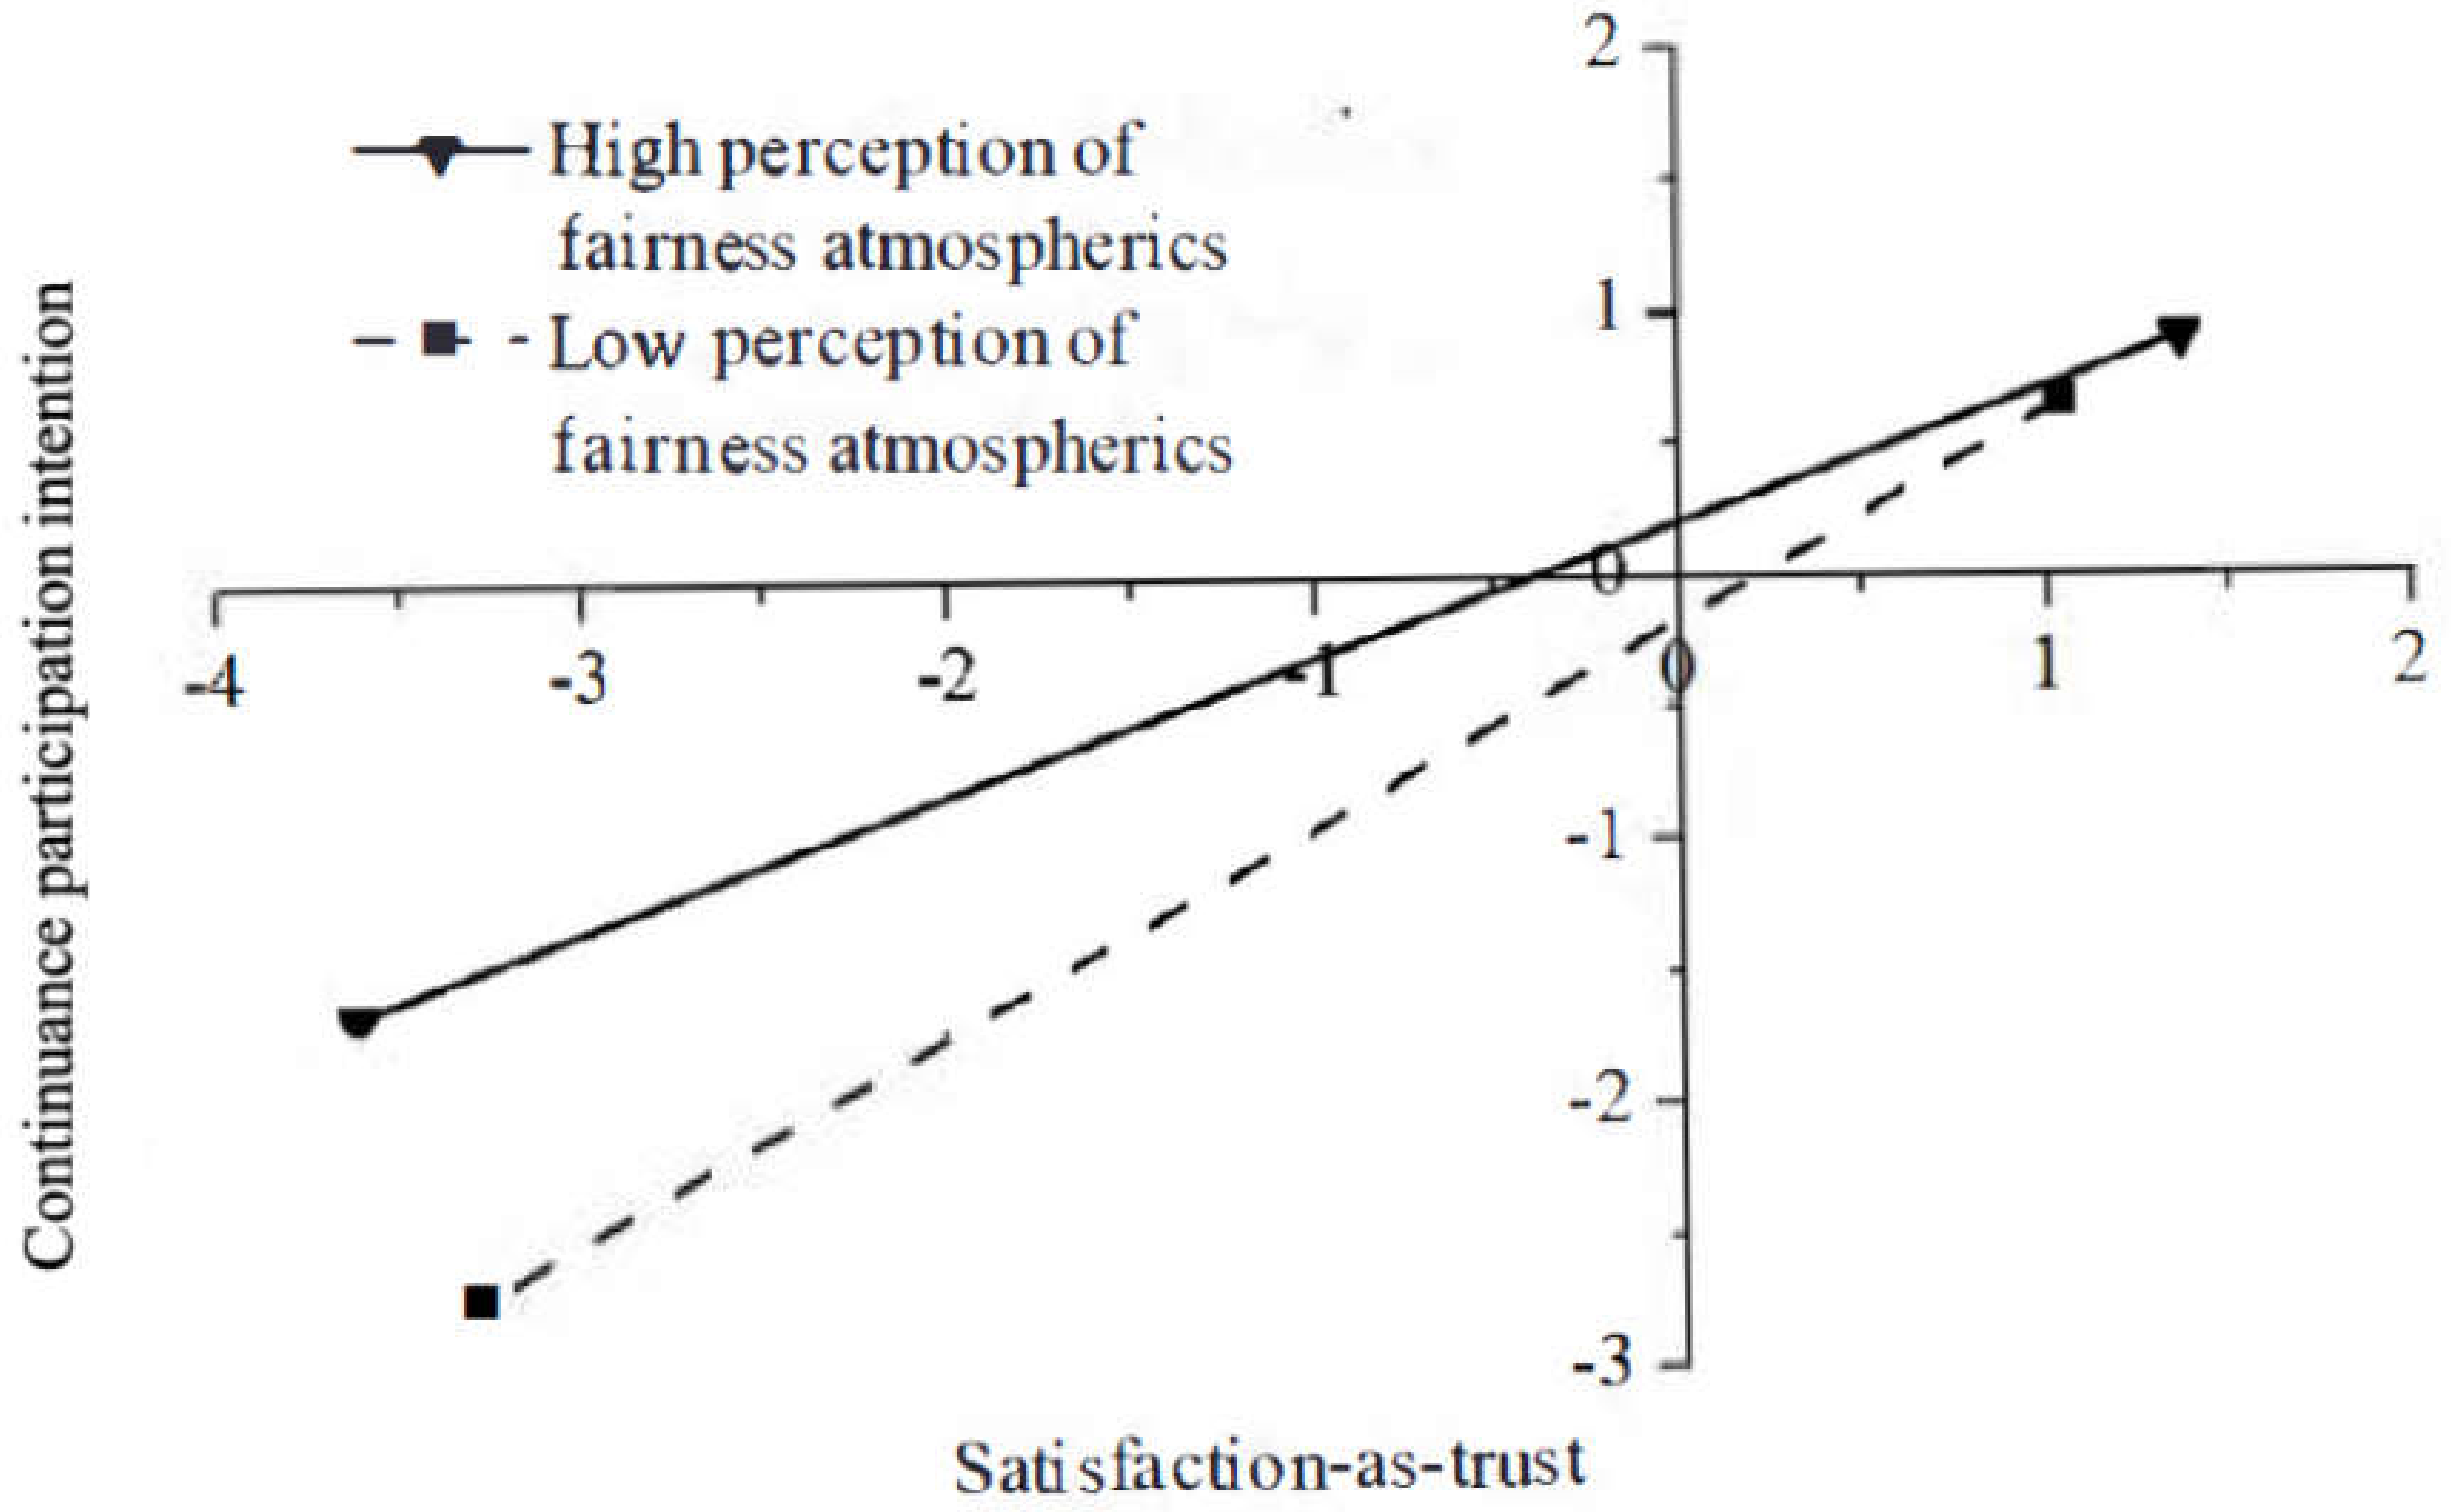
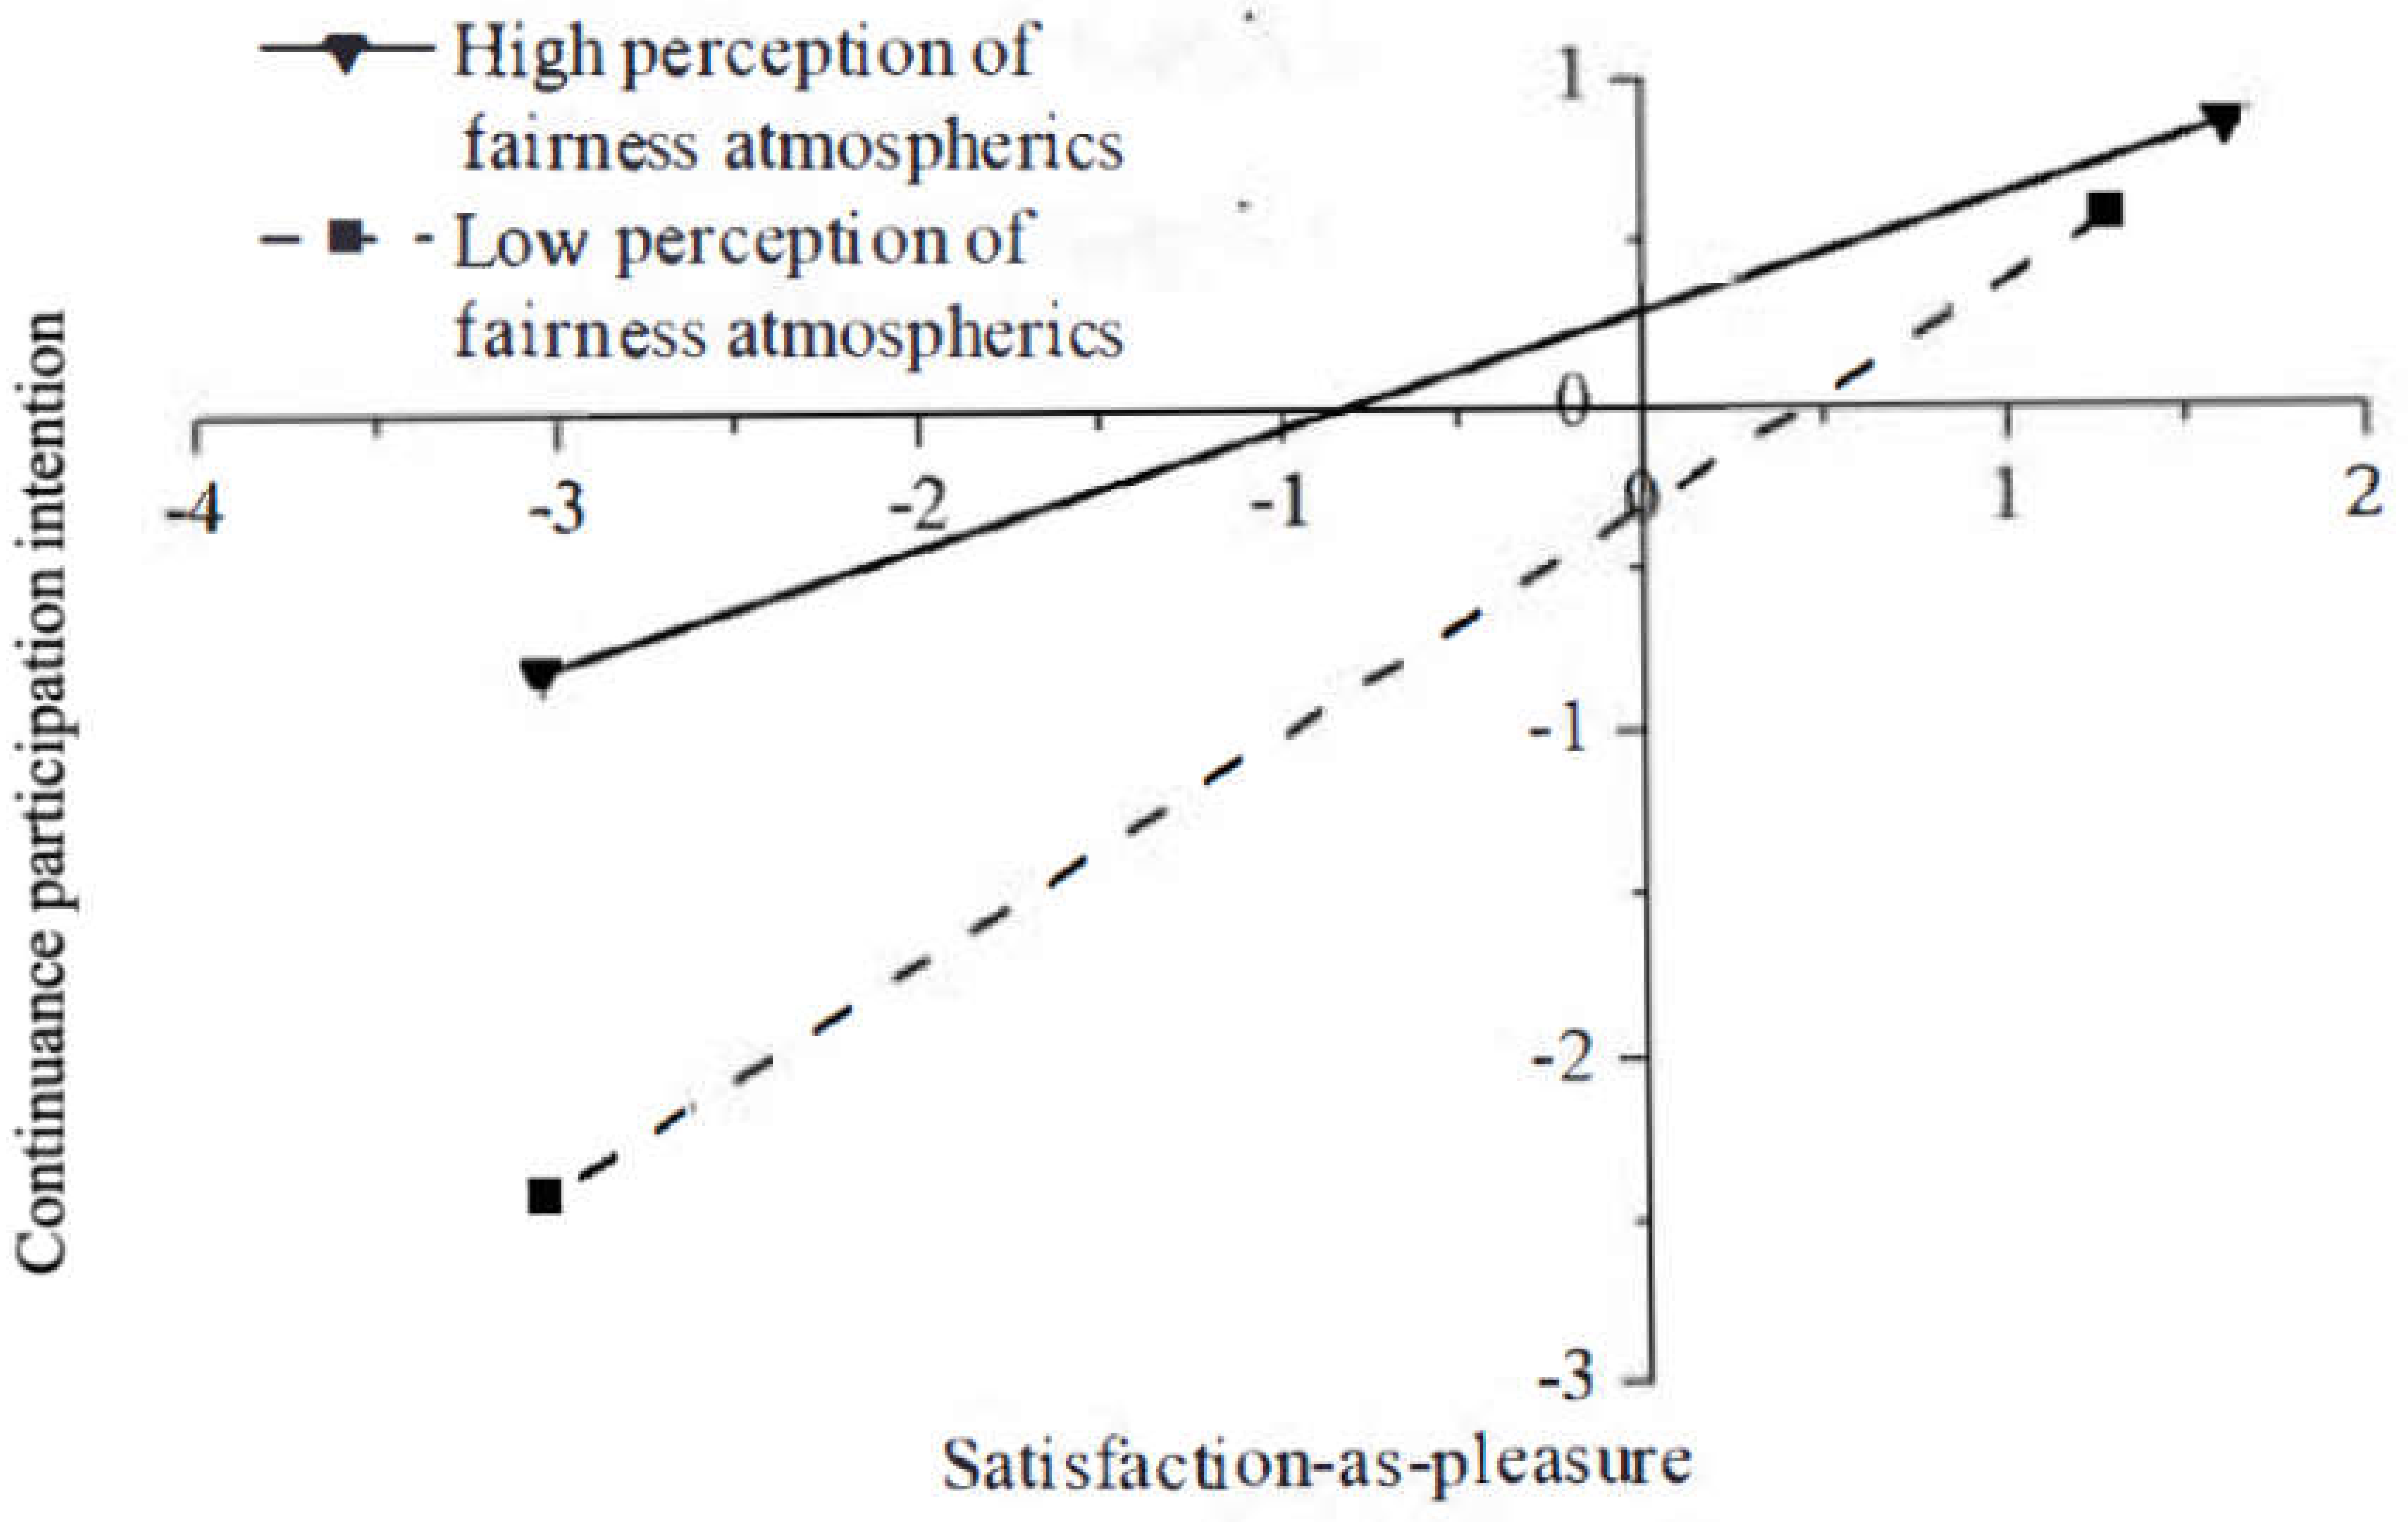
5.3.4. Emotional Satisfaction and Continuance Participation Intention

Table 9 shows the results of hierarchical regression analysis for the main effects of satisfaction-as- trust and satisfaction-as-pleasure on continuously participating intention and the moderating effect of fairness atmospherics on the satisfaction-as-trust/satisfaction-as-pleasure and continuance participation intention. In this procedure, Hypotheses of H2, H4, H8, and H10 were tested. Similarly, with the first two steps, H5 and H6 were supported, suggesting that the two kinds of satisfaction are two major factors for continuance participation intention. In the third step, both interaction terms were significant, supporting H11 and H12. The standardized coefficients of the interaction terms were negative once more. We also plotted the linear regression lines in Figure 7 and Figure 8, by the solid line with triangles representing the high perception group and the dashed line with a rectangle representing the low perception group. For all levels of satisfaction-as-trust/satisfaction-as-pleasure, participants in the high perception group had higher continuance participation intention than those in the low perception group. This suggests that high intensity of fairness atmospherics would be useful in increasing continuance participation intention. The difference in continuance participation intention between the high perception group and the low perception group was diminishing as the two kinds of satisfaction increased. This indicated that increasing participants’ satisfactions would be the alternative factor to increase continuously participating intention for the low perception group.
By summarizing the results from Section 5.3.2, Section 5.3.3 and Section 5.3.4, we had some meaningful messages for SDSFs. The fairness atmospherics indeed plays an important role in participants’ satisfaction formation and continuance intention. Increasing fairness atmospherics would exert positive effects. In addition, improving the quality of two kinds of external stimuli would be an alternative approach to increase the continuance participation intention consequently. At last, according to Table 7, Table 8 and Table 9, all VIF values are less than 10 [92], that is, it is clear that there is no multicollinearity in our model.

6. Conclusions and Discussion

There are a thousand Hamlets in a thousand people’s eyes. Similarly, there may be a thousand Singles Day Shopping Festivals in a thousand participants’ hearts. Millions of participants had been crowding into SDSFs for the past eleven years, despite the positive or negative comments fully filled in the mass media and social media after every SDSF. This study drew several conclusions as follows:
1.
This study revealed that large promotion scale and good social interaction during the SDSF are two kinds of external stimuli to trigger participants’ satisfaction-as-trust, that is, the overall satisfaction judgment on trusting the ability and competence of Alibaba to fulfill their expectation of having more chances and choices to buy what they want with lower prices than ordinary.
2.
On the other hand, this study also revealed that these two kinds of external stimuli lead to participants’ satisfaction-as-pleasure, that is, the overall satisfaction judgment on realizing their expectation of having a higher opportunity to have pleasure during the SDSF.
3.
All of these two kinds of satisfactions can be used to predict the continuance participation intention and behaviors, subsequently, explain the reason for continuous increments of both participation population and sales volume of SDSFs.
4.
In addition, this study examined the moderating effect of fairness atmospherics. The findings of this study identified that the high perception group of fairness atmospherics will have more emotional satisfactions and continuance participant intention than the low perception group. However, the negative sign of the moderating effect indicates that the satisfaction and intention difference between high and low perception group will decrease as the decrease of external stimuli. Therefore, the participation mood created by the fairness atmospherics ultimately moderates the relationships between external stimuli and participants’ internal satisfactions, and the relationships between satisfaction and their continuance intention.
These findings suggested that improving the quality of two kinds of external stimuli and fairness atmospherics would be the marketing strategy for future SDSFs. This study contributes to the theoretical literature and gives practical implications in several aspects as follows.
First, this study proposed that the SDSF, to some extent, is a big innovation product as a whole. The elaborately designed product elements of SDSFs include the huge scale of promotion, the comprehensive discounts, the wide range of brands, sellers, and items, the smooth social media channels for social interaction, etc. Participants’ expectations, disconfirmation, and satisfaction are highly related to the functionality and quality of SDSFs. We find it is difficult to identify and measure participants’ satisfaction judgment on their specific deals. Some participants may be dissatisfied with the price cheating of some sellers (raising the prices beforehand and reducing the prices during SDSFs). Other participants may think it is not worth putting lots of effort and time into calculating discount combinations. Moreover, some participants’ dissatisfaction may be others’ satisfaction. For instance, some participants may be disappointed with failing to snatch time-limited items while others may enjoy the competing process. All of these kinds of satisfactions in the individual and dealing level cannot explain and predict participants’ collective continuance behaviors. In fact, lots of Chinese participants were used to adjusting their short-term or medium-term shopping schedules before the SDSF day, leading to the concentrated release of demand on a single day.
However, if the SDSF is regarded as a whole product endorsed by Alibaba, participants’ continuance behaviors can be explained and predict more easily by their satisfaction judgment on the SDSF itself. The promotion scale, social interaction channels, and the shopping festival atmosphere all belong to the product quality, arousing participants’ cognitive or emotional disconfirmation, and subsequently triggering their satisfaction judgment.
To our knowledge, there are still no studies on shopping festival or festival shopping in the literature considering the large scale promotion as a whole product, although some extant researches regard the music festival or food festival as a product spontaneously [51,52,67]. López-Bonilla et al. gave the idea of design a public festival for tourists [98]. The authors demonstrated that cultural values and popular traditions are important features of the tourism product to attract tourists. Therefore, this study hopes that the conceptual transition of participants’ satisfaction on shopping festivals could shed a light on the future studies.
Second, the results of this study implicate that participants’ emotional satisfactions as trust and pleasure are stronger predictors of their repeat participation behaviors than satisfactions as perceived value, benefit, or other kinds of dealing level disconfirmation. This might be another explanation in addition to the herd behaviors [12] as to why individuals are still willing to participate in the SDSF again even though they might not feel satisfied with what they bought on the last SDSF.
Finally, this study revealed the moderating effect of fairness atmospherics. The direct effect of shopping atmospherics on purchase decision-making occurred several times in the literature [83,85,86]. However, the moderating role of fairness atmospherics was rarely recorded except the study of Ha and Jang [99]. Consumers participate into SDSFs because of economic or non-economic reasons. Although fairness appeal is the elemental atmospherics of the sales event, fairness perception is not the direct ancestor of satisfaction judgement. However, fairness atmospherics plays a moderating role in the formation of participants’ satisfaction and continuous behavioral outputs.
Finally, SDSF would develop sustainably because consumers continuously participate in. For the sales platform company, establishing a fairly trading environment is very important to enhance participants’ satisfaction judgment.
This study has practical implications as well. One of the most important findings of this study supported the hypothesized positive links among the quality of two kinds of external stimuli (promotion scale and social interaction), and the participants’ internally emotional satisfaction-as-trust and -pleasure suggest that the ability and competence of organizing and operating such a large scale promotion are critical to induce participants’ satisfaction. It is worth Alibaba to continuously improve the IT systems to facilitate synergy and integration of each parts of the SDSF [2]. These findings also suggest that social interaction is critical to enhance participants’ satisfaction. That is, Alibaba needs to better cooperate with social networking service companies, like Tencent, the parent company of WeChat, the largest instant communication software in China. As two competitors in many fields, Alibaba and Tencent once blocked messages from each other. The findings of this study implicate that it is not wise for Alibaba to battle with Tencent during SDSFs.
On the other hand, the findings supported the hypothesized positive links among participants’ emotional responses (satisfaction-as-trust and -pleasure) and their continuance intention suggest that the positive disconfirmation of pleasure is also critical for participants to make their shopping decisions during SDSFs. Creating and improving the fairness atmospherics will benefit both sellers and buyers and enhance SDSF’s sustainability.

Author Contributions

Conceptualization, J.L.; methodology, J.L. and A.Z.; writing, A.Z.; investigation, D.L.; analysis, W.Z.; validation, Y.Z. and Y.C.; visualization, Y.L. and N.S. All authors have read and agreed to the published version of the manuscript.

Funding

This research was funded by National Natural Science Foundation of China, grant number 71971198 and 71471164; National Social Science Foundation of PRC, grant number 16BYY023; Humanities and Social Science Project sponsored by the Ministry of Education of PRC, grant number 18YJC740151; National Key R&D Program of China, grant number 2017YFF0209000; Natural Science Foundation of Zhejiang Province, grant number LY18G010004 and LGF19G010003; and Social Science Foundation of Hangzhou Municipality, grant number Z20JC063.

Conflicts of Interest

The authors declare no conflict of interest.

References

  1. Brennan, T.; Chou, C.; Li, C. Alibaba’s Newest 11.11 GMV Record: US$38.4B. 2019. Available online: https://www.alizila.com/alibabas-newest-11-11-gmv-record-us38-4b/ (accessed on 25 March 2020).
  2. Wu, J.H.; Li, Q.; Wei, K.K. Alibaba’s IT platform and electronic commerce synergy in driving “Singles’ Day”. J. Organ. Comput. Electron. Commer. 2016, 26, 193–202. [Google Scholar] [CrossRef]
  3. Wu, J.; Zitikis, R. Should we opt for the Black Friday discounted price or wait until the boxing day? Math. Sci. 2017, 42, 1–12. [Google Scholar]
  4. Thomas, J.B.; Peters, C. An exploratory investigation of Black Friday consumption rituals. Int. J. Retail. Distrib. Manag. 2011, 39, 522–537. [Google Scholar] [CrossRef]
  5. Lennon, S.J.; Johnson, K.K.P.; Lee, J. A perfect storm for consumer misbehavior: Shopping on Black Friday. Cloth. Text. Res. J. 2011, 29, 119–134. [Google Scholar] [CrossRef]
  6. Luo, X.M. How does shopping with others influence impulsive purchasing? J. Consum. Psychol. 2005, 15, 288–294. [Google Scholar] [CrossRef]
  7. Chen, J.V.; Su, B.C.; Widjaja, A.E. Facebook C2C social commerce: A study online impulse buying. Decis. Support Syst. 2016, 83, 57–69. [Google Scholar] [CrossRef]
  8. Dospinescu, O.; Anastasiei, B.; Dospinescu, N. Key factors determining the expected benefit of customers when using bank cards: An analysis on millennials and generation Z in Romania. Symmetry 2019, 11, 1449. [Google Scholar] [CrossRef] [Green Version]
  9. Klimas, C.A.; Shaffer, B. Exploring the impact of holiday gifts: An economic and environmental comparison of DVDs and books received as gifts. Sustain. Prod. Consum. 2019, 19, 11–24. [Google Scholar] [CrossRef]
  10. Jayaratne, M.; Mort, G.S.; D’Soua, C. Sustainability entrepreneurship: From consumer concern towards entrepreneurial commitment. Sustainability 2019, 11, 7076. [Google Scholar] [CrossRef] [Green Version]
  11. Craig, T.; Polhill, G.; Colley, K.; Carrus, G.; Maricchiolo, F.; Bonaiuto, M.; Bonnes, M.; Dumitru, A.; Mira, G. Transmission of pro-environmental norms in large organization. Sustain. Prod. Consum. 2019, 19, 25–32. [Google Scholar] [CrossRef]
  12. Xu, X.Y.; Li, Q.; Peng, L.F.; Hsia, T.L.; Huang, C.J.; Wu, J.H. The impact of informational incentives and social influence on consumer behavior during Alibaba’s online shopping carnival. Comput. Hum. Behav. 2017, 76, 245–254. [Google Scholar] [CrossRef]
  13. Kastanakis, M.N.; Balabanis, G. Between the mass and the class: Antecedents of the “bandwagon” luxury consumption behavior. J. Bus. Res. 2012, 65, 1399–1407. [Google Scholar] [CrossRef]
  14. Kolter, P. Atmospherics as a marketing tool. J. Retail. 1973, 49, 48–64. [Google Scholar]
  15. Ray, R.K. Asian capital in the age of European domination: The rise of the bazaar, 1800–1914. Mod. Asian Stud. 1995, 29, 449–554. [Google Scholar] [CrossRef]
  16. McMillan, J. Reinventing the Bazaar: A Natural History of Markets; W. W. Norton & Company: New York, NY, USA, 2002. [Google Scholar]
  17. Fischer, E.; Arnold, S.J. More than a labor of love: Gender roles and Christmas gift shopping. J. Consum. Res. 1990, 17, 333–345. [Google Scholar] [CrossRef]
  18. Laroche, M.; Saad, G.; Kim, C.; Browne, E. A cross-cultural study of in-store information search strategies for a Christmas gift. J. Bus. Res. 2000, 49, 113–126. [Google Scholar] [CrossRef]
  19. Yeung, W.Y.M.; Yee, S.W.M. Chinese New Year Festival: Exploring consumer purchase intention at the flower market in Macau. Int. J. Hosp. Manag. 2010, 29, 291–296. [Google Scholar] [CrossRef]
  20. Belk, W.R.; Bryce, W. Christmas shopping scenes: From modern miracle to postmodern mall. Int. J. Res. Mark. 1993, 10, 277–296. [Google Scholar] [CrossRef]
  21. Machleit, K.A.; Eroglu, S.A.; Mantel, S.P. Perceived retail crowding and shopping satisfaction: What modifies this relationship? J. Consum. Psychol. 2000, 9, 29–42. [Google Scholar] [CrossRef]
  22. Zehrer, A.; Raich, F. The impact of perceived crowding on customer satisfaction. J. Hosp. Tour. Manag. 2016, 29, 88–98. [Google Scholar] [CrossRef]
  23. Oliver, R.L. A cognitive model of the antecedents and consequences of satisfaction decisions. J. Mark. Res. 1980, 17, 460–469. [Google Scholar] [CrossRef]
  24. Oliver, R.L. Cognitive, affective, and attribute bases of the satisfaction response. J. Consum. Res. 1993, 20, 418–430. [Google Scholar] [CrossRef]
  25. Westbrook, R.A.; Oliver, R.L. The dimensionality of consumption emotion patterns and consumer satisfaction. J. Consum. Res. 1991, 18, 84–91. [Google Scholar] [CrossRef]
  26. Fournier, S.; Mick, D.G. Rediscovering satisfaction. J. Mark. 1999, 63, 5–23. [Google Scholar] [CrossRef]
  27. White, C.; Yu, Y.T. Satisfaction emotions and consumer behavioral intentions. J. Serv. Mark. 2005, 19, 411–420. [Google Scholar] [CrossRef]
  28. Martin, D.; Martin, N.; Hubbard, S.; Palmer, A. The role of emotion in explaining consumer satisfaction and future behavioural intention. J. Serv. Mark. 2008, 22, 224–236. [Google Scholar] [CrossRef]
  29. Yu, Y.T.; Dean, A. The contribution of emotional satisfaction to consumer loyalty. Int. J. Serv. Ind. Manag. 2001, 12, 234–250. [Google Scholar] [CrossRef]
  30. Mehrabian, A.; Russell, J.A. An Approach to Environmental Psychology; MIT Press: Cambridge, MA USA, 1974. [Google Scholar]
  31. Bitner, M.J. Servicescapes: The impact of physical surroundings on customers and employees. J. Mark. 1992, 56, 57–71. [Google Scholar] [CrossRef]
  32. Bagozzi, R.P. Principles of Marketing Management; Science Research Associates Inc.: Chicago, IL, USA, 1986. [Google Scholar]
  33. Lammers, H.B.; Leibowitz, L.; Seymour, G.E.; Hennessey, J.E. Humor and cognitive responses to advertising stimuli: A trace consolidation approach. J. Bus. Res. 1983, 11, 173–185. [Google Scholar] [CrossRef]
  34. Shen, K.N.; Khalifa, M. System design effects on online impulse buying. Internet Res. 2012, 22, 396–425. [Google Scholar] [CrossRef] [Green Version]
  35. Kim, W.G.; Moon, Y.J. Customers’ cognitive, emotional, and actionable response to the servicescape: A test of the moderating effect of the restaurant type. Int. J. Hosp. Manag. 2009, 28, 144–156. [Google Scholar] [CrossRef]
  36. Yoo, J.M.; Kim, M.J. The effects of home page design on consumer responses: Moderating role of centrality of visual product aesthetics. Comput. Hum. Behav. 2014, 38, 240–247. [Google Scholar] [CrossRef]
  37. Xia, L.; Monroe, K.B. It’s not all about money: The role of identity in perceived fairness of targeted promotions. J. Prod. Brand Manag. 2017, 26, 327–339. [Google Scholar] [CrossRef]
  38. Wang, X.; Yuen, K.F.; Wong, Y.D.; Teo, C.C. It is green, but is it fair? Investigating consumers’ fairness perception of green service offerings. J. Clean. Prod. 2018, 181, 235–248. [Google Scholar] [CrossRef]
  39. Borden, N.H. The concept of the marketing mix. J. Advert. Res. 1984, 24, 7–12. [Google Scholar]
  40. Kotler, P. Marketing Management: Analysis, Planning, Implementation and Control; Prentice Hall: Englewood Cliffs, NJ, USA, 1988. [Google Scholar]
  41. Yu, Y.; Huang, J.S. Effects of price discounts and bonus packs on online impulse buying. Soc. Behav. Personal. 2014, 42, 1293–1302. [Google Scholar] [CrossRef]
  42. Grover, R.; Srinivasan, V. Evaluating the multiple effects of retail promotions on brand loyal and brand switching segments. J. Mark. Res. 1992, 29, 76–89. [Google Scholar] [CrossRef]
  43. Bucklin, R.E.; Siddarth, S.; Silva-Risso, J.M. Distribution intensity and new car choice. J. Mark. Res. 2008, 45, 473–486. [Google Scholar] [CrossRef]
  44. Florence, P.V.; Guizani, H.; Merunka, D. The impact of brand personality and sales promotions on brand equity. J. Bus. Res. 2011, 64, 24–28. [Google Scholar] [CrossRef]
  45. Dospinescu, N. The public relations events in promoting brand identity of the city. Econ. Appl. Inform. 2014, 1, 39–46. [Google Scholar]
  46. Sajtos, L.; Kreis, H.; Brodie, R. Image, brand relationships and customer value: Exploring the moderating role of advertising spending- and labour-intensity in customer loyalty. J. Serv. Theory Pract. 2015, 25, 51–74. [Google Scholar] [CrossRef]
  47. Godes, D.; Mayzlin, D.; Das, S. The firm’s management of social interactions. Mark. Lett. 2005, 16, 415–428. [Google Scholar] [CrossRef]
  48. Xu-Priour, D.L.; Truong, Y.; Klink, R.R. The effects of collectivism and polychronic time orientation on online social interaction and shopping behavior: A comparative study between China and France. Technol. Forecast. Soc. Chang. 2014, 88, 265–275. [Google Scholar] [CrossRef]
  49. Anastasiei, B.; Dospinescu, N. Electronic word-of-mouth for online retailers: Predictors of volume and valence. Sustainability 2019, 11, 814. [Google Scholar] [CrossRef] [Green Version]
  50. Anderson, E.; Fornell, C.; Lehmann, D. Customer satisfaction, market share, and profitability: Findings from Sweden. J. Mark. 1994, 58, 53–66. [Google Scholar] [CrossRef]
  51. Yoon, Y.S.; Lee, J.S.; Lee, C.K. Measuring festival quality and value affecting visitors’ satisfaction and loyalty, using a structural approach. Int. J. Hosp. Manag. 2010, 29, 335–342. [Google Scholar] [CrossRef]
  52. Tanford, S.; Jung, S.Y. Festival attributes and perceptions: A meta-analysis of relationships with satisfaction and loyalty. Tour. Manag. 2017, 61, 209–220. [Google Scholar] [CrossRef]
  53. Jones, M.A.; Suh, J. Transaction-specific satisfaction and overall satisfaction: An empirical analysis. J. Serv. Mark. 2000, 14, 147–159. [Google Scholar] [CrossRef]
  54. Xia, L.; Kukar-Kinney, M.; Monroe, K.B. Effects of consumers’ efforts on price and promotion fairness perceptions. J. Retail. 2010, 86, 1–10. [Google Scholar] [CrossRef]
  55. Swan, J.E.; Bowers, M.R.; Richardson, L.D. Customer trust in the salesperson: An integrative review and meta-analysis of the empirical literature. J. Bus. Res. 1999, 44, 93–107. [Google Scholar] [CrossRef]
  56. Sirdeshmuku, D.; Singh, J.; Sabol, B. Consumer trust, value, and loyalty in relational exchanges. J. Mark. 2002, 66, 15–37. [Google Scholar] [CrossRef]
  57. Flavián, C.; Guinalíu, M. Consumer trust, perceived security and privacy policy: Three basic elements of loyalty to a web site. Ind. Manag. Data Syst. 2006, 106, 601–620. [Google Scholar] [CrossRef]
  58. Loureiro, S.M.C.; González, F.J.M. The importance of quality, satisfaction, trust, and image in relation to rural tourist loyalty. J. Travel Tour. Mark. 2008, 25, 117–136. [Google Scholar] [CrossRef]
  59. Loureiro, S.M.C.; Miranda, F.J.; Breazeale, M. Who needs delight? The greater impact of value, trust and satisfaction in utilitarian, frequent-use retail. J. Serv. Manag. 2014, 25, 101–124. [Google Scholar] [CrossRef]
  60. Hirschman, E.C.; Holbrook, M.B. Hedonic consumption: Emerging concepts, methods and propositions. J. Mark. 1986, 48, 92–101. [Google Scholar] [CrossRef] [Green Version]
  61. Alba, J.W.; Williams, E.F. Pleasure principles: A review of research on hedonic consumption. J. Consum. Psychol. 2013, 23, 2–18. [Google Scholar] [CrossRef]
  62. Babin, B.J.; Darden, W.R.; Griffin, M. Work and/or fun: Measuring hedonic and utilitarian shopping value. J. Consum. Res. 1994, 20, 644–656. [Google Scholar] [CrossRef]
  63. Childers, T.L.; Carr, C.L.; Peck, J.; Carson, S. Hedonic and utilitarian motivations for online retail shopping behavior. J. Retail. 2001, 77, 511–535. [Google Scholar] [CrossRef]
  64. Jones, M.A.; Reynolds, K.E.; Arnold, M.J. Hedonic and utilitarian shopping value: Investigating differential effects on retail outcomes. J. Bus. Res. 2006, 59, 974–981. [Google Scholar] [CrossRef]
  65. Hellier, P.K.; Geursen, G.M.; Carr, R.A.; Rickard, J.A. Customer repurchase intention: A general structural equation model. Eur. J. Mark. 2003, 37, 1762–1800. [Google Scholar] [CrossRef] [Green Version]
  66. Hsiao, C.H.; Chang, J.J.; Tang, K.Y. Exploring the influential factors in continuance usage of mobile social Apps: Satisfaction, habit, and customer value perspectives. Telemat. Inf. 2016, 33, 342–355. [Google Scholar] [CrossRef]
  67. Choo, H.; Ahn, K.; Petrick, J.F. An integrated model of festival revisit intentions. Int. J. Contemp. Hosp. Manag. 2016, 28, 818–838. [Google Scholar] [CrossRef]
  68. Manning, K.C.; Sprott, D.E. Multiple unit price promotions and their effects on quantity purchase intentions. J. Retail. 2007, 84, 411–421. [Google Scholar] [CrossRef]
  69. Lee, K.S.; Ng, I.C.L. Advanced sale of service capacities: A theoretical analysis of the impact of price sensitivity on pricing and capacity allocations. J. Bus. Res. 2001, 54, 219–225. [Google Scholar] [CrossRef] [Green Version]
  70. Cao, Y.; Gruca, T.S.; Klemz, B.R. Internet pricing, price satisfaction and consumer satisfaction. Int. J. Electron. Commer. 2003, 8, 31–50. [Google Scholar] [CrossRef]
  71. Swilley, E.; Goldsmith, R.E. Black Friday and Cyber Monday: Understanding consumer intentions on two major shopping days. J. Retail. Consum. Serv. 2013, 20, 43–50. [Google Scholar] [CrossRef]
  72. Jarvenpaa, S.L.; Tractinsky, N.; Vitale, M. Consumer trust in an Internet store. Inf. Technol. Manag. 2000, 1, 45–71. [Google Scholar] [CrossRef]
  73. Yoo, B.; Donthu, N.; Lee, S. An examination of selected marketing mix elements and brand equity. J. Acad. Mark. Sci. 2000, 28, 195–211. [Google Scholar] [CrossRef]
  74. Renard, D. Online promotional games: Impact of flow experience on word-of-mouth and personal information sharing. Int. Bus. Res. 2013, 6, 93–100. [Google Scholar] [CrossRef]
  75. Ou, C.X.J.; Davison, R.M. Why eBay lost to TaoBao in China: The global advantage. Commun. ACM 2009, 52, 145–148. [Google Scholar] [CrossRef]
  76. Wang, S.J.; Beatty, S.E.; Foxx, W. Signaling the trustworthiness of small online retailers. J. Interact. Mark. 2004, 18, 53–69. [Google Scholar] [CrossRef]
  77. Smith, D.; Menon, S.; Sivakumar, K. Online peer and editorial recommendations, trust, and choice in virtual markets. J. Interact. Mark. 2005, 19, 15–37. [Google Scholar] [CrossRef]
  78. Kim, S.; Park, H. Effects of various characteristics of social commerce (s-commerce) on consumers’ trust and trust performance. Int. J. Inf. Manag. 2013, 33, 318–332. [Google Scholar] [CrossRef]
  79. Shin, D.H. User experience in social commerce: In friends we trust. Behav. Inf. Technol. 2013, 32, 52–67. [Google Scholar] [CrossRef]
  80. Lu, B.Z.; Fan, W.G.; Zhou, M. Social presence, trust, and social commerce purchase intention: An empirical research. Comput. Hum. Behav. 2016, 56, 225–237. [Google Scholar] [CrossRef]
  81. Arnold, M.J.; Reynolds, K.E. Hedonic shopping motivations. J. Retail. 2003, 79, 77–95. [Google Scholar] [CrossRef]
  82. Sherman, E.; Mathur, A.; Smith, R.B. Store environment and consumer purchase behavior: Mediating role of consumer emotions. Psychol. Mark. 1997, 14, 361–378. [Google Scholar] [CrossRef]
  83. Liu, Y.H.; Jang, S.C.S. The effects of dining atmospherics: An extended Mehrabian-Russell model. Int. J. Hosp. Manag. 2009, 28, 494–503. [Google Scholar] [CrossRef]
  84. Han, H.; Ryu, K. The roles of the physical environment, price perception, and customer satisfaction in determining customer loyalty in the restaurant industry. J. Hosp. Tour. Res. 2009, 33, 487–510. [Google Scholar] [CrossRef]
  85. Garaus, M. Atmospheric harmony in the retail environment: Its influence on store satisfaction and re-patronage intention. J. Consum. Behav. 2017, 16, 265–278. [Google Scholar] [CrossRef]
  86. Koo, D.M.; Ju, S.H. The interactional effects of atmospherics and perceptual curiosity on emotions and online shopping intention. Comput. Hum. Behav. 2010, 26, 377–388. [Google Scholar] [CrossRef]
  87. Wang, Y.J.; Minor, M.S.; Wei, J. Aesthetics and the online shopping environment: Understanding consumer responses. J. Retail. 2011, 87, 46–58. [Google Scholar] [CrossRef]
  88. Necula, S.C.; Păvăloaia, V.D.; Strîmbei, C.; Dospinescu, O. Enhancement of e-commerce websites with semantic web technologies. Sustainability 2018, 10, 1955. [Google Scholar] [CrossRef] [Green Version]
  89. Dospinescu, O.; Percă-Robu, A.E. The analysis of e-commerce sites with eye-tracking technologies. BRAIN Broad Res. Artif. Intell. Neurosci. 2017, 8, 85–100. [Google Scholar]
  90. Kim, C.S.; Galliers, R.D.; Shin, N.; Ryoo, J.H.; Kim, J.H. Factors influencing Internet shopping value and customer repurchase intention. Electron. Commer. Res. Appl. 2012, 11, 374–387. [Google Scholar] [CrossRef]
  91. Fang, Y.L.; Qureshi, I.; Sun, H.S.; McCole, P.; Ramsey, E.; Lim, K.H. Trust, satisfaction, and online repurchase intention: The moderating role of perceived effectiveness of e-commerce institutional mechanisms. MIS Q. 2014, 38, 407–427. [Google Scholar] [CrossRef] [Green Version]
  92. Hair, J.F.J.R.; Black, W.C.; Babin, B.J.; Anderson, R.E. Multivariate Data Analysis, 7th ed.; Pearson: New York, NY, USA, 2010. [Google Scholar]
  93. López-Bonilla, L.M.; López-Bonilla, J.M. Explaining the discrepancy in the mediating role of attitude in the TAM. Br. J. Educ. Technol. 2017, 48, 940–949. [Google Scholar] [CrossRef]
  94. Fornell, C.; Larcker, D.F. Evaluating structural equation models with unobservable variables and measurement error. J. Mark. Res. 1981, 18, 39–50. [Google Scholar] [CrossRef]
  95. Nunnally, J.C.; Bernstein, I.H. Psychometric Theory; McGraw-Hill Inc.: New York, NY, USA, 1994. [Google Scholar]
  96. Gefen, D.; Straub, D. A practical guide to factorial validity using PLS-graph: Tutorial and annotated example. Commun. Assoc. Inf. Syst. 2005, 16, 91–109. [Google Scholar] [CrossRef] [Green Version]
  97. Cohen, J.; Cohen, P.; West, S.G.; Aiken, L.S. Applied Multiple Regression/Correlation Analysis for the Behavioral Sciences, 3rd ed.; Lawrence Erlbaum Associates Publishers: Mahwah, NJ, USA, 2003. [Google Scholar]
  98. López-Bonilla, J.M.; López-Bonilla, L.M.; Sanz-Altamira, B. Designated public festivals of interest to tourists. Eur. Plan. Stud. 2010, 18, 435–447. [Google Scholar] [CrossRef]
  99. Ha, J.; Jang, S.C. Effects of service quality and food quality: The moderating role of atmospherics in an ethnic restaurant segment. Int. J. Hosp. Manag. 2010, 29, 520–529. [Google Scholar] [CrossRef]
Figure 1. The integrated expectation-confirmation theory and stimulus-organism-response (SOR-ECT) model.
Sustainability 12 02644 g001
Figure 2. Research model with results.
Sustainability 12 02644 g002
Figure 3. Moderating role of fairness atmospherics for promotion scale and satisfaction-as-trust (H7).
Sustainability 12 02644 g003
Figure 4. Moderating role of fairness atmospherics for social interaction and satisfaction-as-trust (H9).
Sustainability 12 02644 g004
Figure 5. Moderating role of fairness atmospherics for promotion scale and satisfaction-as-pleasure (H8).
Sustainability 12 02644 g005
Figure 6. Moderating role of fairness atmospherics for social interaction and satisfaction-as-pleasure (H10).
Sustainability 12 02644 g006
Figure 7. Moderating role of fairness atmospherics for satisfaction-as-trust and continuance participation intention (H11).
Sustainability 12 02644 g007
Figure 8. Moderating role of fairness atmospherics for satisfaction-as-pleasure and continuance participation intention (H12).
Sustainability 12 02644 g008
Table 1. Measures used in the study.
ConstructsItemsSources
Promotion
Scale (PS)
PS1More deeper discounts are offered in SDSF, as compared
to other kinds of promotions.
Adapted/modified from
Yoo et al. [73];
PS2The number of brands and items that offer discounts in
SDSF is more than that of other kinds of promotions.
Florence et al. [44].
PS3Discounts are offered in as varieties of manners as possible
in SDSF.
Social
Interaction (SI)
SI1Sharing discounts information with others in SDSF is a
bonding experience.
Adapted/modified from
Arnold and Reynolds [81];
SI2I enjoy socializing with others when I find a good deal in
SDSF.
Xu-Priour et al. [48].
SI3I communicate with my friends or family on experience in
SDSF to socialize.
Satisfaction-as-
Trust (ST)
ST1I am satisfied that there are indeed my favorite items with
discount prices as SDSF has promised.
Adapted/modified from
Flavián and Guinalíu [57];
ST2I am satisfied that I surely save money as SDSF has
committed.
Loureiro and González [58];
Loureiro et al. [59].
ST3I am satisfied that there are so many good deals
and opportunities as SDSF has declared.
Satisfaction-as-
Pleasure (SP)
SP1I am satisfied with the pleasant experience of gamification
activities in SDFS.
Adapted/modified from
Babin et al. [62];
SP2I am satisfied with the interesting experience of shopping
with entertainment.
Childers et al. [63];
Jones et al. [64];
SP3I am satisfied with the excitement experience of shopping
time-limited items.
Kim et al. [90].
Fairness
Atmospherics
(FA)
FA1I know that the prices are fair.Adapted/modified from
FA2I know the purchasing procedures are fair.Xia and Monroe [37];
FA3I know the deals are fair.Wang et al. [38].
Continuance
Participation
CPI1I will continuously participate in the next SDSFs for the
good deals.
Adapted/modified from
Kim et al. [90];
Intention (CPI)CPI2I will prepare well in advance before the next SDSFs in
the future.
Choo et al. [67];
Fang et al. [91].
CPI3I prefer to participating in the next SDSFs than others.
Table 2. Demographics of the respondents (n = 332).
DemographicsFrequencyPercentage
GenderFemale15546.69%
Male17753.31%
AgeLess than 2020.60%
Between 21 and less than 3013540.66%
Between 31 and less than 4013139.46%
Between 41 and less than 505015.06%
Greater than 50144.22%
EducationHigh school144.22%
University29588.86%
Graduate school236.93%
Monthly incomeLess than CNY 200092.71%
Between CNY 2001 and less than CNY 50007422.29%
Between CNY 5001 and less than CNY 80009227.71%
Greater than CNY 800115747.29%
Participating countsNever164.82%
Recently several times15045.18%
Almost every time11233.73%
Every time5416.27%
Total332100%
Table 3. Overview of the measurement model.
ConstructsItemsFactor LoadingAVECRCronbach’s Alpha
Promotion Scale (PS)PS10.7160.5210.7650.764
PS20.7330.764
PS30.716
Social Interaction (SI)SI10.8300.6220.8310.830
SI20.826
SI30.704
Satisfaction-as-Trust (ST)ST10.7710.5570.7900.789
ST20.729
ST30.738
Satisfaction-as-Pleasure (SP)SP10.7320.5330.7740.774
SP20.732
SP30.725
Fairness Atmospherics (FA)FA10.7570.5540.7880.788
FA20.774
FA30.700
Continuance Participation Intention (CPI)CPI10.7500.6070.8220.819
CPI20.769
CPI30.817
Table 4. Collections between constructs and square roots of the average variance extracted (AVE).
PSSISTSPFACPI
PS0.723
SI0.5000.789
ST0.6210.5570.746
SP0.5090.5930.6070.730
FA0.6690.4680.6780.5490.744
CPI0.6570.6240.7340.6240.6560.779
Table 5. Loadings and cross-loadings.
SISPSTPSCPIFA
SI10.7680.2520.0940.1140.2570.215
SI20.7180.2210.1630.1760.3530.068
SI30.8330.1740.2000.152−0.0210.078
SP10.2140.7260.1600.2040.2040.089
SP20.2260.8330.0990.0990.1070.174
SP30.2040.5590.3830.1060.1740.270
ST10.1860.1710.6620.1320.4350.169
ST20.1910.3540.7350.2100.0870.133
ST30.2080.0400.5340.2320.3500.401
PS10.2070.1700.0410.6120.3190.293
PS20.1150.1770.1140.7710.2770.137
PS30.1800.1100.3910.7240.0190.216
CPI10.1620.1470.1810.2910.7420.295
CPI20.3330.3540.3870.1520.4830.111
CPI30.2370.2970.2910.2670.6500.152
FA10.1580.1510.2790.2720.3170.610
FA20.0910.0470.4400.3940.1870.539
FA30.1260.2860.0940.1790.1070.830
Table 6. Descriptive information for constructs.
Constructs (Cronbach’s Alpha)All RespondentsHigh FA GroupLow FA Group
MeanSDMeanSDMeanSD
Fairness Atmospherics (0.788)5.660.6996.190.1594.800.367
Promotion Scale (0.764)5.680.6896.040.3795.090.634
Social Interaction (0.830)5.201.1205.540.9974.660.851
Satisfaction-as-Trust (0.789)5.620.7165.980.4425.040.606
Satisfaction-as-Pleasure (0.774)5.380.7905.660.6504.930.695
Continuance Participation Intention (0.819)5.680.7606.060.4075.060.708
Table 7. The results of a hierarchical regression analysis for hypotheses H1, H3, H7, and H9.
Independent
Variable
Variable in
Each Step
Standardized
Coefficients
R 2 R 2 ChangeFp-ValueVIF
Promotion ScaleStep 1 0.385 184.9060.000 ***
PS0.632 1.000
Step 2 0.4430.058116.8200.000 ***
PS0.468 1.451
FA0.502 1.451
Step 3 0.4590.01682.7170.004 **
PS0.620 2.847
FA0.470 1.471
PS × FA−0.308 2.228
Social InteractionStep 1 0.311 132.9910.000 ***
SI0.446 1.000
Step 2 0.4330.122112.3630.000 ***
SI0.322 1.194
FA0.604 1.194
Step 3 0.4580.02582.4990.000 ***
SI0.511 3.447
FA0.596 1.257
SI × FA−0.288 3.013
Note: PS: Promotion Scale; SI: Social Interaction; FA: Fairness Atmospherics. * * p < 0.01 . * * * p < 0.001 .
Table 8. The results of a hierarchical regression analysis for hypotheses H2, H4, H8, and H10.
Independent
Variable
Variable in
Each Step
Standardized
Coefficients
R 2 R 2 ChangeFp-ValueVIF
Promotion ScaleStep 1 0.259 102.8950.000 ***
PS0.544 1.000
Step 2 0.2770.01856.4370.006 **
PS0.446 1.451
FA0.301 1.451
Step 3 0.2890.01239.7620.027 *
PS0.584 2.847
FA0.273 1.471
PS × FA−0.281 2.228
Social InteractionStep 1 0.352 160.1290.000 ***
SI0.498 1.000
Step 2 0.3820.03090.7440.000 ***
SI0.434 1.194
FA0.344 1.194
Step 3 0.4060.02466.8090.001 **
SI0.631 3.447
FA0.273 1.257
SI × FA−0.302 3.013
Note: PS: Promotion Scale; SI: Social Interaction; FA: Fairness Atmospherics. * p < 0.05 . * * p < 0.01 . * * * p < 0.001 .
Table 9. The results of a hierarchical regression analysis for hypotheses H5, H6, H11, and H12.
Independent
Variable
Variable in
Each Step
Standardized
Coefficients
R 2 R 2 ChangeFp-ValueVIF
Satisfaction-as-trustStep 1 0.539 345.5120.000 ***
ST0.757 1.000
Step 2 0.5760.037200.0390.000 ***
ST0.628 1.423
FA0.411 1.423
Step 3 0.5890.013139.7130.004 **
ST0.775 3.092
FA0.370 1.464
ST × FA−0.272 2.424
Satisfaction-as-pleasureStep 1 0.412 207.0770.000 ***
SP0.630 1.000
Step 2 0.5240.112161.7740.000 ***
SP0.448 1.188
FA0.651 1.188
Step 3 0.5470.023117.9620.000 ***
SP0.688 2.978
FA0.599 1.224
SP × FA−0.332 2.623
Note: ST: Satisfaction-as-Trust; SP: Satisfaction-as-Pleasure; FA: Fairness Atmospherics. * * p < 0.01 . * * * p < 0.001 .

