A Strategies Alignment Approach to Manage Disruptive Events in Collaborative Networks


Abstract
1. Introduction
2. Materials and Methods
2.1. State of the Art: Sustainable–Resilient CN (S–RCN)
2.2. Problem Description
- Enterprise 1: defines objective1, which is associated with the KPI1, and formulates strategy1
- Enterprise 2: defines objective2, which is associated with the KPI2, and formulates strategy2.
2.3. Strategies Alignment Model to Deal with Disruptions in a S–RCN
2.3.1. Variables Definition
- The networked enterprises define a set of objectives (measured through KPIs) to minimize the disruption’s impacts. A maximum level of each KPI is determined in order to identify the extent to which the objectives are achieved.
- A set of sustainable resilience strategies are formulated by the enterprises in order to achieve the defined objectives. The strategies are raised to eliminate or reduce the negative effects, once the disruption has occurred.
- The use of KPIs allows computing the reduction of loss in the network performance.
- Considering a delay parameter (d1_stris), to model the fact that when a stris is activated, the kpiixk does not notice its influence until d1_stris passes
- Defining the decision variable ti_stris, which allows identifying the time instant in which stris is to be activated.
2.3.2. Objective Function and Restrictions
- u_stris = 0, stris must not be activated
- u_sis1, stris must be activated, and is characterized by being aligned; additionally, the variable u_stris identifies the degree of deployment of each strategy. For instance, we can define a strategy “stris: Invest 10 m.u. in research activities”; the completion of the whole strategy will be given by u_stris = 1 in which 10 m.u are invested. However, there may be a situation in which u_stris = 0.5, in this scenario, stris is implemented 50%, investing 5 m.u. On the other hand, u_stris = 5 indicates that 50 m.u. are to be invested. Accordingly, the total monetary units invested in one strategy are computed by Equation (9).
2.3.3. Systems Dynamic Method
- Stock variables: bi, ;
- Flow variables: F_inf_stris_kpiixk, kpi’ixk;
- Parameters: wk, stris, u_stris, c_stris, val_stris_kpiixk, ti_stris, d’1_stris, d’2_stris, d’4_stris, Threshold_kpiixk;
- Dynamic variables: kpi’i, kpi’n, stris_mu, d’3_sis,tf_stris, slope_stris_kpiixk, inf_stris_kpiixk.
3. Results: Validation of the Strategies Alignment Model
3.1. Case Study
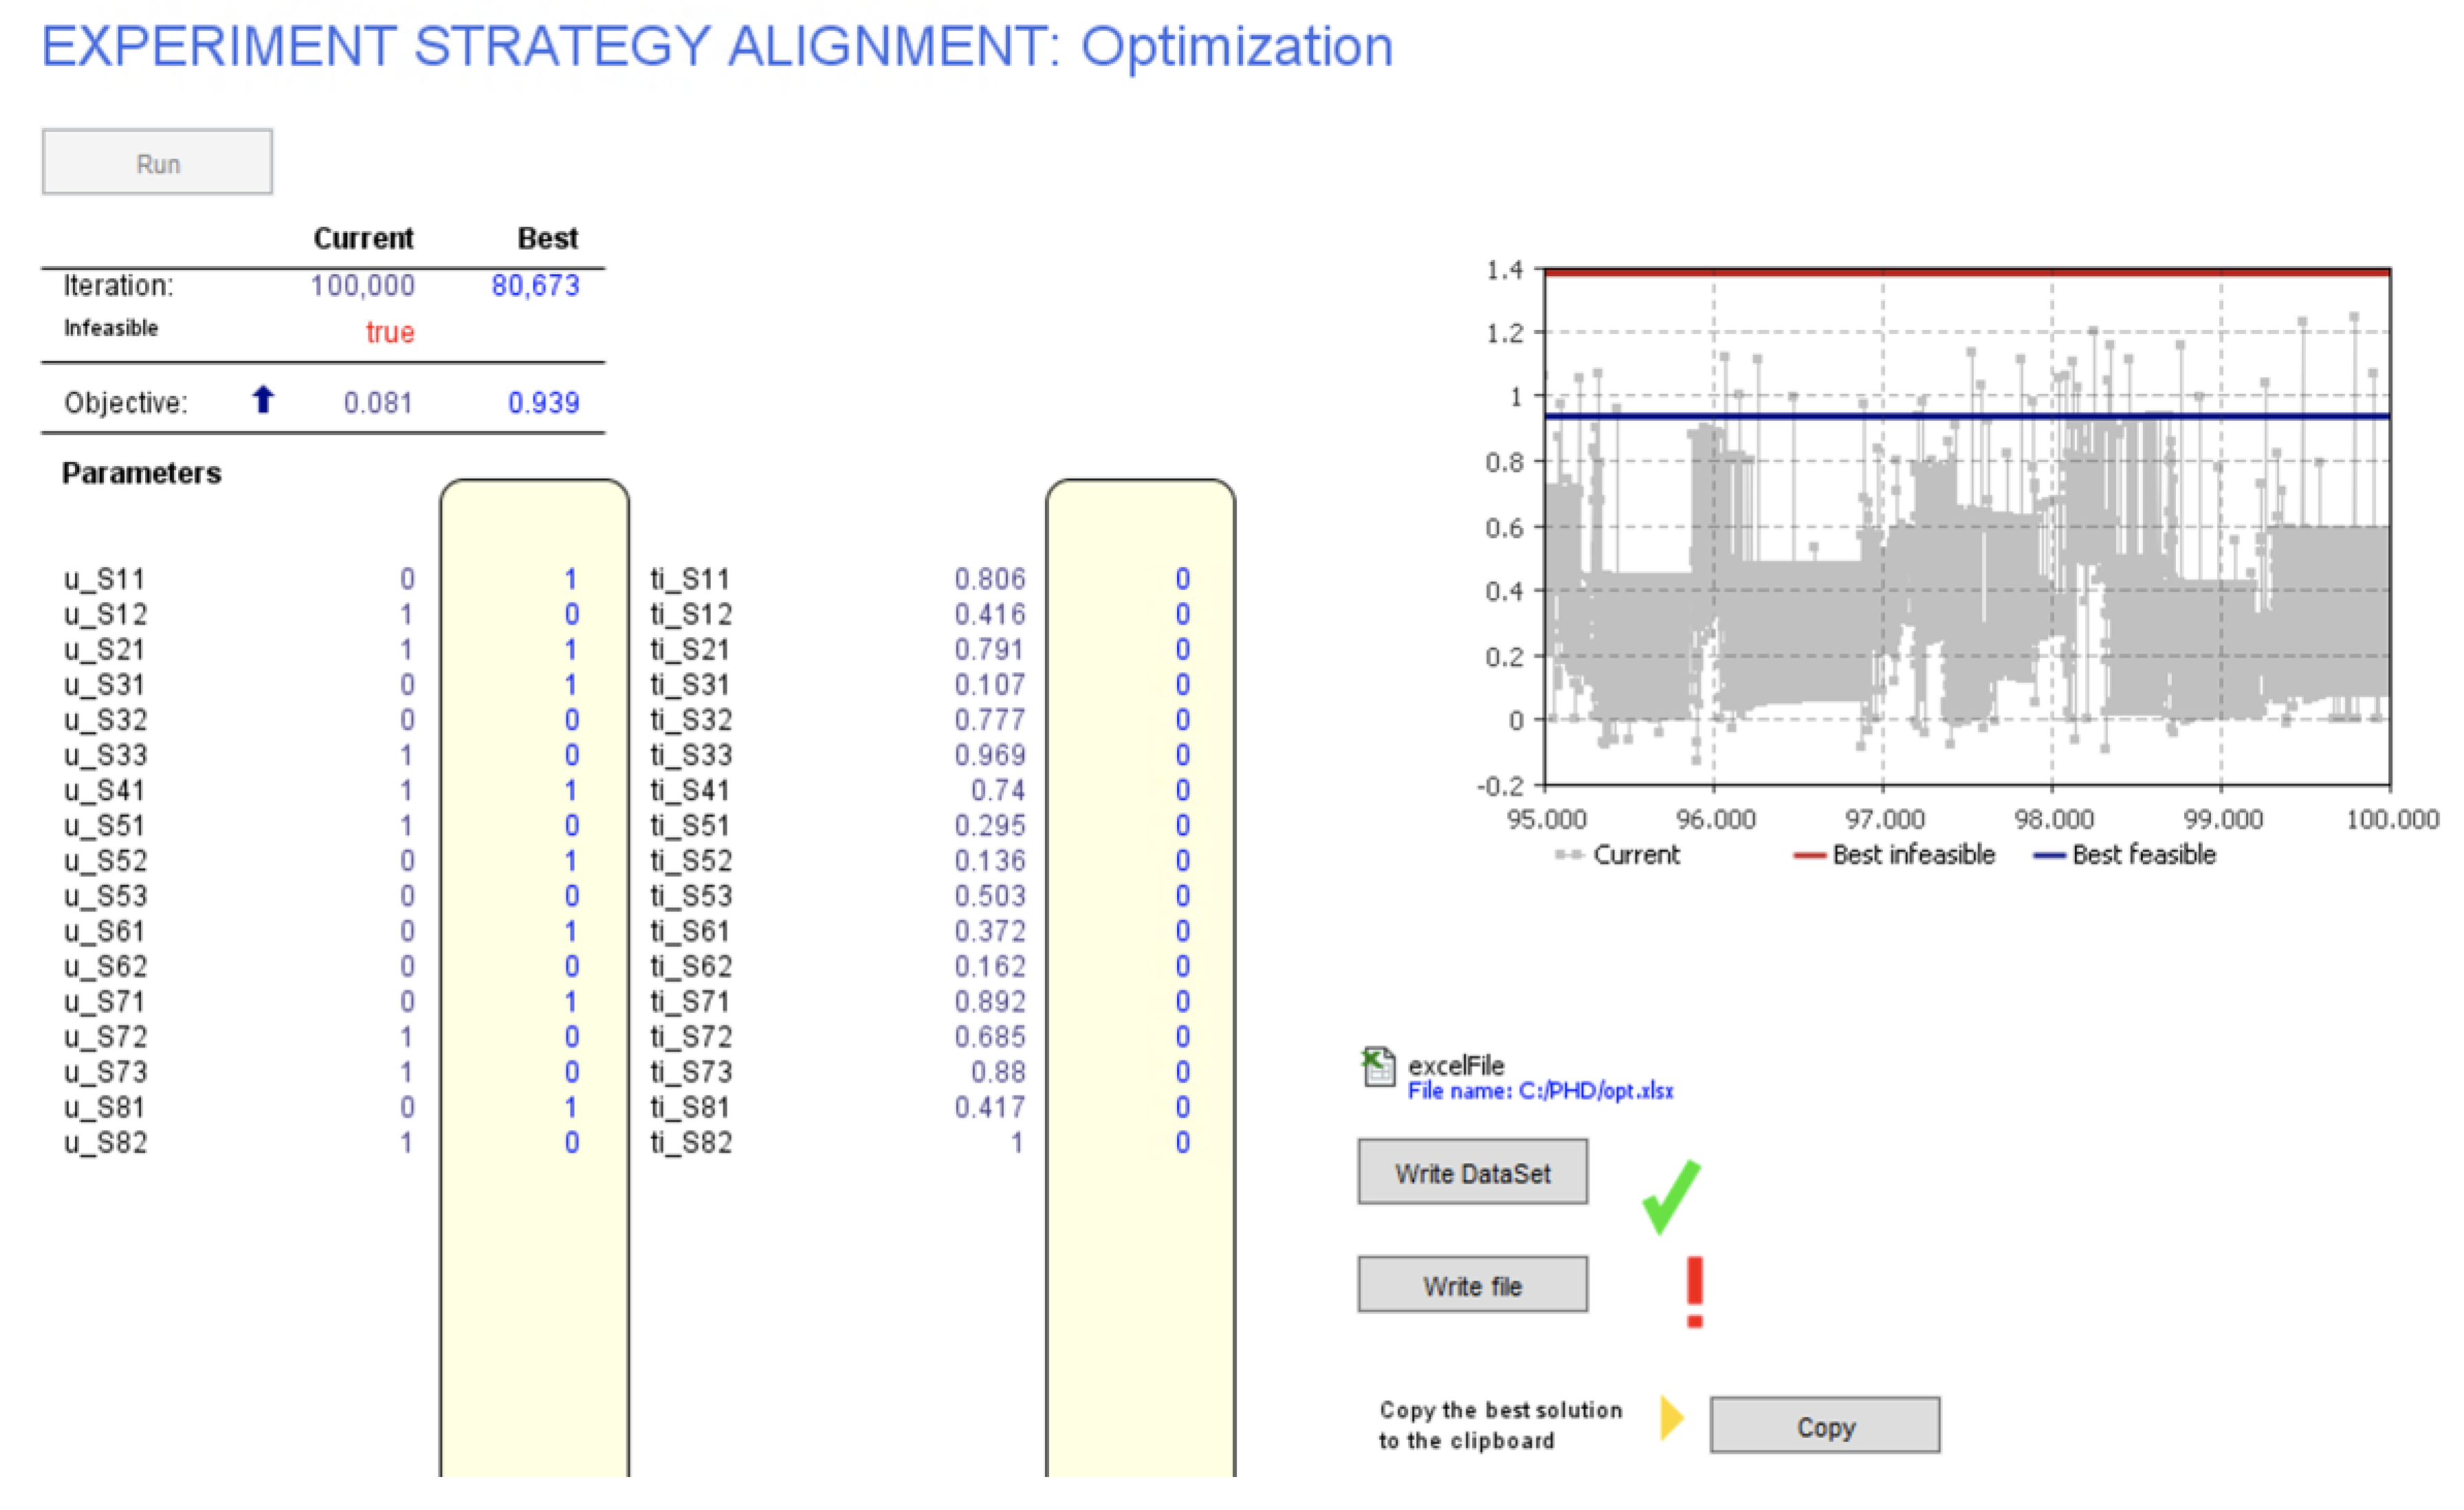
3.2. Implementation and Resolution
- The influence of the strategies activated in the same enterprise in which the kpiixk is defined (ei), F_inf_stris_kpiixk, and
- The influence of the strategies activated by the rest of enterprises of the network (ej), F_inf_strjs_kpiixk.
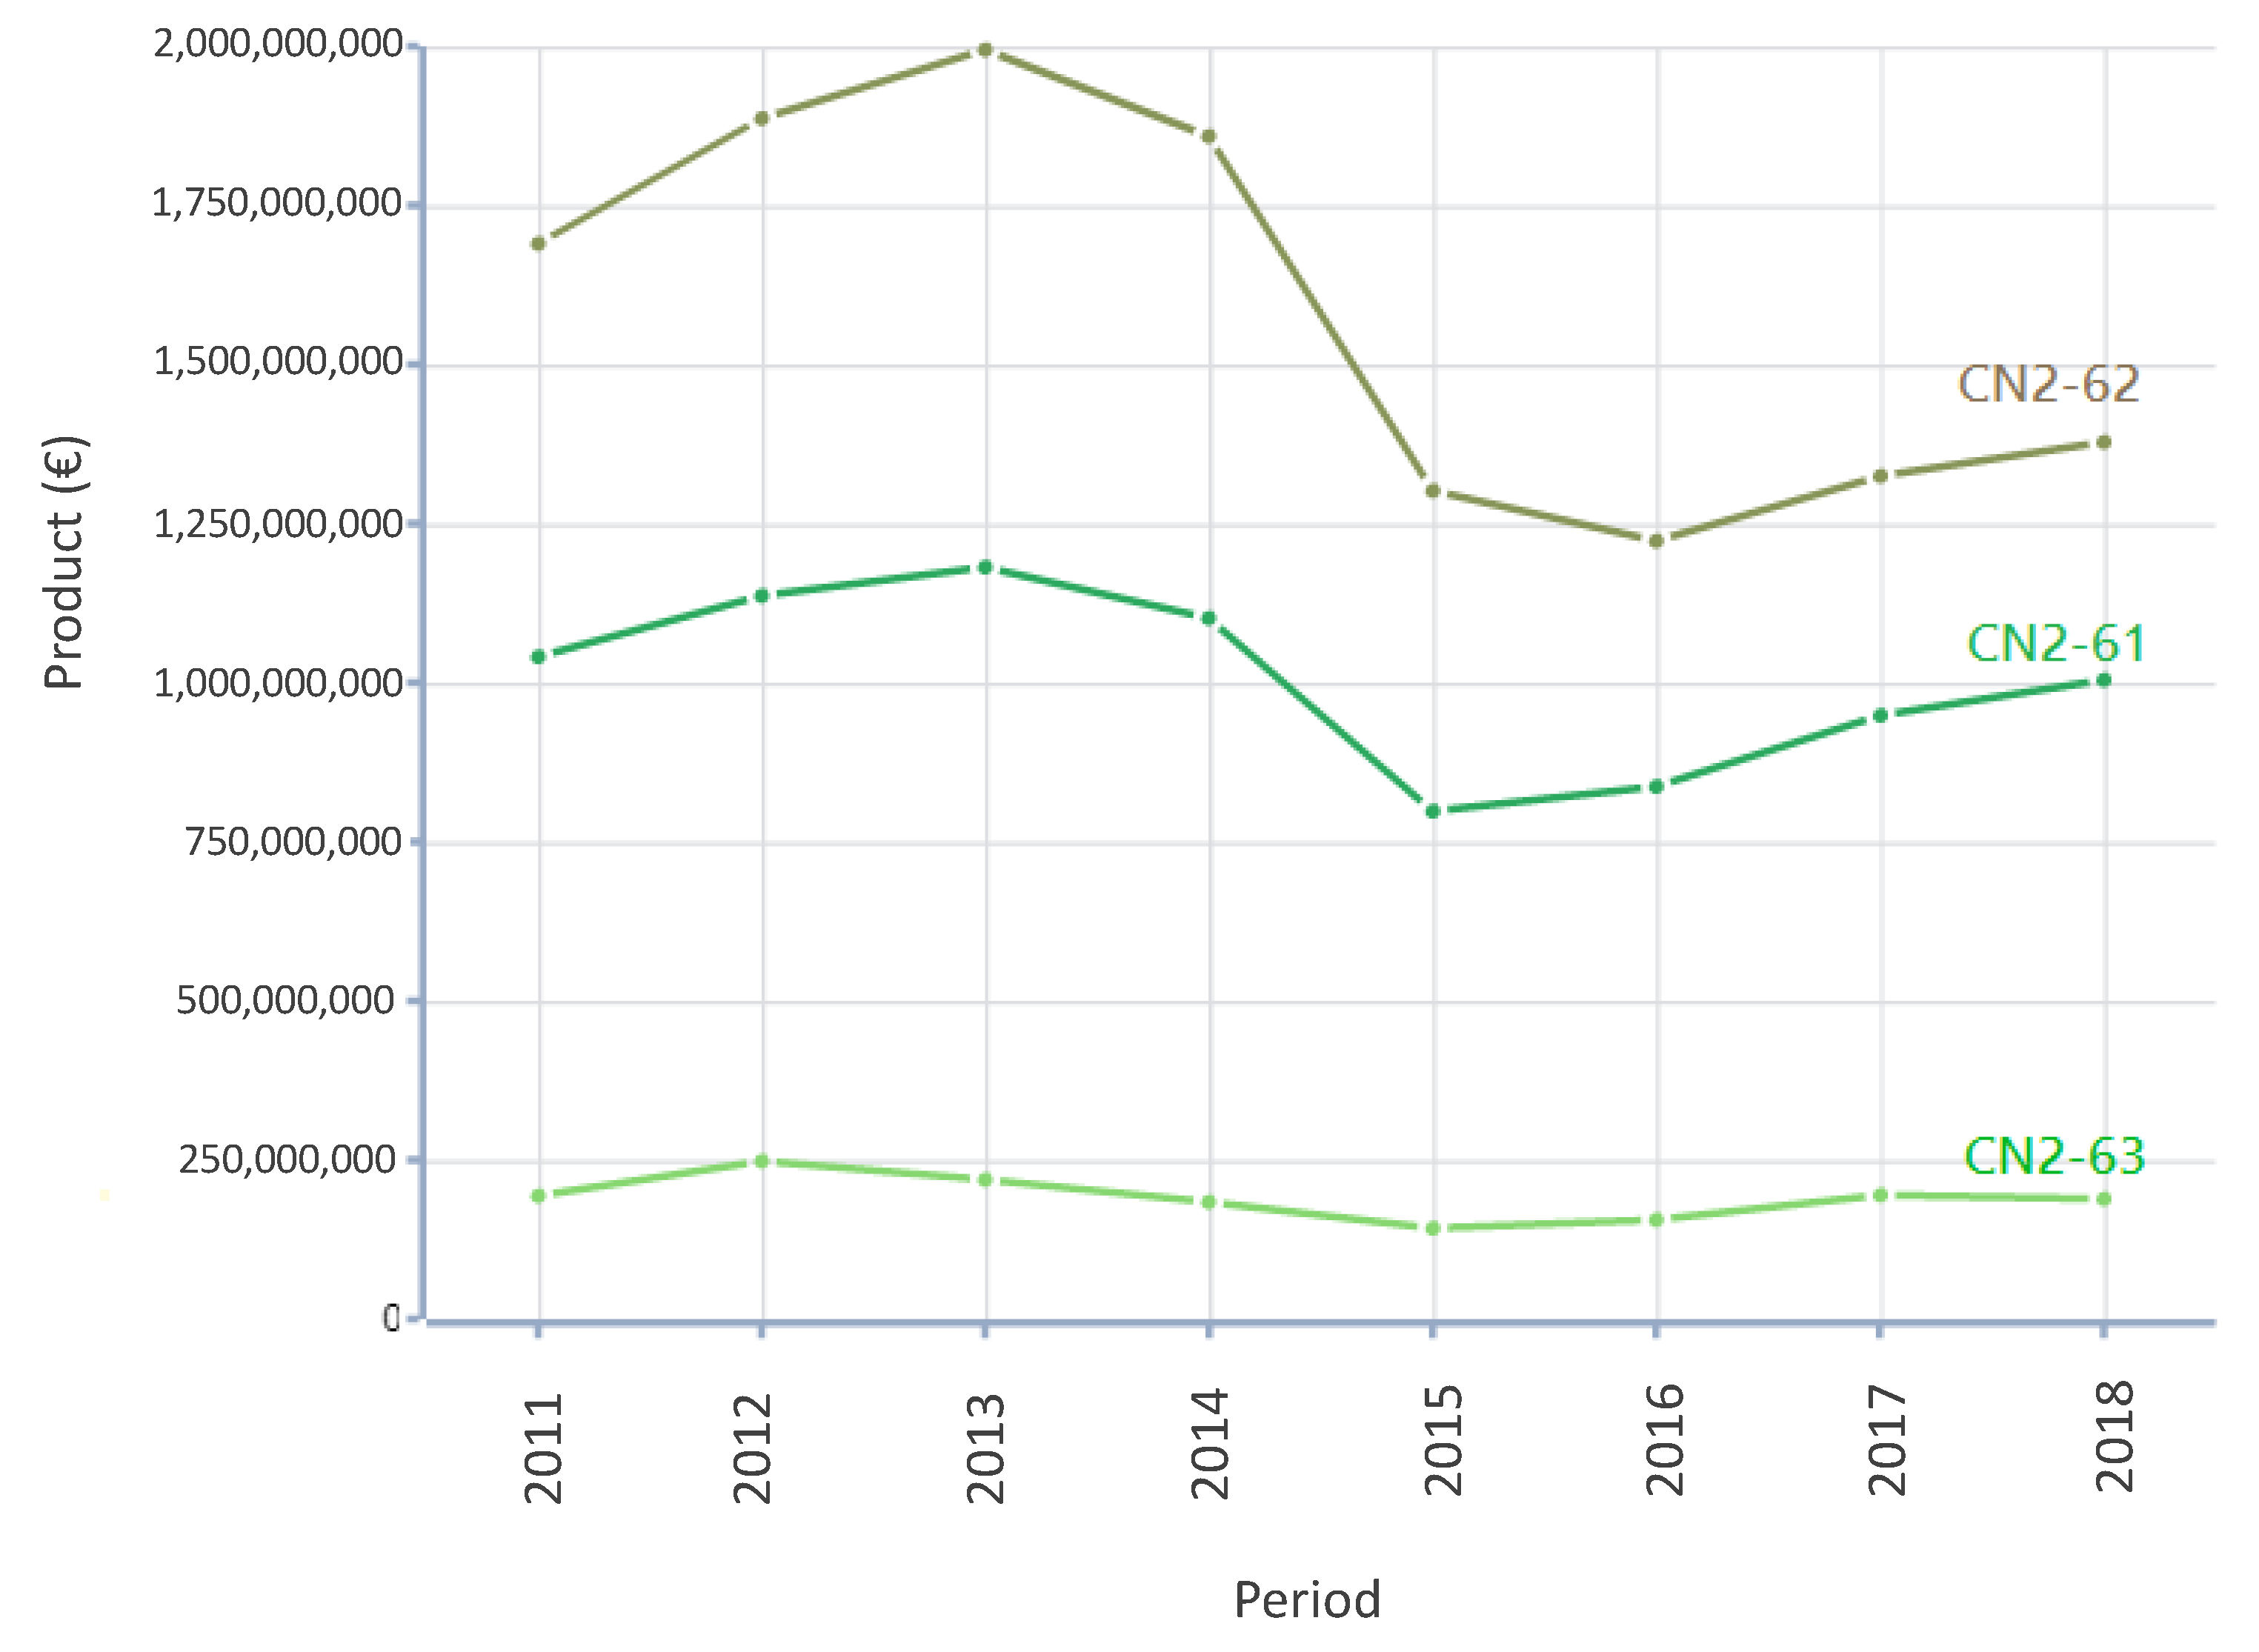
3.3. Results
4. Discussion and Conclusions
Author Contributions
Funding
Acknowledgments
Conflicts of Interest
References
- Camarinha-Matos, L.; Afsarmanesh, H. Collaborative networks: A new scientific discipline. J. Intell. Manuf. 2005, 16, 439–452. [Google Scholar] [CrossRef]
- Christopher, M.; Peck, H. Building the Resilient Supply Chain. Int. J. Logist. Manag. 2004, 15, 1–14. [Google Scholar] [CrossRef]
- Andres, B.; Poler, R. A decision support system for the collaborative selection of strategies in enterprise networks. Decis. Support Syst. 2016, 91, 113–123. [Google Scholar] [CrossRef]
- Bevilacqua, M.; Ciarapica, F.E.; Marcucci, G.; Mazzuto, G. Fuzzy cognitive maps approach for analysing the domino effect of factors affecting supply chain resilience: A fashion industry case study. Int. J. Prod. Res. 2019, 1–29. [Google Scholar] [CrossRef]
- Camarinha-Matos, L.; Afsarmanesh, H.; Boucher, X. The Role of Collaborative Networks in Sustainability. Nonlinear Model Predict. Control 2010, 336, 1–16. [Google Scholar]
- Chorn, N.H. The “Alignment” Theory: Creating Strategic Fit. Manag. Decis. 1991, 29, 20–26. [Google Scholar] [CrossRef]
- Starr, R.; Newfrock, J.; Delurey, M. Enterprise resilience managing risk in the networked economy. Strategy Bus. 2004, 30, 1–10. [Google Scholar]
- Snyder, L.V.; Atan, Z.; Peng, P.; Rong, Y.; Schmitt, A.J.; Sinsoysal, B. OR/MS Models for Supply Chain Disruptions: A Review. SSRN Electron. J. 2010, 48, 89–109. [Google Scholar] [CrossRef]
- Egbelakin, T.; Poshdar, M.; Walsh, K.Q.; Ingham, J.M.; Johnston, D.; Becker, J.; Mbachu, J.; Rasheed, E. Preparation of small to medium-sized enterprises to earthquake disaster. Bull. N. Z. Soc. Earthq. Eng. 2018, 51, 171–182. [Google Scholar] [CrossRef]
- Kimura, N.; Hoshino, S.; Onitsuka, K. Analyzing the Association Between Disaster Risk Preparedness and Environmental Consciousness of Small and Medium-Sized Enterprises: The Case of Sukagawa City, Fukushima Prefecture, Japan. J. Disaster Res. 2019, 14, 1047–1058. [Google Scholar] [CrossRef]
- Ivanov, D. Simulation-based ripple effect modelling in the supply chain. Int. J. Prod. Res. 2017, 55, 2083–2101. [Google Scholar] [CrossRef]
- Morrish, S.; Jones, R. Post-disaster business recovery: An entrepreneurial marketing perspective. J. Bus. Res. 2019, in press. [Google Scholar] [CrossRef]
- Tang, G. Research on transformation from “paired assistance” to “collaborative networks” in post-disaster recovery of 2008 Wenchuan Earthquake, China. Nat. Hazards 2019, 1–23. [Google Scholar] [CrossRef]
- Wu, T.; Blackhurst, J.; O’Grady, P. Methodology for supply chain disruption analysis. Int. J. Prod. Res. 2007, 45, 1665–1682. [Google Scholar] [CrossRef]
- Erol, O.; Sauser, B.J.; Mansouri, M. A framework for investigation into extended enterprise resilience. Enterp. Inf. Syst. 2010, 4, 111–136. [Google Scholar] [CrossRef]
- Nair, A.; Vidal, J.M. Supply network topology and robustness against disruptions—An investigation using multi-agent model. Int. J. Prod. Res. 2011, 49, 1391–1404. [Google Scholar] [CrossRef]
- Kim, Y.; Chen, Y.-S.; Linderman, K. Supply network disruption and resilience: A network structural perspective. J. Oper. Manag. 2014, 33, 43–59. [Google Scholar] [CrossRef]
- Kamalahmadi, M.; Parast, M.M. A review of the literature on the principles of enterprise and supply chain resilience: Major findings and directions for future research. Int. J. Prod. Econ. 2016, 171, 116–133. [Google Scholar] [CrossRef]
- Sanchis, R.; Poler, R. Enterprise Resilience Assessment—A Quantitative Approach. Sustain. 2019, 11, 4327. [Google Scholar] [CrossRef]
- Pei, J.; Liu, W. Evaluation of Chinese Enterprise Safety Production Resilience Based on a Combined Gray Relevancy and BP Neural Network Model. Sustainability 2019, 11, 4321. [Google Scholar] [CrossRef]
- Barroso, A.; Machado, V.; Cruz, V. Supply Chain Resilience Using the Mapping Approach. In Supply Chain Management; IntechOpen: London, UK, 2011; pp. 161–184. [Google Scholar]
- Sheffi, Y.; Rice, J.B. A Supply Chain View of the Resilient Enterprise. A Supply Chain View of the Resilient Enterprise. MIT Sloan. Manag. Rev. 2005, 47, 41–48. [Google Scholar]
- Ivanov, D.; Sokolov, B.; Dolgui, A.; Solovyeva, I. Application of control theoretic tools to supply chain disruption management. In Proceedings of the IFAC Proceedings Volumes; Elsevier BV: Amsterdam, The Netherlands, 2013; Volume 46, pp. 1926–1931. [Google Scholar]
- Craighead, C.W.; Elkins, D.; Handfield, R.B. An empirically derived agenda of critical research issues for managing supply-chain disruptions. Int. J. Prod. Res. 2005, 43, 4067–4081. [Google Scholar]
- Levalle, R.R.; Nof, S.Y. Resilience in supply networks: Definition, dimensions, and levels. Annu. Rev. Control. 2017, 43, 224–236. [Google Scholar] [CrossRef]
- Rajesh, R. On sustainability, resilience, and the sustainable–resilient supply networks. Sustain. Prod. Consum. 2018, 15, 74–88. [Google Scholar] [CrossRef]
- Jabbarzadeh, A.; Fahimnia, B.; Sabouhi, F. Resilient and sustainable supply chain design: Sustainability analysis under disruption risks. Int. J. Prod. Res. 2018, 56, 1–24. [Google Scholar] [CrossRef]
- Mari, S.I.; Lee, Y.H.; Memon, M.S. Sustainable and Resilient Supply Chain Network Design under Disruption Risks. Sustainability 2014, 6, 6666–6686. [Google Scholar] [CrossRef]
- Kaur, H.; Singh, S.P. Sustainable procurement and logistics for disaster resilient supply chain. Ann. Oper. Res. 2016, 283, 1–46. [Google Scholar] [CrossRef]
- Mari, S.I.; Lee, Y.H.; Memon, M.S. Sustainable and Resilient Garment Supply Chain Network Design with Fuzzy Multi-Objectives under Uncertainty. Sustainability 2016, 8, 1038. [Google Scholar] [CrossRef]
- Ivanov, D. Revealing interfaces of supply chain resilience and sustainability: A simulation study. Int. J. Prod. Res. 2017, 56, 3507–3523. [Google Scholar] [CrossRef]
- Camarinha-Matos, L.M. Collaborative Networks: A Mechanism for Enterprise Agility and Resilience. Enterp. Interoperability VII 2014, 3–11. [Google Scholar]
- Andres, B.; Poler, R.; Sanchis, R. Collaborative Strategies Alignment to Enhance the Collaborative Network Agility and Resilience. Secur. Educ. Crit. Infrastruct. 2015, 463, 88–99. [Google Scholar]
- Barthe-Delanoë, A.M.; Montarnal, A.; Truptil, S.; Bénaben, F.; Pingaud, H. Towards the agility of collaborative workflows through an event driven approach—Application to crisis management. Int. J. Disaster Risk Reduct. 2018, 28, 214–224. [Google Scholar] [CrossRef]
- Zhu, W.; Wang, Z. The Collaborative Networks and Thematic Trends of Research on Purchasing and Supply Management for Environmental Sustainability: A Bibliometric Review. Sustainability 2018, 10, 1510. [Google Scholar] [CrossRef]
- Andres, B. An Approach to Support the Strategies Alignment Process in Collaborative Networks. Ph.D. Thesis, Universitat Politècnica de València, Valencia, Spain, 2016. [Google Scholar]
- Ivanov, D.; Sokolov, B.; Solovyeva, I.; Dolgui, A.; Jie, F. Dynamic recovery policies for time-critical supply chains under conditions of ripple effect. Int. J. Prod. Res. 2016, 54, 7245–7258. [Google Scholar] [CrossRef]
- Sanchis, R.; Poler, R. Definition of a framework to support strategic decisions to improve Enterprise Resilience. IFAC Proc. Vol. 2013, 46, 700–705. [Google Scholar] [CrossRef]
- Forrester, J.W. Industrial Dynamics; MIT Press: Cambridge, MA, USA, 1961. [Google Scholar]
- Campuzano, F.; Mula, J. Supply Chain Simulation. A System Dynamics Approach for Improving Performance; Springer: London, UK; Dordrecht, The Netherlands; Heidelberg, Germany; New York, NY, USA, 2011. [Google Scholar]
- AnyLogic. AnyLogic. 2020. Available online: https://www.anylogic.com/ (accessed on 25 March 2020).
- Abylaev, M.; Pal, R.; Torstensson, H. Resilience challenges for textile enterprises in a transitional economy and regional trade perspective - a study of Kyrgyz conditions. Int. J. Supply Chain Oper. Resil. 2014, 1, 54. [Google Scholar] [CrossRef]
- Li, W.-Y.; Chow, P.S.; Choi, T.-M.; Chan, H.-L. Supplier integration, green sustainability programs, and financial performance of fashion enterprises under global financial crisis. J. Clean. Prod. 2016, 135, 57–70. [Google Scholar] [CrossRef]
- Venkatesh, V.; Rathi, S.; Patwa, S. Analysis on supply chain risks in Indian apparel retail chains and proposal of risk prioritization model using Interpretive structural modeling. J. Retail. Consum. Serv. 2015, 26, 153–167. [Google Scholar] [CrossRef]
- Yang, S.; Song, Y.; Tong, S. Sustainable Retailing in the Fashion Industry: A Systematic Literature Review. Sustainability 2017, 9, 1266. [Google Scholar] [CrossRef]
- Sanctions against Russia and the Russian Embargo: Billions of Euros Damage to ‘Made in Italy’ Products. 2018. Available online: http://www.europarl.europa.eu/doceo/document/E-8-2018-002225_EN.html (accessed on 20 February 2020).
- Andres, B.; Pole, R. Supporting the Strategies Alignment Process in Collaborative Networks. In Doctoral Conference on Computing, Electrical and Industrial Systems; Springer: Cham, Switzerland, 2017; Volume 499. [Google Scholar]


| Indices | |
| net | set of networks (net = 1, …, N) |
| i | set of enterprises (i = 1, …, I) |
| x | set of objectives (o = 1, …, O) |
| k | set of key performance indicators (k = 1, …, K) |
| s | set of strategies (s = 1, …, S) |
| Model Parameters | |
| n | number of enterprises belonging to the network |
| ei | enterprise i |
| oix | objective x defined in enterprise i (ei) |
| bi | budget owned by the ei in monetary units [m.u.] to invest in the activation of the strategies |
| stris | strategy s defined by ei |
| kpiixk | key performance indicator (KPI) k used to measure the objective oix |
| kpiixk | increase observed in the kpiixk when the stris are activated. It can be decomposed in:
|
| kpiixkmax | maximum value of kpiixk estimated by the ei (used to homogenise all the KPIs) |
| wixk | weight of kpiixk, determines the relevance that the kpiixk has for ei |
| kpii | KPI defined at enterprise ei level |
| kpinet | KPI defined at network net level |
| F_inf_stris_kpiixk | function that models the behaviour of the kpiixk when stris is activated, is a time-dependent function f(t) |
| c_stris | cost of activating one unit of strategy stris [m.u.] |
| stris_mu | monetary units invested in the activation of stris [m.u.] |
| val_stris_kpiixk | numerical value estimated by the enterprise ei, that registers the increase or decrease of the kpiixk when one unit of stris is activated |
| H | horizon, time units [t.u.], period of time in which the set of strategies are to be activated. Normalised to the unit, H = 1. |
| d1_stris | delay, time period between ti_stris and the time when the kpiixk is started to be influenced by the activated stris [t.u.] |
| d2_stris | time period between the stris starts to influence the kpiixk until the maximum level of influence in is achieved (inf_stris_kpiixk), [t.u.] |
| inf_stris_kpiixk | maximum level of influence on the kpiixk when stris is activated |
| slope_stris_kpiixk | slope of the ramp in F_inf_stris_kpiixk |
| d3_stris | time period in which stris is exerting the highest influence (inf_stris_kpiixk) on the kpiixk [t.u.] |
| d4_stris | total duration of stris [t.u.] |
| tf_stris | unit of time when stris is finished [t.u.] |
| Threshold_kpiixk | value from which the associated kpiixk is affected by the inf_stris_kpiixk. Below Threshold_kpiixk the influence of stris is not observed, from Threshold_kpiixk, the influence exerted by stris is considered |
| Decision Variables | |
| u_stris | units of strategy [u.s] stris to be activated |
| ti_stris | initial time of activation of stris [t.u.] |
| Mathematical Model (SAM) | Elements in SD Model |
|---|---|
| c_Sis | |
| d1_Sis | |
| d2_Sis | |
| d3_Sis | |
| d4_Sis | |
| KPIixk_min | |
| Threshold_KPIixk | |
| ti_Sis | |
| u_Sis | |
| val_Sis_KPIixk | |
| Wikx | |
| Inf_Sis_KPIixk | |
| KPI_i | |
| KPI_GLOBAL | |
| KPIixk | |
| KPIixk_T | |
| Sis_mu | |
| bi | bi |
| curve_KPIixk | |
| curve_KPIixk_T | |
| fulfill_KPIixk_min | |
| slope_stris_kpiixk | slope_Sis_KPIikx |
| tf_stris | tf_Sis |
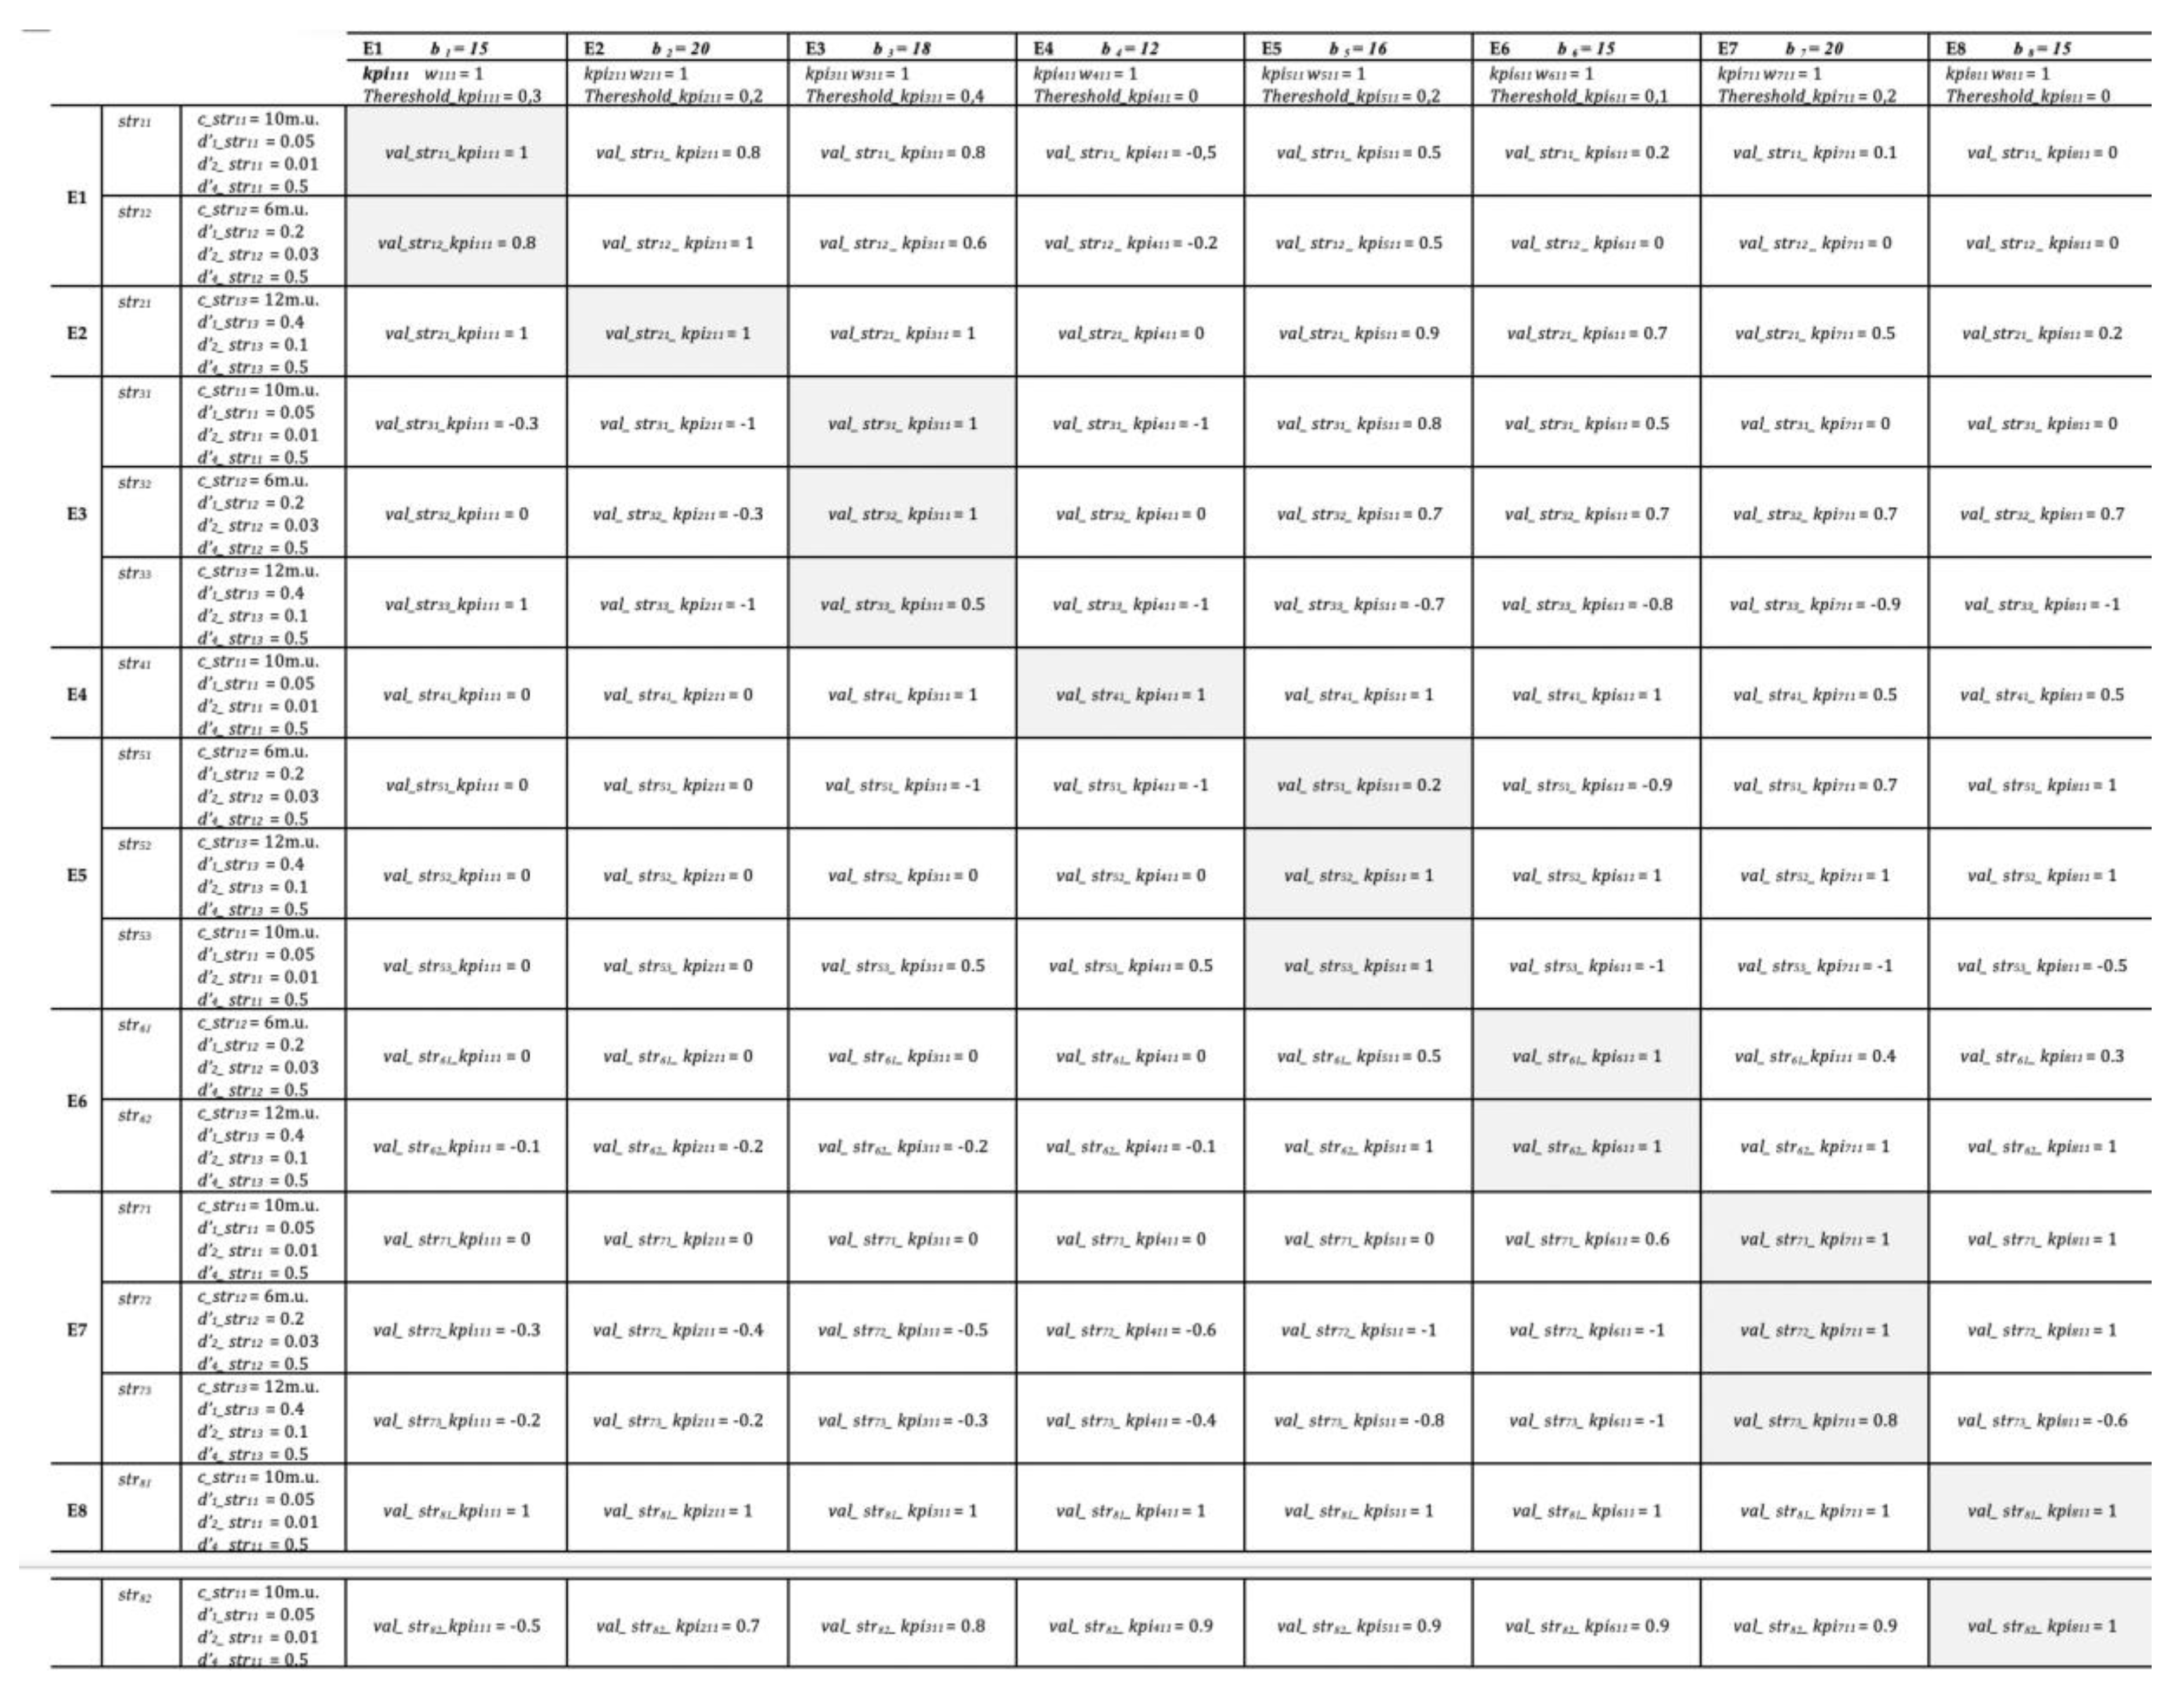
| Id | SC Node | Strategies Codification and Definition |
|---|---|---|
| E1 | RM Supplier | str11: Training in production traceability |
| str12: Create practical programs and partnerships for fire prevention and worker safety | ||
| E2 | Yarn Supplier | str21: Maintain a close and fluid relationships with suppliers and strengthen compliance with their obligations |
| E3 | Fabric Supplier | str31: Group suppliers into clusters |
| str32: Guarantee the traceability of production | ||
| str33: Strengthen the supply chain in the Southeast Asian region | ||
| E4 | Dye Supplier | str41: Ensure the high quality of monitoring tools |
| E5 | Manufactu-rer | str51: Reduce of price of the involved product, during the period of overproduction |
| str52: Increase the marketing activities on the product disturbed by the drop of demand | ||
| str53: Reuse the product, disturbed by the drop of demand, and manufacture another product. Use production capacity in the new product and use different distribution channels to place the product in another market. | ||
| E6 | Wholesaler | str61: Trabajo conjunto del equipo de RSC con los distintos departamentos de la empresa y en especial con los departamentos de compra |
| str62: Incorporar un eslabón en la cadena de suministro para el recogida y reciclado de producto | ||
| E7 | Distributor | str71: Launch promotions with the disturbed product (i.e., personalization of disturbed product to sell in other niches of market) |
| str72: Reduce of price of the disturbed product, by reducing the turnover margin and reducing the price of the manufacturer product | ||
| str73: Open new markets: (i) distribute the product at the same price with the additional cost of opening up a new market interesting option if the distributor is interested in continuing on the market in the long term; or (ii) distribute the product at lower price with white label to absorb the unsold products, the new market will have a specific duration. | ||
| E8 | Retailer | str81: Promote purchasing practices that guarantee the sustainability of the supply chain |
| str82: Evaluation of the current situation of the supply chain with the objective of identifying areas of work in the field of resilience |
| Non-Collaborative Scenario | Collaborative Scenario | ||
|---|---|---|---|
| str11 | 1 (ti = 0.32) | 1 (ti = 0) | |
| str12 | 0 | 0 | |
| str21 | 0 | 1 (ti = 0) | |
| str31 | 1 (ti = 0.457) | 1 (ti = 0) | |
| str32 | 1 (ti = 0.388) | 0 | |
| str33 | 0 | 0 | |
| str41 | 1 (ti = 0.37) | 1 (ti = 0) | |
| str51 | 1 (ti = 0.335) | 0 | |
| str52 | 0 | 1 (ti = 0) | |
| str53 | 1 (ti = 0.475) | 0 | |
| str61 | 1 (ti = 0) | 1 (ti = 0) | |
| str62 | 0 | 0 | |
| str71 | 1 (ti = 0.465) | 1 (ti = 0) | |
| str72 | 1 (ti = 0.335) | 0 | |
| str73 | 0 | 0 | |
| str81 | 1 (ti = 0.124) | 1 (ti = 0) | |
| str82 | 0 | 0 | % KPIs Improvement |
| kpi111 | 0.476 | 0.614 | 29% |
| kpi211 | 0.075 | 0.263 | 251% |
| kpi311 | 1.439 | 1.492 | 4% |
| kpi411 | 0.008 | 0.22 | 2650% |
| kpi511 | 1.84 | 1.497 | −19% |
| kpi611 | 0.881 | 1.677 | 90% |
| kpi711 | 1.318 | 1.162 | −12% |
| kpi811 | 0.845 | 0.591 | −30% |
| 0.86 | 0.939 | 9% |
© 2020 by the authors. Licensee MDPI, Basel, Switzerland. This article is an open access article distributed under the terms and conditions of the Creative Commons Attribution (CC BY) license (http://creativecommons.org/licenses/by/4.0/).
Share and Cite
Andres, B.; Marcucci, G. A Strategies Alignment Approach to Manage Disruptive Events in Collaborative Networks. Sustainability 2020, 12, 2641. https://doi.org/10.3390/su12072641
Andres B, Marcucci G. A Strategies Alignment Approach to Manage Disruptive Events in Collaborative Networks. Sustainability. 2020; 12(7):2641. https://doi.org/10.3390/su12072641
Chicago/Turabian StyleAndres, Beatriz, and Giulio Marcucci. 2020. "A Strategies Alignment Approach to Manage Disruptive Events in Collaborative Networks" Sustainability 12, no. 7: 2641. https://doi.org/10.3390/su12072641
APA StyleAndres, B., & Marcucci, G. (2020). A Strategies Alignment Approach to Manage Disruptive Events in Collaborative Networks. Sustainability, 12(7), 2641. https://doi.org/10.3390/su12072641