Article

Developing a Sustainable Management Strategy for Quantitative Estimation of Optimum Nitrogen Fertilizer Recommendation Rates for Maize in Northeast China

1
College of Life Science, Yan’an University, Yan’an 716000, Shaanxi, China
2
College of Land and Environmental, Shenyang Agriculture University, Shenyang 110866, China
*
Authors to whom correspondence should be addressed.
Sustainability 2020, 12(7), 2607; https://doi.org/10.3390/su12072607
Submission received: 28 February 2020 / Revised: 18 March 2020 / Accepted: 21 March 2020 / Published: 25 March 2020
(This article belongs to the Special Issue Sustainable Cropping Practices to Counteract Environmental Stresses)

Abstract

:
Excessive application of chemical fertilizers has caused a series of environmental problems, including environmental pollution. Quantitative estimation of a sustainable fertilizer recommendation rate is paramount for formulating fertilizer management strategies to improve productivity of low-yield regions and to prevent environmental damage. In this study, the database was drawn from 31 experimental sites in the main maize production region of Northeast China, during the period 2009 to 2013, to study the relationships between yield factors and nitrogen application rates, and to explore sustainable nitrogen (N) fertilizer recommendation rates based on analysis using the fertilizer response model. The fertilizer response model method is a technique that can provide effective performance predictions for the estimation of the optimum crop balanced fertilizer rates in varied agricultural regions. Results revealed that the average grain yield in treatment of N180 (the amount of nitrogen application rate was 90 kg ha −1) was highest, and the yield increase rate ranged from 4.77% to 58.53%, with an average of 25.89%. The sequence of grain yields in each treatment receiving N fertilizer management from high to low was: N180 > N270 > N90 in all the regions. The agronomic efficiency for applied N in N90, N180, N270 treatments was 11.8, 10.8, and 4.6 kg kg −1, respectively. The average optimum N fertilizer recommendation rate in Liaoning province was 180.4 kg ha −1, and the predicted optimum yield ranged between 7908.7 and 12,153.9 kg ha −1, with an average of 9699.1 kg ha −1. The mean optimum N fertilizer recommendation rate in western (WL), central and southern (SCL), eastern (EL), and northern (NL) of Liaoning province were 184.2, 177.2, 163.5, and 192.5 kg ha −1, and the average predicted optimum yields were 8785.3, 10,630.3, 9347, and 9942.4 kg ha −1. This study analyzed the spatial distribution of optimum fertilizer recommendation rates and the corresponding theoretical yield based on a large database, which helped to develop effective and environment-friendly N management strategies for sustainable production systems.

1. Introduction

Food security faces the great challenges of continuous population growth and arable land resources decreasing [1,2,3]. With the population increasing, the demand for the world’s major crops’ production is projected to double in the next few decades [4,5]. However, there are unprecedented pressures on the agricultural system to meet the increasing food demand [6]. Maize (Zea mays L.) is one of the indispensable three largest food sources in China. China has allotted 16 million hectares of cultivation area to maize production, producing 216 million tons of maize per year [7]. Maize plays a pivotal role in ensuring food safety and offers multiple benefits to human nutritional needs [8]. Using maize to produce food and bioenergy is a strategic choice due to its abundance and proximity to existing grain-to-ethanol conversion facilities. The demand for maize grain and straw for this purpose will increase quickly, and without expanding the cultivated land, creating the need for a more efficient improving maize yields in the main agricultural areas of the world [9,10,11].
In order to improve maize yield, the application of nitrogen fertilizer has become one of the most important measures in China. The costs of nitrogen are relatively low compared to the value of land. Nitrogen, an essential nutrient element for the all growth functions, is a major nutrient limiting progress toward improving crop productivity [12,13,14]. In recent years, twice as much nitrogen fertilizer was applied into agricultural land, whereas excessive and blind application of nitrogen fertilizer has become a common phenomenon in agricultural production, which will inevitably lead to a decrease in agronomic efficiency and even bring about a decline in yield and crop quality [15,16,17]. A large number of studies have shown that the N surplus had accumulated to 46–280 kg N ha−1 in farmers’ fields, which implies that more nitrogen accumulated in the soil or were lost to the environment and bring a series of ecological problems, such as water eutrophication, and greenhouse gas emissions [18,19]. The environmental costs of the overuse of nitrogen fertilizers are incalculable, and therefore, fertilizer application and its environmental benefits must be considered. Only by implementing effective fertilization strategies and improving the efficiency of nitrogen fertilizer use will it be possible to maintain the ecology and thereby achieve a balanced development of high-yield and efficient production of maize [20]. The aim should be to obtain maximum yield using the lowest possible amount of fertilizer to ensure crop growth, taking into account both the development of crop production and protection of the environment. In the current climate, it is particularly urgent that scientific and reasonable nitrogen fertilization application methods are developed, in order to ensure high yields of food production.
A large number of methods have been applied to the fertilizer recommendation for various crops, such as the linear plus platform model [21,22], sphere model [23], and Mitscherlich model [24]. More remarkably, the fertilizer effect function model requires numerous manuring field trials to be conducted on different fertilizer application amounts in preliminary stages, which makes the method suitable and reliable for large-scale planting regions [25]. At present, the fertilizer effect function model is based on multiyear and multisite field experiments, which proves that this model could adopt a scientific approach to predicted optimum fertilizer application rates, and effectively prevent the abuse of chemical fertilizer such as nitrogen (N) and phosphorus (P) fertilizer, with the purpose of ensuring stable development of agricultural production.
Based on the foregoing, the aim of this work was to determine the recommended nitrogen fertilization parameters suitable for large-scale planting regions, in order to provide scientific guidance on fertilization in the present cropping system. This study collected data from 31 experimental sites in the northeast plain from 2009 to 2013. The objectives of this study were as follows: (1) Analyze the characters of grain yield, yield increasing rate, and agronomic efficiency of N for maize; (2) determine which functions describe the relationships between the grain yield and fertilizer application in Liaoning province; and (3) accurately evaluate fertilizer recommendation rates of N using the fertilizer effect function model in western, southern and central, and eastern areas of Liaoning province.

2. Materials and Methods

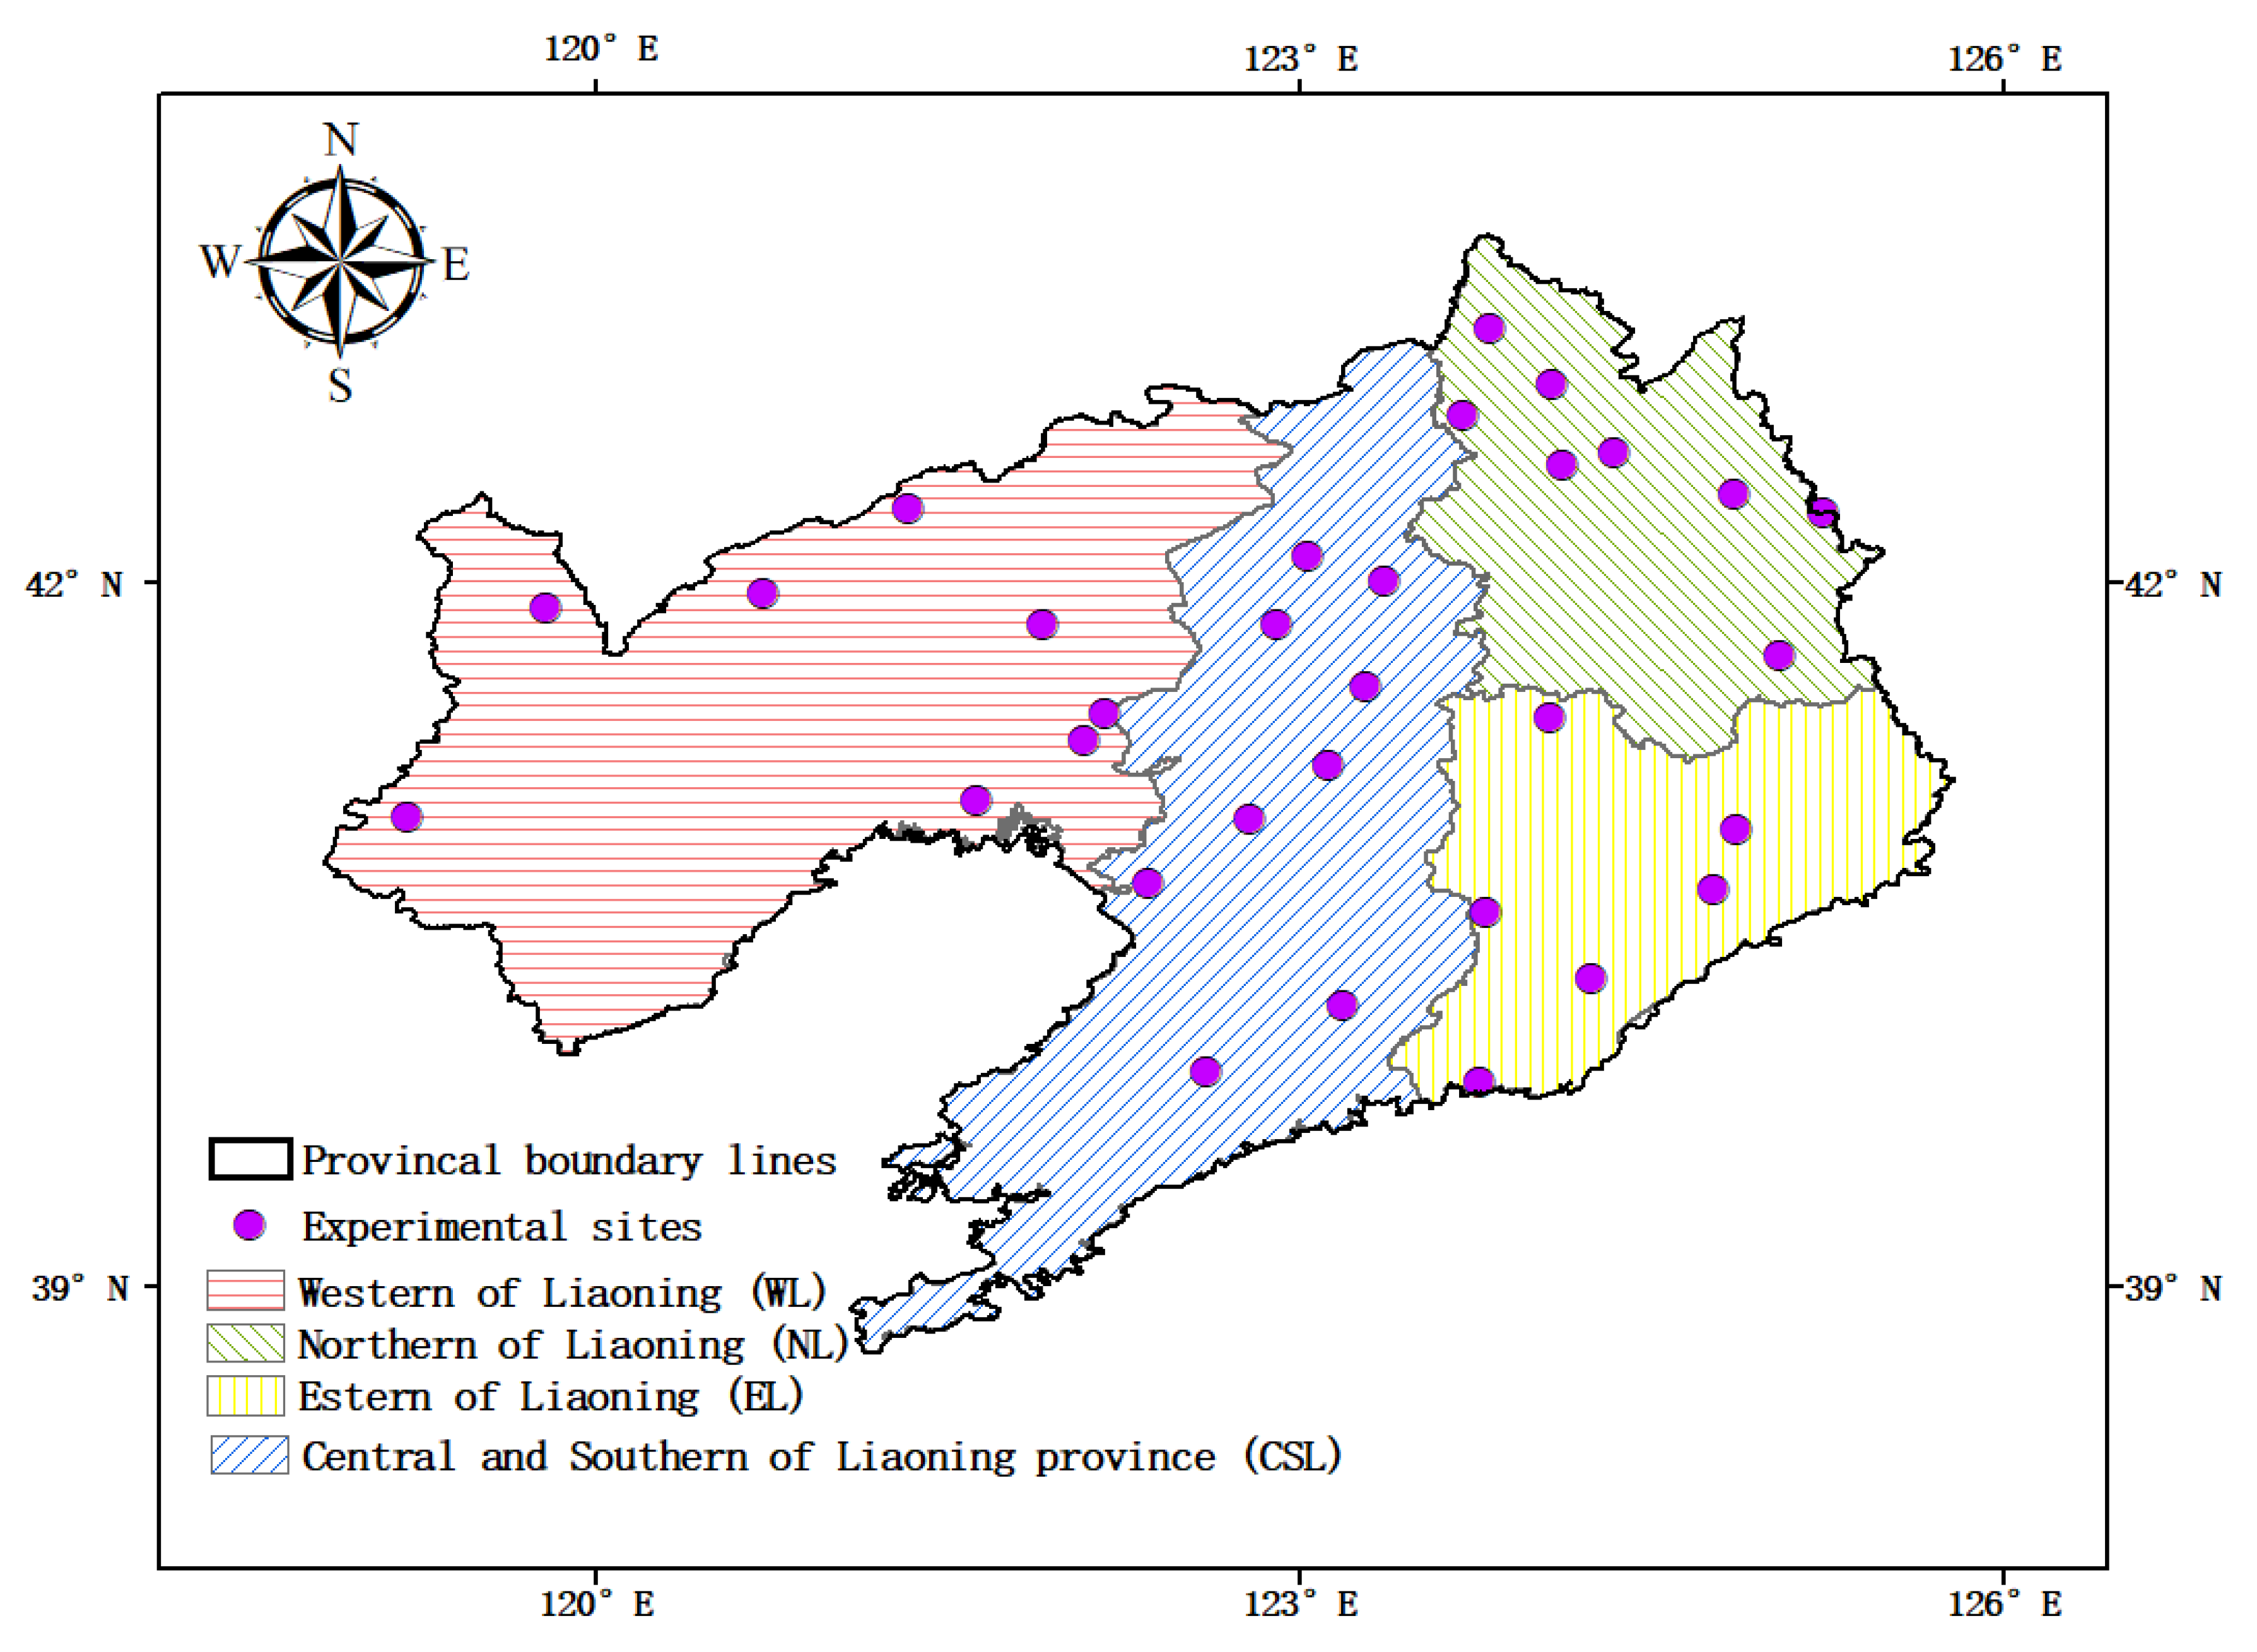
2.1. Site Description

The 31 sites of experimental farmland used in this study can be found at latitude 38°43′N–43°26′N, longitude 108°53′–125°46′E and belong to the typical warm temperate continental monsoon climate (Figure 1). Annual rainfalls generally start in April and continue up to early October. The summary of the experimental sites for maize production region is as follows: Across all experimental sites, the peak time for precipitation is observed in July and the district records average annual precipitation ranges from 550 to 690 mm. The total annual radiation ranges from 5020 to 5860 MJ/m2. The annual mean temperature is 8.1–9.2 °C. The frost-free period ranges from 150 to 200 days. Soil was typic Hapli-Stagnic Anthrosols (USDA soil system) in experimental region and had the following chemical properties in a depth of the topsoil (20 cm) before beginning of the experiment in 2009–2013 (range): pH ranged from 5.4 to 7.3, soil organic carbon ranged from 5.9 to 10.8 g kg −1, total N ranged from 0.52 to 1.07 g kg −1, and alkaline hydrolyse N, Olsen-P and available K were in the range of 54.38–113.65 mg kg −1, 14.7–33.6 mg kg −1, 93.68–134.23 g kg −1, respectively, and bulk density of 1.05–1.21 g cm −3.

2.2. Experimental Design and Management

Field experiments were conducted in 31 experimental sites of the northeast plain for 5 years (2009–2013), and the location of 31 experimental sites were shown in Figure 1. Each experimental plot was 60 square meters. In total, 14 treatments were performed at each experimental site, and four different nitrogen fertilizer treatments were selected for the research, i.e., (i) no nitrogen fertilizer was added (-N); (ii) N deficiency treatment (LN): The amount of nitrogen application rate was 90 kg ha −1; (iii) N medium treatment (N180): The amount of nitrogen application was 180 kg ha −1; (iv) sufficient N supply treatment (N270): The amount of nitrogen fertilizer application rate was 270 kg ha −1. In practice, Phosphorus (P) and potassium (K) fertilizer application rates were adjusted according to local soil fertility, P (95 kg ha −1) and K (120 kg ha −1) were used in all treatments. The N, P, and K fertilizers used consisted of urea (46% N), superphosphate (12% P2O5), and potassium chloride (60% K2O), respectively. Before sowing, 60% of nitrogen fertilizer in all treatment was applied into the soil as basal fertilizer, and 40% nitrogen fertilizer was applied as dressing fertilizer during the tasseling stage and heading stage, respectively. Field management is consistent with the local farmers’ habits. Meanwhile, weeds, diseases, and insect pests were controlled by spraying herbicides (Atrazine and ropisochlor) and insecticides (Methami-dosphos, Omethoate, and Tradimefon) and fungicides, which were in accordance with the conventional local management practices, and thus there are no obvious weeds, diseases, and insect pests in the growing season of crops.

2.3. Sample Collection and Analysis

The location software was used to record the name and longitude and latitude of the experimental sites, and collected the planting and fertilization of these sites. After maturity (October 1 to October 15) each year, maize plant samples and soil samples were collected, marked, and sealed, and brought back to the laboratory for analysis. The fresh plants were harvested, and the plant separated from grain and straw. These samples were first dried at 105 °C for 30 min to halt biological activity, and then dried at 75 °C until a constant weight was achieved (the grain yield value was adjusted to 14% moisture), and the thousand-grain weight was recorded. The sampled grain and straw were ground through a 0.5 mm sieve, and analyzed by the Kjeldahl method after H2SO4-H2O digestion for determination of N concentration.

2.4. Fertilizer Effect Function Model

The fertilizer effect function model (quadratic model) was used as a promising tool for evaluating the optimum fertilizer recommendation rates, which is supported by experimental database for grain yield and different fertilizer application levels.
Seek the correlation:
Y = aN2 + bN + c
where y is the grain yield (kg ha −1), and N is the amount of nitrogen fertilizer rates (kg ha −1), a represents the quadratic regression coefficient, b represents the linear regression coefficient, and c represents the basic yield.

2.5. Calculations and Parameters

Agronomic efficiency of N (AEN) represented by the proportion between (Yield in N fertilized-Yield in no N fertilized) to the N fertilizer application rate was the following formula [26]:
A E N = Y ield in   N   fertilized Y ield in   no   N   fertilized N   application   rate

2.6. Statistical Analysis

Statistical analysis was performed with SPSS Statistics Software 19.0 for Windows and Figures were performed Origin 2018. The differences of crop yield between all treatments were analyzed using analysis of variance (ANOVA) and Tukey’s multiple comparisons tests at 5% significance level. Regression equation was used to quantify the relationships among the response variables (N application and yield).

3. Results and Discussion

3.1. Characteristics of Grain Yield and Yield Increasing Rate

The maize grain yields at different N fertilization levels (-N, N90, N180, and N270) for all sites is shown in Figure 2a. The mean grain yields of the -N, N90, N180, and N270 treatments were 7932.7 kg ha −1 (ranged from 5565.3 to 10,266 kg ha −1), 8998.9 kg ha −1 (ranged from 6214.5 to 11,250.2 kg ha −1), 9885.8 kg ha−1 (ranged from 8137.5 to 12074.7 kg ha −1), and 9150.3 kg ha −1 (ranged from 7149.3 to 11,915.3 kg ha −1), respectively (Figure 2a). The frequency distribution of the yield increase rate was shown in Figure 2b. Particularly in the N180 treatment, the yield increase rate was the highest, which ranged from 4.77% to 58.38%, with an average of 25.89%. Results showed that the mean yields increase rate in the N90 and N180 treatment was 13.74% and 16.15%, with the increasing range of 2.04–32.05% and 1.36%–51.67% (Figure 2b). It is remarkable that the grain yields in each treatment with receiving N fertilizer management from high to low was: N180 > N270 > N90 in all the regions (Figure 2a).
Zhao et al. [27] conducted in a representative agricultural area in Quzhou County of China, and reported that the mean maize yield was 7900 kg ha −1 (a range from 4500 to 11,300 kg ha −1), which is similar to grain yield in -N treatment of our study. Setiyono et al. [28] measured at physiological maturity in on-station and on-farm experiments in Nebraska (USA), Indonesia, and Vietnam during 1997–2006, and found that the average grain yield is 12,000 kg ha −1, which was somewhat greater than the average of 9885.8 kg ha –1 in N180 treatment of our study. These results indicated that the grain yield was determined by better soil and fertilizer management in the study.

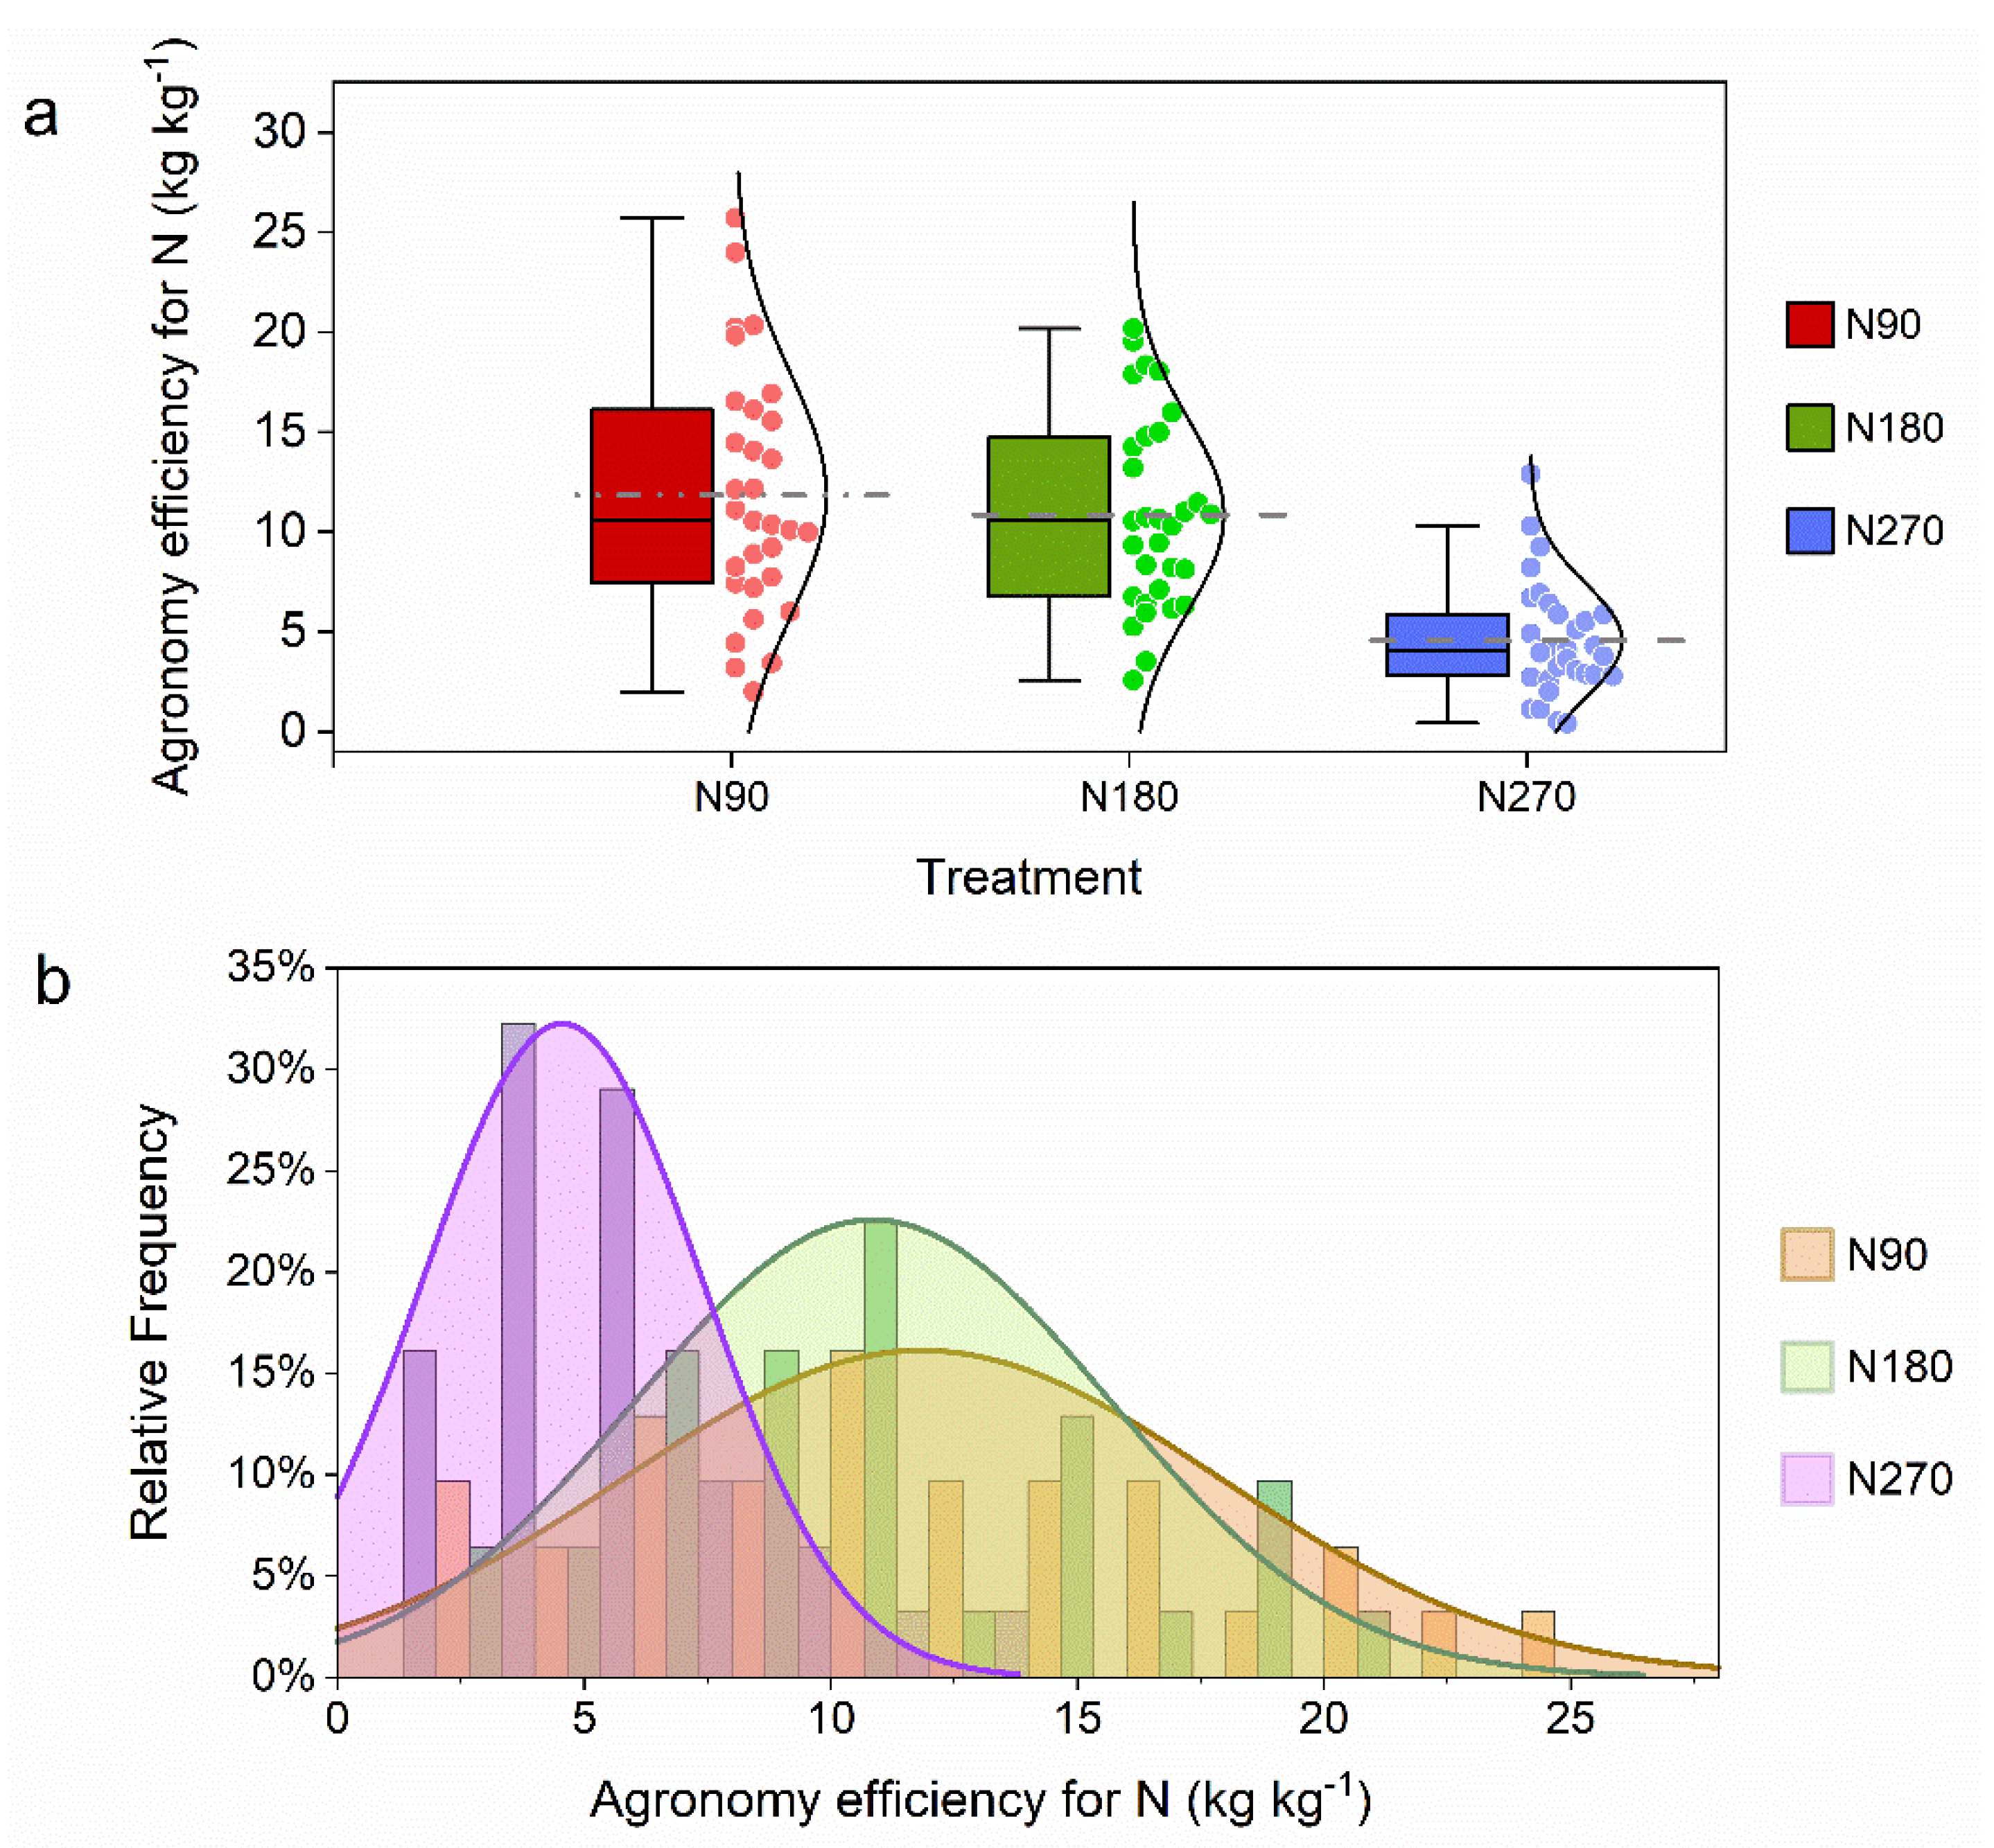
3.2. Agronomy Efficiency for Nitrogen

The frequency distribution of agronomic efficiency for N (AEN) on maize was shown in Figure 2. In these database, the agronomic efficiency for applied N on maize in N90, N180, N270 treatments was 11.8 kg kg −1 (ranged from 2.0 to 25.7 kg kg −1), 10.8 kg kg−1 (ranged from 2.6 to 20.2 kg kg −1), and 4.6 kg kg −1 (ranged from 0.4 to 2.9 kg kg −1), respectively (Figure 3a). The data of each treatments presented normal distribution curves (Figure 3a). From the relative frequency of AEN (Figure 3b), it could be seen that about 16.1%, 22.6%, 35.5%, 12.9%, and 12.9% of AEN samples in N90 treatment were distributed in the ranges of 0–5, 5–10, 10–15, 15–20, and 20–25 kg kg −1; approximately 6.5%, 29.0%, 35.5%, 19.4%, and 3.2% of AEN in N180 treatment were distributed in the ranges of 0–5, 5–10, 10–15, 15–20, and 20–25 kg kg −1; and 48.4%, 45.2%, and 6.5% of AEN in N270 treatment were distributed in the ranges of 0–5, 5–10, and 10–15 kg kg −1. Chuan et al. [29] reported that the AEN for wheat in China ranged between 0 and 35 kg kg −1, and AEN could an average value of 9.4 kg kg −1, and the results were similar with AEN in -N, N90, and N180 treatment of our study. The agronomic efficiency for N in our study was just at the baseline reported by Dobermann et al. [30] study, which illustrated that AEN for cereals in developing countries ranged from 10 to 30 kg kg −1. These results showed that agronomic efficiency of N remains low in China, emphasized to improve fertilizer management.

3.3. The Regression Coefficient of Quadratic Model of Nitrogen Fertilizers in Maize

The quadratic model was used for fitted based on the grain yield and nitrogen fertilizer application rates (Figure 4). We made statistics on the regression coefficients for the quadratic model of nitrogen (N) fertilization effect on maize and obtained the following results in Table 1 and Figure 4. The mean values of coefficients a, b, and c in the quadratic model of nitrogen fertilizer effect in Liaoning Province are −0.056, 20.04, and 7859.8, respectively (Table 1). The average quadratic model of nitrogen fertilizer in Liaoning Province Y = −0.056N2 + 20.04N + 7859.8 was obtained.

3.4. Optimum Nitrogen Fertilizer Recommendation Rates for Maize in Liaoning Province

Scientific and rational balanced fertilization is an effective way to promote high-yield and high-efficiency utilization of corn, as an important basis for guiding crop fertilization practice and related research. Therefore, we calculated the optimum nitrogen fertilizer recommendation rates and the corresponding theoretical yields based on the quadratic regression model that fit the relationship between yield and N application rates (Table 2). Therefore, the average optimum N fertilizer recommendation rate was 180.4 kg ha −1, and ranged from 136 to 248.1 kg ha −1 (Table 2). The theoretical yield is ranged between 7908.7 and 12153.9 kg ha −1, with an average of 9699.1 kg ha −1 (Table 2). Li et al. [20] reported that the average optimum N fertilizer recommendation rate for maize in central and southern Liaoning province was 210 kg ha −1, which was significantly higher (29.6 kg ha −1) than that in this study. Xu et al. [31] proposed that the optimum N fertilizer requirement based on Nutrient Expert for Hybrid Maize at 5893 on-farm experiments in China ranged from 150–210 kg ha −1, which was slightly lower (14–38 kg ha −1) than that in our study. Ziadi et al. [32] suggested that optimum N fertilizer application for maize over three years (2000–2002) near Montreal (Canada) was 181 kg N ha−1 in the clay, which was similar to our study. The variations in the optimum N fertilizer rates reflected the environmental conditions and site-specific differences, including temperature, irrigation, cropping practice, and so on [33].

3.5. Spatial Distribution of the Optimum Nitrogen Fertilizer Recommendation Rates and Corresponding Theoretical Yields

To better evaluated optimum N fertilizer recommendation rate in different regions, we have divided Liaoning province into four regions, such as western Liaoning (WL), South and central Liaoning province (SCL), Eastern Liaoning (EL) and Northern Liaoning province (NL) (Figure 5). The regression coefficients (a, b, and c) of the quadratic model, and optimum nitrogen fertilizer recommendation rate and corresponding economic theoretical yield in different regions were shown in Table 3.
8 of the experimental sites are distributed in western Liaoning province (WL) (Figure 4). For WL region, the average regression coefficients of a, b, and c in the quadratic model were −0.055, 20.12, and 6890 kg ha −1, respectively (Table 3). On average, the quadratic model of yield response to applied N rate was y = −0.055N2 + 20.12N + 6890. The average optimum N fertilizer recommendation rate was 184.2 kg ha −1, ranged from 145.6 to 246.1 kg ha −1, and the average of the predicted optimum yield was 8785.3 kg ha −1 (Table 3).
Furthermore, 9 of the experimental sites are in central and southern Liaoning province (SCL) (Figure 4). For SCL, the average regression coefficients of a, b, and c in the quadratic model were −0.054, 19.06, and 8914 kg ha −1, respectively (Table 3). On average, the quadratic model of yield response to applied N rate was y = −0.054N2 + 19.06N + 8914. Therefore, the average optimum N fertilizer recommendation rate was 177.2 kg ha −1, with a range from 136 to 211.7 kg ha −1, and the average of the predicted optimum yield was 10630.3 kg ha −1 (Table 3).
6 of the experimental sites are distributed in eastern Liaoning province (EL) (Figure 4). For EL, the average regression coefficients of a, b, and c in the quadratic model were −0.052, 16.50, and 8015 kg ha −1, respectively (Table 3). On average, the quadratic model of yield response to applied N rate was y = −0.052N2 + 16.50N + 8015. Therefore, the average optimum N fertilizer recommendation rate was 163.5 kg ha −1, ranged from 139.8 to 169.2 kg ha −1, and the average of the predicted optimum yield was 9347 kg ha −1 (Table 3).
8 of the experimental sites are distributed in northern Liaoning province (NL) (Figure 4). For EL, the average regression coefficients of a, b, and c in the quadratic model were −0.065, 24.83, and 7549 kg ha −1, respectively (Table 3). On average, the quadratic model of yield response to applied N rate was y = −0.065N2 + 24.83N + 7549. The average optimum N fertilizer recommendation rate was 192.5 kg ha −1, with a range of 175.1–208.2 kg ha −1, and the average of the predicted optimum yield was 9942.4 kg ha −1 (Table 3).
By comparison, we found that the ranking of corresponding theoretical yield was WL < NL < EL < SCL. The results indicated that some of the experiment sites in central and southern Liaoning province need to be supplemented with appropriate nitrogen fertilizer application rates to benefit the normal growth of crops and increased production.

4. Conclusions

A large number of maize databases from 31 field experiments were collected to analyze the effects of nitrogen (N) application rates on yield, and to evaluate the spatial distribution of optimum N recommendation rate for maize. Compared with -N treatment, grain yields were shown to be significantly higher in N90, N180, and N270 treatment. The mean yields of the -N, N90, N180, and N270 treatments were 7932.7, 8998.9, 9885.8, and 9150.3 kg ha −1, respectively. The ranking of grain yields in N fertilizer treatment was: N180 > N270 > N90 in all the regions. The average quadratic model of nitrogen fertilizer in Liaoning Province Y = 7859.8 + 20.04N−0.056N2. The average optimum N fertilizer recommendation rate was 180.4 kg/ha, ranging from 136 to 248.1 kg/ha. For western (WL), central and southern (SCL), eastern (EL), and northern (NL) Liaoning province, the quadratic model of grain yield to applied N rate was y = −0.055N2 + 20.12N + 6890, y = −0.054N2 + 19.06N + 8914, y = −0.052N2 + 16.50N + 8015, and y = −0.065N2 + 24.83N + 754, respectively. Therefore, the average optimum N fertilizer recommendation rates in WL, SCL, EL, and NL were 184.2, 177.2, 163.5, and 192.5 kg ha −1. To conclude, this study provided a useful tool for other countries to explore an optimal N management practice for increase fertilizer efficiency and productivity, and reduce environmental damage.

Author Contributions

Conceptualization, W.J. and X.L.; methodology, X.L., X.W.; formal analysis, Y.X. and Z.C.; investigation, X.L. and Z.C.; data curation, W.J. and X.L.; writing—original draft preparation, W.J.; writing—review and editing, X.L.; supervision, Y.Y. and Z.C.; project administration, X.W. and X.L. All authors have read and agreed to the published version of the manuscript.

Funding

This research was funded by “Shaanxi Engineering and Technological Research Center for Conversation and Utilization of Regional Biological Resource, grant number sxgczx-2019-08”, and “the National Key Research and Development Program of China, grant number 2016YFD0200105”.

Conflicts of Interest

The authors declare no conflict of interest.

References

  1. Foley, J.A.; Navin, R.; Brauman, K.A.; Cassidy, E.S.; Gerber, J.S.; Matt, J.; Mueller, N.D.; Christine, O.C.; Ray, D.K.; West, P.C. Solutions for a cultivated planet. Nature 2011, 478, 337–342. [Google Scholar] [CrossRef] [PubMed] [Green Version]
  2. Lu, C.; Lan, F. Winter wheat yield potentials and yield gaps in the North China Plain. Field Crop Res. 2013, 143, 98–105. [Google Scholar] [CrossRef] [Green Version]
  3. Guilpart, N.; Grassini, P.; Sadras, V.O.; Timsina, J.; Cassman, K.G. Estimating yield gaps at the cropping system level. Field Crop Res. 2017, 206, 21–32. [Google Scholar] [CrossRef] [PubMed]
  4. Tilman, D.; Cassman, K.G.; Matson, P.A.; Naylor, R.; Polasky, S. Agricultural sustainability and intensive production practices. Nature 2002, 418, 671–677. [Google Scholar] [CrossRef] [PubMed]
  5. Tester, M.; Langridge, P. Breeding technologies to increase crop production in a changing world. Science 2010, 327, 818–822. [Google Scholar] [CrossRef]
  6. Godfray, H.C.; Beddington, J.R.; Crute, I.R.; Haddad, L.; Lawrence, D.; Muir, J.F.; Pretty, J.; Robinson, S.; Thomas, S.M.; Toulmin, C. Food security: The challenge of feeding 9 billion people. Science 2010, 327, 812. [Google Scholar] [CrossRef] [Green Version]
  7. Qi, J.Y.; Yang, S.T.; Xue, J.F.; Liu, C.X.; Du, T.Q.; Hao, J.P.; Cui, F.Z. Response of carbon footprint of spring maize production to cultivation patterns in the Loess Plateau, China. J. Clean. Prod. 2018, 187, 525–536. [Google Scholar] [CrossRef]
  8. Ning, T.Y.; Zheng, Y.H.; Han, H.F.; Jiang, G.M.; Li, Z.J. Nitrogen uptake, biomass yield and quality of intercropped spring- and summer-sown maize at different nitrogen levels in the North China Plain. Biomass Bioenergy 2012, 47, 91–98. [Google Scholar] [CrossRef]
  9. Pordesimo, L.O.; Hames, B.R.; Sokhansanj, S.; Edens, W.C. Variation in corn stover composition and energy content with crop maturity. Biomass Bioenergy 2005, 28, 336–374. [Google Scholar] [CrossRef]
  10. Wang, X.; Li, Z.; Xing, Y. Effects of mulching and nitrogen on soil temperature, water content, nitrate-N content and maize yield in the Loess Plateau of China. Agric. Water Manag. 2015, 161, 53–64. [Google Scholar]
  11. Yang, Q.L.; Liu, P.; Dong, S.T.; Zhang, J.W.; Zhao, B. Effects of fertilizer type and rate on summer maize grain yield and ammonia volatilization loss in northern China. J. Soil Sediments 2019, 19, 2200–2211. [Google Scholar] [CrossRef]
  12. Pan, J.; Zhang, L.; He, X.; Chen, X.; Cui, Z. Long-term optimization of crop yield while concurrently improving soil quality. Land Degrad. Dev. 2019, 30, 897–909. [Google Scholar] [CrossRef]
  13. Zhao, D.; Reddy, K.R.; Kakani, V.; Read, J.; Carter, G. Corn (Zea mays L.) growth, leaf pigment concentration, photosynthesis and leaf hyperspectral reflectance properties as affected by nitrogen supply. Plant Soil 2003, 257, 205–218. [Google Scholar] [CrossRef]
  14. Clark, M.S.; Horwath, W.R.; Shennan, C.; Scow, K.M.; Lantni, W.T.; Ferris, H. Nitrogen, weeds and water as yield-limiting factors in conventional, low-input, and organic tomato systems. Agric. Ecosyst. Environ. 1999, 73, 257–270. [Google Scholar] [CrossRef]
  15. Xu, X.; He, P.; Pampolino, M.F.; Johnston, A.M.; Qiu, S.; Zhao, S.; Chuan, L.; Zhou, W. Fertilizer recommendation for maize in China based on yield response and agronomic efficiency. Field Crop Res. 2014, 157, 27–34. [Google Scholar] [CrossRef]
  16. Wang, X.; Fan, J.; Xing, Y.; Xu, G.; Wang, H.; Deng, J.; Wang, Y.; Zhang, F.; Li, P.; Li, Z. The Effects of Mulch and Nitrogen Fertilizer on the Soil Environment of Crop Plants. In Advances in Agronomy; Sparks, D.L., Ed.; Academic Press: Cambridge, MA, USA, 2019. [Google Scholar]
  17. Guo, J.; Wang, Y.; Fan, T.; Chen, X.; Cui, Z. Designing corn management strategies for high yield and high nitrogen use efficiency. Agron. J. 2016, 108, 922–929. [Google Scholar] [CrossRef]
  18. Chen, X.P.; Cui, Z.L.; Vitousek, P.M.; Cassman, K.G.; Matson, P.A.; Bai, J.S.; Meng, Q.F.; Hou, P.; Yue, S.C.; Römheld, V. Integrated soil–crop system management for food security. Proc. Natl. Acad. Sci. USA 2011, 108, 6399–6404. [Google Scholar] [CrossRef] [Green Version]
  19. Sebilo, M.; Mayer, B.; Nicolardot, B.; Pinay, G.; Mariotti, A. Long-term fate of nitrate fertilizer in agricultural soils. Proc. Natl. Acad. Sci. USA 2013, 110, 18185–18189. [Google Scholar] [CrossRef] [Green Version]
  20. Li, Z.; Han, X.; Cheng, F.; Liu, X.; Yang, J.; Wang, S. Study on fertilizer recommendation for corn in the south central of Liaoning province. Liaoning Agric. Sci. 2010, 4, 6–11. (In Chinese) [Google Scholar]
  21. Liu, M.Q.; Yu, Z.R.; Liu, Y.H.; Konijn, N.T. Fertilizer requirements for wheat and maize in China: The QUEFTS approach. Nutr. Cycl. Agroecosyst. 2006, 74, 245–258. [Google Scholar] [CrossRef] [Green Version]
  22. Jiang, W.T.; Liu, X.H.; Qi, W.; Xu, X.N.; Zhu, Y.C. Using QUEFTS model for estimating nutrient requirements of maize in the Northeast China. Plant Soil Environ. 2017, 63, 498–504. [Google Scholar]
  23. Doberman, A.; Pcs, C.; Cassman, K.G. Fertilizer inputs, nutrient balance, and soil nutrient-supplying power in intensive, irrigated rice systems. I. Potassium uptake and K balance. Nutr. Cycl. Agroecosyst. 1996, 46, 1–10. [Google Scholar] [CrossRef]
  24. Jiang, W.T.; Liu, X.H.; Wang, Y.; Zhang, Y.; Qi, W. Responses to potassium application and economic optimum K rate of maize under different soil indigenous K supply. Sustainability 2018, 10, 2267. [Google Scholar] [CrossRef] [Green Version]
  25. Chuan, L.M.; Zheng, H.G.; Sun, S.F.; Wang, A.L.; Liu, J.P.; Zhao, T.K.; Zhao, J.J. A Sustainable Way of Fertilizer Recommendation Based on Yield Response and Agronomic Efficiency for Chinese Cabbage. Sustainability 2019, 11, 4368. [Google Scholar] [CrossRef] [Green Version]
  26. Ladha, J.K.; Pathak, H.; Krupnik, T.J.; Six, J.; van Kessel, C. Efficiency of fertilizer nitrogen in cereal production: Retrospects and prospects. Adv. Agron. 2005, 87, 85–156. [Google Scholar]
  27. Zhao, P.F.; Cao, G.X.; Zhao, Y.; Zhang, H.Y.; Chen, X.P.; Li, X.L.; Cui, Z.L. Training and Organization Programs Increases Maize Yield and Nitrogen-Use Efficiency in Smallholder Agriculture in China. Agron. J. 2016, 108, 1944–1950. [Google Scholar] [CrossRef]
  28. Setiyono, T.D.; Walters, D.T.; Cassman, K.G.; Witt, C.; Dobermann, A. Estimating maize nutrient uptake requirements. Field Crops Res. 2010, 118, 158–168. [Google Scholar] [CrossRef]
  29. Chuan, L.; Ping, H.; Pampolino, M.F.; Johnston, A.M.; Jin, J.; Xu, X.; Zhao, S.C.; Qiu, S.J.; Zhou, W. Establishing a scientific basis for fertilizer recommendations for wheat in China: Yield response and agronomic efficiency. Field Crop Res. 2013, 140, 1–8. [Google Scholar] [CrossRef]
  30. Dobermann, A. Nutrient use efficiency: Measurement and management. In Fertilizer Best Management Practice: General Principles, Strategy for their Adoption and Voluntary Initiatives vs. Regulations. In Proceedings of the IFA International Workshop on Fertilizer Best Management Practices, Brussels, Belgium, 7–9 March 2007; Krauss, A., Isherwood, K., Heffer, P., Eds.; International Fertilizer Industry Association: Paris, France, 2007; pp. 1–28. [Google Scholar]
  31. Xu, X.; He, P.; Zhang, J.; Pampolino, M.F.; Johnston, A.M.; Zhou, W. Spatial variation of attainable yield and fertilizer requirements for maize at the regional scale in China. Field Crop Res. 2017, 203, 8–15. [Google Scholar] [CrossRef]
  32. Ziadi, N.; Cambouris, A.N.; Nyiraneza, J.; Nolin, M.C. Across a landscape, soil texture controls the optimum rate of N fertilizer for maize production. Field Crops Res. 2013, 148, 78–85. [Google Scholar] [CrossRef]
  33. Wang, X.; Fan, J.; Xing, Y.; Xu, G.; Wang, H.; Deng, J.; Wang, Y.; Zhang, F.; Li, P.; Li, Z. The Effects of Mulch and Nitrogen Fertilizer on the Soil Environment of Crop Plants. Adv. Agron. 2019, 153, 121–173. [Google Scholar]
Figure 1. The distribution map of experimental plots for maize in Northeast China.
Sustainability 12 02607 g001
Figure 2. Description of yield factors across the database. Upper section: (a) Distribution of grain yield in -N, N90, N180, and N270 treatment for 31 experimental sites. White dots represent the median value. The black rectangle is the range from the 25% quartile to the 75% quartile. The lower and upper edge of the rectangle indicate 25% quartile (Q25%) and 75% quartile (Q75%) of grain yield. The significance of differences assessment based on black rectangle. (b) Relative frequency (%) of the number of yield increasing rate.
Sustainability 12 02607 g002
Figure 3. (a) Comparison of agronomy efficiency for nitrogen (kg kg −1) of various treatments during a -year period (2009–2013) and (b) Relative Frequency of agronomy efficiency for N in (N90, N180, and N270) treatment. Blank Solid and gray dashed lines indicate median and mean values, respectively. The upper and lower of box edges indicated the 25th and 75th quartiles.
Sustainability 12 02607 g003
Figure 4. The curves simulated by the fertilizer effect function (quadratic equation) model to fit the relationship between yield and nitrogen application rates for maize across 31 sites of Liaoning province.
Sustainability 12 02607 g004
Figure 5. Spatial distribution of the 31 experimental sites for maize in Liaoning province of China.
Sustainability 12 02607 g005
Table 1. Statistics of the regression coefficients for the quadratic model of nitrogen (N) fertilization effect on maize in Liaoning province.
Statistics(Y = aN2 + bN + c)
Coefficients for the Quadratic Model of Grain Yield to N Fertilizer Application
abc
Average–0.05620.047859.8
SD0.0176.711159.0
Minimum−0.0969.055254.5
25% quartile−0.06314.036865.0
Mean−0.05719.157935.0
75% quartile−0.04424.638833.0
Maximum−0.02635.2810069.1
Table 2. The optimum recommended nitrogen fertilizer rate (kg ha −1) on maize in Liaoning province based on quadratic model analysis.
StatisticsOptimum
N Fertilizer Recommendation Rate
(kg ha −1)
The Predicted Optimum Yield
(kg ha −1)
Average180.4 9699.1
Mean183.8 9892.6
SD24.1 1041.6
Min136.0 7908.7
25% quantile165.0 8850.0
75% quantile195.3 10468.5
Max248.1 12153.9
Table 3. The regression coefficients for the quadratic model of yield response to N fertilizer application and optimum N fertilizer recommendation rates under different regions in Liaoning province.
RegionstatisticsY = aN2 + bN + c
Coefficients for the Quadratic
Model of Grain Yield to N
Fertilizer Application
Optimum
N Fertilizer Recommendation Rates (kg ha −1)
The Predicted Optimum Yield
(kg ha −1)
a b c (kg ha −1)
WL
(Western Liaoning province)
Average−0.055 20.12 6890 184.2 8785.3
Min−0.071 12.07 5255 145.6 7908.7
25%Qa−0.063 14.03 6493 165.0 8242.3
75%Qa−0.047 24.63 6990 194.8 9276.0
Max−0.032 29.78 8909 248.1 10326.2
SCL
(Southern and central Liaoning province)
Average−0.054 19.06 8914 177.2 10630.3
Min−0.096 9.05 7242 136.0 9138.5
25%Q−0.062 12.25 8351 159.7 10331.3
75%Q−0.034 24.32 9420 196.1 11104.3
Max−0.026 35.28 10069 211.7 12153.9
EL
(Eastern Liaoning province)
Average−0.052 16.50 8015 163.5 9347.0
Min−0.084 12.17 7590 139.8 8899.9
25%Qa−0.075 12.20 7657 143.1 8957.1
75%Qa−0.034 23.22 8492 188.5 9750.5
Max−0.031 25.68 8678 196.2 9821.4
NL
(Northern Liaoning
Province)
Average−0.06524.837549192.59942.4
Min−0.08517.437082175.19328.0
25%Qa−0.07820.517154182.79610.3
75%Qa−0.05329.308092201.810297.0
Max−0.04533.218206208.210468.5

