1. Introduction
Energy is a source of life and development in any country. At the same time, energy consumption leads to environmental and health damage, as well as depletion of the economy if the consumption process is inefficient. It is therefore essential to ensure adequate energy and efficient consumption. The Kingdom of Saudi Arabia (KSA) is the world’s largest oil producer, contributing 13.2% of the total global production, and is the largest oil exporter, totaling 18.7% of the global exports [
1]. In 2017, in the KSA, the total primary energy supply was 211.32 Mtoe, while the total final consumption was 140.71 Mtoe; this means that the energy system efficiency was about 67% in this year.
Table 1 shows the distribution of the final energy and the share of energy consumption in the KSA in 2017. From the table, it can be observed that 10% of the final energy was consumed in the residential sector. It should be noted here that the fuel consumed in the industry sector was not all burned, and part of it (about 20% of the total) was used in the chemical industry. Furthermore, in 2017, the fuel consumption for electricity production was divided into natural gas (53.7%) and oil (46.3%) [
2]. In 2016, the KSA issued the “Vision 2030 of Kingdom of Saudi Arabia,” which launched both an outline for national energy policy and a set of objectives for energy efficiency, for improvement of renewable energy sources, and waste-to-energy opportunities [
2]. Another important factor to consider is that energy use generates around 532.2 Mton of CO
2 per year [
3], which is set to increase. Indeed, an increase from 6.9 to 9.6 MWh in electrical energy consumption per capita in the KSA was observed from 2007 to 2017, respectively, with an increase of 39.1% for the decade. Such growth needs an active expansion of infrastructure.
Table 2 shows the total electrical energy sold in 2017 in the KSA. It is clear from
Table 2 that the residential sector consumed 48.1%, while the other sectors consumed the remaining 51.8% of the total electrical energy produced [
2]. The electricity used to operate all air conditioning systems, appliances, lighting, and warm water represents 87.30% of the total energy consumed. The remaining 12.70% was obtained from liquefied petroleum gas (LPG), which was used only for cooking [
4].
Table 3 illustrates that residential energy consumption mainly relies on electricity. In 2014, the electricity consumption reached a maximum value of 88.5% of the total energy used in the residential sector.
The residential sector has many weaknesses and deficits, such as unfit use of electrical appliances, poor insulation of homes, and citizens being unaware of energy efficiency. This work will help in creating a way to remove inefficient methods/equipment from the residential sector as, at present, in the case of the KSA, there are a limited number of such studies for this sector [
5]. Hence, in order to efficiently implement methods/techniques to achieve energy utilization, it is imperative to carry out economic and environmental analysis, along with energy and exergy analysis. With the fast development and demand for housing in the KSA, it becomes necessary to study not just the energy consumption, but also the exergy analysis so as to improve and sustain energy efficiency in the residential sector. The KSA will increase by about two million homes by 2020, as reported by Alrashed and Asif [
6]; in the Qassim region alone, the number of occupied dwellings was 272,078 in 2017 [
4].
As mentioned above, electrical energy in buildings is primarily consumed for air conditioning, heating water, lighting, and running appliances in the KSA. As per the Saudi Energy Efficiency Center’s (SEEC) study, almost 70% of buildings require proper thermal insulation, while an average of 64% of buildings are estimated as uninsulated by Esmaeil et al. [
7]. We adapted the same change of overall heat transfer coefficient from U
o = 1.8 W/m
2 K (the previously established coefficient) to U
n = 0.35 W/m
2 K (a new coefficient). This study aims to encourage energy policy-makers to realize energy-efficient appliances, as well as to develop an efficient residential sector that has less of an impact on the developmental cost for the nation and the environment. The objectives of this work are as follows:
- ▪
Study the energy and exergy analysis of various electrical appliances of households;
- ▪
Study the exergy analysis of the residential sector in the Qassim region;
- ▪
Assess the economic and environmental impacts of energy consumption in the residential sector in the Qassim region.
2. Literature Review
The basis of energy analysis to study and evaluate the performance and efficiency of a system or a process relies on the first law of thermodynamics. In contrast, exergy analysis is built on the second law of thermodynamics, and it measures the types of losses in the processes and systems. Exergy can be defined as “Exergy (also called availability), which is the maximum useful work that could be obtained from the system at a given state in a specified environment” [
8].
As exergy analysis is used for determining energy losses in machines or systems, this method of analysis could help to identify various losses, as well as the types of losses, in the residential sector. The results of such analysis could help to improve inefficiencies and reduce losses. Little work has been reported with reference to the KSA in which exergy, economic, and environmental assessments have been carried out for the residential sector. According to the authors’ knowledge, no work has focused on exergy analysis specifically of the Qassim region. Thus, the present study could help to reduce the unnecessary usage of residential energy and to raise the awareness of the public about energy consumptions within this region.
The first major energy and exergy analysis for the United States was performed by Reistad [
9]. In his study, he examined the consumption sector for oil refining, electricity generation, and distribution separately. Furthermore, the end-use of energy was split into three sectors—residential/commercial, industrial, and transportation. Dincer [
10] presented the role of exergy in energy policy making; he reported that it is apparent that no single precise production exergy value can be established for each type of fuel. Despite these problems, values for production exergy are needed to carry out an appropriate overall system exergy analysis to enhance the understanding of environmental, economic, and energy issues. Hepbasli [
11] reviewed low exergy heating and cooling systems for buildings and societies and found that the exergy efficiency values range from 0.40% to 25.3%. Dincer et al. [
12] presented an analysis of sectoral energy and exergy utilization of the KSA between 1990 and 2001. Based on their analysis, it can be concluded that the residential sector is more efficient with respect to energy, while the industrial sector is most exergy efficient. Al-Ghandoor [
13] also analyzed the energy and exergy utilization, but for Jordan’s economy in the main sectors. In his calculation for the main sectors, namely, residential, industrial, and transportation, he showed that the energy efficiencies are 68.3%, 78.3%, and 22.7%, respectively, and the corresponding exergy efficiencies are 9.5%, 37.9%, and 22.7%. The weighted total energy and exergy efficiencies in the residential sector for various countries and periods are presented in
Table 4.
Badmus and Osunleke [
15] studied the overall energy and exergy analyses for the whole Nigerian residential sector in 1991–2005. They found that the overall utilization energy efficiency was 19.89%, and the exergy efficiency was 4.38%. Abam et al. [
23] analyzed the end-use energy and the total energy and exergy efficiencies of the residential buildings of Nigeria. The main conclusions were that the mean energy and exergy values for electricity use were 42.76% and 13.77%, respectively, and for fossil fuel, and the mean energy and exergy efficiencies were 62.63% and 13.46%, respectively, in the period of 2006–2011. Armel et al. [
25] determined the total energy and exergy efficiencies of the residential sector in Cameroon from 2001 to 2010 using a survey of 250 households. They determined that the energy and exergy efficiencies were 58.74% and 22.63%, respectively. Saidur et al. [
19] analyzed the energy and exergy utilization in the residential sector in Malaysia from 1997 to 2004. The overall energy and exergy efficiencies for all devices used were 70% and 28%, respectively. Kondo [
20] studied the energy and exergy efficiencies in Japan’s residential and commercial sectors from 1990 to 2006. He found that the Japanese residential and commercial sectors had great potential for energy savings. Liu et al. [
21] reported that the exergy efficiency was 11–12.2% for the urban residential sector in China during the period of 2002–2011, while the energy efficiency was 62.8–70.2%. The exergy efficiency of air conditioning was deepest by 6%, and thus, the authors emphasized that energy-saving strategies should pay much more attention to the enhancement of exergy efficiencies. Al-Ghandoor et al. [
22] presented energy and exergy analyses of the Jordanian urban residential sector by considering the streams of energy and exergy in Jordanian homes. They used a survey involving 200 households, and energy consumption data were collected. Their results indicate that the exergy analysis was less efficient than the energy analysis.
Utlu and Hepbasli [
17] analyzed the energy and exergy efficiencies of the Turkish residential–commercial sector (TRCS), and in another work [
18], they presented a study to estimate the energy and exergy efficiencies for the whole TRCS. They reported that the energy and exergy efficiency values for the TRCS are 55.58% and 9.33%, respectively. Utlu and Hepbasli [
26] also conducted an extensive study to found the effect of energy and exergy utilization efficiencies in the TRCS in the year 2003. They found that the energy efficiency values for this sector were between 51.95–80.82% and the exergy efficiency values were 8.11–11.92%. Jansen et al. [
27] proposed various concepts to improve the exergy efficiency of multi-family buildings from the 1960s in Bilbao, Spain, for different cases. They reported that the overall energy efficiency values of the reference cases and new cases are 50% and 70%, while the exergy efficiency values are 10% and 16%, respectively.
The reference state must be determined for exergy analysis, which is usually the ambient conditions of the processes or the thermodynamics systems. It can be selected either as a variable environment state or as a constant environment state (see
Table 5) In the first case (group I), as the state conditions change, with time or place, the outcomes are unique. Meanwhile, in the second case (group II), due to the constant environment, outcomes are not unique with respect to time or place. It is noted from
Table 5 that most studies adopted the constant conditions in the processes of exergy analyses in the housing sector, which is more realistic for comparison. Likewise, it should be noted that the constant reference state was also adopted in this study.
3. Methodology
After outlining the indicators considered in this work, a new and improved survey was developed based on the previous work of Esmaeil et al. [
7]. This new survey is separated into five parts:
- ▪
Part I collects universal data on homes;
- ▪
Part II gathers data on household appliances—there are requests about the number, power, and the time of use of each household appliance;
- ▪
Part III gathers data on air conditioners;
- ▪
Part IV includes a table to obtain the daily electrical energy consumption of the dwelling;
- ▪
Part V focuses on gas consumption.
The survey was carried out with the assistance of students from the engineering and architectural colleges at Qassim University. More than 150 students agreed to complete a questionnaire in their homes and the homes of their relatives. To certify the quality of the data in the survey, the students were given instructions to explain how to collect the required data appropriately. After completing the survey, a discussion was held with every student to confirm the accuracy of the collected data. The survey was conducted in 2017 in Arabic; an English translation is given in
Appendix A. The two most common types of houses in the Qassim area were considered—namely, villas and flats.
One hundred surveys for dwellings were obtained. In summary, all of the surveys provided complete answers for Parts I–III and V, but for part IV, only about 30 surveys were collected. Furthermore, with the permission of the occupants, monthly electricity consumption data for 54 houses were collected for the period from 2015 to 2018.
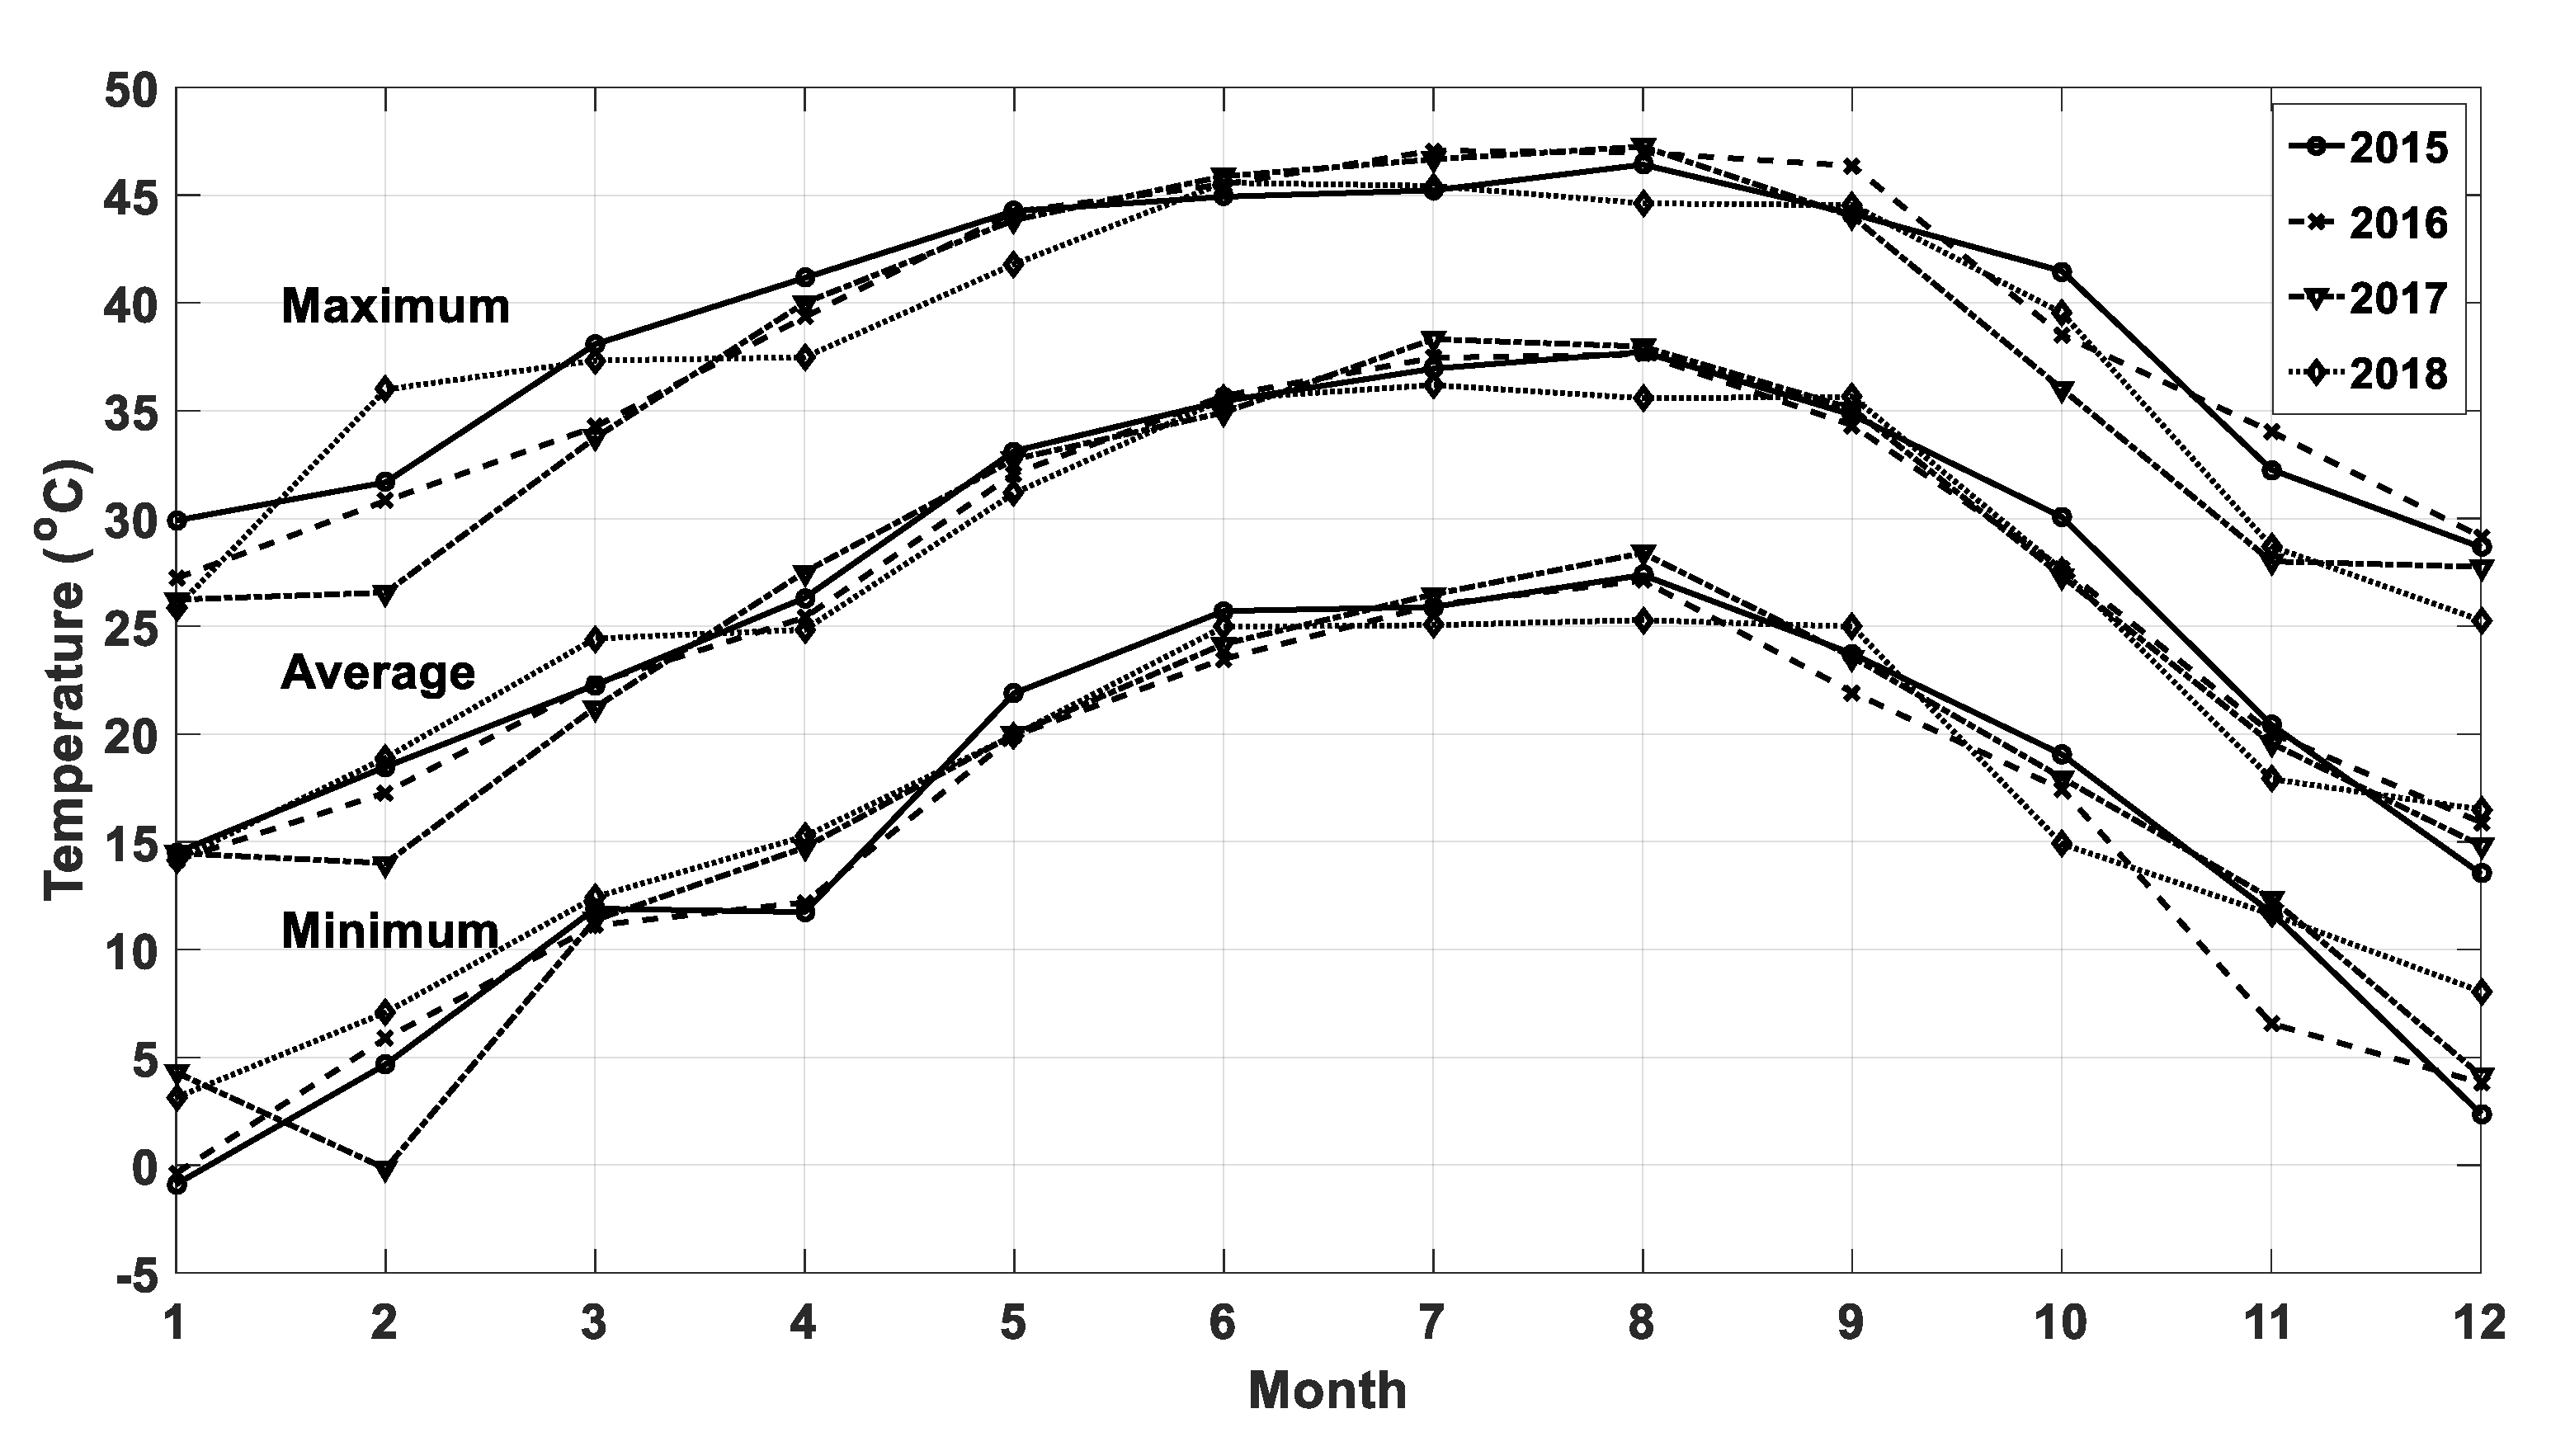
3.1. Meteorological Conditions
According to climate classification system by Köppen–Geiger, the KSA, which is located between the latitude lines 32° N and 17° N and between the longitude lines 56° E and 28° E, is categorized as a hot and arid climate area. Meanwhile, the Qassim region is situated at the center of the kingdom between the latitude lines of 25.5° N and 27.12° N and the longitude lines of 41.6° E and 44.06° E. As the climatic conditions of the region of interest play an important role in energy consumption, temperature variation data were collected from a climate monitoring station at Qassim university for the years 2015–2018, which were then analyzed.
Figure 1 shows the monthly maximum, average, and minimum temperatures in the Qassim region during 2015–2018.
3.2. Energy and Exergy Calculation
The data from the questionnaire were used to determine the monthly electrical and thermal energy consumption of the studied buildings in 2017, which was also compared with the average monthly electrical energy consumption based on electricity bills for 54 houses in the Qassim region during 2015–2018. The electrical energy consumption (
E) calculation of each appliance or lighting system and air conditioning unit was based on its rating power (
RP) and operating time (
OT), as per the following equation:
In this study, the efficiencies (i.e., energy,
η, and exergy,
ϕ) were calculated based on the following definitions from Dincer et al. [
5]:
Energy consumption can be segregated under the appliance categories, such as air conditioning and refrigeration units, lighting system, water heating, other electrical appliances, and cooking appliances; whereas air conditioning and refrigeration systems lie in the category in which the system’s energy efficiency is calculated based on the coefficient of performance. The energy efficiency of each appliance was obtained from the Saudi internal market. The exergy efficiency for appliances dependent on temperature was derived as
where
γG = 0.97 means the exergy grade for LPG, which is defined as the share of a gas’s chemical exergy
eG to the gas’s higher heating value
HG. Chemical exergy is
eG = 44,643 (kJ/kg), and the higher heating value is
HG = 46,024 (kJ/kg) for a reference environment temperature of 25 °C and a pressure of 101.325 kPa Liu et al. [
21].
The exergy efficiency of energy consumption is considered equivalent to its energy efficiency of devices independent of temperature, such as televisions, personal computers, vacuum machines, water pumps, exhaust blowers, etc.
In this study, to compute energy and exergy efficiencies for residential buildings, weighted efficiencies concerning the overall efficiency of the two energy sources were used. The weighting factor was calculated from the contributed share of each energy source to the total energy input. It must be noted that less than 1% of total energy consumption was from kerosene and other types of fuel [
4]. Equations (5) and (6) present the overall energy and exergy efficiencies of electrical energy, respectively:
where
ηe,i and
ϕe,i are the energy and exergy efficiencies of the i
th portion of electrical energy intake, respectively.
WFe,i is the share of electrical intake for the i
th portion of electrical energy use. The total energy and exergy efficiencies of the residential sector were calculated as
where
WFe and
WFG are the share of the total electrical energy intake and the thermal energy from LPG intake to the total energy consumption in 2017, respectively.
4. Results and Discussion
A similarity was observed in most of the results between the previous Esmaeil, et al. [
7] and current questionnaire results. There is some variation in the results, as shown in
Table 6. It is noted that the roof isolation percentage of the buildings under investigation increased from 31% to 43% in the present work, which indicates an increasing awareness of its importance.
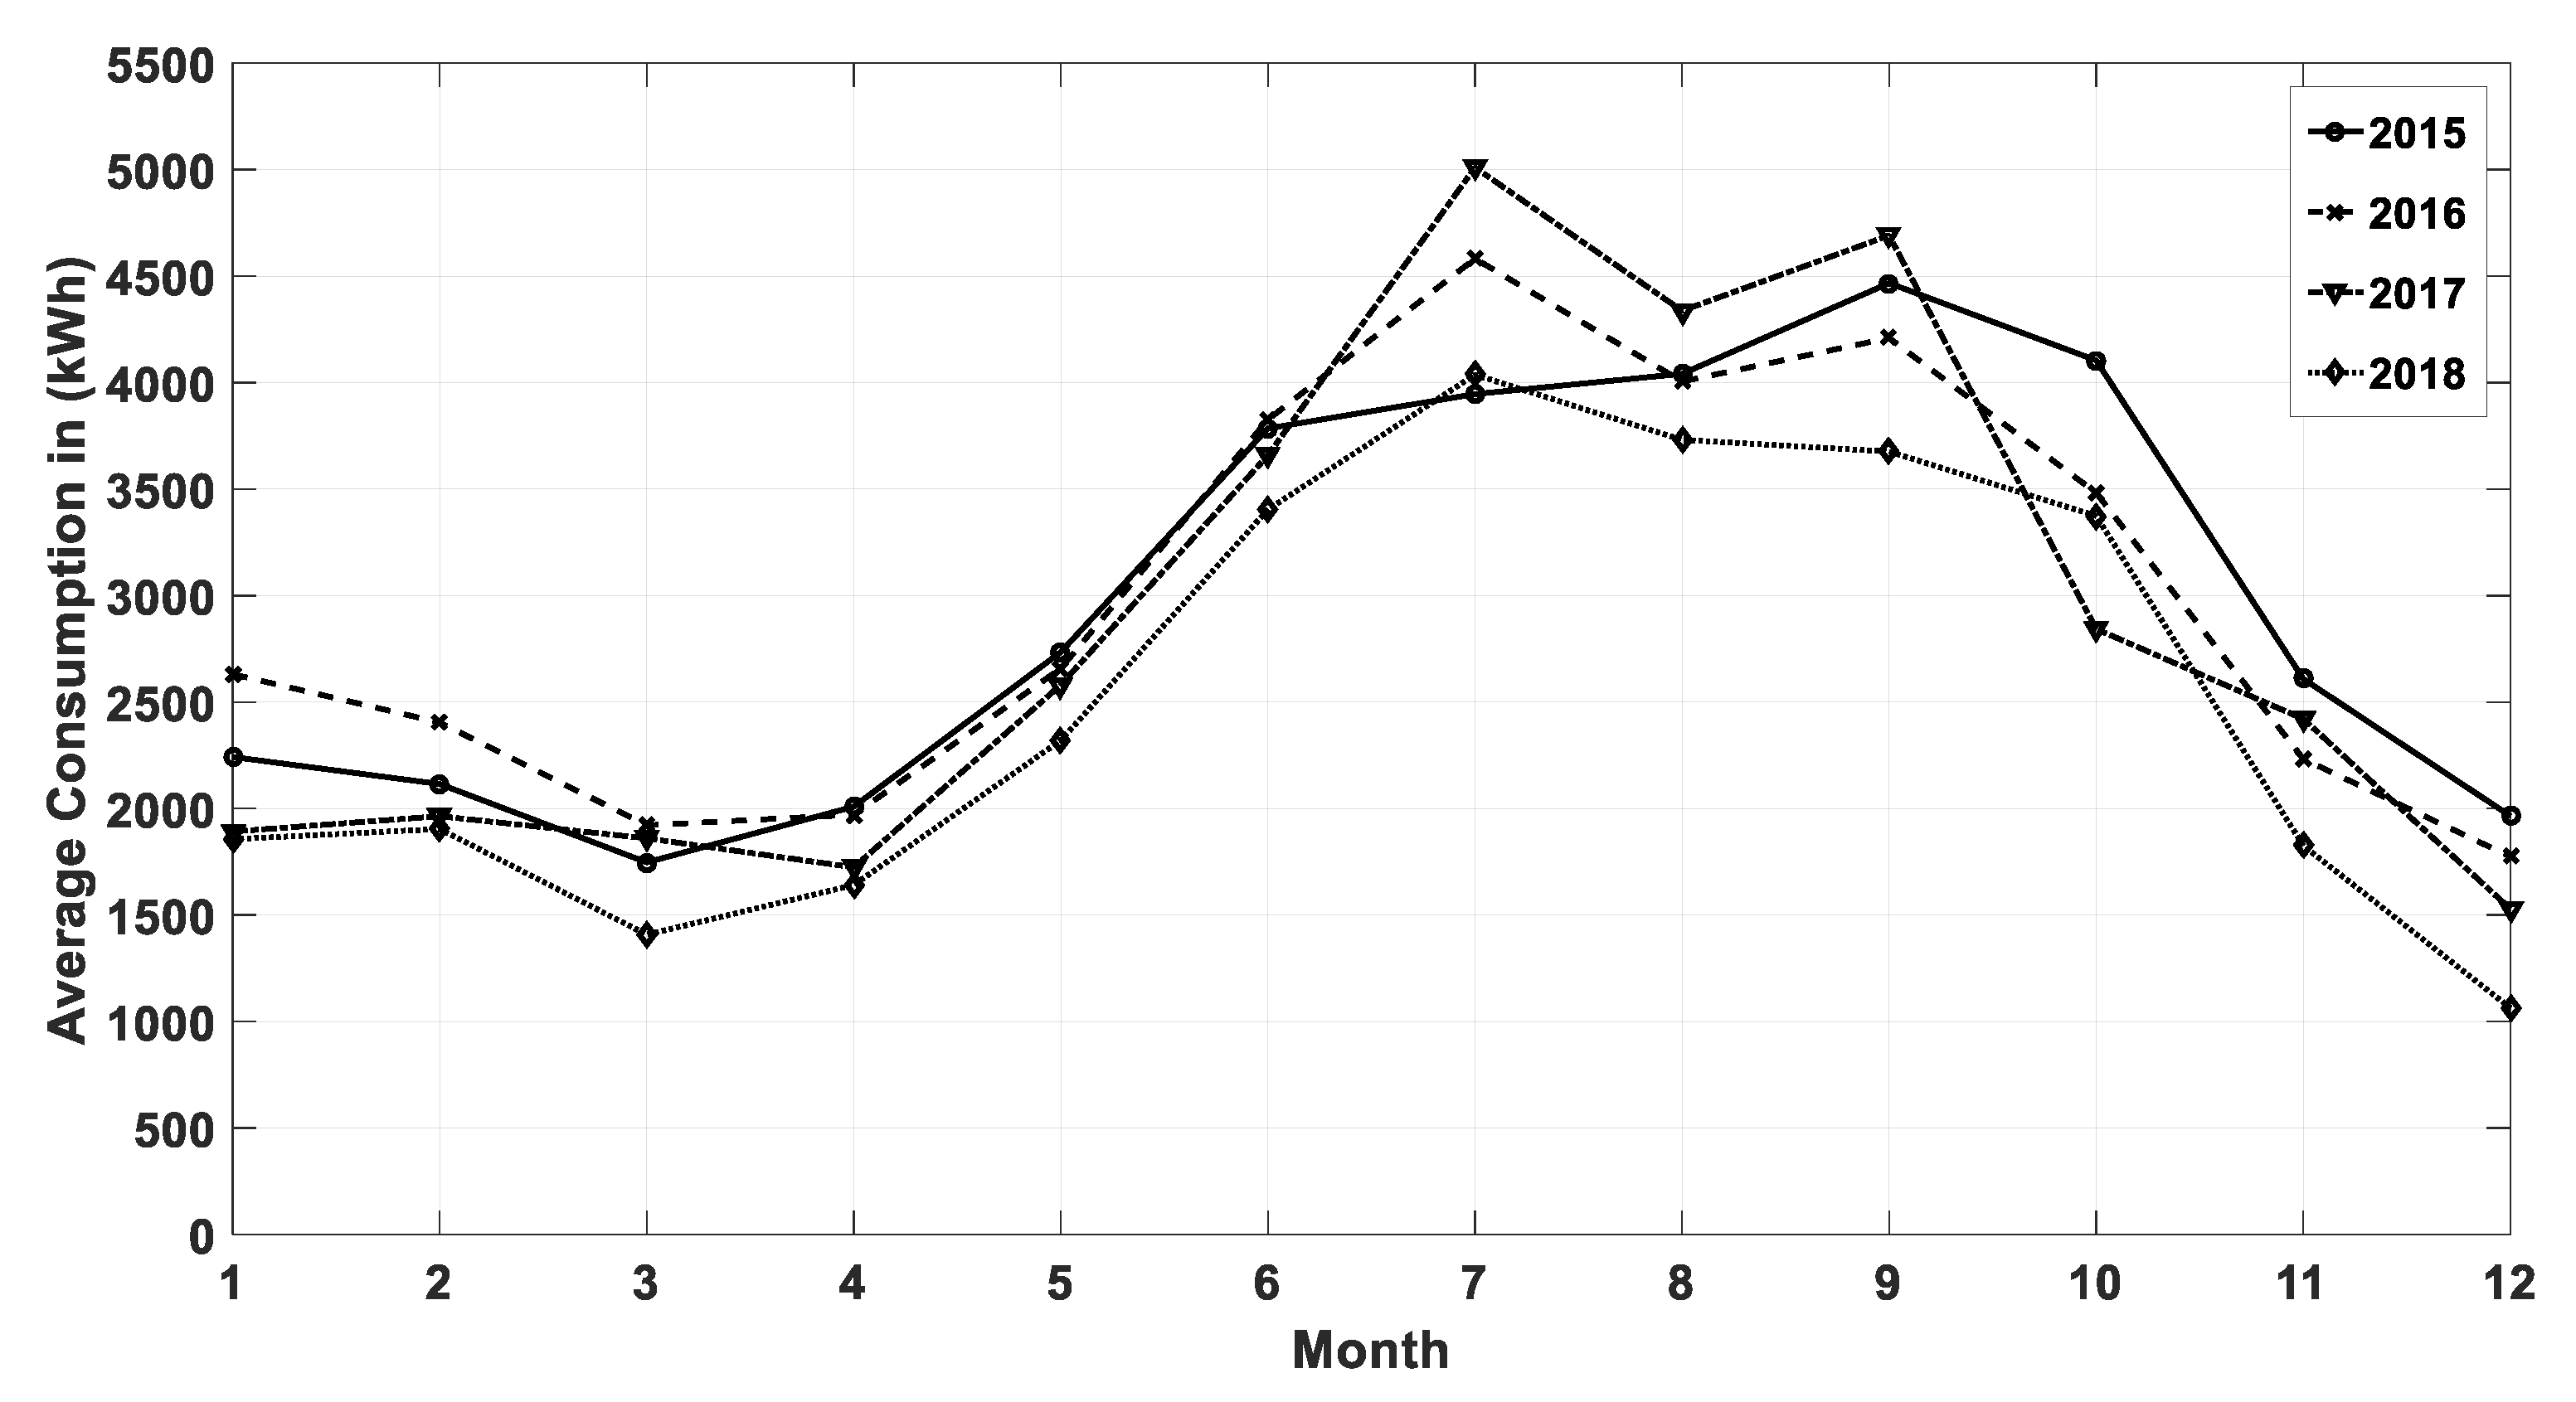
4.1. Energy Consumption
The average monthly electrical energy consumption for the study period based on the electricity bills of 54 houses in the Qassim region is plotted in
Figure 2. It is observed from this figure that
- ▪
Consumption in 2017 was higher than the other years (summer temperature is higher than in other years);
- ▪
The average monthly consumption was often between 1500 kWh and 4500 kWh;
- ▪
Consumption was greatest in 2015 in September;
- ▪
Electrical energy consumption in the summer months was more than double the consumption in most of the other months.
The analysis relied on the value of consumption, which was based on the average consumption resulting from the electricity bills in the year 2017, as it is an average value among the values resulting from the statistical study based on the questionnaire, which is 34,448 kWh.
Table 7. includes the ownership level, power rating, annual working times, annual electrical energy consumption, and percentage of electrical energy consumption for each item, which was produced from the questionnaire results. The average annual electrical energy consumption of 30,832 kWh was obtained as a result of the information from the questionnaire for 100 households in the Qassim region in 2017.
Table 8 shows the annual electrical energy consumption per item and unit area of the building. We note from
Table 8 that the biggest consumption value was for air conditioners, as the energy consumption was 3348.9 kWh/year, which is almost equal to the total consumption of all other electrical items used (3392.4 kWh/year). According to electrical energy consumption data, this consumption is relatively low compared to the values resulting from the bills obtained from the 54 dwellings (see
Table 9). This may be justified, as not all equipment was taken into account, and the operating time was not determined accurately in some homes. It should also be noted that the number of air conditioners shown in
Table 7 is the number of used air conditioners. The number of air conditioners installed and rarely used was not taken into account. It was observed that some houses have more than 20 air conditioners installed; it is also clear that the main consumer is air conditioners. It should be noted that houses are typically heated by air conditioners or electric heaters. This indicates that there is a need to focus on improving the efficiency of these devices and on improving the thermal insulation of the elements of building casing, as well as on trying to increase people’s awareness about the importance of more sustainable energy conservation in this area. It should be noted from the questionnaire that the average LPG that a Saudi house consumes per year for cooking is 300 kg, which is 3720 kWh/year.
4.2. Exergy Analysis
Energy efficiency, environmental temperature T
o, product temperature T
p, exergy efficiency, and share of used electrical energy for used appliances of different end uses were specified, as shown in
Table 10 the survey, lighting electrical consumption was approximately divided between Incandescent (40%), fluorescent (30%), and LED (30%). The typical energy and exergy efficiencies for an incandescent light is 5% and 18.5% respectively [
17], while for fluorescent light is 20% and 17.5–18.5% respectively [
19]; [
32], and for LED light is 27.3% and 21.8% respectively [
32]. Based on these values, the energy and exergy efficiencies for each type of lighting were determined, as shown in
Table 10. Combining the consumed energy with the energy and exergy efficiencies for each type of lighting, the rated energy and exergy efficiencies of lighting were 16.19% and 19.34%, respectively. For exergy analysis of the energy consumed by air conditioners, the reference temperature was taken as previously mentioned constant 304.7 K, based on the average temperature in 2017 in the Qassim region.
Based on Equation (5), the total efficiency of electrical energy consumption used in this study was 163.6% (T
o is constant), and we used the efficiency of LPG as 65%, although the energy efficiencies of gas-burning were determined as η
G = 65% by Al-Ghandoor et al. [
22]. Also, based on Equation (6), the total exergy efficiency of electrical energy consumption was 10.76%, and the exergy efficiency of LPG was obtained using Equation (4):
The total exergy efficiencies of gas burning for cooking were determined by Utlu and Hepbasli (2006) [
18] as ϕ
G = 17.2%. After calculating the electrical energy and LPG consumption per home for the Qassim region, it was found that the rate was as follows: 88.6% as electrical energy and 11.4% as thermal energy of used LPG. For the residential sector in the Qassim region, the overall weighted η
overall,Q and ϕ
overall,Q were calculated using Equations (7) and (8).
There is a big difference in energy efficiency in the Qassim region, regarding the KSA between the current study (145%) and a previous study (77.52%), which was conducted in 2004 by Dincer et al. [
5]. As for the exergy efficiency, there is an improvement in the current study by up to 12%.
As can be observed, the rate of energy consumption for air conditioning is high, so it is necessary to look for ways to reduce this load. In addition to insulating the construction envelopes, the use of high-efficiency devices would help to reduce the consumption for the building to become more sustainable.
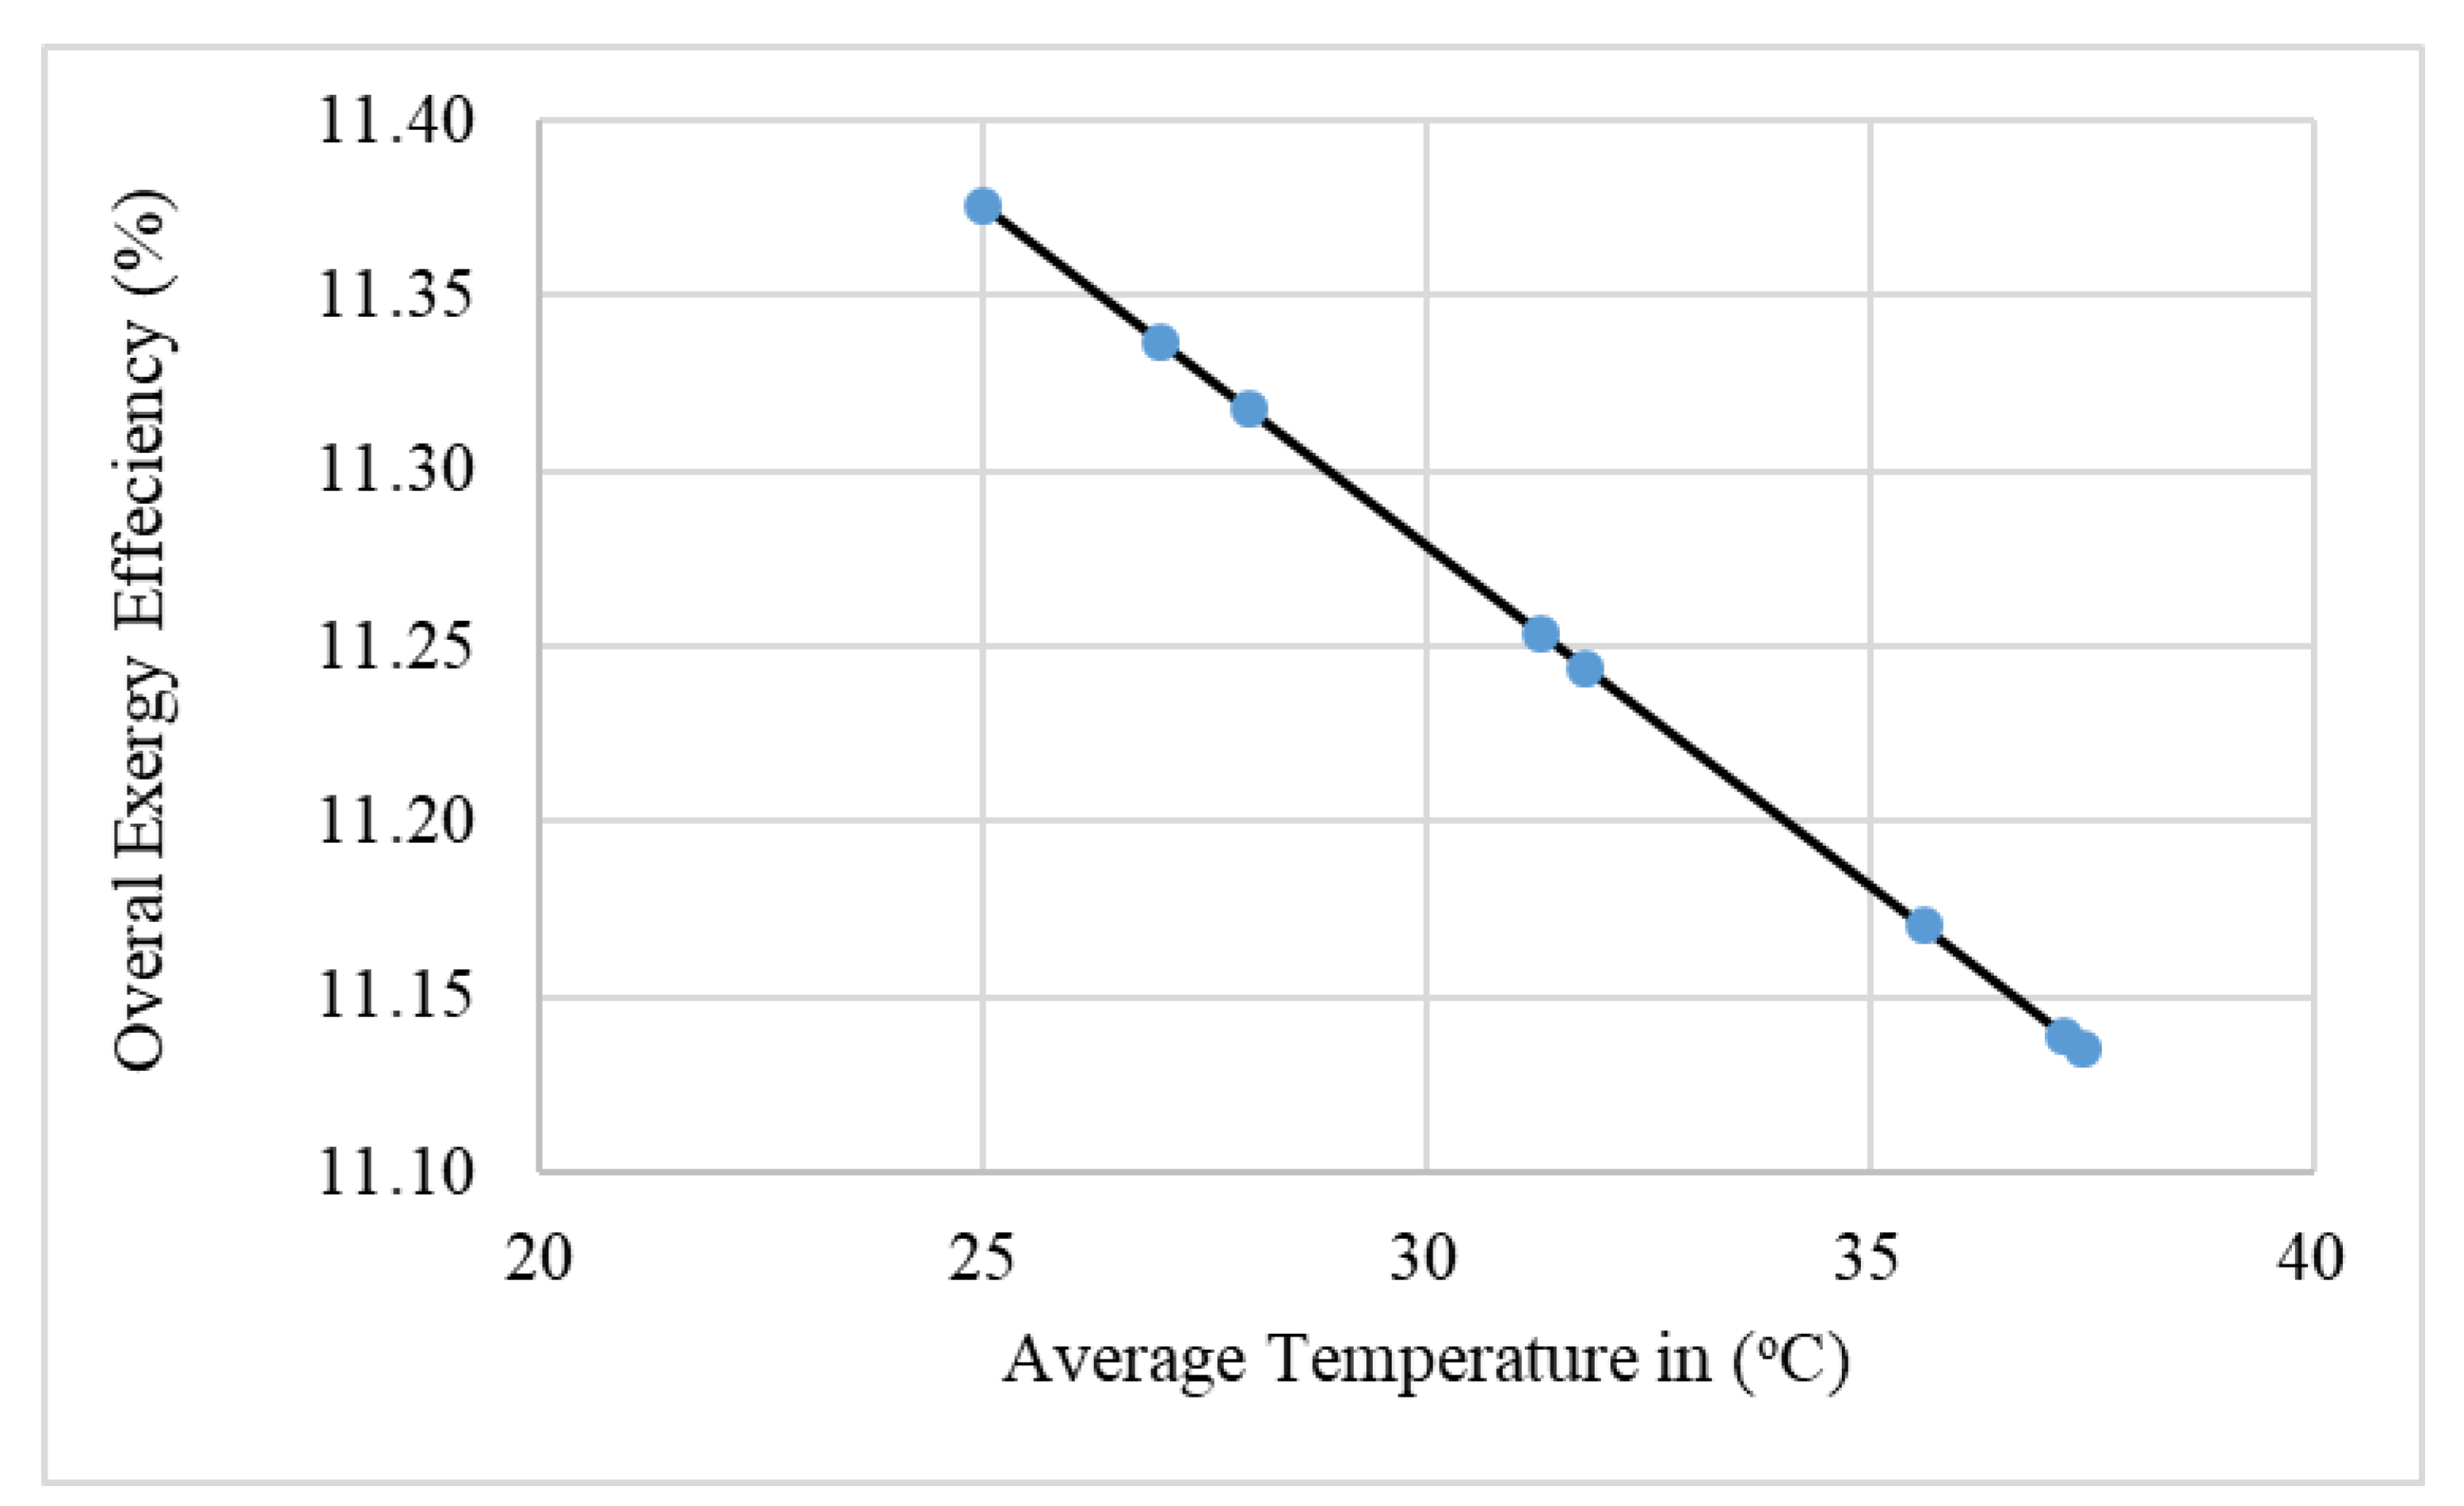
Figure 3 shows the effect of the reference temperature on the exergy efficiency. It is observed that exergy efficiency decreases with increasing reference temperature; it is 11.38% at an ambient temperature of 26 °C and 11.13% at a temperature of 50 °C. This indicates that the effect of the reference temperature is generally limited in this application.
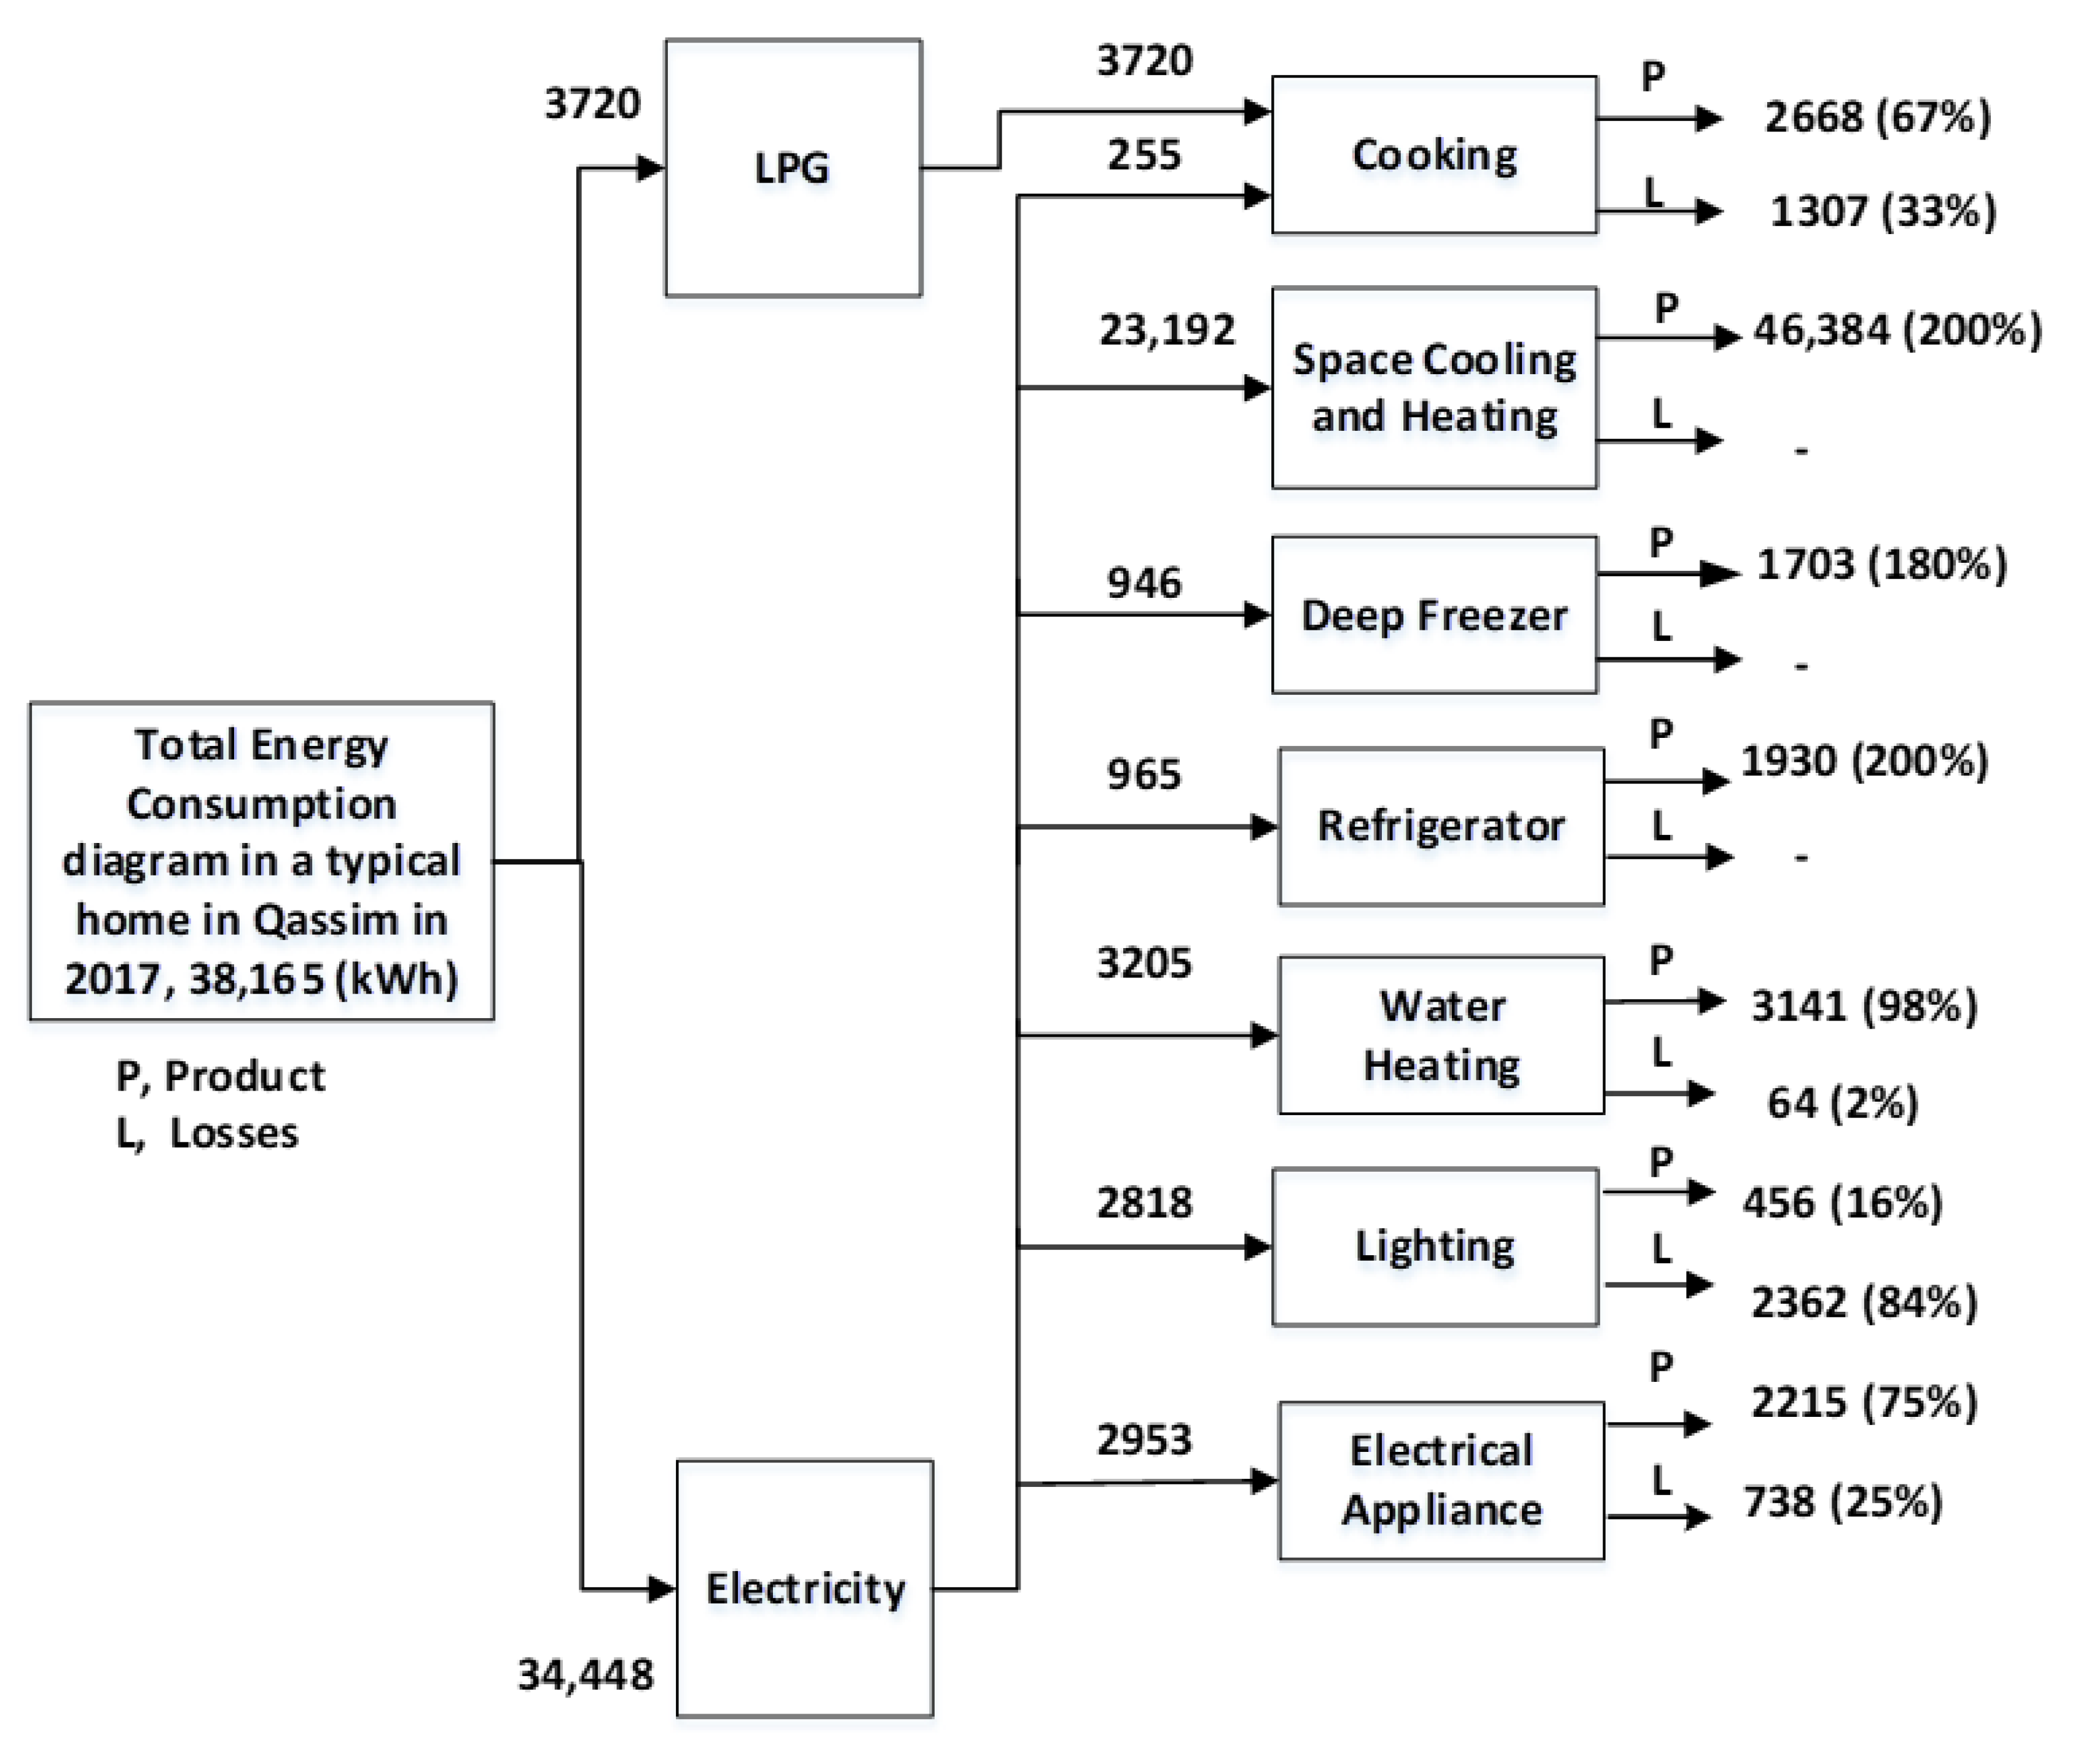
4.3. Energy and Exergy Diagrams
The energy and exergy diagrams are shown in
Figure 4 and
Figure 5 are very important to illustrate the overall energy use picture. It should be taken into consideration that although these diagrams are specifically for urban houses in the Qassim region, such diagrams can also be used for the Qassim region or the KSA as a whole. In order to do this, the number of homes, as well as the rate of homes in rural areas in the Qassim region or in other regions in the KSA, which usually consume less energy than in the current urban situation, will be needed. In the KSA, the average energy consumption per house, in general, is only about 70% of the values obtained in this study [
2], given the conditions of the surrounding atmosphere, local behavior in different regions, and the envelope construction of homes. It is supposed that the energy and exergy input to the homes are equal.
The following results can be drawn from the figures:
- ▪
The used energy (energy transfer) in air conditioners, refrigerators, and deep freezers are higher than energy income because it depends on the COP, which is a practical fall between 2–4. The energy losses were not calculated in these devices, knowing that there is a loss, and this loss is mainly related to the efficiency of the compressor.
- ▪
The used energy is generally always greater than the waste, except in lighting.
- ▪
The exergy losses are much larger than that used, except electrical devices independent of temperature.
4.4. Economic and Environmental Analysis
First, in order to improve the overall energy system to be more sustainable in the first place, energy consumption should be reduced. Second, loss of energy and distraction of exergy can be reduced by making the devices and processes more efficient. On the other hand, the utilization of renewable energy sources will help to improve environmental and economic conditions in many applications. Here, an economic and environmental analysis was carried out of two main processes of energy consumption in houses the Qassim region: reducing thermal load and trying to take advantage of solar energy to heat water.
We conducted an economic analysis using the life cycle cost method (LCC), taking into account the requirements of the Saudi Building Energy Conservation code (KSA SBC-602) [
33] for estimating the potential savings along the life cycle of a system. We considered a home with an average area of 582 m
2, based on the results of the survey—consisting of two floors (17 × 17.1 m), walls with a height of 3.25 m, a roof area of 291 m
2, and surrounding walls with an area of 443.3 m
2. For 2017, the annual average total consumed energy using the bill data per home was 34,448 kWh (see
Table 7). Adopting envelope isolation for buildings would reduce the energy consumption of air conditioning by 43%, according to Esmaeil et al. [
7], in addition to an enormous reduction in greenhouse gas (GHG) emissions. Although, the adoption of passive strategies can reduce the total energy consumption by as much as 37% [
34].
Based on the survey results, 100% of dwellings use electric water heaters. However, Kalogirou [
35] proposed a solar fraction of 79%, while Hazami et al. [
36] proposed a solar fraction ranging from 50–100%. It should be noted that the solar fraction is the used solar thermal energy provided by the solar system divided by the total energy necessary for any application. Indeed, Saudi Arabia possesses rich solar radiation intensity from 1700–2400 kWh/m
2 yearly, and based on its climate conditions, a solar fraction of at least 70% could be recommended. Therefore, by applying this solar fraction and considering a consumption ratio of 9.31% from the total electrical energy for domestic heating of water (see
Table 7), a yearly energy saving of 6.5% (0.7 × 9.31) of total electrical consumption could be achieved. Furthermore, an analysis was carried out to identify the amount of energy saving that may occur in the case of adopting solar water heating (SWH) instead of using electric water heaters, based on the assumptions in
Table 11. Also, some information was collected from the experts of the local market—for example, the current insulation cost, the cost of maintenance, and the life cycle of the building or SWH system. By applying the assumptions
Table 11 to the represented home in the Qassim region to meet the requirements of the KSA, as per SBC-602, and by using SWH, the calculations shown in
Table 12 were obtained. As mentioned earlier the proportion of fuel consumed to generate electricity is 53.7% from gas and 46.3% oil in 2017 [
2]. By utilizing the RETScreen program, it was determined that the amount of savings in the deployment of CO
2 would be as follows: 0.866 tCO
2/MWh using oil and 0.67 tCO
2/MWh using natural gas [
37]. As a result of the evaluation of the calculation process, it was found that the application of the SBC-602 leads to a payback time between 10.07 and 15.15 years, and avoids 383 tCO
2 emissions during the life cycle of the project. In contrast, the use of SWH leads to a payback time between 6.6 and 8.5 years and savings of 43.1 tCO
2 during the life of the system.
This indicates that good economic conditions could be achieved despite the lower price of the energy unit compared to the global energy price. Also, savings can be achieved in emissions of GHG, and therefore the buildings could be more sustainable. We should not forget the benefit of ensuring better thermal comfort conditions for residents as well.
Esmaeil et al. [
7] calculated the impact of the insulation building envelopes to meet the Saudi standards in the Qassim region. They reported a payback time value of 6.8 years based on the KSA subsidized electricity tariff of 0.048
$ USD/kWh. In Riyadh and Dammam in the KSA, Ahmad [
38] determined a payback time of wall insulation of 2–2.7 years. It is noticed that there is a difference in the payback time, which might be a result of price increases; for instance, in the last two years, the cost of materials and labor have increased by more than 25% in comparison to the study provided by Esmaeil et al. [
7].
Almasri and Almarshoud [
39,
40] analyzed the Solar Water heater for the residential sector using the RET Screen program at six sites in the KSA. They reported a wider perspective to include the costs, benefits to society, and the environment, and that the feasibility of using a Solar Water heater in the KSA can reduce electricity consumption by about 7.5%. Furthermore, their estimated payback time for all selected sites is between 3.4–8.35 years. Thus, a good match is observed between the current results and previous studies.

 ,
, 


