Article

Sustainability in the Banking Sector: A Predictive Model for the European Banking Union in the Aftermath of the Financial Crisis

by
Cristina Gutiérrez-López
1,* and
Julio Abad-González
2
1
Department of Business Administration, University of León, 24071 León, Spain
2
Department of Economics and Statistics, University of León, 24071 León, Spain
*
Author to whom correspondence should be addressed.
Sustainability 2020, 12(6), 2566; https://doi.org/10.3390/su12062566
Submission received: 31 January 2020 / Revised: 20 March 2020 / Accepted: 21 March 2020 / Published: 24 March 2020

Abstract

:
Given the central role of banks in financial stability and the recent impact of their insufficient capitalization, this article focuses on finding determinants of their solvency through financial variables. The study considers the European Banking Union framework and the results of the latter stress test exercises, using a panel of the 45 banks based in 15 European countries that were stress tested in 2014, 2016 and 2018. This paper models bank soundness proxied by the stressed tier capital 1 ratio by means of financial indicators representing a CAMELS (Capital, Assets quality, Management, Earnings, Liquidity and Sensitivity to market risk) approach as well as global systemically important financial institutions (G-SIFIs) additional requirements. The model also specifies a dummy covariate referred to the disclosure of corporate social responsibility (CSR) reports, adopting a comprehensive sustainability scheme. The research period starts with the European Banking Union and includes the three exercises conducted since then. We find that financial sustainability is positively correlated with higher capitalization, earnings and liquid assets, while poor quality assets (high non-performing loans) and inefficiency impact negatively on bank soundness. Moreover, it considers the year-scenario interaction either as a fixed or a random effect. The results support capital and liquidity regulation and highlight factors that reinforce banking soundness. They also reveal a positive connection between CSR and banking solvency.

1. Introduction

The banking sector is facing new challenges derived from increased competition and tightened regulations, forcing companies to project a solid image in terms of profitability and solvency, and to adapt their capabilities to new roles in the financial sector. Such roles include a central position in redistributing funds to promote sustainable growth and improving access to financial services [1], especially considering the significant amounts of capital flows and investments that will be needed to fight against climate change [2].
Moreover, the sustainability concept is adopting different perspectives nowadays and imposes increasing demands on banks, whether in its environmental aspect or in general terms. Overall, banks have more visibility than companies in other sectors and, as a consequence, are increasingly engaging in sustainability and corporate social responsibility (CSR) activities as part of their strategy to improve their public image. Additionally, competitiveness has led them to devote increasing resources to achieve sustainability, allowing the use of concepts such as sustainable banking, i.e., a trustworthy banking system accounting for every stakeholder, considering both financial and non-financial factors [3]. The connection between this concept and sustainable finance is undeniable; even the European Banking Authority (EBA) established that the transition to a lower-carbon economy provides new opportunities in the area of sustainable finance such as the development of green bonds, although new risks can emerge from green bubbles or greenwashing policies [4]. This conception of sustainability from the banking perspective not only sets ethical standards but also contributes to the stability and soundness of the financial system by a proper risk management [5]. In other words, finding an evaluation model of banking performance is necessary for evaluating bank sustainability.
Consequently, there is an increasing need to measure sustainability performance. In doing so, since the riskier the sector, the higher reporting requirements, banks are more motivated (and pressured) to publish reports that explain the potential benefits (or lack of risks) they offer (or take) [6]. Banks with higher financial efficiency are also more efficient in CSR activities [7], making a strong connection between CSR development and financial performance, and perceiving CSR as a means to restore their credibility [8].
Classical evaluating models of banking performance traditionally included only financial factors, but non-financial issues have been recently recognized as equally important elements [9]. In this sense, social and environmental aspects have joined financial features by means of CSR, adopting a multi-stakeholder perspective. Specifically, social and environmental sustainability implies minimizing the negative impact of banking activities on society and the environment [10].
Still, a sustainable bank is, first of all, a bank that contributes to the financial system stability by fighting against excessive risk-taking and moral hazard behavior. A sustainable bank is nothing but a company that respects regulations [9] and keeps proper earnings along with a successful continuation of business activities in the long term [10].
In the European case, the banking union project tries to enhance capital rules, strengthen banking supervision and avoid banking bailouts. To contribute to this aim, consecutive stress test exercises have evaluated resilience for the last 10 years. As there is abundant literature on the determinants of bank distress (or, alternatively, bank solvency), it is of special relevance to assess what factors explain financial soundness and stability in European banks since the European Banking Union (EBU) was effective by using the results of those stress-test exercises.
Consequently, the aim of this paper is to analyze the sustainability of European Union (EU) banks (along with Norway) that were tested in the three stress test exercises carried out by the EBA since the EBU’s inception, i.e., in 2014, 2016 and 2018 [11,12,13]. We hypothesize that solvency prediction levels derived from stress tests can be proxied by different financial indicators reflecting a CAMELS model (which stands for Capital, Assets quality, Management, Earnings, Liquidity and Sensitivity to market risk). The selected period of research also lets us discuss the sustainability of bank solvency after the financial crisis in Europe. To the best of our knowledge, this is the first study that covers all the stress tests performed in the EU with the implementation of the EBU by means of panel data that encompass all the banks submitted to the aforementioned 2014, 2016 and 2018 exercises.
Moreover, this study has a threefold contribution. First, the results provided by two alternative specifications of multilevel modeling suggest that the extended CAMEL model proposed is valid to predict stress test results. Second, this model can be used as an early-warning system to prevent bank distress in the sector in the context of the EBU. In fact, most of our findings support the direction of changes in the EU regulation and supervision. Third, this paper enhances the traditional financial studies by including a covariate referred to CSR disclosure, proving that engagement in these activities positively affects financial performance in terms of solvency.
The paper is structured as follows. Section 2 reviews the most significant literature about stress test and banking solvency determinants and develops research hypotheses. Section 3 describes the data (sample and variables) and methodology, while Section 4 presents the main results. Finally, Section 5 concludes.

2. Literature Review and Hypotheses

2.1. Banking Capital Regulation

As previously stated, sustainable banks are compliant, sound and efficient companies that reach appropriate solvency levels and contribute to financial system stability in the long term. This sustained solvency has been tested through specific exercises in which major companies in Europe are evaluated using common rules/standards. Identifying the main indicators that explain solvency is therefore a remarkable issue, which helps us prevent future financial crises and lets us release funds for sustainable growth.
Regulation in terms of capital (specifically, tier 1, as best-quality capital) and the definition of the solvency ratio are the core of different regulations issued by the Basel Committee on Banking Supervision known as Basel Accords. In the subsequent amendments of the original Accord, three different parts (known as pillars) have always been directly or indirectly addressed: capital requirements, supervisory review and market discipline. The last financial crisis illustrated insufficient capital buffers (in quantity and/or quality) and procyclicality and liquidity problems, which all led to the new Basel III Accord [14], where solvency was theoretically strengthened in the core equity tier 1 to risk-weighted assets ratio (CET1) and liquidity measures were incorporated. In addition, a tier 1 capital leverage ratio was introduced to prevent both arbitrage and model risks, and two other buffers (capital conservation and countercyclical) were included to guarantee the absorption of losses in circumstances of economic and financial stress and to ensure protection for the banking sector in periods of excessive credit growth and potential systemic risk. At any rate, updates and amendments in capital regulation both in the general view of the Basel Committee and in particular geographical contexts (e.g., the European Union) are ongoing, as is the case with the completion of the Basel III framework in 2017 [15].
New regulations also referred to global SIFIs (systemically important financial institutions). SIFIS are those entities whose distress or disorderly failure would cause significant disruption to the wider financial system and to economic activity because of their size, complexity and systemic interconnectedness [16]. Considering that their bankruptcy would be more expensive than their bailout, a higher level of capital was imposed on them, although this cannot replace proper management and supervision. In the case of these institutions, specific measures address two main problems: the cost of a public bailout and negative externalities, and moral hazard [17,18]. Besides tighter supervision and special resolution, these banks are required to increase their ability to absorb losses by raising additional capital to a percentage ranging from 1% to 3.5% of their risk-weighted assets. In 2019, 30 banks have been identified as SIFIs by the Financial Stability Board, and 11 are European (not including Switzerland).
In the midst of these regulatory changes, the Banking European Union was first announced in June 2012 as part of the institutional reaction to the crisis and as a response to difficulties in the relations among national supervisors. Its aim was to fulfill a single market in the financial sector, which requires enhancing banking solvency [19]. The project was conceptualized for euro-area countries, but others could also join. It started with a new regulatory framework throughout Directive 2013/36/EU (best known as the Capital Requirements Directive) and Regulation 575/2013, which transposed the Basel III Accord consistently among Member States. In November 2013, the European Central Bank (ECB) took up new duties as the single banking supervisor and later took part in the 2014 stress test banking exercise. The project moved forward establishing uniform rules on how failing banks in the EU should be restructured and resolved, avoiding costs of funding resolutions from national governments and taxpayers and imposing them to their shareholders and/or banks themselves (bail-in), thus protecting financial and social sustainability. This was reflected in a single resolution mechanism with the corresponding bank recovery and resolution directive passed in 2014. Reality has shown that market discipline is effective in these cases since, when the resolution is impending, creditors and depositors leave the company and such outflows are higher in the case of a systemic crisis [20], a situation that the project tries to avoid. Finally, the vicious circle between sovereign debt in many peripheral countries and the weakness of their banks was among the reasons to establish the European Deposit Insurance Scheme. This scheme equally ensures deposits in all Member States and prevents the depositors’ level of confidence in banks from depending on their location; however, national schemes would continue to co-exist alongside this mechanism.
Attempting to ensure the stability of the banking system, these regulations have been supplemented by stress testing exercises under adverse potential scenarios, thus forecasting future solvency levels in terms of the tier 1 ratio. In the European context, such tests contribute to the effective application of the single rulebook (mainly, CET1 as the Capital Requirements Directive specifies), support the ECB in developing its supervisory role, help identify banks facing serious problems that might need recapitalization or resolution, and play a part in restoring confidence for depositors, shareholders and financial markets.

2.2. Stress Tests

Stress tests are an analytical model of the financial systems resilience to adverse events with low probability of occurrence [21] and provide comparable results between the entities [22] due to the establishment of common assumptions about the potential downturn scenarios including a deterioration of macroeconomic variables. Although there is general consensus about their structure, they should also include the risks imposed by climate change and thus redefine solvency requirements to the corresponding catastrophe risk [23].
Stress tests are intended not only to diagnose banking companies´ soundness (from a micro perspective) but also to foster increasing resilience in the financial sector and, in the European case, prevent and limit credit restrictions imposed on citizens and companies (from a macro view). This subsequent healthy financial system theoretically helps efficient resource allocation and risk reduction [24,25,26]. Avoiding future financial crisis and its costs in terms of bailouts and restructuring process is also among the objectives of present regulation [27] and explains the development of successive Basel accords. Financial disclosure regarding both methodology and results is supposed to help banking regulators adequately supervise the banking sector [28] although it is not costless and may induce companies to suboptimal behavior and even to an overreaction to such information, thus reducing market discipline [29]. They are now understood as supervisory tools and part of pillar 2 (supervisory review of capital requirements demanded according to pillar 1) in terms of the Basel Accords.
According to previous studies, there is still room for their improvement, since adverse scenarios based on historical data are not sufficiently severe to be statistically robust [30], the risk-based capital ratio did not predict bank risk in the six months after stress tests [31] and risk-weighted assets measures that were not related to the market risk of assets European stress test have predicted a solvency ratio usually for a two-year horizon in terms of tier 1 [32]. Actually, a stressed tier 1 may differ from current capital levels although they should be connected.
In Europe, the first test exercise was developed in July 2010 (strictly speaking, with a precedent in 2009 analyzing the 22 mayor banking groups at the aggregate level), in order to assess the levels of capital and make a loss estimation under adverse scenarios. A tier 1 of 6% was required and the results were moderately satisfactory—despite the subsequent case of Ireland—although they raised alarms about the need to increase capital requirements.
A year later, the EBA (created as the European banking supervisory authority in 2009 along with the corresponding ones for stock markets and insurances and pensions, and responsible for developing a common methodology and coordinating the exercise) published the results of a new stress test, applied to a sample of 90 institutions from 21 countries, requiring a minimum level tier 1 of 5% in the proposed adverse scenario. These tests revealed that eight banks did not reach the minimum required capital. Based on these results, the EBA recommended that the national supervisors demanded the failing institutions to achieve the required capital and, in case of exposure to sovereign debt problems, to strengthen their capital base. Furthermore, additional measures regarding restrictions on dividend payments, leverage or equity issues were proposed.
Shortly thereafter, the Banking European Union was implemented and the cooperation between EBA and ECB was reinforced. Furthermore, since then there is a close cooperation between the EBA and the ECB, the European Systemic Risk Board, the European Commission, and the supervisory authorities in Member States.
Consequently, stress tests have become a regular European duty every two years since 2014, although their specific features have been evolving (see Table 1), and they are complemented with a yearly EU-wide transparency exercise. Specifically, the 2014 stress test exercise demanded a common equity tier 1 capital ratio of 5.5% and 8% in the adverse and baseline scenarios, concluding that 24 of the 123 analyzed institutions had capital needs.
The 2016 exercise, the first one without a pass/fail threshold, included 51 banks from 15 countries and was justified to support ongoing supervisory efforts to maintain the repair process in the EU banking sector. Moreover, while previous exercises can be considered ‘crisis stress tests’, as their objective was to identify possible capital shortfalls that require immediate recapitalization actions, since 2016 their aim was to assess remaining vulnerabilities and understand the impact of hypothetical adverse market dynamics or the changes with negative consequences on credit risk. The last exercise whose results have been already disclosed was conducted in 2018 (the 2020 test is still in progress), with a sample made of 48 banks in 15 countries in the EU and the European Economic Area at the highest level of consolidation. As a result, 46 banks from 15 countries took part in the three latest stress tests.
Besides European stress tests, the International Monetary Fund performs regular tests as part of its Financial Sector Assessment Program, focusing on the largest commercial banks in each country and thus evaluating a high percentage of banking assets. These analyses can be developed both as top-down (from aggregate data to individual) or bottom-up (from particular to general information) models.
In the US case, an annual supervisory test is performed since the implementation of the Dodd–Frank Act in 2010. Moreover, attempting to restore market confidence in the financial sector, the Board of Governors of the Federal Reserve System regularly carries out the Supervisory Capital Assessment Program (SCAP), starting in 2009 with the 19 largest banking holdings.
Nowadays, the Federal Reserve combines an annual capital review (the Comprehensive Capital Analysis and Review) to assess if the largest banking holdings keep enough capital to continue operating in the case of economic and financial tensions, as well as a complementary stress test called the Dodd–Frank Act stress testing (DFAST) to evaluate these banks in terms of their prospective loss-absorbing capacity through an adequate capital. As for the period considered in this study, 30, 31, 33, 34 and 35 companies have been included in DFAST in the period 2014–2018, respectively.

2.3. Determinants of Banking Solvency and Proposed Hypotheses

Banking soundness or, alternatively, banking distress, has been profoundly analyzed in research papers, mainly using the so-called CAMELS methodology (which stands for Capital, Assets quality, Management, Earnings, Liquidity and Sensitivity to market risk). This model based on accounting variables has been used on numerous occasions to explain and predict banking failures, such as the cases of Argentina [33], Australia [34], Brazil [35], Croatia [36], the US [37,38,39], Jamaica [40], South-East Asia [41], Spain [42] or Venezuela [43], and its capabilities as an early-warning system or tool for anticipating distress have been pointed out [44].
Most of the previous research has focused on predicting banking risk (solvency risk) defined by the non-performing loans ratio [45], while z-score or capital ratios (mainly tier 1) would reflect bank solvency. In this study, a stressed tier 1 lets us use a common regulatory variable for the whole sample and a forecast reflecting the attempt to prevent non-sustainable banking companies. In a similar approach, ref. [46] analyze which CAMELS variables explain the deviation of a predicted stressed Tier 1 capital ratio from a current Tier 1 capital ratio, thus getting stress test impact.
The explanatory variables included in the selected model are proxies of the different indicators of the CAMELS system and have been previously considered in research papers, although their specific category is not always clear. Specifically, some ratios could be categorized as either management, earnings or even sensitivity, since they reflect efficiency in expenses and or/income generation; moreover, liquidity and sensitivity are also blurred and some measures reflect how performance impacts firms’ exposure to liquidity problems, thus increasing market risk.
Moreover, the CAMELS model is extended in an attempt to improve the classical assessment of banking solvency by taking CSR into account. The key role that banks have in society as financial intermediaries explains the growing demands for them to compromise with CSR activities. This aspect has received increasing attention since the 2008 financial crisis, where banks lost customers’ trust and needed to build new relationships through these actions in order to restate confidence. This new trend has also attracted the literature’s attention, as the number of research papers before 2008 had been scarce [47].
The specific influence of each component of a CAMELS model leads us to propose the following hypotheses:
Capitalization: several papers find that capitalization is inversely related to banking risk [44,48,49] and, as a consequence, has a positive influence on bank solvency. This is because capital requirements impose a limit on liabilities and thus disincentive risk-taking. As a result, the first hypothesis is proposed as follows:
Hypothesis 1 (H1).
There is a positive relation between bank capitalization and solvency.
Assets quality: troubled assets are a significant driver of credit risk because a high proportion of loans to total assets usually implies banking problems, increasing non-performing loans (NPL) and higher operating costs with growing liquidity issues [49]. The influence of poor-quality assets on bank failure has been previously confirmed by [50], among others. However, the simple proportion of loans to assets (asset structure) may lead us to different assumptions, due to its impact on higher profitability [51]. For that reason, the proportions of NPL, reserves or provisions to cover possible losses are more suitable proxies to reflect credit risk exposure. These arguments let us propose the following hypothesis:
Hypothesis 2 (H2).
There is a negative relation between the proportion of NPL in assets and bank solvency.
Management: according to the literature, efficiency is inversely related to banking risk and therefore has a positive influence on bank solvency [44,46,48,49,50,52]. Moreover, efficient management is closely related to earnings and assets quality, because better-managed institutions keep an appropriate earnings capacity and usually have a lower NPL ratio, as management quality is also reflected in loan quality [42]. However, most of the research uses a cost-to-income ratio as a proxy, which actually reflects inefficiency and considerable high expenses as an undesirable input. Moreover, inefficient banks typically have higher risk levels [53]. Other variables, such as high asset growth, are a reflection of an aggressive and risky lending policy [54] and, along with loans growth, can reflect banking mismanagement [32]. Accordingly, the following hypothesis is postulated:
Hypothesis 3 (H3).
Higher inefficiency levels negatively affect bank solvency.
Earnings: previous research has proved a negative relation between bank performance and risk [44,46,49,52] and, as a consequence, a positive influence of earnings on bank solvency. In particular, this relation is outstanding for the return-on-assets (ROA) ratio, since companies with higher ROA reflect a better management quality and have a lower NPL ratio, but other studies have also found significance for return on equity [55]. On the contrary, worse performance may be a proxy for lower-quality skills with respect to lending activities. Financial return is also included by [32] and others. Other proxies relate interest revenue to current or total assets, which could also explain sensitivity [46]. Hence, the earnings hypothesis states that:
Hypothesis 4 (H4).
There is a positive relationship between a bank´s returns and solvency.
Liquidity: according to the Basel rules, a proper level of liquidity is imperative for avoiding future crisis, since solvency and liquidity issues are reinforced. The 2008 liquidity crisis demonstrated that these entities need longer time frames to work with and that liquidity demands can restrict credit to the private sector, thus causing credit crunches. In that sense, higher liquidity ratios will impact on banking solvency in a positive way. Moreover, a high level of liquid assets that can easily be converted into cash when needed gives banks credibility to meet their financial demands [46]. As a consequence, we propose:
Hypothesis 5A (H5A).
Higher liquidity assets are positively correlated with the solvency level.
However, some studies support that rising liquidity ratios create incentives for risk-taking [56]. In fact, if the variables are based on the proportion of loans in the bank´s portfolio, they are a proxy of liquidity risk, since the higher such loans are, the greater the risk arising from bank´s inability to fund assets increases or liabilities reductions [49,51]. Considering this, the alternative liquidity hypothesis is formulated as follows:
Hypothesis 5B (H5B).
A higher liquidity risk is negatively correlated with the solvency level.
Sensitivity: the most controversial variable is sensitivity to market risk (S). According to [57], it is reflected in total assets (size) and positively affects solvency as such investments somehow impede default risk, but [42] introduces earnings from commercial transactions/operating revenue as a proxy and [58] uses the level of other interest-bearing liabilities to total assets, both expecting that the higher this ratio, the higher the sensitivity of financial institutions to the impact of liquidity issues on interest expense and hence on firms’ profitability, with the subsequent negative effects on soundness. These arguments lead us to propose the subsequent hypothesis:
Hypothesis 6 (H6).
Higher sensitivity to market risk is negatively correlated to solvency level.
The traditional CAMELS model has proved to be a good instrument for predicting banking solvency, thus ensuring financial sustainability. The incorporation of CSR engagement extends this concept and is of particular interest in the post-crisis period. Despite the fact that some studies reveal a negative impact of CSR on solvency proxies [46], considering that banks with low capital risk tend to issue a sustainability report because they are exposed to higher risks, the majority of recent research found a positive relation between banks´ CSR and financial performance [59,60]. Therefore, the following hypothesis is proposed:
Hypothesis 7 (H7).
Engagement in CSR activities is positively correlated to solvency level.

3. Materials and Methods

3.1. Dependent Variable and Sample Selection

The proxy for the level of solvency that will be used is the so-called stressed tier 1 capital ratio (Y) [46], i.e., the 2-year forecast from results-released date for this ratio, under both baseline and adverse scenarios, disclosed by the EBA in 2014, 2016 and 2018 EU stress test exercises. The rationale behind its selection is that this ratio should reflect the level of solvency under the current regulation according to Basel III rules and its incorporation into European law in the European banking union development through the Capital Requirements Directive.
As previously mentioned, the number of banks submitted to stress-testing in those EU exercises has sharply decreased from 123 in 2014 to 51 and 48 in 2016 and 2018, respectively. As a consequence, the stressed tier 1 capital ratio is only observable for the 46 banks that were submitted to the three aforementioned stress tests exercises. Moreover, owing to the absolute lack of information regarding its financial statements, the German bank Norddeutsche Landesbank had to be excluded from the sample, which finally consisted of a panel of 45 banks (see Table A1 in the Appendix A), resulting a total of 256 observations corresponding to 128 bank-years in the two scenarios, baseline and adverse. Table 2 presents the distribution of banks in the sample by country and stress test exercise.

3.2. Independent Variables

Since the 2014, 2016 and 2018 stress test exercises were based on the 2013, 2015 and 2017 financial statements, respectively, the independent variables are financial ratios gathered from the Orbis Bank Focus database corresponding to the latter. These initial 17 ratios were grouped into the six different sets of variables in line with the well-known CAMELS rating system used by the Federal Deposit Insurance Corporation for banking supervision purposes (see Table 3). The expected sign for their coefficients is derived from the hypotheses proposed in Section 2.3. Hence, all the explanatory variables related to capital (C), earnings (E) and liquid assets (LiqAssets/Dep) are expected to positively correlate with the response, as stated in hypotheses H1, H4 and H5A, while the ones referring bad quality of assets (A), inefficient management (M), liquidity risk (Loan/Dep and Loan/TDep), and sensitivity to market risk (S) are expected to negatively impact the dependent variable, in coherence with hypotheses H2, H3, H5B and H6. However, due to missing data in the database, four of these potential explanatory variables were finally excluded from the analyses to avoid a severe sample reduction in terms of banks (more than 40% of PayOut and PER values are missing) or even countries (the data referred to Cap/Assets is missing for the Italian banks, and including NCO/Loans would imply the exclusion of the Polish and Hungarian banks). Consequently, the final number of financial ratios included as regressors in our analysis is 13.
Furthermore, the implications in terms of additional capital requirements for global systemically important financial institutions (G-SIFIs) are considered by means of SIFI, a variable that takes values of 1, 1.5, 2 or 2.5, according to the specific additional capital buffer the G-SIFIs have to meet, and a value of 0 for the rest of banks.
Additionally, due to the importance of the macroeconomic environment in regulatory stress test scenarios and as a way to address a potential European Banking Union impact, we include a dummy variable called Euro that takes value 1 if the bank has its headquarters in a euro-area country, and 0 otherwise.
Finally, we include a dummy reflecting the disclosure of a specific CSR report to consider the influence of environmental, social and governance (ESG) policies on banking soundness. This variable will be 1 if the financial institution issues a specific sustainability report (alternatively called ESG report, CSR report or Global Reporting Initiative Standards Compliance, among others), or 0 otherwise; this information is expected to be a significant part of the integrated report (also referred to as non-financial information, an integrated annual review or non-financial statements), particularly in 2017. In coherence with hypotheses H7, this variable is expected to positively impact the dependent variable.
Table 4 summarizes the main descriptive statistics for the aforementioned variables.

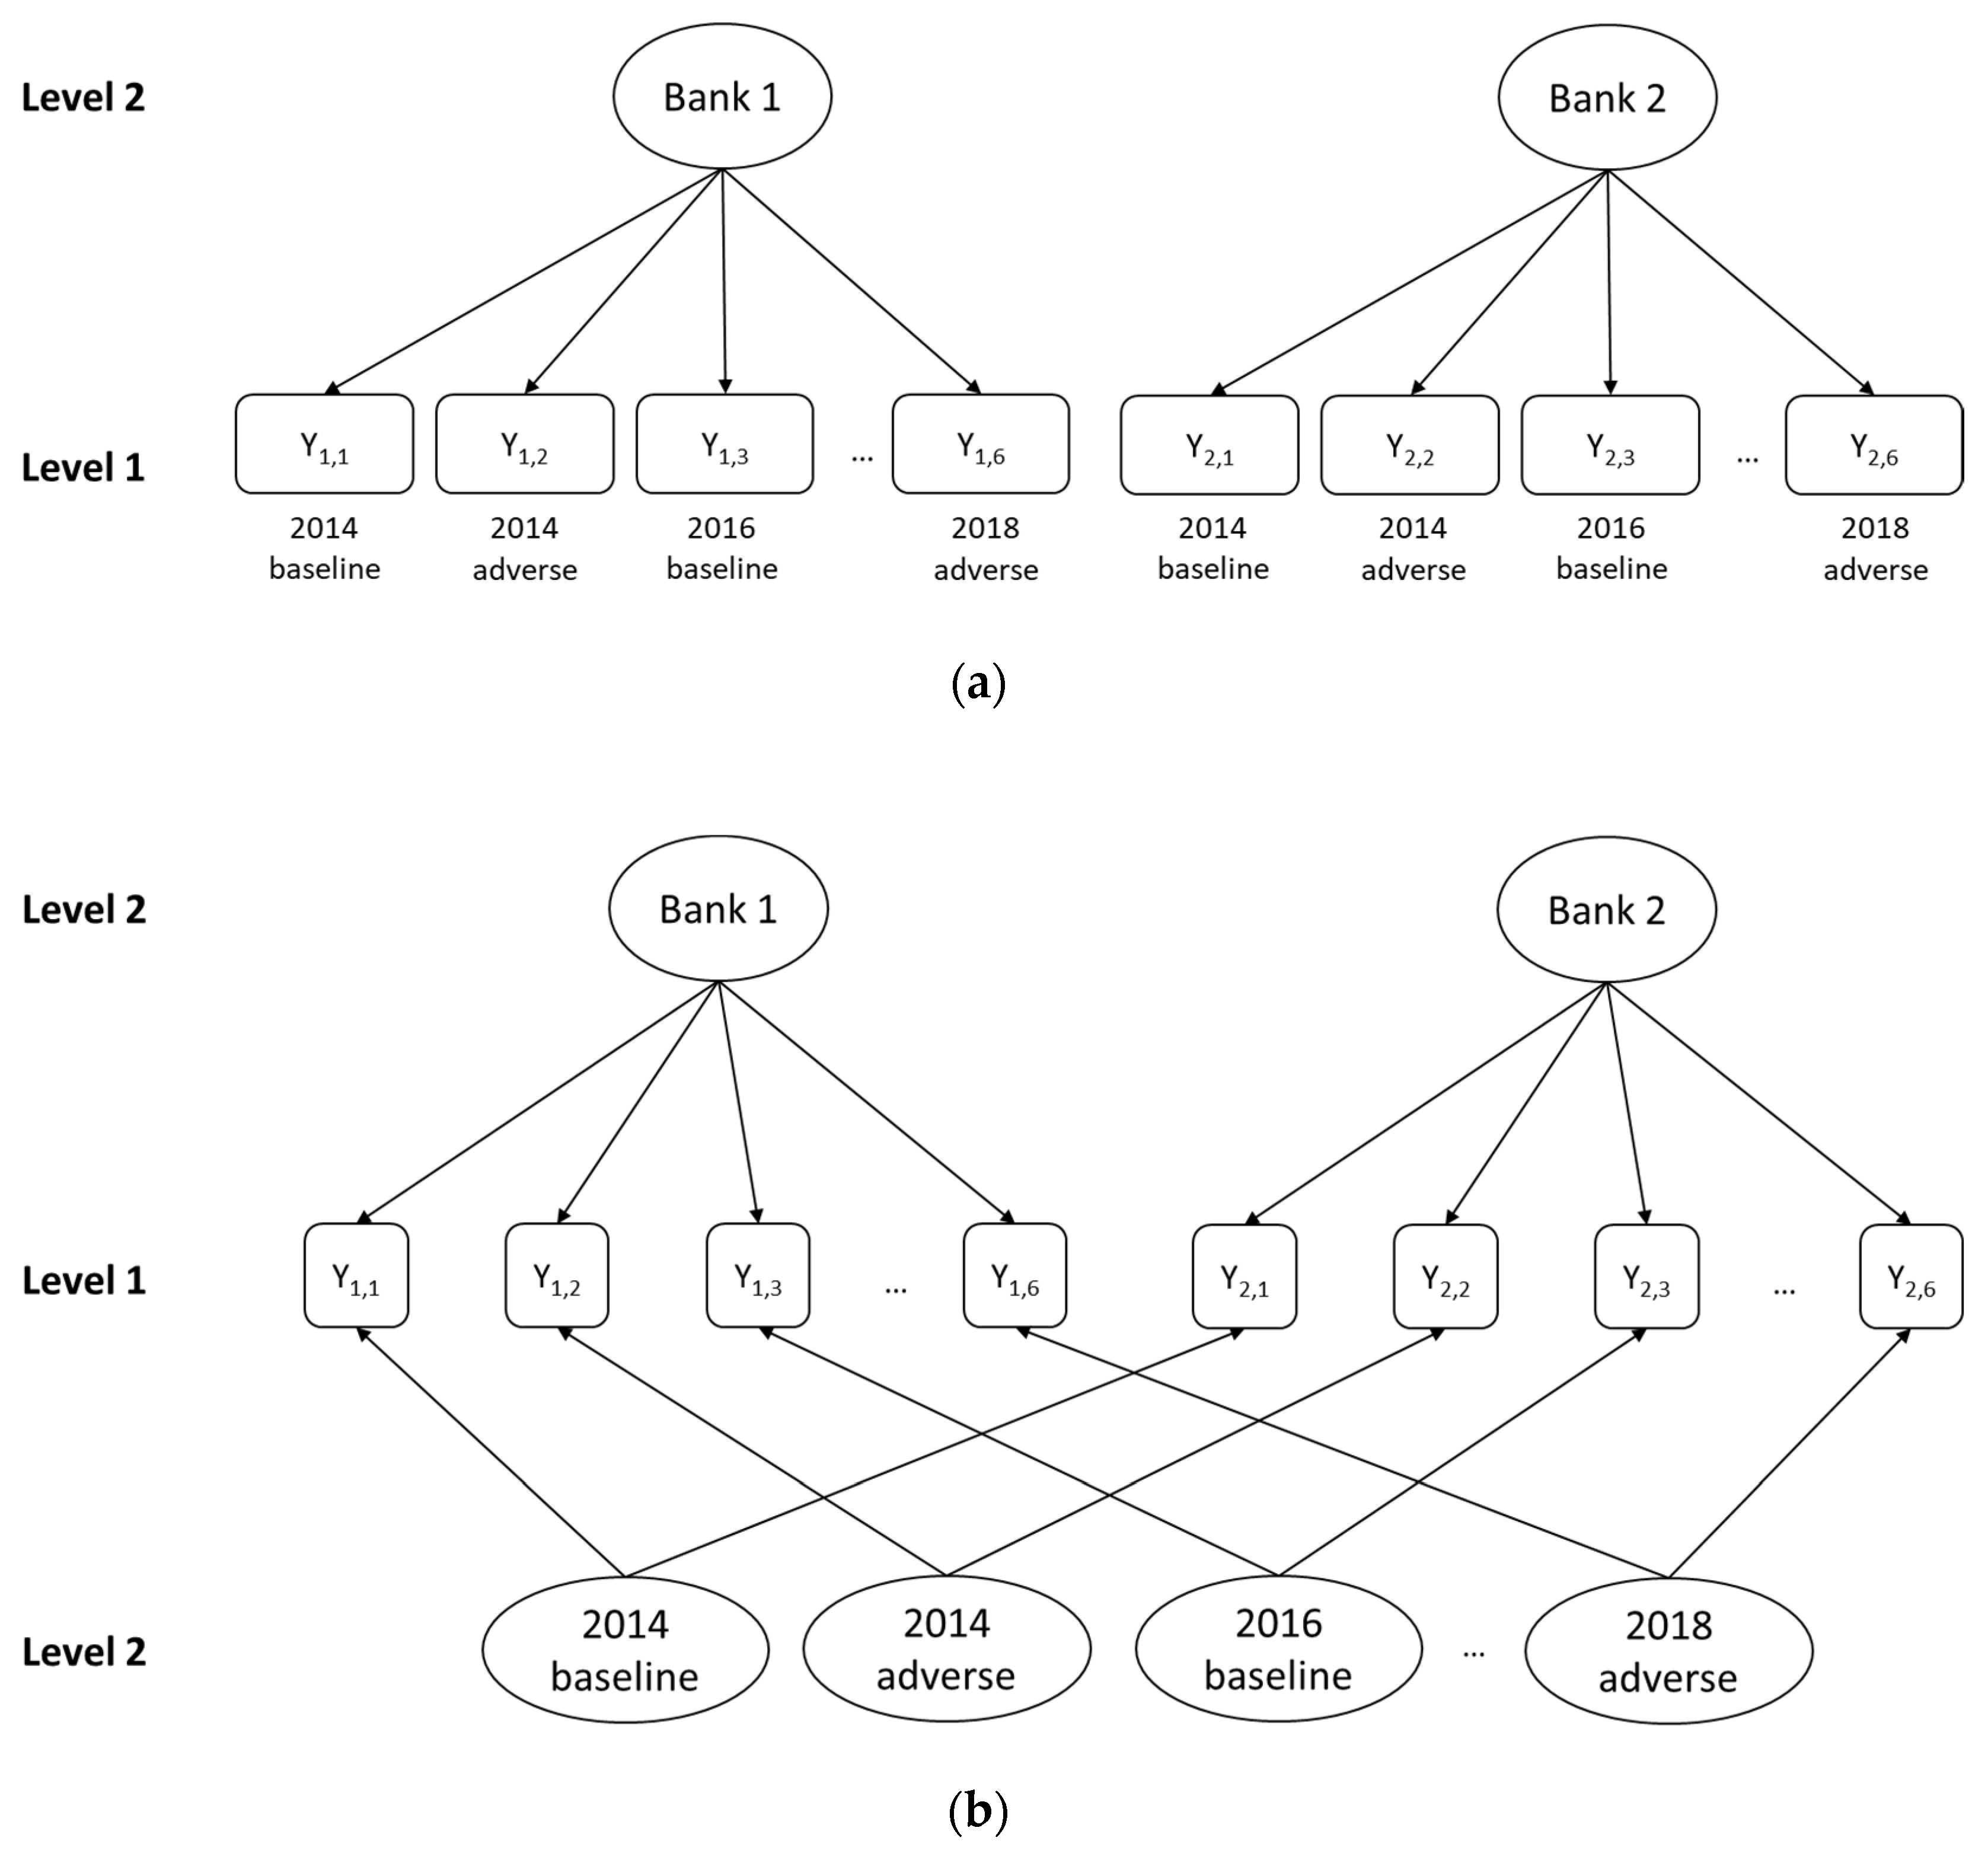
3.3. Statistic Models

Given that the dependent variable in our analysis is the tier 1 capital ratio estimated by the three stress test exercises in the two considered scenarios, it seems unrealistic to assume as uncorrelated the values of the response for each bank in the different scenarios and years. Hence, instead of applying an ordinary least squares (OLS) regression on our pooled data, we will use multilevel modeling, a parametric extension of OLS that is best suited to address the violation of the assumption of independent observations, which is likely to occur when dealing with nested observations, as is our case [62] (p. 2). According to [62] (pp. 96–97,159) and [63] (pp. 46–48), we model the bank-level effect by means of a random-effects specification because the groups (banks) are regarded as a sample from a population, the vast majority of covariates are bank-level variables, and the number of groups is large enough (>20) while the group sizes are small (≤6).
Consequently, as this multilevel structure can be addressed by means of either a nested or a crossed-classified model (Figure 1), we propose the following two alternative multilevel structures for modeling our data:
1.
A two-level random intercept model with covariates according to the following specification:
y i j = β 0 + k = 1 13 β k R a t i o k j + β 14 S I F I j + β 15 E u r o j + β 16 C S R j + l = 1 5 γ k S c e n a r i o _ Y e a r k i + u j + e i j ,  
where Ratiokj comprises the 13 financial ratios aforementioned, Scenario_Yearki encompasses five dummies indicating the combinations between years and scenarios (being the baseline scenario in 2014 the reference category), uj is the level-2 (bank) random intercept and eij the level-1 residual error term. This model can be thought as a “mixed-effects two-way ANOVA model” since a random effect is specified for banks and the interaction between scenario and year is included as a fixed effect [62] (p. 98).
2.
A crossed random effects model with covariates, according to the following specification:
y i j = β 0 + k = 1 13 β k R a t i o k j + β 14 S I F I j + β 15 E u r o j + β 16 C S R j + ζ i + u j + e i j ,  
where the interaction between scenario and year is included as the random effect ζi instead of as a fixed effect. This model is usually called a two-way error-components model [62] (p. 433), since the two crossed factors are included in the model as random intercepts.
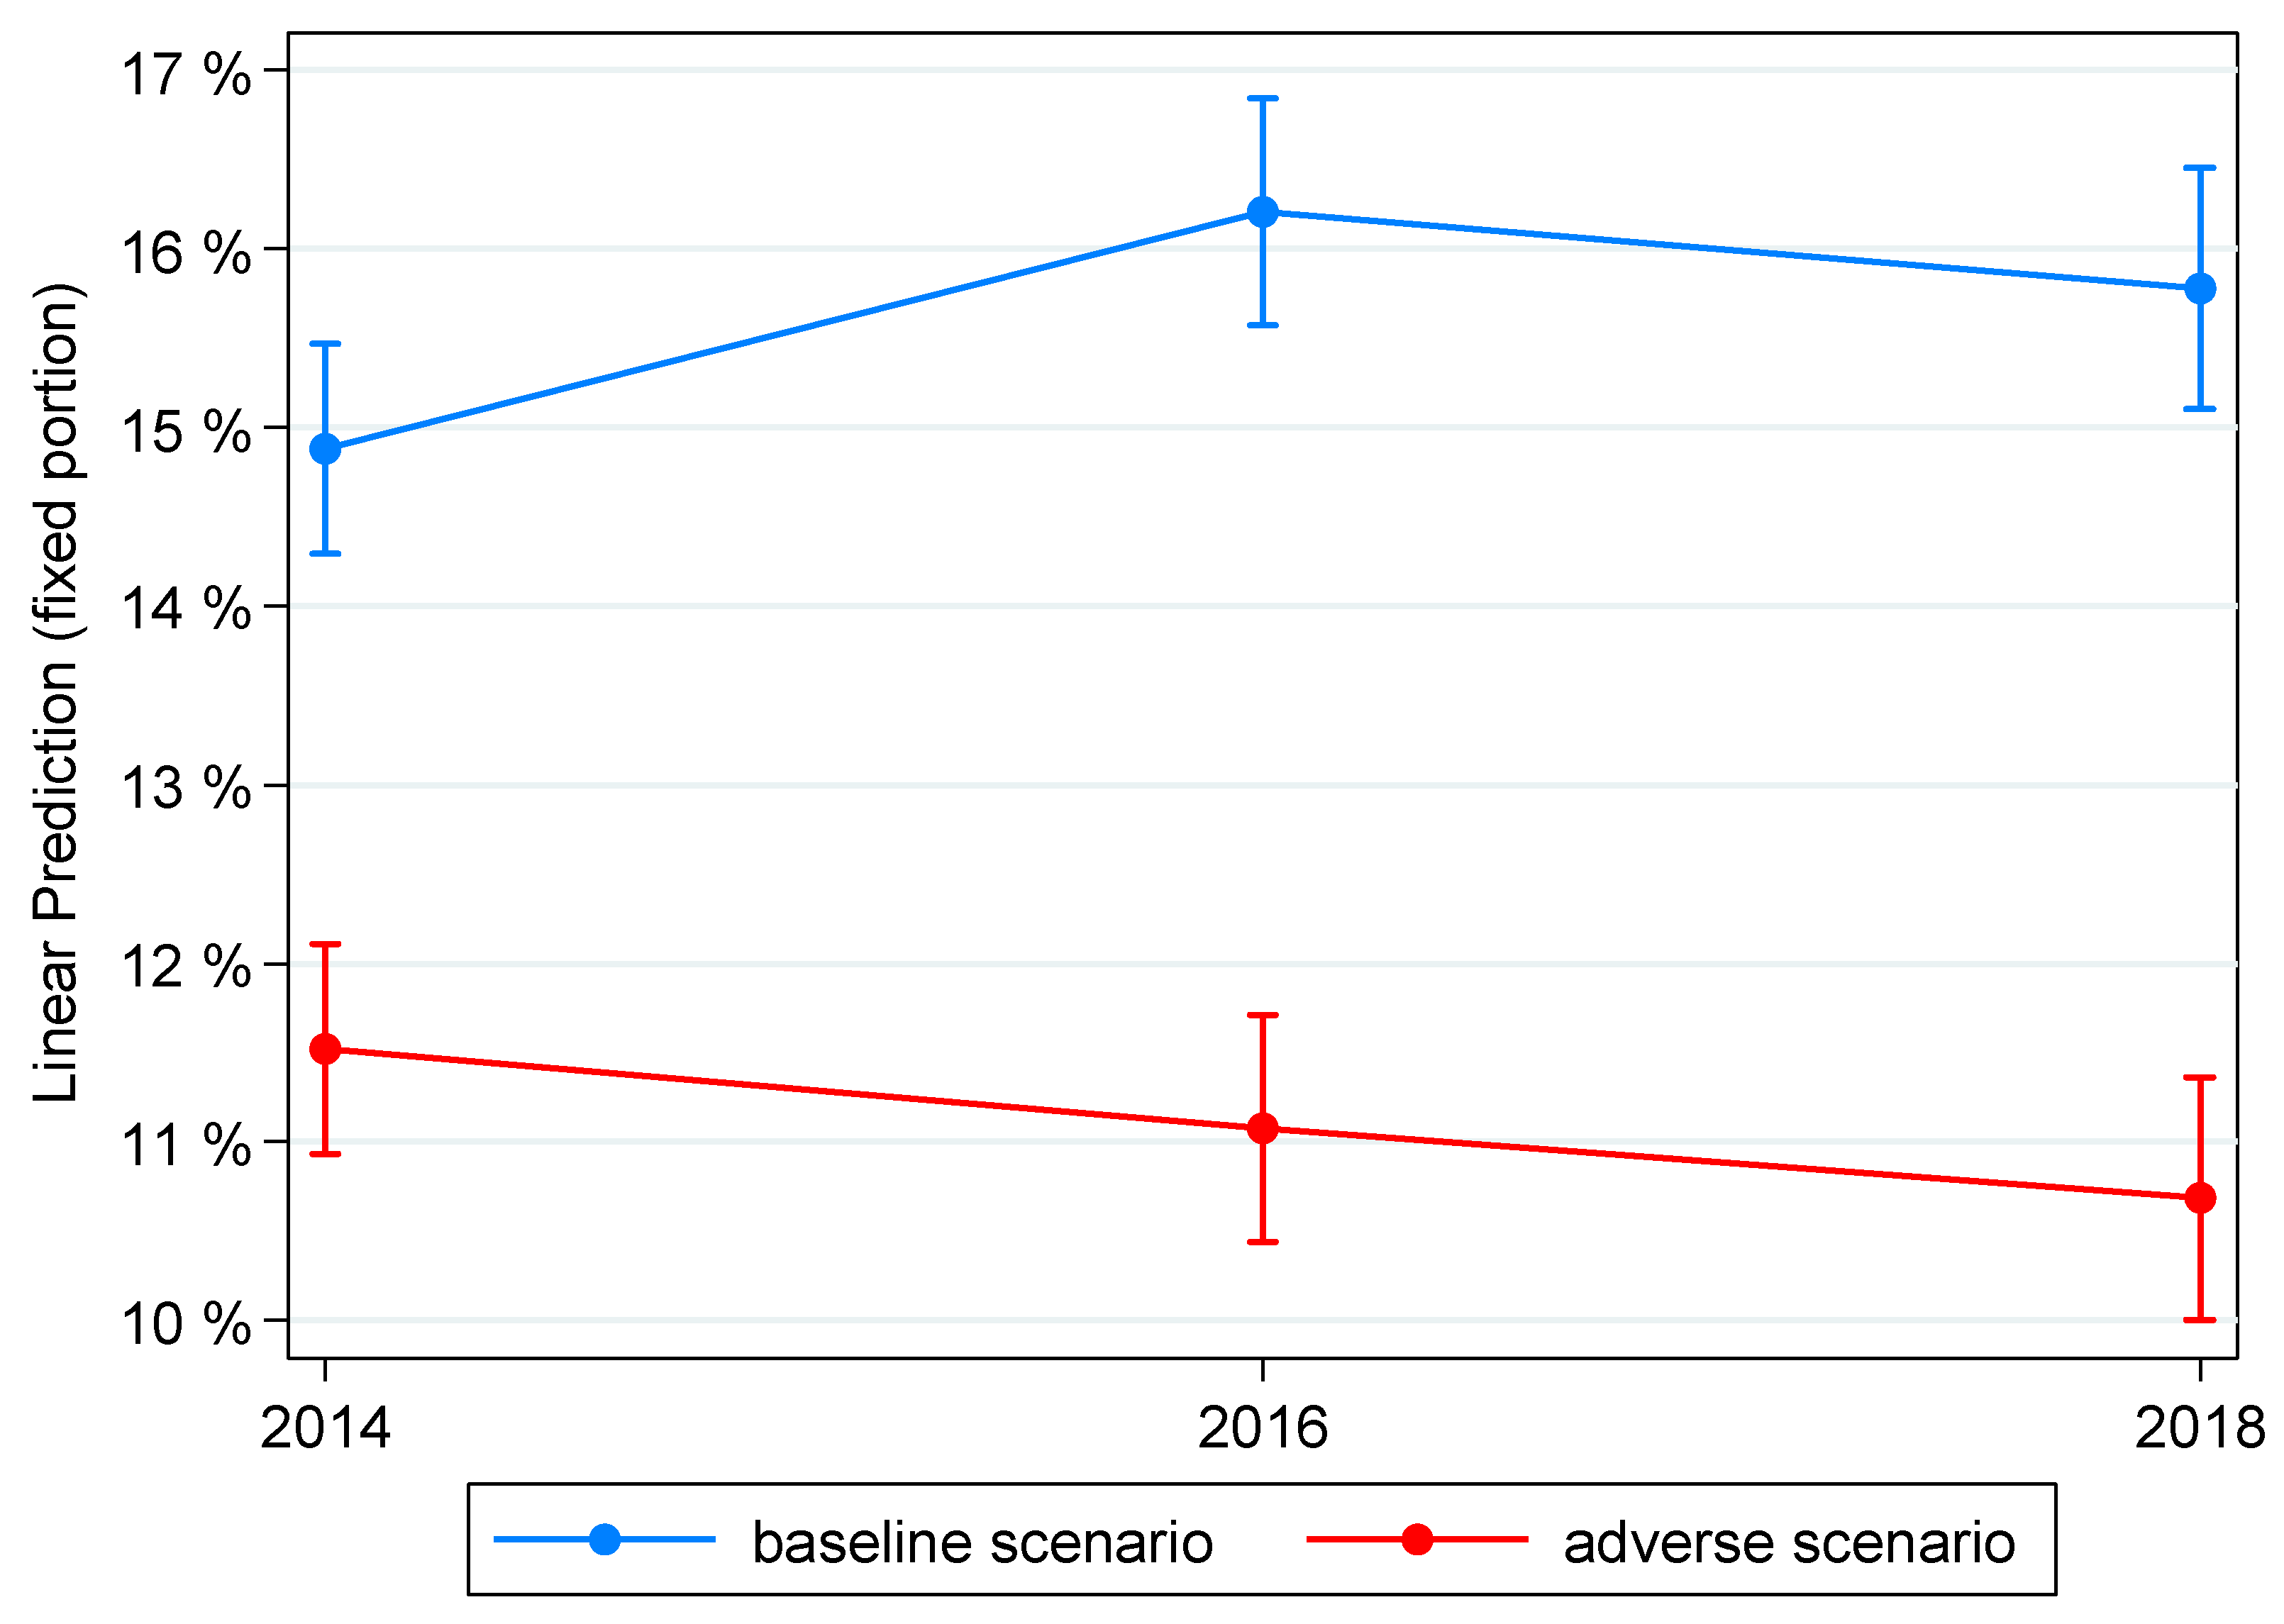
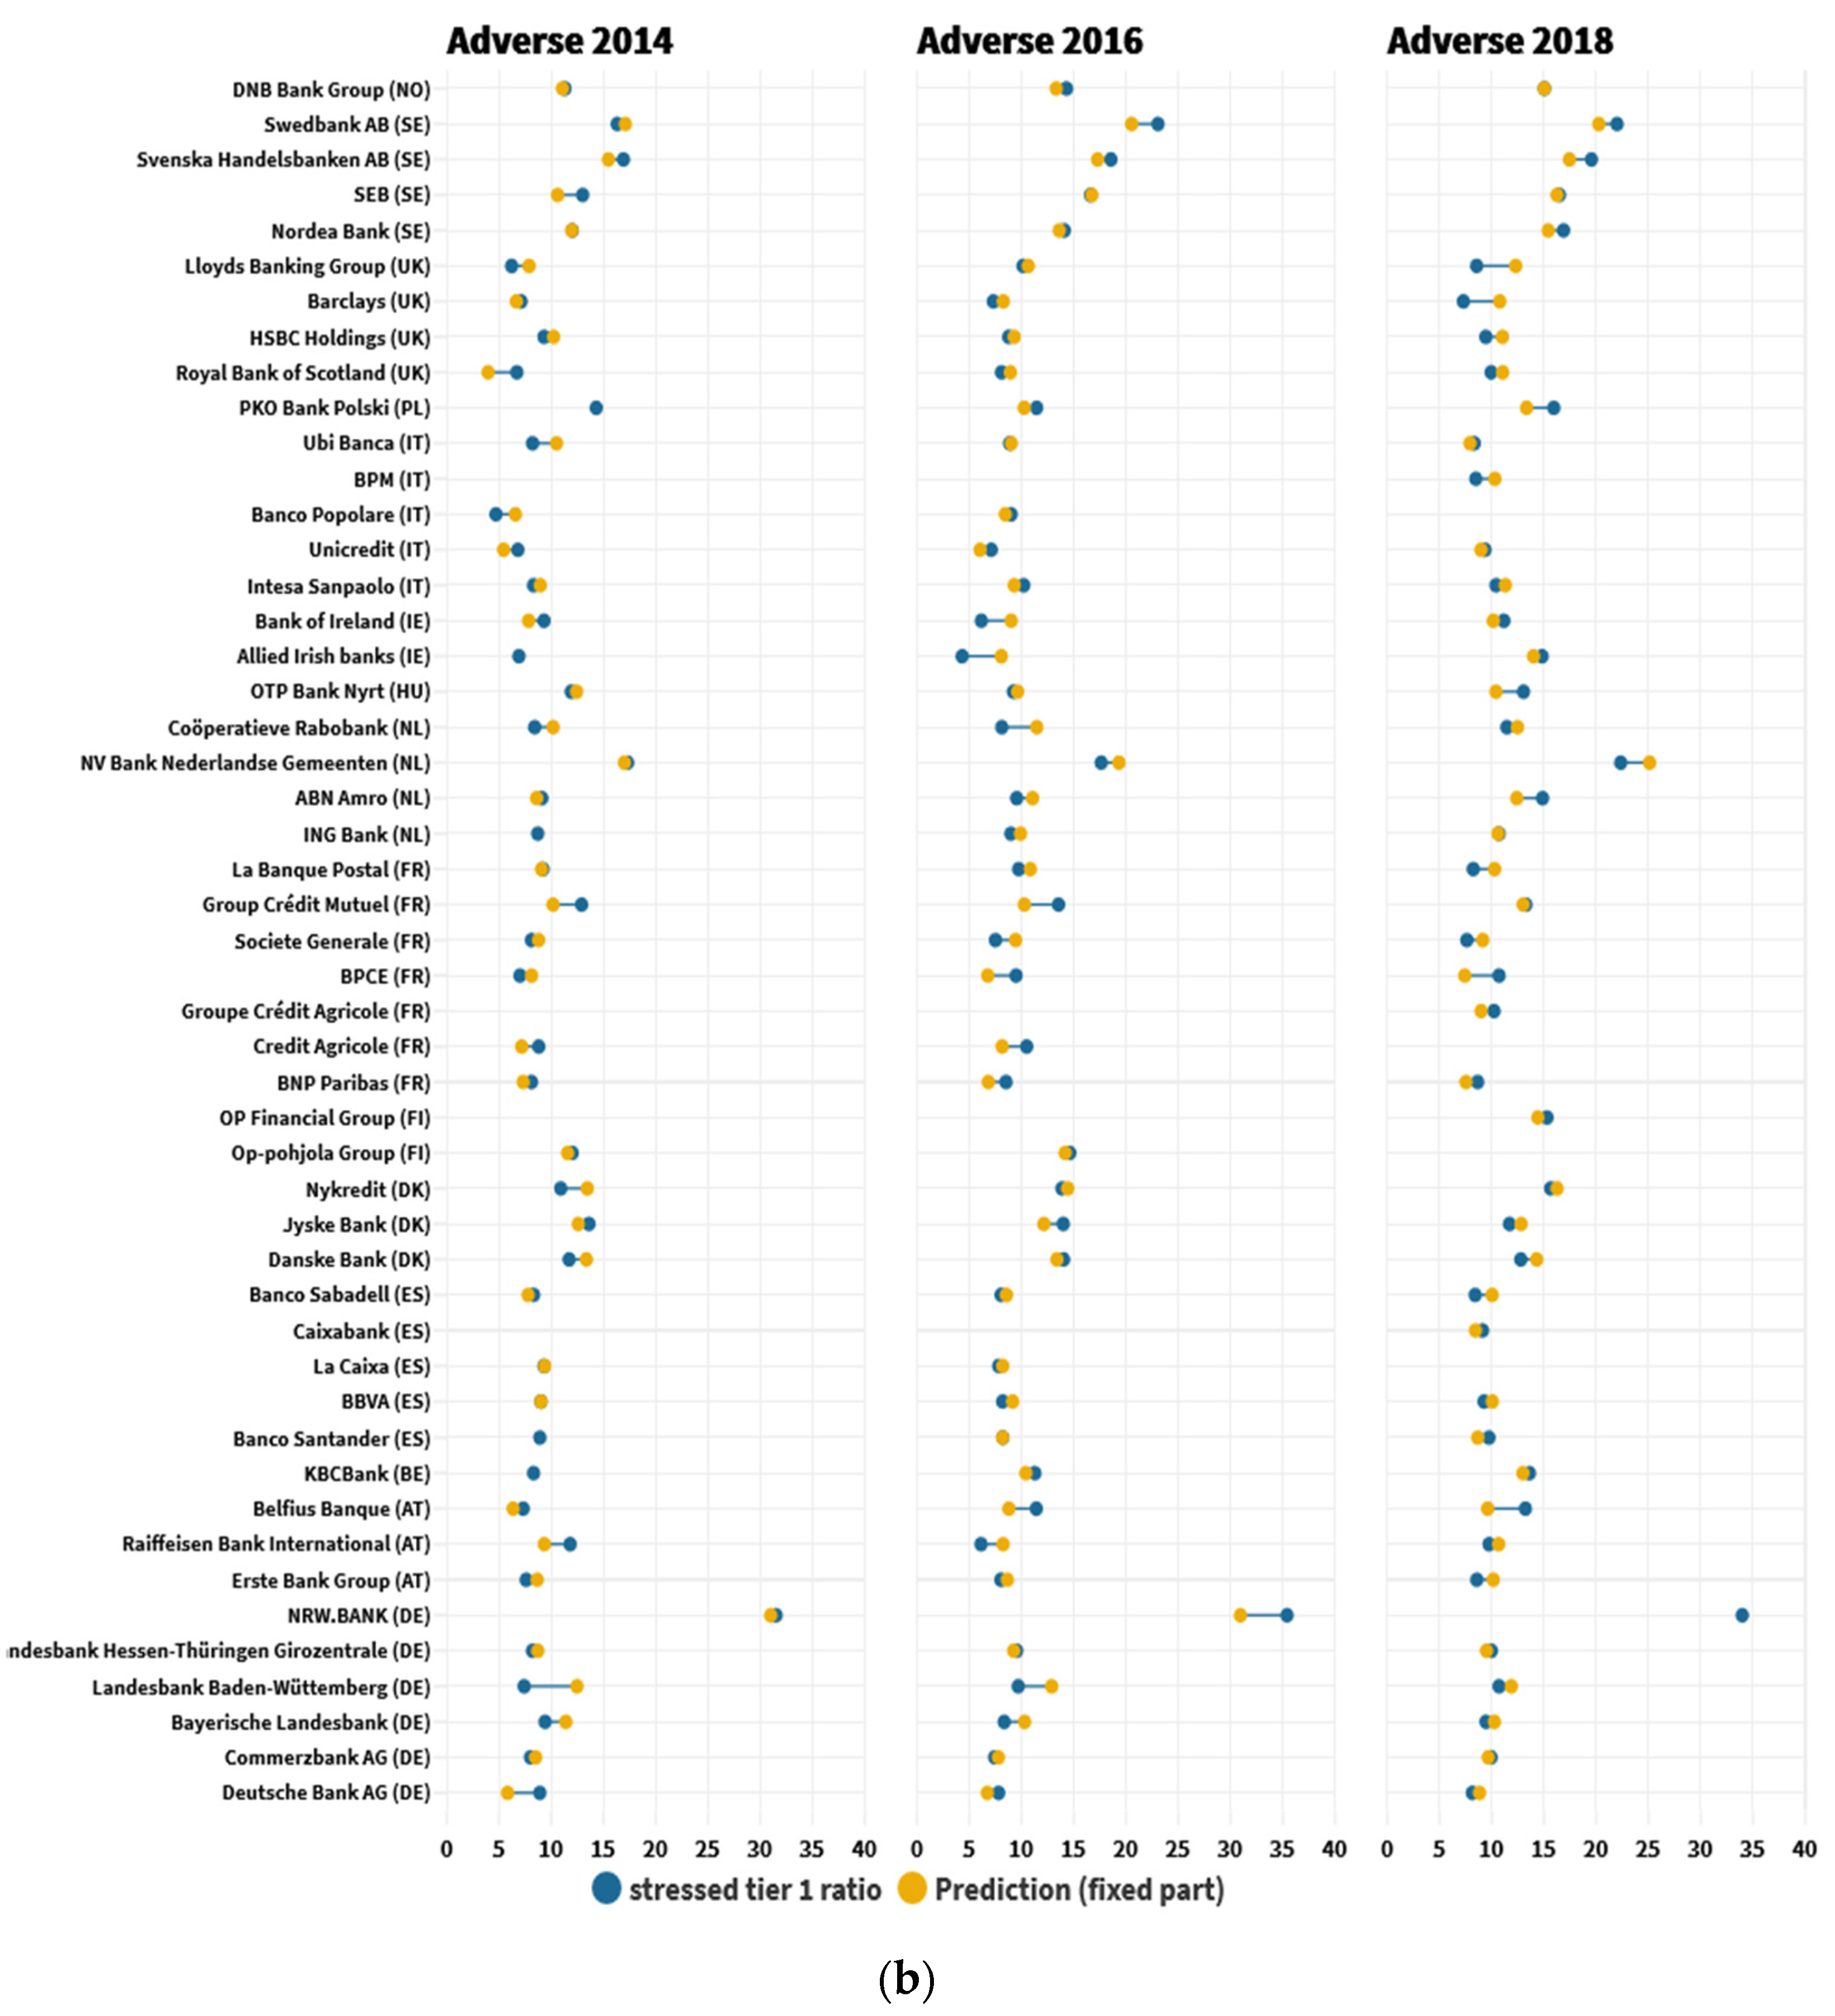
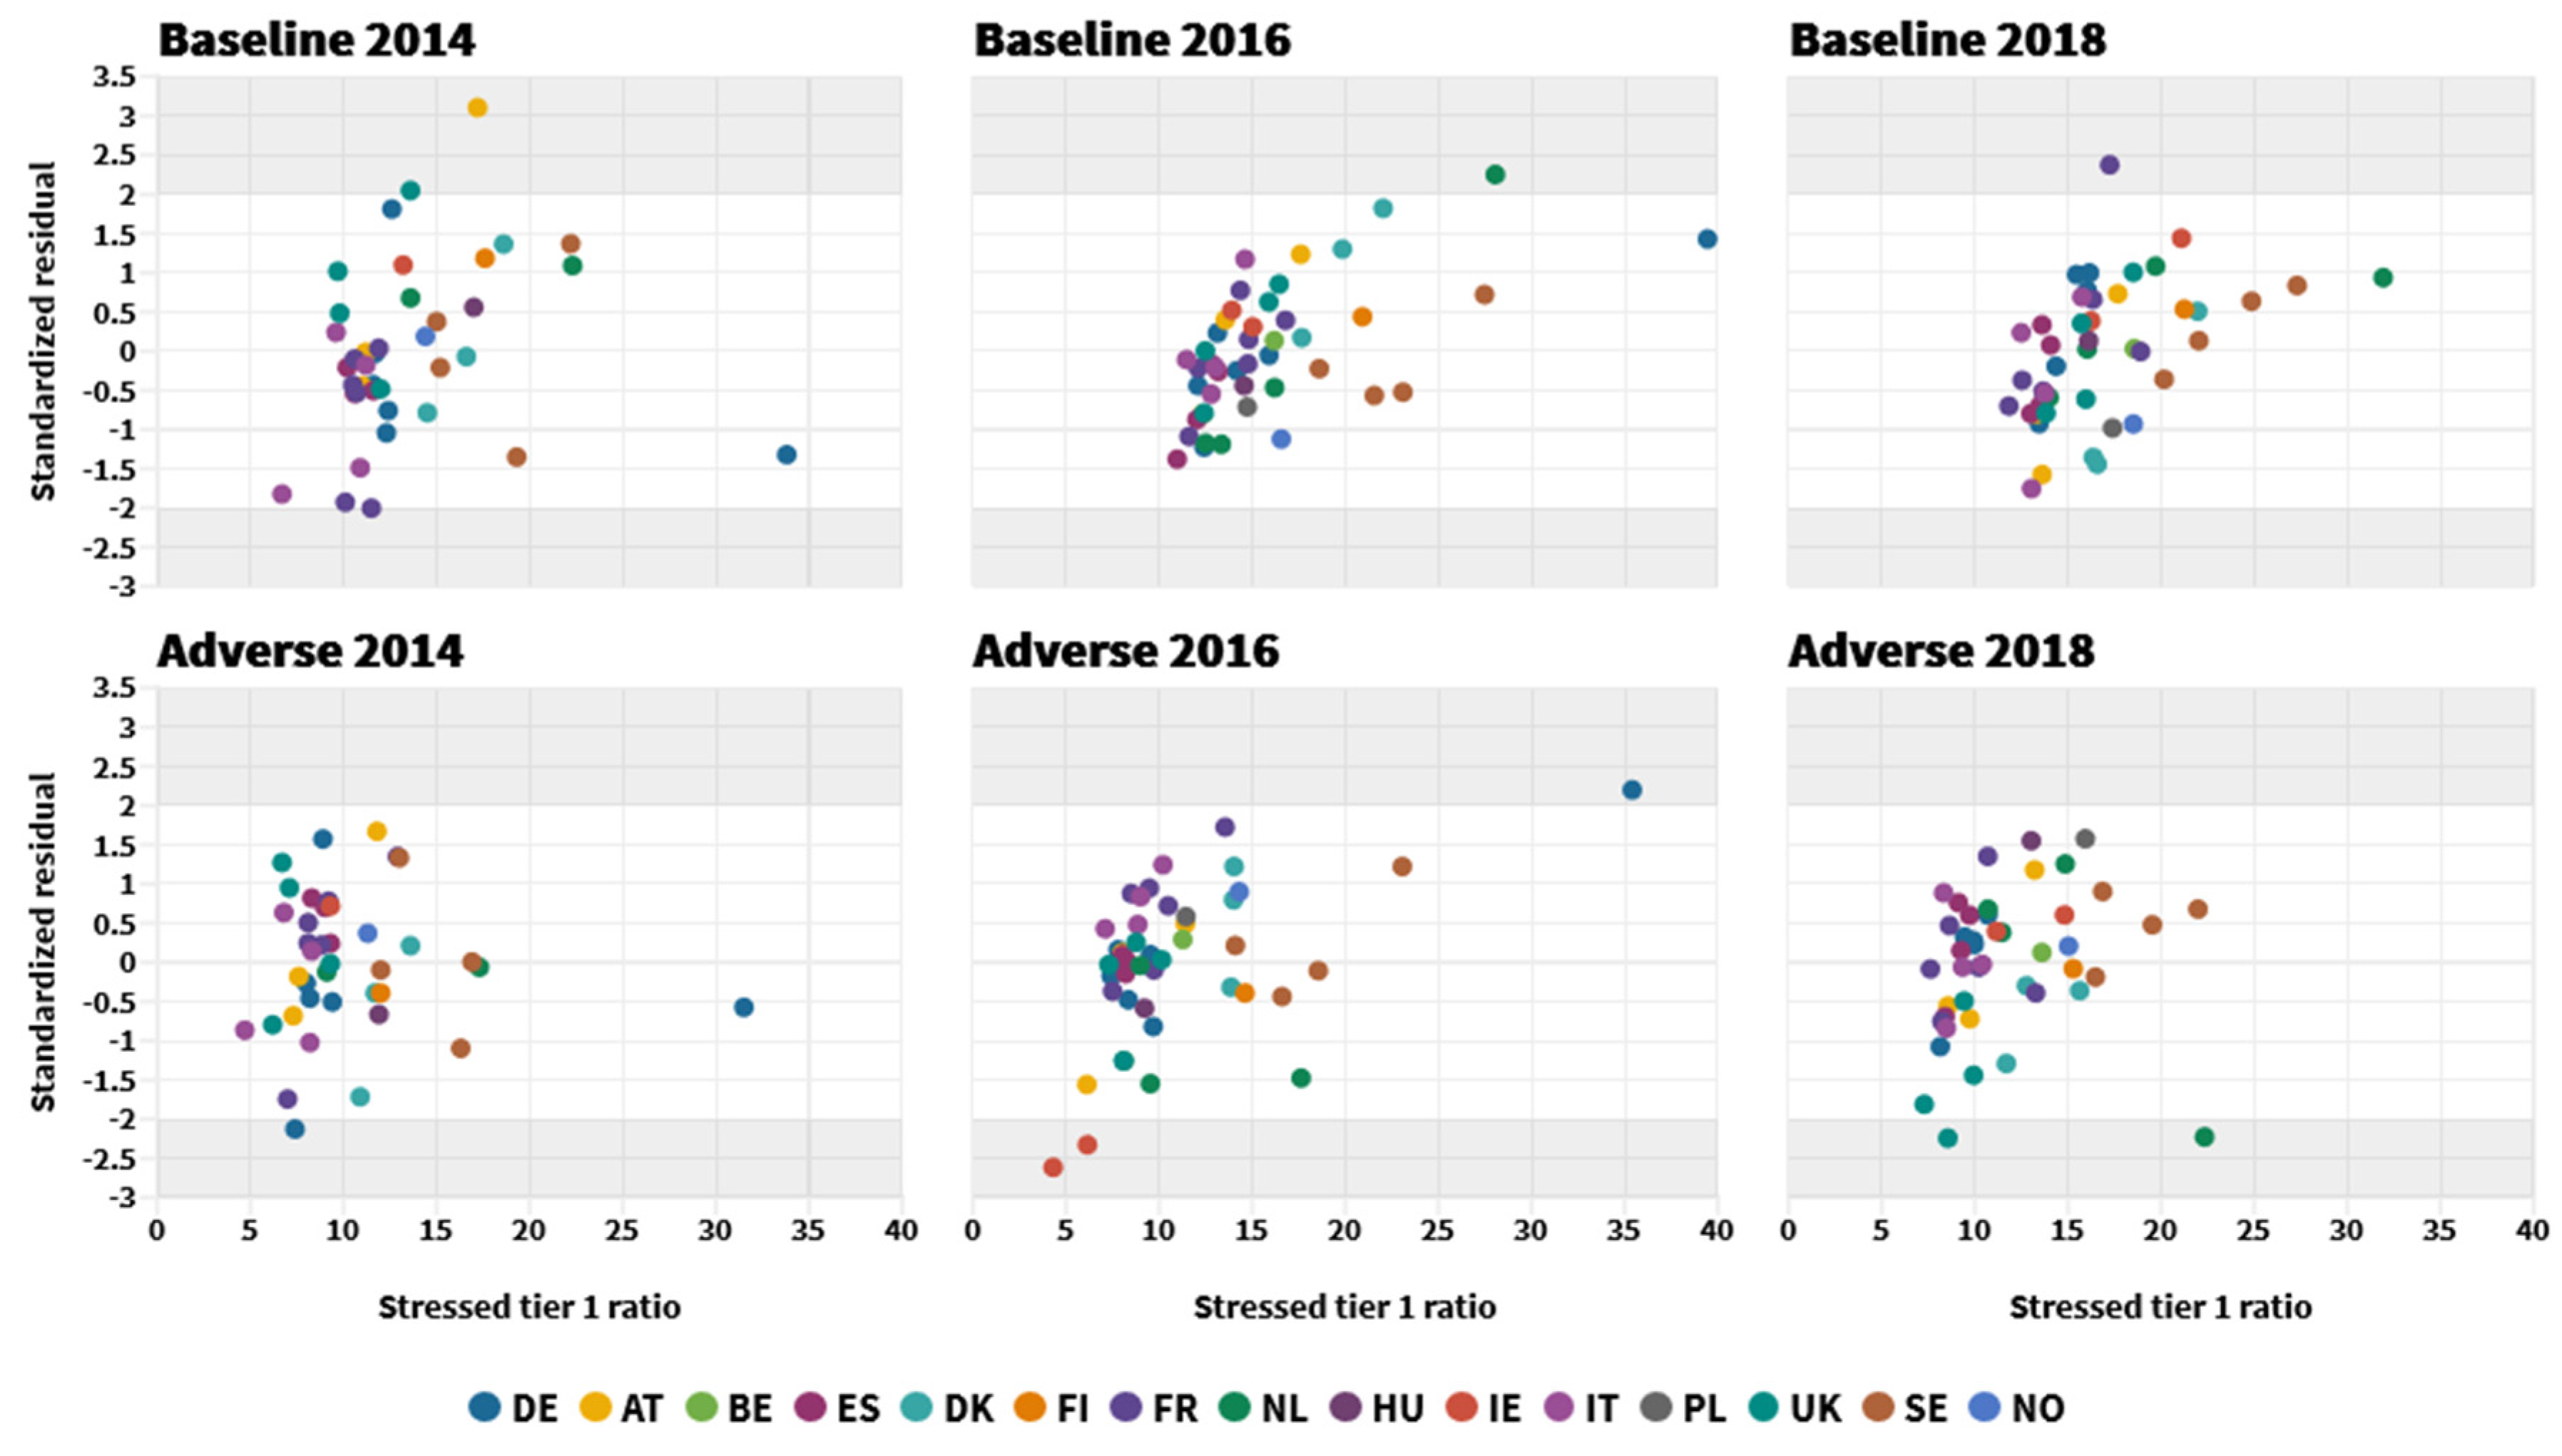
4. Results

Table 5 shows the estimated coefficients, standard errors (SE) and goodness-of-fit measures for both specifications, as well as for the corresponding null models that do not include any covariates and are used as comparison terms (all the analyses have been performed using Stata 14 [64]).
Firstly, a look at the intra-class correlation coefficients (ICC) corresponding to both null models reveals the multilevel nature of our data: more than 60% of the variation in the dependent variable observations can be attributed to differences between banks. Moreover, the likelihood ratio tests (LR test) also indicate that the variance of the level-2 factors are significantly higher than zero, supporting the adequacy of using a multilevel specification instead of a conventional linear regression. In this respect, it is worth noting that, since banks are also nested in countries, an additional specification in which the countries act as a level-3 factor was also considered (either as a fixed or a random effect), but rejected since the likelihood ratio test did not find a statistically significant difference from the models finally described in this paper.
Secondly, the LR tests also reveal that the inclusion of covariates significantly improves both models in comparison with their corresponding null specifications. The estimated regression coefficients, standard errors and significances for the fixed part will be discussed jointly since are they are quite similar in both models, a similarity that can be envisioned as a good indicator of the robustness of our results. In fact, as a robustness check, apart from using the maximum-likelihood estimator (MLE), whose results are presented in Table 5, the so-called sandwich estimator, which provides standard errors robust to heteroskedasticity and other distributional assumptions, was also used, its results being basically the same as the MLE ones.
Regarding capitalization (C), the coefficients for the two considered proxies are, as expected, positive and statistically significant (particularly the one corresponding to Tier1), thus fully supporting our first hypothesis H1. This result is in line with previous evidence of a positive relation between capitalization and solvency and also sustains that the 2-year forecast for the tier 1 ratio under a stressed scenario is strongly connected with the current tier 1 values.
Concerning assets quality (A), the two proposed variables measure the importance of loan loss reserves (LLR) and NPL to gross loans, thus indicating poor quality assets. While NPL/Loans proves to be non-significant, the sign and significance of the LLR/Loans coefficient reveals a negative impact on bank solvency, supporting hypothesis H2.
A similar situation occurs with respect to management (M), since the coefficient for the only significant variable (cost-to-income ratio) presents the expected negative sign (it represents inefficiency), while asset growth is non-significant. Consequently, hypothesis H3 is also supported.
As regards the impact of earnings (E) on solvency, we hypothesized that better-performing companies should be less likely to be distressed in the future, and both OpIncome and ROA coefficients signs support this rationale (although only the former is statistically significant). However, even though the coefficient for return on equity, which is not significant, is negative, it could be argued that the lower the equity, the higher the return for shareholders, but not necessarily for the company. Consequently, hypothesis H4 is not fully supported, owing to the lack of significance of ROA and ROE.
The conclusions related to the two liquidity (L) hypotheses are also mixed: while the proportion of liquid assets to deposits is significant and has the expected positive sign according to hypothesis H5B, our data do not support hypothesis H5A, since the two proxies considered show opposite signs and none of them is statistically significant.
As far as sensitivity (S) is concerned, H6 is rejected since the coefficient for Interbank is positive, contrary to expectations, though not significantly different from zero.
In general terms, these results support the proposed hypotheses (except for sensitivity to market risk) and confirm that variables in a CAMEL model can predict the stressed capital tier 1 ratio. These findings are in line with previous evidence supporting that bank solvency positively correlates with capital [32,42,44,46,48,49] and profitability [44,49,51,52,65], while it correlates negatively with assets quality when NPL and losses are significant [49,50,65]. Inefficiency is also significant and influences solvency in a negative way, as previous papers sustained [42,49,50,52], while liquidity according to buffers in line with the Basel rules reinforces soundness.
Besides the CAMELS financial ratios, our data reveal that the buffer required for G-SIFIs also has a significant and negative impact on the stressed tier 1 ratio EBA forecast, while being a bank established in the euro area has a negative but not significant influence on it.
Finally, the hypothesis related to CSR disclosure (H7) is supported, since its coefficient sign is positive, as expected, and highly significant. These findings confirm the general assumption about a positive relationship between banks’ environmental, social and governance policies and financial performance [59,60].
The interaction between years and scenarios reflected through five dummies complete the fixed part of model 1. As shown in Figure 2, under the adverse scenario, the linear prediction for a bank’s stressed capital tier 1 ratio whose covariates were at their respective sample mean is 11.5% in 2014, 11.1% in 2016 and 10.7% in 2018, these figures being statistically non-significant among themselves; however, the corresponding predicted values under the baseline scenarios are, as expected, significantly higher, about 14.9% in 2014, 16.2% in 2016 and 15.8% in 2018, a difference that is also statistically significant.
As regards the random part, the inclusion of significant level-2 (banks) covariates in both models sharply diminishes the variance left to explain at this level, which is the most relevant as noted previously. For this reason, the random-intercept standard deviations corresponding to this level (sd[uj]) are not significantly different from zero in the models with covariates. Likewise, but to a lesser extent, adding the scenario–year combinations as a fixed effect in model 1 reduces the unexplained residual standard deviation at level-1 (sd[eij]). Since no level-1 or scenario–year covariate is included in model 2, there is a minor reduction in the unexplained variances for the random intercept ζi and the error term eij. Consequently, the overall R2, which indicates the proportion of total variance explained by the model compared with the null one, is close to 90% for model 1 and just about 73% for model 2. Breaking down by levels, as [66] suggest, the difference in R2 in favor of model 1 at level-1 is much more evident (82% vs. 26.5%), while it is slightly favorable to model 2 at level-2 (93.6% vs. 94.4%).
Finally, the Akaike and Bayesian Information Criteria (AIC and BIC, respectively) evaluate models in terms of their parsimony as well as their statistical goodness-of-fit. Both indicators show that the fit of both specifications is quite similar and, even though BIC penalizes for extra parameters, model 1 is slightly better than model 2.
In order to obtain a more parsimonious specification and reduce potential multicollinearity, two additional models based on (1) and (2) but excluding statistically non-significant covariates have been also estimated. As shown in Table 6, the coefficients are quite similar to their equivalents in Table 5, but their statistical significances are even better. In fact, the LR test comparing each “reduced model” with its corresponding “extended specification” reveals that they are not significantly different, i.e., including the additional covariates does not improve the models. In fact, according to the Akaike and Bayesian information criteria, the reduced specification of model 1 provides the best fit to our data, so it will be considered our final model.
Figure 3 depicts an individual comparison, broken down by year and scenario, of the actual and fitted values by the final specification, while Figure 4 shows that less than 5% of the standardized residuals can be considered as outliers confirming the high predictive capacity of the model.
Additionally, and as a means of checking the robustness of our results, Table 7 provides the estimates for this final model considering the two scenarios separately and, consequently, splitting the sample in two halves. The results confirm the sign and significance of all the covariates in both scenarios (except for OpIncome in the baseline one). The higher significance and absolute value of the coefficients of Eq/Assets, LLR/Loans, Ineff and OpIncome in the adverse scenario reveals a stronger effect of these explanatory ratios on the stressed tier 1 ratio under worse circumstances, while the influence of SIFI and CSR seems less relevant than in the baseline scenario.

5. Conclusions

Given the importance of banking solvency, European stress tests have been progressively refined to accurately predict how banks would perform in case of adverse macroeconomic conditions. On the basis of financial information, subsequent exercises have forecasted capital adequacy, becoming part of the supervisory process of the banking system, increasing information transparency and strengthening market discipline.
However, the stress testing model is undergoing a continual improvement process (e.g., the initial pass/fail threshold has been discarded since 2016) and it will soon include other aspects such as catastrophe risk imposed by climate change with the subsequent increase in solvency requirements (maybe as an additional buffer).
So far, banks’ economic sustainable actions have been referred to their involvement in the growth of the economy through their lending activity. Unfortunately, this was limited during the financial crisis when both solvency and liquidity problems arose. Searching for benefits does not prevent banks from being sustainable if they act in a responsible way.
This paper has evaluated the predictive capability of classical financial models (CAMELS) by proposing a set of proxies that reflect capitalization, assets quality, management, earnings, liquidity and sensitivity to market risk in a sample that includes all of the European banks submitted to the three stress tests exercises conducted since the European Banking Union has been effective. In doing so, our work extends the previous research on the determinants of bank solvency, choosing a specific period in the aftermath of the financial crisis in Europe, when several measures (e.g., a common regulation, single supervision, single resolution framework and single deposit schemes) have joining forces in search of a real single banking market. Our findings validate the CAMEL capacity for predicting the stressed capital tier 1 ratio, highlighting the importance of financial statements as indicators of financial sustainability.
The explanatory capacity of the current tier 1 for forecasting such a ratio two years ahead is remarkable, and demonstrates how capital adequacy is important no matter how much economic conditions may worsen. On the other hand, inefficiency imposes the most damaging impact on soundness. As has been stated, efficient management is closely related to earnings and assets quality, creating a virtuous cycle of solvency-positive influences.
Our findings clearly support the financial variables’ influence on solvency according to a CAMEL model as well as confirm the need for systemic banks to keep additional capital as regulation demands. They also reflect how the marginal effect of the adverse scenario on the stressed tier 1 ratio was more relevant in 2016 and 2018 than in 2014, while the influence of the euro-area was not significant.
In conclusion, our results could be important for regulatory and supervisory authorities for several reasons. First, monitoring specific financial indicators is essential to distinguish between sound and distressed banks. Higher capitalization and earnings ratios combined with higher proportion of liquid assets clearly reinforce banking solvency and lead to better results in stress test exercises. On the contrary, a high proportion of NPL and cost-to-income ratio are signals of financial weakness. These findings are in line with the main contents of current financial regulations and help anticipate banks in trouble, thus avoiding resolution or recapitalization decisions and the corresponding costs of both actions.
Second, we have shown how adverse potential scenarios can impact banks, thus requiring them to keep higher levels of capital. Our findings highlight capitalization, assets quality, management and earnings as the explanatory variables whose relevance increases in the adverse scenario. Indeed, such deterioration in macroeconomic conditions imposes higher costs to banking companies, undermines their profitability and efficiency and limits the credit flow to businesses and families. This behavior is behind the reasons for strengthening regulation, especially in the European context.
Third, the European Banking Union has not proved yet to benefit their members in comparison with the rest of European countries in terms of bank solvency. Actually, this has been the only variable with no influence on the results. However, the potential effects of this project are beyond banking solvency supervision and include other aspects that stress test exercises do not account for: common deposit guarantee schemes or resolution frameworks. At any rate, these exercises enhance market discipline and their results complement other roles played by the European Central Bank as a single supervisor. It could be said that these other pillars refer equally to social and financial sustainability.
Fourth, these results reveal that banks contribute more to financial soundness when they are socially and environmental responsible, and support the general literature about the positive connection between their financial performance and CSR, proving that CSR activities help them restore public image and inspiring confidence and soundness. However, the influence of this aspect does not increase when economic conditions worsen.
Finally, our results are useful to reinforce current regulations putting emphasis on the same concerns. Future changes in banking competition will bring new challenges that will force banks to respond and also offer them new opportunities. Whatever those changes are, financial sustainability must be ensured.
Since only 46 banks have taken part in the three stress tests under analysis, our study presents limitations because of the small sample size. Firstly, we discarded the including of additional macroeconomic covariates to describe the two alternate scenarios. Secondly, missing data in some of the proposed explanatory variables did not allow us to evaluate more options as CAMELS proxies.
Future research could investigate if these findings hold in other geographical regions where stress tests are performed regularly, such as the US. Moreover, the influence of CSR on banking soundness and credibility can be quantified by analyzing the contents of sustainability reports instead of their mere disclosure, thus proposing a full sustainability approach that improves traditional models.

Author Contributions

C.G.-L. and J.A.-G. contributed equally to the paper. All authors have read and agreed to the published version of the manuscript.

Acknowledgments

We are grateful to four reviewers for their comments, which have been very helpful in improving the manuscript. The usual disclaimer applies.

Conflicts of Interest

The authors declare no conflict of interest.

Appendix A

Table A1. Sample of banks by countries.
CountryBank
GermanyDeutsche Bank AG
Commerzbank AG
Bayerische Landesbank
Landesbank Baden-Wüttemberg
Landesbank Hessen-Thüringen Girozentrale
NRW.BANK
AustriaErste Bank Group
Raiffeisen Bank International
Belfius Banque
BelgiumKBCBank
SpainBanco Santander
BBVA
La Caixa
Banco Sabadell
DenmarkDanske Bank
Jyske Bank
Nykredit
FinlandOp-pohjola Group
FranceBNP Paribas
Credit Agricole
BPCE
Societe Generale
Group Crédit Mutuel
La Banque Postal
The NetherlandsING Bank
ABN Amor
NV Bank Nederlandse Gemeenten
Coöperatieve Rabobank
HungaryOTP Bank Nyrt
IrelandAllied Irish banks
Bank of Ireland
ItalyIntesa Sanpaolo
Unicredit
Banco Popolare
Ubi Banca
PolandPKO Bank Polski
The UKRoyal bank of Scotland
HSBC Holdings
Barclays
Lloyds banking group
SwedenNordea Bank
SEB
Svenska Handelsbanken AB
Swedbank AB
Table A2. Sample descriptive statistics by year.
VariableYearObs.MeanStd. Dev.MinMax
Y (baseline scenario)20144513.5874.5396.733.8
20164516.1185.32810.9739.44
20184517.4155.32811.8339.92
Y (adverse scenario)20144510.1984.3154.731.5
20164510.9855.2264.3135.4
20184512.3004.9377.2833.96
Eq/Assets2013456.1502.5052.6114.54
2015456.4802.2322.513.27
2017456.8132.4473.0115.11
Tier120134114.4735.8158.644.04
20154515.8395.6829.842.82
20174517.4255.87510.341.34
LLR/Loans2013443.8834.1570.0520.63
2015453.1263.2210.0515.78
2017442.2742.2030.049.56
NPL/Loans2013447.2236.8850.0934.92
2015455.6805.5990.1424.02
2017444.1974.0890.0319.52
Ineff20134563.80814.63217.5798
20154562.25615.02222.65112.52
20174560.28417.245-3.2993.29
AssetGrw201345−0.0180.072−0.1830.225
201545−0.1140.072−0.2630.145
2017450.1420.116−0.2170.562
OpIncome2013450.9550.5720.022.54
2015450.9270.5690.033.4
2017450.9380.4970.112.96
ROE2013453.3417.930−27.0712.84
2015456.3664.463−10.0116.69
2017458.0734.393−1.3521.79
ROA2013450.1830.537−1.611.62
2015450.4080.313−0.421.34
2017450.5560.408−0.082.13
Loan/Dep20134596.94947.70532.41280.98
20154599.96750.97837.6325.64
20174598.28756.42743.66352.51
Loan/TDep20134561.44116.98826.4189.91
20154562.66315.90829.4290.31
20174564.49515.78231.7592.19
LiqAssets/Dep20134540.80722.7325.39100.99
20154538.56220.9042.22100.11
20174539.55220.8226.07100.31
Interbank20134599.38986.9157.65443.6
201545106.77094.85516.87449.34
20174597.245105.6349.77571.77
SIFI2013450.4110.70502.5
2015450.3670.67402.5
2017450.3110.58302
SCR2013450.6890.46801
2015450.8000.40501
2017450.9330.25201
Euro2013–2017450.6890.46601

References

  1. Ballate, A. Shaping Our World for a Better Tomorrow: Sustainable Investing, ESG, and Industry Insight. In Independent Study Project Collection, 2805. 2018. Available online: https://digitalcollections.sit.edu/isp_collection/2805 (accessed on 18 October 2019).
  2. Jeucken, M.; Bouma, J. The changing environment of banks. In Sustainable Banking; Bouma, J., Jeucken, M., Klinkers, L., Eds.; Routledge: London, UK, 2017. [Google Scholar]
  3. Rebai, S. New Banking Performance Evaluation Approach: Sustainable Finance and Sustainable Banking. Ph.D. Thesis, Higher Institute of Management, University of Tunis, Tunis, Tunisia, 2014. [Google Scholar]
  4. European Banking Authority (EBA). Joint Committee Report on Risks and Vulnerabilities in the EU Financial System; EBA: London, UK, April 2018. [Google Scholar]
  5. Raut, R.; Cheikhrouhou, N.; Kharat, M. Sustainability in the banking industry: A strategic multi-criterion analysis. Bus. Strategy Environ. 2017, 26, 550–568. [Google Scholar] [CrossRef]
  6. Sofian, I.; Dumitru, M. The compliance of the integrated reports issued by European financial companies with the international integrated reporting framework. Sustainability 2017, 9, 1319. [Google Scholar] [CrossRef] [Green Version]
  7. Fijałkowska, J.; Zyznarska-Dworczak, B.; Garsztka, P. Corporate social-environmental performance versus financial performance of banks in Central and Eastern European countries. Sustainability 2018, 10, 772. [Google Scholar] [CrossRef]
  8. Forcadell, F.J.; Aracil, E. European banks’ reputation for corporate social responsibility. Corp. Soc.-Responsib. Environ. Manag. 2017, 24, 1–14. [Google Scholar] [CrossRef]
  9. Rebai, S.; Azaiez, M.N.; Saidane, D. A multi-attribute utility model for generating a sustainability index in the banking sector. J. Clean. Prod. 2016, 113, 835–849. [Google Scholar] [CrossRef]
  10. Jan, A.; Marimuthu, M. Bankruptcy and Sustainability: A Conceptual Review on Islamic Banking Industry. Glob. Bus. Manag. Res. 2015, 7, 109–138. [Google Scholar]
  11. European Banking Authority (EBA). 2014 EU-Wide Stress Test Results. 2014. Available online: https://eba.europa.eu/risk-analysis-and-data/eu-wide-stress-testing/2014 (accessed on 2 November 2019).
  12. European Banking Authority (EBA). 2016 EU-Wide Stress Test Results. 2016. Available online: https://eba.europa.eu/risk-analysis-and-data/eu-wide-stress-testing/2016 (accessed on 2 November 2019).
  13. European Banking Authority (EBA). 2018 EU-Wide Stress Test Results. Available online: https://eba.europa.eu/risk-analysis-and-data/eu-wide-stress-testing/2018 (accessed on 2 November 2019).
  14. Basel Committee on Banking Supervision. Basel III: A Global Regulatory Framework for More Resilient Banks and Banking Systems; Bank for International Settlements: Basel, Switzerland, 2010; Available online: https://www.bis.org/publ/bcbs189_dec2010.htm (accessed on 16 October 2019).
  15. Basel Committee on Banking Supervision. Basel III: Finalizing Post-crisis Reforms; Bank for International Settlements: Basel, Switzerland, 2017; Available online: https://www.bis.org/bcbs/publ/d424.htm (accessed on 24 February 2020).
  16. International Monetary Fund; Bank for International Settlements; Financial Stability Board. Guidance to Assess the Systemic Importance of Financial Institutions, Markets and Instruments: Initial Considerations. 2009. Available online: https://www.imf.org/external/np/g20/pdf/100109.pdf (accessed on 27 October 2019).
  17. Pongini, P.; Nieri, L.; Pelagatti, M. The importance of being systemically important financial institutions. J. Bank. Financ. 2015, 50, 562–574. [Google Scholar] [CrossRef]
  18. Baker, C.; Cummings, C.; Jagtiani, J. The impacts of financial regulations: Solvency and liquidity in the post-crisis period. J. Financ. Regul. Compliance 2017, 25, 253–270. [Google Scholar] [CrossRef] [Green Version]
  19. Dewatripont, M. European banking: Bailout, bail-in and state aid control. Int. J. Ind. Organ. 2014, 34, 37–43. [Google Scholar] [CrossRef]
  20. Boccuzzi, G.; De Lisa, R. Does bail-in definitely rule out bailout? J. Financ. Manag. Mark. Inst. 2017, 1, 93–110. [Google Scholar]
  21. Čihák, M. Introduction to Applied Stress Testing; IMF Working Paper; Monetary and Capital Markets Department: Washington, DC, USA, 2007. [Google Scholar]
  22. Petrella, G.; Resti, A. Supervisors as information producers: Do stress test reduce bank opaqueness? J. Bank. Financ. 2013, 37, 5406–5420. [Google Scholar] [CrossRef]
  23. Nieto, M. Banks and Environmental Sustainability: Some Reflections from the Perspective of Financial Stability; CEPS: Brussels, Belgium, 2017. [Google Scholar]
  24. Henry, P.B. Capital account liberalization, the cost of capital, and economic growth. Am. Econ. Rev. 2003, 93, 91–96. [Google Scholar] [CrossRef] [Green Version]
  25. Beck, T.; Demirguc-Kunt, A.; Laeven, L.; Levine, R. Finance, firm size, and growth. J. Money Credit Bank. 2008, 40, 1379–1405. [Google Scholar] [CrossRef] [Green Version]
  26. Aghion, P.; Angeletos, G.M.; Banerjee, A.; Manova, K. Volatility and growth: Credit constraints and the composition of investment. J. Monet. Econ. 2010, 57, 246–265. [Google Scholar] [CrossRef] [Green Version]
  27. Laeven, L.; Valencia, F. Systemic Banking Crises: A New Database; Working Papers 08/224; International Monetary Fund: Washington, DC, USA, 2008. [Google Scholar]
  28. Gick, W.; Pausch, T. Optimal disclosure of supervisory information in the banking sector. SSRN Electron. J. 2016. [Google Scholar] [CrossRef]
  29. Goldstein, I.; Sapra, H. Should banks’ stress test results be disclosed? An analysis of the costs and benefits. Found. Trends® Financ. 2014, 8, 1–54. [Google Scholar] [CrossRef]
  30. Alfaro, R.A.; Drehmann, M. Macro stress tests and crises: What can we learn? BIS Q. Rev. 2009, 29–41. Available online: https://www.bis.org/publ/qtrpdf/r_qt0912e.htm (accessed on 16 October 2019).
  31. Acharya, V.; Engle, R.; Pierret, D. Testing macroprudential stress tests: The risk of regulatory risk weights. J. Monet. Econ. 2014, 65, 36–53. [Google Scholar] [CrossRef] [Green Version]
  32. Kolari, J.W.; López-Iturriaga, F.J.; Pastor Sanz, I. Predicting European bank stress tests: Survival of the fittest. Glob. Financ. J. 2019, 39, 44–57. [Google Scholar] [CrossRef]
  33. Dabos, M.; Sosa Escudero, W. Explaining and predicting bank failure using duration models: The case of Argentina after the Mexican crisis. Rev. Anal. Econ. 2004, 19, 31–49. [Google Scholar]
  34. Avkiran, N.K.; Cai, L. Predicting Bank Financial Distress Prior to Crises; New Zealand Finance Colloquium: Brisbane, Australia, 2012. [Google Scholar]
  35. Wanke, P.; Barros, C.P.; Faria, J.R. Financial distress drivers in Brazilian banks: A dynamic slacks approach. Eur. J. Oper. Res. 2015, 240, 258–268. [Google Scholar] [CrossRef]
  36. Kraft, E.; Galac, T. Deposit interest rates, asset risk and bank failure in Croatia. J. Financ. Stab. 2007, 2, 312–337. [Google Scholar] [CrossRef]
  37. Weelock, D.C.; Wilson, P.W. Why do banks disappear? The determinants of U.S. bank failures and acquisitions. Rev. Econ. Stat. 2000, 82, 127–138. [Google Scholar] [CrossRef] [Green Version]
  38. Curry, T.J.; Fissel, G.S.; Ramirez, C.D. The impact of bank supervision on loan growth. N. Am. J. Econ. Financ. 2008, 19, 113–134. [Google Scholar] [CrossRef]
  39. Jin, J.Y.; Kanagaretnam, K.; Lobo, G.J. Ability of accounting and audit quality variables to predict bank failure during the financial crisis. J. Bank. Financ. 2011, 35, 2811–2819. [Google Scholar] [CrossRef]
  40. Daley, J.; Matthews, K.; Whitfield, K. Too-big-to-fail: Bank failure and banking policy in Jamaica. J. Int. Financ. Mark. Inst. Money 2008, 18, 290–303. [Google Scholar] [CrossRef] [Green Version]
  41. Arena, M. Bank failures and bank fundamentals: A comparative analysis of Latin America and East Asia during the nineties using bank-level data. J. Bank. Financ. 2008, 32, 299–310. [Google Scholar] [CrossRef] [Green Version]
  42. Paule-Vianez, J.; Gutiérrez-Fernández, M.; Coca-Pérez, J.L. Prediction of financial distress in the Spanish banking system. Appl. Econ. Anal. 2019, 28, 69–87. [Google Scholar] [CrossRef]
  43. Molina, C.A. Predicting bank failures using a hazard model: The Venezuelan banking crisis. Emerg. Mark. Rev. 2002, 3, 31–50. [Google Scholar] [CrossRef]
  44. Poghosyan, T.; Čihak, M. Determinants of bank distress in Europe: Evidence from a new data set. J. Financ. Serv. Res. 2011, 40, 163–184. [Google Scholar] [CrossRef]
  45. Schulte, M.; Winkler, A. Drivers of solvency risk–Are microfinance institutions different? J. Bank. Financ. 2019, 106, 403–426. [Google Scholar] [CrossRef]
  46. Gambetta, N.; García-Benau, M.A.; Zorio-Grima, A. Stress test impact and bank risk profile: Evidence from macro stress testing in Europe. Int. Rev. Econ. Financ. 2019, 61, 347–354. [Google Scholar] [CrossRef]
  47. Nájera-Sánchez, J.J. A Systematic Review of Sustainable Banking through a Co-Word Analysis. Sustainability 2020, 12, 278. [Google Scholar] [CrossRef] [Green Version]
  48. Berger, A.N.; DeYoung, R. Problem loans and cost efficiency in commercial banks. J. Bank. Financ. 1997, 21, 849–870. [Google Scholar] [CrossRef] [Green Version]
  49. Baselga-Pascual, L.; Trujillo-Ponce, A.; Cardone-Riportella, C. Factors influencing bank risk in Europe: Evidence from the financial crisis. N. Am. J. Econ. Financ. 2015, 34, 138–166. [Google Scholar] [CrossRef]
  50. Männasoo, K.; Mayes, D. Explaining bank distress in Eastern European transition economies. J. Bank. Financ. 2009, 33, 244–253. [Google Scholar] [CrossRef]
  51. Trujillo-Ponce, A. What determines the profitability of banks? Evidence from Spain. Account. Financ. 2013, 53, 561–586. [Google Scholar] [CrossRef]
  52. Louzis, D.; Vouldis, A.T.; Metaxas, V. Macroeconomic and bank-specific determinants of non-performing loans in Greece: A comparative study of mortgage, business and consumer loan portfolios. J. Bank. Financ. 2012, 36, 1012–1027. [Google Scholar] [CrossRef]
  53. Fiordelisi, F.; Marques-Ibanez, D.; Molyneux, P. Efficiency and risk in European banking. J. Bank. Financ. 2011, 35, 1315–1326. [Google Scholar] [CrossRef] [Green Version]
  54. Kraft, E.; Jankov, L. Does speed kill? Lending booms and their consequences in Croatia. J. Bank. Financ. 2005, 29, 105–121. [Google Scholar] [CrossRef]
  55. Makri, V.; Tsagkanos, A.; Bellas, A. Determinants of non-performing loans: The case of Eurozone. Panoeconomicus 2014, 61, 193–206. [Google Scholar] [CrossRef] [Green Version]
  56. Acharya, V.; Naqvi, H. The seeds of a crisis: A theory of bank liquidity and risk taking over the business cycle. J. Financ. Econ. 2012, 106, 349–366. [Google Scholar] [CrossRef]
  57. Wanke, P.; Azad, M.A.K.; Barros, C.P. Financial distress and the Malaysian dual baking system: A dynamic slacks approach. J. Bank. Financ. 2016, 66, 1–18. [Google Scholar] [CrossRef]
  58. Kerstein, J.; Kozberg, A. Using accounting proxies of proprietary FDIC ratings to predict bank failures and enforcement actions during the recent financial crisis. J. Account. Audit. Financ. 2013, 28, 128–151. [Google Scholar] [CrossRef]
  59. Cornet, M.M.; Erhemjamts, O.; Tehranian, H. Greed or good deeds: An examination of the relation between corporate social responsibility and the financial performance of US commercial banks around the financial crisis. J. Bank. Financ. 2016, 70, 137–159. [Google Scholar] [CrossRef]
  60. Laguir, I.; Marais, M.; El Baz, J.; Stekelorum, R. Reversing the business rationale for environmental commitment in banking: Does financial performance lead to higher environmental performance? Manag. Decis. 2018, 56, 358–375. [Google Scholar] [CrossRef]
  61. Gemar, P.; Gemar, G.; Guzman-Parra, V. Modeling the Sustainability of Bank Profitability Using Partial Least Squares. Sustainability 2019, 11, 4950. [Google Scholar] [CrossRef] [Green Version]
  62. Rabe-Hesketh, S.; Skrondal, A. Multilevel and Longitudinal Modeling Using Stata. Volume I: Continuous Responses, 3rd ed.; Stata Press: College Station, TX, USA, 2012. [Google Scholar]
  63. Snijders, T.A.B.; Bosker, R.J. Multilevel Analysis. An Introduction to Basic and Advanced Multilevel Modeling, 2nd ed.; Sage: London, UK, 2012. [Google Scholar]
  64. StataCorp. Stata Statistical Software: Release 14; StataCorp LP: College Station, TX, USA, 2015. [Google Scholar]
  65. Abad-González, J.; Gutiérrez-López, C.; Salvador, A. Banking solvency determinants in the EU: A model based on stress tests. Appl. Econ. Lett. 2018, 25, 1296–1300. [Google Scholar] [CrossRef]
  66. Raudenbush, S.W.; Bryk, A.S. Hierarchical Linear Models: Applications and Data Analysis Methods, 2nd ed.; Sage: Thousand Oaks, CA, USA, 2002. [Google Scholar]
Figure 1. Illustration of nested structure vs. crossed-classified structure: (a) In a nested model, the level-1 observations (one per each bank–year–scenario combination) are nested within the level-2 observations (banks). (b) In a crossed-classified model, the level-1 observations are simultaneously nested within banks and within year-scenarios.
Sustainability 12 02566 g001
Figure 2. Predictive margins of year–scenario fixed effects with 95% confidence intervals.
Sustainability 12 02566 g002
Figure 3. Individual and by-year comparison of the actual and fitted values under the (a) baseline scenario and (b) adverse scenario.
Sustainability 12 02566 g003aSustainability 12 02566 g003b
Figure 4. Scatterplot of the standardized residuals vs. the dependent variable, by scenario and year.
Sustainability 12 02566 g004
Table 1. Comparison of EU-wide stress test exercises 1.
Year201420162018
Number of banks1235148
CoverageAbout 70% of the EU banking sector
Individual prerequisitesCovering at least 50% of the national banking sectorTo be included in the sample, banks have to have a minimum of EUR 30 bn in assets.The euro area is considered as a single jurisdiction, and smaller banks in some countries are not included but controlled by the ECB’s stress tests
Number of countries221515
Threshold (core equity tier 1 ratio)8% Baseline scenario
5.5% Adverse scenario
Non-applicable
Adverse scenario
GDP deviation from the baseline level−2.2% (2014)
−5.6% (2015)
−7% (2016)
−1.2% (2016)
−1.3% (2017)
0.7% (2018)
−1.2% (2018)
−2.2% (2019)
0.7% (2020)
Other factors
-
An increase in global bond yields amplified by an abrupt reversal in risk assessment (especially in emerging market economies)
-
A further deterioration of credit quality in countries with feeble demand
-
Stalling policy reforms jeopardizing confidence in the sustainability of public finances
-
Lack of necessary bank balance sheet repair to maintain affordable market funding.
-
Abrupt reversal of compressed global risk premia, amplified by low secondary market liquidity
-
Weak profitability prospects for banks and insurers in a low nominal growth environment, amid incomplete balance sheet adjustments
-
Rising of debt sustainability concerns in the public and non-financial private sectors
-
Prospective stress in a rapidly growing shadow banking sector, amplified by spillover and liquidity risk.
-
Abrupt and sizeable reprising of risk premia in global financial markets
-
Adverse feedback loop between weak bank profitability and low nominal growth, amid structural challenges in the EU banking sector
-
Public and private debt sustainability concerns (potential reprising of risk premia and increased political fragmentation)
-
Liquidity risks in the non-bank financial sector with potential spillovers to the broader financial system.
Specific concernsCapital shortfallsMarket and liquidity risksImplementation of new accounting standards on financial instruments (IFRS 9) and their effects on credit risk
1 Own elaboration based on EBA (2014, 2016, 2018) on [11,12,13].
Table 2. Distribution of the banks in the final sample by country and stress test exercise 1.
YearATBEDEDKESFIFRHUIEITNLNOPLSEUKTotal
201330633161142104439
201531634161244114445
201731534161244114444
1 In 2013, the six banks with missing data are KBCBank (BE), Banco Santander (ES), Allied Irish Banks (IE), ING Bank (NL), Coöperatieve Rabobank (NL) and PKO Bank Polski (PL). In 2017, the only bank with missing data is NRW.BANK (DE).
Table 3. CAMELS ratios considered as potential explanatory variables.
GroupAcronymsVariablesSignReferences
CEq/AssetsEquity/Total assets+[32,42,46]
CCap/AssetsCapital Funds/Total assets+[49,50,61]
CTier1TIER 1+[42,61]
ALLR/LoansLoan loss reserves/Gross loans[46,61]
ANPL/LoansNon-performing or impaired loans/Gross loans[32,42,61]
ANCO/LoansNet-charge offs/Gross loans[42]
MINEFFCost/Income ratio[42,49,50,52]
MAssetGrwTotal Assets growth%[32,42]
EOpIncomeOther operating income/Assets +[32,42]
EROENet Income/Equity+[32,42,61]
EROANet Income/Total assets+[42,44,49,61]
EPayOutDividend Payout +[61]
LLoan/DepNet Loans/(Deposits + Short term funding)[32]
LLoan/TDepNet Loans/(Total Deposits + Borrowing)[42]
LLiqAssets/DepLiquid Assets/(Deposits + Short term funding)+[42]
SInterBankInterbank Assets/Liabilities[32,42]
SPERPrice-earnings ratio[32,42]
Table 4. Descriptive statistics of the pooled sample 1.
VariableObs.MeanStd. Dev.MinMax
Y (baseline scenario)13515.7075.28716.739.92
Y (adverse scenario)13511.1614.8834.3135.4
Eq/Assets1356.4812.4082.515.11
Tier113115.9565.9038.644.04
LLR/Loans1333.0953.3500.0420.63
NPL/Loans1335.7005.7640.0334.92
Ineff13562.11615.7130−3.29112.52
AssetGrw1350.0030.1383−0.2630.562
OpIncome1350.9400.5460.023.4
ROE1355.9266.145−27.0721.79
ROA1350.38230.455−1.612.13
Loan/Dep13598.40151.74632.41352.51
Loan/TDep13562.86616.25426.4192.19
LiqAssets/Dep13539.64021.4842.22100.99
Interbank135101.13596.0167.65571.77
SIFI1350.36300.65602.5
Euro1350.68890.46501
CSR1350.80740.395801
1 A breakdown by year of these descriptive statistics can be found in Table A2 in the Appendix A.
Table 5. Model comparison 1.
Model 1Model 2
Null ModelWith CovariatesNull ModelWith Covariates
Coeff.SECoeff.SECoeff.SECoeff.SE
N256 256 256 256
Log-likelihood−723.0 −483.9 −591.3 −500.4
Degrees of freedom0 21 0 16
LR test vs. linear model129.03*** 32.15*** 392.42*** 268.71***
LR test vs. null model 478.21*** 181.92***
FIXED PART
  Intercept13.492***0.6745.789**2.38813.419***1.2934.2702.612
 CEq/Assets 0.294**0.139 0.294**0.141
 CTier1 0.585***0.047 0.585***0.047
 ALLR/Loans −0.337**0.152 −0.336**0.153
 ANPL/Loans 0.0280.084 0.0270.085
 MIneff −0.044***0.014 −0.044***0.014
 MAssetGrw 0.1061.569 0.06261.568
 EOpIncome 0.770*0.459 0.771*0.464
 EROE −0.0530.088 −0.0530.089
 EROA 0.5881.339 0.5941.354
 LLoan/Dep 0.0020.006 0.0020.006
 LLoan/TDep −0.0110.024 −0.0110.024
 LLiqAssets/Dep 0.025*0.013 0.025*0.013
 SInterbank −0.0010.002 −0.0010.002
   SIFI −1.038***0.340 −1.038***0.344
   Euro −0.2530.487 −0.2500.492
   CSR 1.204***0.364 1.202***0.368
   Scenario#year
Baseline-2014 0.000
Baseline-2016 1.326***0.372
Baseline-2018 0.898**0.425
Adverse-2014 −3.362***0.319
Adverse-2016 −3.807***0.372
Adverse-2018 −4.197***0.425
RANDOM PART
  sd(ζi) 2.661***0.7812.307***0.672
  sd(uj)4.299***0.5101.0850.1884.649***0.5061.0960.192
  sd(eij)3.316***0.1621.408***0.0721.662***0.0821.425***0.074
  ICC0.627 0.373 0.912 0.763
GOODNESS-OF-FIT
  Overall R2 0.893 0.728
  Level-2 (bank) R2 0.936 0.944
  Level-1 R2 0.820 0.265
  AIC1452.0 1015.8 1190.7 1040.7
  BIC1462.7 1100.9 1204.8 1111.6
1 Significance levels: *** p < 0.01, ** p < 0.05, * p < 0.10.
Table 6. Comparison of the reduced models 1.
Model 1 (Reduced)Model 2 (Reduced)
Coeff.SECoeff.SE
   N256 256
  Log-likelihood−484.6 −501.0
  Degrees of freedom13 8
  LR test vs. linear model38.34*** 270.32***
  LR test vs. null model476.81*** 180.57***
  LR test vs. complete model1.40 1.36
FIXED PART
  Intercept4.540***1.2272.983*1.557
  CEq/Assets0.331***0.0970.331***0.098
  CTier10.587***0.0390.587***0.040
  ALLR/Loans−0.285***0.071−0.285***0.072
  MIneff−0.041***0.010−0.041***0.011
  EOpIncome0.741*0.4300.740*0.434
  LLiqAssets/Dep0.028***0.0100.028***0.010
   SIFI−0.939***0.289−0.939***0.292
   SCR1.144***0.3491.143***0.353
   Scenario#year
Baseline-20140.000
Baseline-20161.271***0.321
Baseline-20180.857**0.352
Adverse-2014−3.362***0.322
Adverse-2016−3.862***0.321
Adverse-2018−4.328***0.352
RANDOM PART
  sd(ζi) 2.305***0.671
  sd(uj)1.0430.1661.0540.170
  sd(eij)1.421***0.0711.438***0.073
  ICC0.350 0.756
GOODNESS-OF-FIT
  Overall R20.895 0.730
  Level-2 (bank) R2 0.941 0.949
  Level-1 R2 0.816 0.251
  AIC1001.2 1026.1
  BIC1058.0 1068.6
1 Significance levels: *** p < 0.01, ** p < 0.05, * p < 0.10.
Table 7. Estimates of the final model by scenarios 1.
Model 1 (Reduced)Baseline ScenarioAdverse Scenario
Coeff.SECoeff.SE
   N128 128
  Log-likelihood−246.3 −242.7
  Degrees of freedom10 10
  LR test vs. linear model11.11*** 7.29***
FIXED PART
  Intercept4.064***1.5301.0351.443
  CEq/Assets0.239**0.1180.426***0.109
  CTier10.636***0.0490.575***0.046
  ALLR/Loans−0.184**0.089−0.355***0.083
  MIneff−0.037***0.013−0.045***0.013
  EOpIncome0.4020.5251.046**0.481
  LLiqAssets/Dep0.031***0.0120.031***0.011
   SIFI−1.133***0.344−0.703**0.309
   SCR1.122**0.4490.752*0.430
   Year
20140.000 0.000
20161.299***0.317−0.5250.322
20180.925**0.361−0.931***0.360
RANDOM PART
  sd(uj)1.1160.2040.8750.204
  sd(eij)1.378***0.1111.417***0.113
  ICC0.396 0.276
GOODNESS-OF-FIT
  Overall R20.878 0.879
  Level-2 (bank) R2 0.935 0.960
  Level-1 R2 0.717 0.471
  AIC518.5 511.4
  BIC555.6 548.4
1 Significance levels: *** p < 0.01, ** p < 0.05, * p < 0.10.

