1. Introduction
High levels of meat consumption pose severe environmental and health risks. Globally, livestock contribute an estimated 14.5%–18% to the total global warming effect, an amount larger than all of transportation [
1,
2]. Moreover, residents of many developed countries consume far more meat than recommended by those in the medical community [
3,
4]. Meat consumption is also dramatically increasing in emerging markets [
5]. Yet, consumption of large quantities of meat may be a particularly difficult problem to solve. Meat consumption is a well-established and highly visible norm in many developed countries. Such norms can powerfully reinforce behavior [
6]. In contexts where a norm is sustainable, highlighting the behavior of others can promote environmental behaviors like conserving household energy [
7] or water [
8]. However, in the context of meat consumption, particularly where predominant norms reinforce unsustainable behavior, how can we encourage positive change?
Recent research suggests a possible solution: When people are exposed to dynamic norm information, information that a behavior is increasing in prevalence, people may conform to this change and do so even when this change violates the current norm [
9]. Dynamic norms can affect attitudes and behaviors in many domains [
10], including meat consumption [
9]. In one study, people were more motivated to limit their meat consumption after learning that some people were changing and starting to eat less meat, as compared to simply learning about static norm information that some people currently limit how much meat they eat. Further, in a field experiment, patrons waiting in line at a café who completed a survey containing information about a growing number of people who make an effort to eat less meat were twice as likely to order a vegetarian lunch compared to those who only learned about a static norm or a control group (34% as compared to 17% and 21%, respectively). Dynamic norms have also been shown to affect other sustainable behaviors, including reducing water use [
9,
11] and single-use products [
12].
Why might dynamic norms about meat consumption be powerful? In the context of meat consumption, research finds that people infer that the trend to eat less meat will continue and grow in popularity over time, and then conform to this anticipated future norm, a process called pre-conformity [
9]. Further, learning that others have changed leads people to infer that limiting meat consumption is important to others, and this also motivates personal change.
While the café study demonstrates that dynamic norms can reduce meat consumption, it is not feasible to administer surveys conveying dynamic norms to large numbers of people just before they order a meal. How can we communicate dynamic norms about meat consumption in a naturalistic way that could reduce meat consumption on a scale that could become socially and environmentally relevant? Consumers get information about food options through many channels, including menus and web-based ordering platforms. The present research aimed to develop and assess a scalable intervention that integrates dynamic-norm messaging in menus to promote vegetarian choices (dishes containing no meat). If effective, this would provide an inexpensive way to promote sustainable dietary choices among large numbers of people.
Given the effects in prior research, what magnitude of effects might be expected from a scalable dynamic norm intervention in a naturalistic restaurant context? In the prior café field experiment, there was a 13 percentage point increase in vegetarian dishes in the dynamic norm condition. Due to the fact that the dynamic norm was embedded in a survey that required participants’ attention, the vast majority of people targeted by the intervention read the dynamic norm. Moreover, they thoughtfully engaged with it in a written response—actively processing it in a way that could increase engagement and impact. Although menus also provide a low-cost way to reach consumers immediately before they decide what to order, people are not obliged to look at a norm message embedded on a menu—indeed, it could be a distraction from their primary goal of viewing and selecting options. Indeed, given how strongly goals drive attention [
13], we can assume that some people may never see the message. Moreover, when ordering at a restaurant, people often face other distractions, such as conversation and social pressure, to make a decision quickly. Additionally, given that people likely return to the same restaurants repeatedly, many people have known favorite dishes and may not even look at the menu during each visit. Finally, in a menu people receive the dynamic norm in a passive way that does not require them to think about it or respond to it actively. Thus, as compared to the café survey, we expected that fewer people would see the note embedded in a menu, and of those, fewer would think about its contents in a thoughtful manner. Thus, we anticipated the effect size of a menu intervention could be much smaller, perhaps one-quarter or one-third of that found in survey-based field experiment (roughly 4–5 percentage point change).
Would a 4–5 percentage point decrease in meat consumption be meaningful in a restaurant context? Whereas psychologists may rely on generic, lab-based benchmarks to understand effect sizes (e.g.,
d = 0.40 is a “recommended minimum” size for an effect of significance [
14]), these standards are often inappropriate in complex field settings with real-world outcomes that matter. Rather, it is important to benchmark the value of an intervention by the benefits it produces relative to the costs, as compared to other interventions for similar outcomes [
15]. Certainty of effectiveness, potential population impact, feasibility, sustainability, effects on equity, potential side effects, and acceptability have also been identified for judging the promise of a proposed intervention strategy [
16]. One can imagine a variety of strategies to reduce meat consumption: infrastructural changes, large-scale educational campaigns, industry-level subsidies for vegetarian options, etc. As compared to all of these strategies, changing menus or online ordering platforms to encourage more sustainable choices has the potential to be extremely cost-effective and perform favorably on these suggested criteria. In countries like the U.S., restaurant food, including food delivery, accounts for more than one-third of all food consumed, a proportion that continues to grow, suggesting a substantial potential population impact [
17]. By capitalizing on an existing communication system—menus—there is little or no added cost for restaurants that already update their menus and platforms from time to time, making it a feasible, potentially sustainable and acceptable practice for restaurants to implement. Adding dynamic norm messaging to menus is unlikely to produce undesirable side effects, as a shift to less meat ordering may reduce food costs for restaurants and have health benefits for consumers. Moreover, from a purely financial perspective, vegetarian dishes often offer restaurants a higher profit margin [
18,
19]. Thus, in addition to sustainability and health benefits, moving customers from meat-based toward more vegetarian dishes offers restaurants financial value, as well as potential brand value. For all these reasons, even modest reductions in meat consumption would be worth the negligible operating costs.
How would the cost and benefits of such an intervention compare to similar interventions targeting meat consumption in broader dietary contexts? Recent research has begun to compare different experimental interventions aimed at encouraging individuals to reduce their meat consumption [
20]. One study, implemented in a student catering facility, found that providing information about the carbon footprint of various food choices resulted in a 4.8 percentage point reduction in meat dishes labeled with high emissions—but an 11.5 percentage point increase in meat dishes labeled as having low emissions—leading to an estimated 3.6 percentage point reduction in emissions [
21]. In another study, researchers sent daily text messages to undergraduate college students to reduce their red meat consumption, and found a self-reported reduction of roughly 1.5 portions of red meat over the course of a week, but did not assess objective measures or if other meat was substituted for red meat [
22]. Another field experiment on college cafeteria choices found experimental evidence that an intervention that doubled the availability of vegetarian choices, from 25% to 50% of total offerings, increased vegetarian dish selection by 7.8 percentage points, from 19.1% to 26.9% [
23]. While these interventions demonstrate effects that are similar or slightly larger in size than those we would anticipate from restaurant menu messaging, they require significantly greater operational costs, effort, and accommodation, such as repeated daily contact [
22], calculating the carbon footprint of all dishes offered and updating this information as new dishes are introduced [
21], or making extensive changes to offerings [
23].
To our knowledge, a highly scalable intervention with minimal operating costs or effort in the context of decision making in restaurants has not yet been developed. We present results from four field studies in diverse contexts, with over 33,000 food orders that evaluate an intervention that incorporates dynamic norm statements about increasing customer orders of vegetarian dishes in a small note inserted on restaurant menus. After reviewing the results of the field studies, we then conduct a series of online studies to further assess factors influencing intervention effectiveness, and experimentally test specific methods to strengthen this intervention technique.
2. Overview of Field Experiments
All sites chosen for our research had to meet basic requirements, including (1) having a substantial number of vegetarian entrées available (roughly, between one-half and one quarter of total dishes offered), (2) vegetarian entrées were as visible on the menu as entrées containing meat, and (3) vegetarian entrées were clearly labeled so customers would know they did not contain meat. In all studies, vegetarian dishes may contain non-meat animal products (e.g., cheese) and were therefore not necessarily vegan. In this context, if an intervention led customers to intend to order a meatless dish, they could effectively translate that intention into a purchase of an available vegetarian entrée.
While meeting these basic criteria, the four field locations were selected to represent a wide range on food ordering contexts: one is in a fast-dining establishment on a college campus that primarily serves burgers; one in a “virtual restaurant” with online ordering, an emphasis on healthy foods, and lunch delivery for businesses; and two take place at a fine-dining establishment, one during lunch and another during dinner.
Given the diversity of contexts and populations examined here, what kind of heterogeneity could exist in such an intervention? Behavioral interventions are not magic bullets with invariant effects [
24]; rather, their effectiveness depends on qualities that vary in real-world contexts [
25]. A fundamental scientific and applied question is understanding these contexts and mapping how and when qualities in contexts allow a given intervention to change a desired behavior [
26]. As the present intervention uses social norms to motivate behavior change, we generally expect heterogeneity of effects across factors that have been shown to moderate the influence of social norms. First, social norms are more influential when the referent referred to in the norm is like the observer, socially close, or otherwise relevant or important to the target audience [
27,
28]. Given that the norms we use in our interventions pertain to changes in fellow customers’ dietary habits, it may be reasonable to assume that customers with greater connection to other customers at that establishment will respond more.
Second, the influence of social norms has been shown to be stronger for those low in socioeconomic status, and weaker or ineffective for those in high socioeconomic status, in changing both sustainable behavior [
29] and consumer behavior [
30]. One reason why is because people who are higher in socio-economic status perceive their actions as reflecting their autonomous choices [
31] and prefer to make self-determined choices that do not appear to conform to others [
32]. Generally, if norm messages are seen as manipulative or forceful, they can induce a state of “psychological reactance” where people feel their freedom or autonomy is threatened [
33]. In such cases, people may resist and attempt to regain their sense of freedom by refusing external pressures and stand firm on their existing preferences [
34,
35]. Thus, we might expect weaker effects in contexts with wealthier customers, especially when these contexts are associated with wealth and thus draw out this aspect of customers’ selves.
Where possible, we use exploratory analyses to investigate the factors described above—the relevance of the norm referent to consumers, the socioeconomic background of consumers, the socioeconomic context of the study, and the experience of reactance—in our field studies to see whether it appears to impact the effectiveness of our intervention.
3. Study 1: A Field Experiment at a Campus Sports Cafe
This study investigates the effects of a menu-based dynamic norm intervention in the “fast-casual” dining context of a college campus sports café that primarily serves burgers, including both meat and veggie-burger options. Effects are assessed comparing orders made on days randomly assigned to have a dynamic norm message added to the menu, to orders made on days assigned to a control menu without the intervention content. This campus café is visited by many members of the campus community. Those who paid using a campus ID could be identified as either students or faculty and staff. As these groups could differ in their baseline meat consumption, we obtained these data on customers who paid with a campus ID to use as a planned covariate.
The café is located in a central area of the campus and also sees foot traffic among large numbers of visitors to campus, including people temporarily working on campus (e.g., construction workers), as well as family members visiting students, and tourists visiting campus. Thus, sales come from customers with both a stronger connection to the campus and a weaker connection to it. In exploratory analyses, we operationalized this (1) by comparing people who paid with a campus ID (students and staff) vs. other means, and (2) by comparing people who had visited the establishment previously (those who paid with the same payment method, e.g., the same credit card) vs. newcomers. Note that both operationalizations are imperfect. For instance, university students, faculty, or staff (i.e., people with a strong institutional connection) may not have come to the café previously, could have done so but paid with different means, and would not have used a campus ID. Thus, moderation tests based on these variables are conservative to an unknown extent, as people with a strong campus connection are included among people without it.
The restaurant met the basic criteria for our study. The menu offered enough vegetarian entrées (slightly less than half of all items on the menu), and the vegetarian options were easily identified on the menu. A leaf symbol was placed next to vegetarian items on the menu board and the menu tablets, and a key at the bottom of the primary section on the menu board indicated that the leaf marked dishes that were vegetarian or vegan.
3.1. Materials and Methods
3.1.1. Participants and Assessment Period
We collected data on 23,103 unique customers, who ordered 110,266 entrées from April 3rd, 2017 to June 6th, 2018. As we were interested in food purchases for oneself, we identified and removed 21.3% of entrée orders (23,478), where customers purchased more than one entrée and were likely purchasing food for others.
Depending on payment method use, we were also able to collect data on customers’ affiliation with the university during the pre-intervention and intervention period (69,033 total); 1.6% were from university faculty or staff, 61.1% were university students, and 41.6% used a payment method that could not be used to identify potential affiliations with the university. Among orders placed during the intervention phase, 73.7% belonged to customers who had visited the establishment before and used the same payment method in the past year.
This intervention randomized 34 days to condition. Bootstrapping 500 simulations in a mixed model with the parameters planned in our analysis, and using data from purchases in the month prior at this location to model variability and volume of orders during the intervention period, including all data features (e.g., intraclass correlations among clustering variables, orders per day, etc.), we estimated that having 34 total days randomized (17 to each condition), would provide more than 80% power to detect a 5 percentage point difference in the proportion of vegetarian orders from historic baseline levels at this location, compared to controls.
3.1.2. Design and Procedure
From May 4, 2018 to June 6, 2018, we randomized 34 days to the intervention or control condition. Randomization was stratified across day of the week and weeks so that the intervention and control conditions occurred the same number of total days, had similar occurrences for each day of the week, and had a similar number of occurrences during any given week during the experimental period. After randomizing dates to condition, we learned that the restaurant was closed on Memorial Day, May 28, which brought the total number of intervention days down from 17 to 16. In addition to data on orders collected during the experimental period, we collected historic data on orders from the prior year (April 3, 2017–May 1, 2018).
3.1.3. Intervention Materials
At this restaurant, customers line up by a menu board that describes the available dishes and then go on to order using a tablet with an attached card payment device. The menu board featured burgers prominently, and some items, such as salads and sides, less prominently. On intervention days, a note featuring a dynamic norm message was affixed to the menu boards (see
Figure 1). It read:
Our Meatless Burgers Are on the Rise
From Lunch to Late Night, we offer a variety of options for you to enjoy.
The first line of the note presented the dynamic norm information. The second line was intended to mitigate any psychological reactance people could experience if they felt they were being told what to do. Specifically, we wanted to forestall a perceived demand for compliance, e.g., “Others are changing and you should too.” The note features the same leaf as the one designating the vegetarian dishes to help reduce any possible confusion about which dishes were on the rise.
The intervention note covered text that was otherwise visible in the control condition. That text read:
All burgers are served with lettuce, tomato, and your choice of bun.
Whole Wheat | Sesame Seed | Pretzel | Gluten Free
[The] Combo includes fountain drink and choice of fries, side salad, or fruit cup
This information was also provided on the ordering kiosk; thus, it was redundant and still visible during the intervention. It also applies to both meat and vegetarian entrées and, as such, would not be expected to impact meatless ordering.
In observing the flow of customers at this restaurant prior to the intervention, we observed that many customers did not look at the menu board. We therefore also included a similar note to the top of the tablet that customers used to place their orders on intervention days (see
Figure 2). The menu tablet had a larger selection of dishes, and so the tablet note was adjusted slightly to focus on all dishes. It read:
We’ve noticed customers are starting to choose more meatless dishes.
From Lunch to Late night, we make sure to offer you a variety of dishes to choose from.
3.1.4. Outcome Measure and Analysis
Entrées were coded for having meat or not (0 = Meat, 1 = Vegetarian). Using the lme4 package in the R software environment, we assessed whether entrée dishes selected were vegetarian or not in a generalized linear mixed-effects logistic regression, that included a random intercept for the customer as well as a random intercept for date nested within week.
This intervention randomized days, and not individuals, to condition. Thus, for example, individuals could visit during a day that was assigned to the intervention and then later return on another day assigned to the control, creating the possibility of a spillover across conditions. Two sets of analysis were conducted to examine vegetarian selection of food orders and remove condition spillover where possible. The first examined all entrée orders up to and including the first purchase a customer made on a day assigned to intervention. We refer to this as the “First Intervention” analysis, and consider it to be the best estimate for an initial treatment effect. The second analysis also included any subsequent intervention day orders that were not interrupted by an order made on a day assigned to the control. We refer to this as the “No Spillover” analysis, and consider it to be the best estimate for effects, including repeated visits. The second analysis keeps repeating data from customers who experienced the intervention multiple times, but has no condition “spillover” to control days after customers had been treated.
Both methods to detect and remove condition spillover rely on customers’ payment information and are imperfect. For instance, if someone paid with a different credit card over two visits, we would not be able to detect a possible spillover. Thus, our estimates of condition effects are conservative, as some condition spillover likely remains.
For each analysis, we utilized the historic data in two ways. Our first analysis utilizes the data in its most granular form, including every entrée purchase made over the prior year, to increase power: we use a mixed model analysis using a condition variable that denoted data from the control, intervention, or historic period dates, and included a random intercept for the customer. This model then analyzed the contrast coded condition variable and evaluating the contrast between control and intervention.
Our second analysis trades the granularity of the historic data and instead makes an individual difference measure solely based on customers’ prior purchases to control for their historic preferences: we created a fixed effect variable for each customer for the percentage of entrées they ordered during the historic period that were vegetarian, and included this variable in a mixed model regression assessing condition effects on orders in the experimental period.
These models have different strengths: the first model substantially has more degrees of freedom to help estimate variance and includes data from customers who did not have any visits before the intervention. The second model uses a parsimonious covariate for future choices to buy meat: one’s past choices to buy meat. It also restricts the analysis to customers with at least some historic data for the covariate.
As students, faculty and staff may differ in their baseline levels of meat consumption, we also analyzed customers’ affiliation to the campus (obtained for purchases made using a University ID). Including this variable in our analyses controls for whether the customer is a student or a staff or faculty member; however, it limits analyses to those who made purchases with a campus ID (and excludes those who paid in cash, gift card, or credit card). Given the tradeoff between controlling for ID holders’ campus roles and analyzing only a subset of the data, we report analyses both with and without this covariate.
We also consider using a campus ID, and the presence or absence of historic data, to be indicators of how connected customers are to the norm referent—fellow customers at a campus eatery—and use these variables as interaction terms in exploratory analyses to assess if these populations show differential effects.
As discussed above, the First Intervention and No Spillover analyses have four analyses each: with historic data modeled in the mixed model, or as a fixed effect, and with and without the covariate for university role. Given their unique contributions to understanding the effect of this intervention, we report each analysis separately.
3.2. Results
3.2.1. Vegetarian Selection
Across the First Intervention analyses, we find all four models produced a directional increase in vegetarian orders. In half of these the increase was significant, specifically those that included the historic fixed effect (see
Table 1). In a third case, the increase was marginally significant—the mixed model with a covariate for the university role and historic data. Among the significant or marginal models, the increases in vegetarian orders ranged from an estimated 1.4 to 1.7 percentage points. This effect is modest. However, it would mean that, over the course of 16 treatment days, roughly 50 customers were persuaded to purchase a vegetarian option by the intervention. The remaining model, which included all historic orders and no covariates, did not find a significant increase in vegetarian dishes ordered.
Across the No Spillover analyses, again all models produced a directional increase in vegetarian orders and for half this increase was significant, specifically those including the historic fixed effect. These models found increases in vegetarian orders with estimates ranging from 1.1 to 1.3 percentage points. By contrast, neither of the models that included historic orders in the model found a significant increase in vegetarian dishes ordered (ranging from 0 to 0.8 percentage points).
3.2.2. Exploratory Analyses
Given the variations in outcomes in the models tested, we sought to examine whether the effects differed because of the subsets of populations used in each model. Specifically, the models that included the covariate for university role by necessity include only participants who paid using their university ID. By contrast, the models that had a fixed effect variable for participants’ historic levels of vegetarian dishes ordered are limited to those who had at least one purchase in the prior year. Both of these subsamples arguably may have a closer connection to the café and the norm referent: they are members of the campus or have eaten there before. To investigate if these subsamples differed in their effects, we tested interactions with condition and dummy coded variables for whether participants had university role data, or historic data. We then ran separate analyses of intervention effects on those who are included vs. excluded in these analyses.
Examining visits in the First Intervention analysis, we find a marginal interaction between condition and whether customers had made any purchase in the historic period,
z = 1.90,
p = 0.058. Among customers who had purchased an entrée in the year prior, a logistic mixed-effects model on purchases during the intervention, with a random intercept for date and customer, found a significant increase in the proportion of vegetarian dishes ordered in the note condition as compared to the control, by an estimated 1.4 percentage points. Among customers who had not purchased anything from the restaurant in the year prior to the study period, there was no effect of condition. See
Table 1. We find a similar marginal interaction in the No Spillover analysis,
z = 1.88,
p = 0.061, where the note significantly increased orders of vegetarian dishes for those with historic purchases,
z = 2.35,
p = 0.019, but not for those without historic purchases,
z = −0.46,
p = 0.647.
Analyzing the interaction of paying with a university ID card and condition in First Intervention visits, we do not find a significant interaction effect,
z = 1.57,
p = 0.117. However, we find a positive main effect of the note analyzing only customers who used a university ID card (an estimated increase in vegetarian orders by 1.4 percentage points), and we find no difference by condition for those who did not pay with a university ID card. See
Table 1. Similarly, analyzing the same interaction but among No Spillover visits, we do not find an interaction effect,
z = 1.18,
p = 0.237. However, again, we found a positive effect of the note at the margin of significance for those who used an ID card,
z = 1.95,
p = 0.051, and no effect of condition among those who did not,
z = 0.34,
p = 0.691.
3.3. Discussion
The outcomes of this intervention appear to depend in large part on the model used to assess the effects—or more precisely—on the sample examined by the models. Models that utilized historic data or the university role covariate tend to yield estimates of greater effects. Upon further examination, it appears that these results are due to the subsets of participants that contributed these data: those who had visited the eatery at any point in the past year, and those who at some point had paid with a University ID showed significant effects. Both suggest that effects were positive among customers who had some affiliation with the university and therefore potentially a greater connection or sense of community with the norm referent (fellow customers).
4. Study 2: A Field Experiment with an Online Lunch Ordering Service
This study investigates the effects of a menu-based dynamic norm intervention in the context of Farm Hill, a “virtual restaurant” that has a lunch delivery service and restaurant that served business employees within the greater San Francisco Bay Area via an online account. Effects are assessed comparing orders made by customers before and after being randomly assigned to either have a dynamic norm message added to their online menu or to a control menu without the intervention content. This online food service met basic criteria for our study, including that the menu offered enough vegetarian entrées (slightly less than half of all items on the menu), and these options were easy to identify as vegetarian. Vegetarian and vegan dishes were each marked with a written label that appeared immediately below the title of the dish.
4.1. Materials and Methods
4.1.1. Participants and Assessment Period
We assessed 8722 lunch orders from 1628 customers in the month prior (March 21–April 18, 2018) to and during (April 19–May 1, 2018) an intervention. The intervention was scheduled to run 30 business days, and over these 30 days customers would remain in their assigned condition. However, during the intervention period, the business abruptly closed after 10 days of the intervention, such that data collection ceased short of the planned 30 days. This meaningfully reduces the power of the study to detect effects, as described below.
This research context offered the ability to randomize participants to condition (rather than days), and included both pre and during intervention measures for all customers. The 30-day assessment period was planned following power analyses. Bootstrapping 500 simulations in mixed models with the parameters planned in our analysis, and using data from historic purchases at this location to model variability and volume of orders during the intervention period, including all data features (e.g., intraclass correlations among clustering variables, orders per day, volume of returning customers from month to month, etc.), we estimated that having 1600 customers initially randomized to condition, and assessing orders over 30 days pre and post intervention would provide at least 80% power to detect a 5 percentage point difference in the proportion of vegetarian orders from historic baseline levels at this location, compared to controls. However, only having 10 days of intervention data reduced power substantially, requiring an effect of roughly 7–8 percentage points to be 80% powered.
A total of 10.8% (939) orders were dropped that did not include an entrée. As we are investigating personal food choices, we also dropped 0.3% (28) of orders that had more than one entrée to be delivered on the same day, as the customer may have been purchasing food for others.
This left 7460 entrées purchased by 1231 customers for analysis. Of those, 1231 customers were randomized to condition and placed 5909 orders in the pre-intervention period, and 592 placed 1551 orders for entrées during the intervention period. During the intervention period, 306 of those customers received the dynamic norm intervention and placed 775 entrée orders. No demographic data were available for customers.
4.1.2. Design and Procedure
Customers ordered meals through individual accounts on an online platform. Customers were randomized to either a dynamic norm intervention condition or a control condition. Based on data collected in the month leading up to the intervention, this randomization was stratified by the proportion of vegetarian dishes previously ordered and the frequency of ordering from the restaurant. Specifically, customers were placed into one of five similarly sized categories for frequency of purchases: 1 order, 2–3 orders, 4–6 orders, 7–15 orders, or 16 or more orders. For the proportion of vegetarian orders, customers were bucketed into four categories: 0% vegetarian orders, greater than 0% and less than half, equal to or greater than half but less than 100%, or 100% vegetarian orders. Randomization was stratified, such that customers with similar rates of ordering from the restaurant and of ordering vegetarian food were in each condition.
Once randomized to condition, customers in the intervention condition saw the dynamic norm every time they viewed the online menu, while customers in the control condition saw the unaltered menu.
4.1.3. Intervention Materials
Those assigned to the intervention saw the menu with a centered note at the top of the menu (see
Figure 3). It read:
News from [Name of Restaurant]!
We’ve noticed that customers are starting to eat less meat by choosing more meatless dishes.
We’re committed to offering a menu that gives you a variety of choices, all with fresh ingredients.
As in Study 1, the first line presented dynamic norm information and the second line aimed to mitigate psychological reactance by emphasizing the many choices customers had.
4.1.4. Outcome Measures and Analysis
Entrées were coded for having meat or not (0 = Meat, 1 = Vegetarian). To examine change in vegetarian dishes ordered during the intervention, we dummy-coded preintervention and intervention dates (preintervention = 0, intervention = 1), and tested the interaction between condition and time (preintervention vs. intervention) in a mixed model logistic regression, predicting whether customers ordered a vegetarian dish or not, including a random intercept for each customer nested within their employer, and a random intercept for each day. Mixed models were assessed using the lme4 package in the R software environment.
Anecdotally, when others viewed the note from this study, which refers to an increase in “meatless” dishes, some interpreted it as possibly only referring to a decline in red meat (i.e., they believed “meat” to refer primarily to red meat and pork, and less so to poultry or fish). Given this possibility, we conducted further exploratory analysis, where we assessed whether there were impacts on food ordered by a continuous measure of meat. Specifically, as some types or meat may be more prototypical of “meatiness,” we coded dishes in terms of how “meaty” they appeared. This coding assigned a 0 to vegetarian dishes, a 1 to poultry and seafood, and a 2 to pork, beef, and other red meat. We also assessed impacts on a red-meat-only coding of dishes, where dishes containing red meat and pork were coded as 1, and everything else was coded as 0. This analysis would be less appropriate in Study 1, where the note emphasized that vegetarian burgers were on the rise and used the symbol of a leaf on both the note and the vegetarian items, clearly indicating which dishes were on the rise. In addition to differences in how meat dishes may be perceived by consumers, these differences track environmental impacts, as beef in particular has a disproportionately larger environmental cost [
2].
4.2. Results
4.2.1. Vegetarian Selection
There was a non-significant increase, estimated at 2.6 percentage points, in the proportion of vegetarian dishes ordered for those in the intervention, relative to the control (see
Table 2).
4.2.2. Exploratory Analyses
Meaty
This analysis was run with a linear mixed-effects regression. A negative effect indicates a decrease in the meatiness of dishes ordered on the 2-point scale. As shown in
Table 2, customers in the intervention condition showed a marginal decrease in the “meatiness” from before to during the intervention period, relative to changes in the control condition across this period.
Red Meat
This analysis was run with a generalized linear mixed-effects logistic regression. A negative effect indicates switching away from red meat to anything else. There was a significant decrease in the proportion of dishes ordered that contained red meat in the intervention relative to changes in the control condition (a decrease by an estimated 1.56 percentage points).
4.3. Discussion
Unfortunately, this field experiment was cut short, and only provided data from an intervention period one-third as long as had been designed. The resulting reduction in power makes it difficult to interpret the results. Indeed, the absolute effect of the dynamic norm intervention on the proportion of vegetarian dishes ordered is noteworthy, and exceeded the effects observed in Study 1. Yet, this difference was not statistically significant in the sample obtained and, thus, its reliability is not known. Nonetheless, providing some confidence, exploratory analyses suggest the dynamic norm message encouraged customers to purchase fewer items most associated with “meat,” those that were prototypically “meaty,” and to avoid red meat and pork.
5. Study 3: A Field Experiment with Lunch in a Fine Dining Restaurant
This study investigates the effects of a menu-based dynamic norm intervention in a fine dining Italian restaurant during its lunch hours. Effects are assessed comparing orders made on days randomly assigned to have a dynamic norm message added to the menu to days with a control menu without the intervention content. This restaurant met basic criteria for our study, including that the menu offered enough vegetarian entrées (between one-third and one-half of all items on the menu), and vegetarian options were easy to identify on the menu. A leaf was placed next to vegetarian items, and a key at the bottom of the menu marked the dish as containing no meat. This restaurant is located near a shopping mall, a medical school, and a hospital, and generally had a mix of customers for lunch who live and/or work nearby.
5.1. Materials and Methods
5.1.1. Participants and Assessment Period
This study was conducted at a sit-down, Italian restaurant where customers typically dine with others (>80% of customer checks were for more than one person). As is typical in social dining, guests may share dishes, and one to five people split the total check for any number of patrons. This environment makes it more challenging both to track individual ordering and visits over time, as was done in Studies 1 and 2.
Ordering data was collected on 4435 lunch parties that dined between April 30, 2018 and October 2, 2018, during which time 125 days offered lunch. Each lunch order collected contained information on which dishes were ordered, their price, and the total number of people on the order. During lunch, the restaurant had an average of 91.5 guests per day (range 35–165). In some cases, the restaurant hosted large parties that might be served by restaurant catering, or bulk orders of food that do not reflect individual decision-making. To remove such cases, we dropped large orders. Specifically, we implemented three exclusion rules. First, we dropped cases where 30 or more items were ordered, which accounted for 1.2% (55) of total orders. Second, we dropped parties of 10 or more, which accounted for 0.8% (23) of total orders. Third, we dropped cases where parties purchased items from a special event menu (orders with items that were not on the standard menu and cost $5 or more), which accounted for 1.7% (74) of total orders.
Further, it was possible that condition spillover could exist across days, where customers who had seen the intervention would visit on a subsequent day assigned to the control. To reduce spillover, we removed orders where one of the payment methods that appeared on a day assigned to the control had previously appeared on a day assigned to the intervention. This applied to the entire order, as we could not link payment method to specific dishes ordered. We removed 9.2% of orders due to having condition spillover. Despite this step, some spillover almost certainly remains in the data: cases where a person dined with a party, but did not pay, or paid with cash or a different credit card, and saw the intervention and later returned on a day assigned to the control. This left 12,636 items purchased by 3645 dining parties.
This intervention randomized 125 days to condition. Bootstrapping simulations in mixed models with the parameters planned in our analysis, and using data from the historic purchases at this location to model variability and volume of orders during the intervention period, including all data features (e.g., intraclass correlations among clustering variables, orders per day, etc.), we estimated that having 125 total days randomized (at least 60 to each condition), would provide more than 80% power to detect a five percentage point difference in the proportion of vegetarian orders from the historic baseline levels at this location, compared to controls.
5.1.2. Design and Procedure
This restaurant is a sit-down restaurant where each customer receives their own menu. Each day during the experimental period was randomized to condition. Randomization was stratified by day of the week and by each week. The restaurant used the same menu for Monday to Saturday, which was included in the randomization. However, the restaurant did not use the same lunch menu on Sundays, so Sundays were excluded from the study and randomization. In total, 125 days were randomized to either the dynamic norm intervention or the control condition. Every day when there was a transition between the two conditions, a member of the research team went to the restaurant prior to opening and verified that all of the menus had been replaced with the appropriate condition menus for that day. Nonetheless, there were rare occasions when one or two menus from the wrong condition would later be found to have been in use at the restaurant. However, overall spillover of materials between conditions was kept at a minimum.
5.1.3. Intervention Materials
Those assigned to the intervention condition saw a menu with a note at the top right of the menu (see
Figure 4). It read:
We’ve noticed that our customers are starting to order our meatless dishes for lunch more often.
We delight in bringing you the of Italian food inspired by California’s bounty: all of our dishes feature carefully sourced ingredients and fresh produce.
As in Study 1 and 2, the first line presented dynamic norm information and second line was intended to mitigate psychological reactance while keeping with restaurant branding. Further, a leaf symbol appeared next to the vegetarian items, clarifying which items were meatless and becoming more popular.
5.1.4. Outcome Measures and Analysis
As in Studies 1 and 2, items were coded as vegetarian (1) or with meat (0). Due to the nature of social dining in which guests share appetizers and entrées, and as some meals at this restaurant were comprised of small plates (appetizers) ordered instead of entrées, appetizers, as well as entrées, were included in this analysis. Further, some appetizers contained meat, and therefore were of interest (in Studies 1 and 2 appetizers only rarely contained meat). Using the lme4 package in the R software environment, we assessed each item ordered for whether it was a vegetarian dish in a generalized linear mixed-effects logistic regression, that included a random intercept for the order the dish belonged to (the group’s bill), and a random intercept for the date nested within week. Unlike Study 2, analyzing red meat or more meaty dishes would be less appropriate in Study 3, where there was little room for misinterpreting what the dynamic norm was pertaining to: both the note and dishes were labeled with the same symbol, indicating which dishes were becoming popular.
5.2. Results
Vegetarian Selection
A mixed model analysis found that the intervention increased ordering of vegetarian dishes relative to the control condition (see
Table 3). This increase in vegetarian dishes sold, an estimate of 2.2 percentage points, represents customers being persuaded to purchase a vegetarian dish 136 more times during the course of the 61 intervention days as compared to the 64 control days.
5.3. Discussion
In this study, the dynamic norm reduced the proportion of meat dishes sold at lunch in an Italian restaurant, and increased the proportion of vegetarian dishes sold, by 2.2 percentage points overall.
6. Study 4: A Field Experiment with Dinner in a Fine Dining Restaurant
While conducting Study 3, we were given the opportunity to run the intervention during dinner as well. Thus, Study 4 investigates the effects of a menu-based dynamic norm intervention in the same restaurant as Study 3, but during dinner. Like Study 3, effects are assessed by comparing orders made on days randomly assigned to have a dynamic norm message added to the menu to control days without the intervention content. As compared to the lunch menu, the dinner menu is notably more expensive; dinner is thus a markedly higher social class context and experience. Presumably, dinner also draws a wealthier customer base. This context is also much more expensive than that in Study 1 and 2. As prior work has found that norms are less influential among people high in socio-economic status, we conduct exploratory analyses to assess whether patrons who spent more money would respond to the intervention differently.
6.1. Materials and Methods
6.1.1. Participants and Assessment Period
Study 4 has the same characteristics of the restaurant, customers, and exclusion criteria as Study 3. A total of 2526 dinner parties was analyzed between August 11, 2018 and October 2, 2018, during which time dinner was served on 38 days. During dinner, the restaurant had an average of 185.5 guests per day (range 79–268). We removed checks with 30 or more items (4%, or 100 orders), parties of 10 or more (0.9%, or 23 orders), and parties who purchased items that were not on the menu and cost $5 or more (1.6%, or 41 orders). In total, we analyzed 7914 items purchased by 1985 dining parties.
This intervention randomized 38 days to condition. Bootstrapping simulations in mixed models with the parameters planned in our analysis, and using data from historic purchases at this location to model variability and volume of orders during the intervention period, including all data features (e.g., intraclass correlations among clustering variables, orders per day, etc.), we estimated that having 38 total days randomized (17 to each condition), would provide at least 80% power to detect a 5 percentage point difference in the proportion of vegetarian orders from historic baseline levels at this location, compared to controls.
6.1.2. Procedure
We used the same procedure as Study 3 for the randomization and conducting the study, including stratifying randomization by day of the week and by each week. The 38 days were randomized to a dynamic norm condition or control condition.
6.1.3. Intervention Materials
We used similar materials as Study 3, except that the dynamic norm note added to the dinner menu referred to choosing dishes for dinner instead of lunch.
6.1.4. Outcome Measures and Analyses
We used the same outcome measure as Study 3. We also examined those who bought more items and conducted exploratory interactions by this variable and condition. We calculated the average number of items purchased per person, which was calculated by summing the number of appetizers, entrées, drinks, and desserts for a check and dividing by the number of customers on the check. Note that we considered assessing the average price per person, but the amount spent per person is directly impacted by customers’ choices to purchase meat: entrées that contain meat were much more expensive. The number of items purchased, by contrast, provides a measure of spending relatively independent of the outcome.
Like Study 3, analyzing red meat or more meaty dishes would be less appropriate in Study 4, as there was little room for misinterpreting what the dynamic norm was pertaining to: both the note and dishes were labeled with the same symbol, indicating which dishes were becoming popular.
6.2. Results
6.2.1. Vegetarian Selection
Contrary to our hypothesis, a mixed model analysis found that the dynamic norm message significantly reduced vegetarian orders compared to the control condition (see
Table 4). This decrease in vegetarian dishes sold, an estimate of 3.7 percentage points, represents customers being persuaded to purchase a non-vegetarian dish 130 more times during the course of the 17 intervention days as compared to the 17 control days.
6.2.2. Exploratory Analyses
Testing the interaction between number of items ordered by each person and condition, we find a significant interaction, z = −2.35, p = 0.019. The reduction in vegetarian ordering among customers who ordered more items than the median amount per person was large (estimated at −6.1 percentage points). There was no such effect among those who ordered fewer than the median amount per person (estimated at −1.0 percentage points).
6.3. Discussion
While Study 3 found a positive overall effect of the dynamic norm note in increasing vegetarian ordering, Study 4 found the opposite: the dynamic norm note increased orders containing meat. Exploratory analysis suggests this increase in meat ordered in response to the dynamic norm arose primarily among those who bought more items. One interpretation, consistent with past research, is that “big spenders” demonstrated reactance against the normative message, and thus did the opposite of what it implied.
7. Summary of Field Studies and Overview of Online Studies
In Studies 1–3, we find modest positive effects of a dynamic norm intervention, with increases in vegetarian orders of up to 2.5 percentage points, although these effects do not always reach significance and in some cases are underpowered. Further, exploratory analysis finds substantial heterogeneity among populations and contexts, producing larger effects in some cases, for instance among prior customers and those with a university affiliation at a campus eatery (Study 1), and null effects in others. In Study 4, the intervention reduced vegetarian ordering at dinner in a fine-dining restaurant, especially among customers who bought more items, an effect consistent with past norms literature and theories of reactance, although this interpretation is speculative, as we lack direct psychological evidence. Based on these results, it appears that the menu-based dynamic norms interventions may cause reductions in meat consumption in restaurant contexts, where customers have a greater connection to the norm referent used in the note (e.g., fellow customers, as in people with university roles in Study 1), and where the restaurant and clientele do not reflect high in socioeconomic status.
In parallel to these questions about context are questions about the intervention delivery and content. How salient was the provision of dynamic norm information in menus? Did people notice it? How can we alter the intervention materials or implementation to make it more impactful? And if this were done, could we produce larger effect sizes, at least in the contexts and populations that are fitting for this intervention?
First, for a dynamic norm message to be influential, it must be seen. Yet, we do not know what proportion of customers notice a dynamic norm note on menus, nor whether it could be made more salient. Second, despite the risk of reactance (e.g., in Study 4), we do not know whether the methods used to mitigate reactance in the field studies were effective, or what level of reactance people experienced. Additionally, past literature and exploratory analyses from Study 1 both suggest that a dynamic norm message may be more effective if people have a greater connection to the referent in the norm message. Can we improve the norm referents implied in dynamic norm messages so customers feel more connected to them and that the message pertains to people they see as similar to themselves?
In Studies 5–9, we conduct a series of online experiments to address these questions and rigorously evaluate areas for improvement. In each, participants complete a hypothetical food ordering scenario and choose a dish from a menu, and then are asked questions about the menu and dynamic norm notes used. Study 5 assesses what proportion of people who view the menus notice the dynamic norm note, and how they interpret it. Study 6 assesses feelings of coercion related to reactance. Study 7 assesses methods to improve the visibility of the intervention note. Studies 8 and 9 assess possible improvements in the norm referent on ratings of the note’s content and examine the impact on hypothetical food ordering. As Studies 5–7 are focused visibility, reactance, and other psychological measures, they were not designed or powered enough to detect changes in vegetarian dish selection in the range of effects considered here. By contrast, Studies 8 and 9 are meant to test the effectiveness of the note on psychological measures, as well as serve as a rough indicator for vegetarian selection.
8. Study 5: Assessing the Field Study Menu Intervention Materials
Study 5 aimed to assess two broad questions: First, what proportion of people would see and read dynamic norm messages in menus when considering what to order? Second, how do people interpret the information in the norm statement and its purpose in the menu?
8.1. Materials and Methods
8.1.1. Participants
Overall, 284 adults with a unique IP address in the United States took part, through Amazon’s Mechanical Turk in a “3–5 min Psychology Survey” for 45 cents.
This study was conducted at a time when an increase in “bot,” “click-farm,” and other suspicious activity had been observed on Amazon’s Mechanical Turk [
36]. To address data quality concerns, we coded participants’ responses for potential evidence that participants were not from the U.S., using geolocation information and free response quality (see the
Supplemental Material for full coding description); this method is similar to others that have been validated [
37]. Coders achieved a high reliability (Kappa = 0.83). Discrepancies were resolved through consensus. Out of our total sample, 1.05% (3) responses were coded as likely coming from non-U.S. participants and were dropped from analysis.
Participants were shown the menu and asked to choose one item that they would like to order for lunch; if they chose more than one item, or specified a dish that did not resemble anything on the menu, they were dropped from analysis (2.14% of total participants). Additionally, participants were asked several free response questions; if they didn’t answer some of them, either by leaving a question blank or by typing something incoherent (e.g., “praba”), they were dropped from analysis (6.4% of total participants).
This left a sample of 257 participants. Of the remaining participants, 57.0% identified as men, 41.8% as women, and 1.2% as non-binary. The mean age was 35. The sample size was chosen to be sufficient to provide rough estimates of basic descriptive statistics about how many people would notice the note, and how they would interpret it. In Studies 5–9, all subjects gave their informed consent for inclusion before they participated in the study. These studies were approved by the Internal Review Board of Stanford University.
8.1.2. Procedure and Materials
Participants were told that we were doing research on food selection. They were asked to imagine they were buying lunch from a restaurant, told that they would be shown that restaurant’s menu, and would be asked to pick a single dish off the menu to order for lunch. They were randomly assigned to one of three menus, all from our field experiments. Menu A was from a campus restaurant that offers general American sports-bar fare, such as burgers, fries, and salads (Study 1). Menu B was from a high-end Italian restaurant (Study 3). Menu C was from a web-based restaurant branded as selling healthy meals, largely for lunch orders for businesses (Study 2). To adapt these menus to a national audience, some changes were made: ingredients and dish names on all of the menus were adjusted slightly to be more widely recognizable (e.g., switching from a “Pugliese Pizza” to a “BBQ Chicken Pizza”), and prices were adjusted to reflect more typical lunch pricing across the U.S. (lowered to $8–10 per entrée). Each menu had a variety of meat and vegetarian options. Vegetarian items were marked with a leaf, denoting them as “vegetarian” (Menu A), or containing “no meat” (Menu B), or each vegetarian item was directly labeled with the words “Vegan” and “Vegetarian” (Menu C). Using the materials from the interventions, each menu had a small note near the top with dynamic norm information about a trend towards reducing meat consumption among restaurant customers (e.g., “We’ve noticed that our customers are starting to choose our meatless dishes for lunch more often”).
After indicating which dish they would order, participants were asked to recall what the note said (while the menu was no longer visible). Next, they were shown the menu again, and asked a series of questions.
8.1.3. Dependent Measures
Visibility and Recall
After the food ordering task, but before participants were shown the menu again, they were asked if they had seen, read, and could recall the note:
Did you notice the note, at the top right of the menu? (0 = No, 1 = Yes)
Did you read the note at the top right of the menu? (0 = No, 1 = Partially, 2 = Yes)
What were the contents of the note, that you remember? (Free response)
Free responses were coded as either recalling the increasing popularity of vegetarian dishes (coded as dynamic norm), mis-remembering the note as about the static popularity of vegetarian dishes (static norm), simply as a promotion (no norm), copying and pasting text from the note or question (copied text), entering nothing (nothing), or other (Kappa = 0.85).
It is possible that asking participants whether they noticed or read the note could overestimate these occurrences, if participants feel obligated to report they saw the note, or underestimate these occurrences, if participants fail to recall that they had seen the note. By contrast, assessing their recall of the note’s content is a more conservative estimate of whether participants saw the note, as it requires them to reproduce it from memory. However, the latter indicates whether participants engaged with the note in a sufficiently attentive manner to recall it.
Interpretation of Note
While the menu and note were presented a second time, participants were asked four free response questions regarding how they interpreted the note. Each response was coded into exclusive categories developed through a reading of responses and noting common themes.
The first question was, “What do you think of when you read the note?”, which was coded as pertaining to one of eleven response types: commenting that the restaurant was accommodating its customers (coded as accommodating), speculating that the restaurant had good food (quality food), that the restaurant had vegetarian food (vegetarian food), that the food was healthy (healthy food), that the restaurant was trying to make money (money), that the restaurant wanted customers to eat vegetarian (prescribe vegetarianism), expressing support for the note (e.g., “It’s nice that they offer meatless options”, supportive), expressing opposition to the note (e.g., “I don’t care much for it”, unsupportive), identifying the reduction in meat consumption (dynamic norm), feeling that the note is pointless or trivial (trivial), thinking about people who are vegan or vegetarian (vegetarians) (Kappa = 0.88). Responses were also coded for the general valence as either positive, neutral, or negative (Kappa = 0.95).
The second question was, “Why do you think the restaurant put this note on the menu?” This question was coded for different rationales or motivations, including: to be inclusive of vegetarians (include vegetarians), to advertise products (advertising), to show customers that they are responsive to their wishes (responsive), to meet corporate social responsibility goals related to health or the environment (corporate social responsibility, or CSR), to save money or profit more (money), to encourage customers to consume less meat (prescribe vegetarian), and other (Kappa = 0.89).
The third question was, “What does this suggest to you about the restaurant’s food items?” This question was coded for different inferences about the dishes, including: that it was high quality (high quality), that the restaurant was accommodating or that the food selection was varied (accommodating), that the food was healthy (healthy), that the restaurant catered to vegetarians (for vegetarians), that the meat products must be poor quality (bad meat), that some of the food has meat or vegetables (meat or vegetarian), that it didn’t indicate anything (nothing), and other (Kappa = 0.92).
The fourth question was, “What does this suggest to you about the restaurant’s veggie dishes?” This question was coded for inferences about the vegetarian dishes, including: that participants thought the items must be new (new), that they must be high quality (high quality), that they were plentiful or available (plentiful), that they were poor quality (low quality), that they did not have meat (meatless), that they were popular (popular), that the restaurant wants customers to eat meatless (prescribe vegetarian), that it didn’t indicate anything (nothing), and other (Kappa = 0.93).
Note ratings. After the open-ended questions, participants were asked four questions related to the content in the note that we expected would impact how effective the note’s message would be, each using Likert responses:
How good or bad do you think their veggie items taste? (1 = Very bad, 7 = Very good)
If you saw this at a restaurant, how believable or unbelievable would you find the note? (1 = Very unbelievable, 7 = Very believable)
How accurate or inaccurate would you think that this note is? (1 = Very inaccurate, 6 = Very accurate)
How normal or strange do you think this is? (1 = Very strange, 7 = Very normal)
8.2. Results
8.2.1. Visibility and Recall
Averaged across the menus, only 35.7% of participants reported noticing the note. Further, only 28.0% of participants said they fully read the note, while 9.3% said they partially read it, and 62.6% said they did not read it at all.
The coded responses from asking participants to recall the contents of the note revealed that only 19.2% of participants recalled that the note had information about a decline in meat consumption. Thus, it appears that around 30% of participants read the note, and perhaps 20% read it attentively. These results were fairly consistent across menus (see
Table 5).
8.2.2. Interpretation
See
Table 6 for a breakdown of these results for reach menu. When asked what they thought about after reading the note, the most common responses, coded into exclusive categories, were that the restaurant was being accommodating to customers, that they had vegetarian food, remarking on the reduction in meat consumption, and expressing general support. Coding responses for overall valence, most were neutral or positive.
When asked why the restaurant put the note on the menu, the most common responses were that the restaurant was trying to be more inclusive to vegetarians, that it was simply an advertisement, or that it tried to encourage people to eat less meat.
When asked what the note suggested about the restaurant’s food, the most common responses noted that the food was accommodating, healthy, or high quality.
With regards to what the note suggested about the vegetarian items, the most common responses noted that the vegetarian items were high quality and plentiful.
8.2.3. Note Ratings
The vegetarian dishes were rated as being between “slightly good” and “good.” The contents of the note were rated as being between “slightly believable” to “moderately believable” and “moderately accurate.” The note on the menu was rated as “slightly normal.”
8.3. Discussion
There were several important findings from Study 5. First, few participants reported that they had noticed or read the notes used in our field experiments—only about one in three—and even fewer could recall the basic content of the note—less than 20%. Second, after being shown the note again, almost all participants had positive or neutral responses to it; few had a negative response. Yet, they have tended to interpret the note as about or written for vegetarians, such as to be inclusive to vegetarians, rather than thinking about the change in meat consumption as a broad trend pertaining to most people or people like them who ate meat. Thus, it appears the note could be improved in two major ways: first, by being more salient and thus noticed; and second, by appealing to all people, not assumed to be specifically for vegetarians or vegans, who are specifically not our target audience.
9. Study 6: Assessing Psychological Reactance
Given that Study 4 found a backfire effect consistent with psychological reactance, Study 6 assessed whether notes encouraging people to eat less meat may lead people to feel coerced, including by comparison to a more traditional menu note, one that advertised specials.
The notes used in our field studies were designed to reduce reactance by including text that framed the dynamic norm information as emanating not from an effort to coerce patrons to eat less meat but as a response to customers’ preferences. To assess the effectiveness of this approach, Study 6 compares it to notes that contain a direct request to conform to the dynamic norm in the second line.
Furthermore, this study examines how people interpret the intentions behind the restaurant’s choice to include the note on the menu. This includes more prosocial intentions (such as caring about health and the environment) or more coercive intentions (such as trying to get customers to buy a specific dish).
9.1. Materials and Methods
9.1.1. Participants
Overall, 479 adults with a unique IP address in the United States took part through Amazon’s Mechanical Turk in a “2–4 min Psychology Survey” for 40 cents. People who may have participated in Study 5 were ineligible. We used the same methods used in Study 5 to filter out potential non-U.S. respondents. Out of our total sample, 5.2% (25) responses were coded as likely coming from non-U.S. participants and were dropped from the analysis.
Participants were asked to choose one item that they would like to order for lunch; if they chose more than one item or specified a dish that didn’t resemble anything on the menu, then they were dropped from the analysis (0.4% of total participants).
This left a sample of 452 participants. Of the remaining participants, 41.6% self-identified as men, 58.2% as women, and 0.2% as non-binary. The mean age was 35. A minimum of 100 participants per condition, with four conditions, yields 80% power to detect medium-small effect sizes in differences between ratings of intervention materials (d = 0.4).
9.1.2. Procedure
As in Study 5, participants were told that we were studying food selection. Again, they were asked to imagine they were buying lunch from a restaurant and asked to pick a single dish from the menu to order (whether these choices were vegetarian are not analyzed for lack of statistical power). Unlike Study 5, Study 6 used a single menu, that from Study 3, the field study of lunch at a high-end Italian restaurant adapted for a national audience as in Study 5. The menu had a variety of meat and vegetarian options. This menu provided the template for Studies 6–9.
After indicating which dish they would order, participants were shown the note again, and asked a series of questions.
9.1.3. Manipulation
Participants were randomly assigned to one of four conditions in a 2 × 2 design. The note in each condition contained a dynamic norm, either about increases in orders for vegetarian dishes or for specials, depending on condition. Each note had a second line of text either with or without a direct request to order one of those items: “Try one of our [Plant-based dishes/Specials] today!” Thus, participants were randomly assigned to one of these conditions: a vegetarian no request, a vegetarian direct request, a specials no request, or specials direct request (see
Figure 5). Menus with notes about meat consumption marked vegetarian dishes with a leaf; menus with notes about specials marked specials with a star. The same items were marked for both specials and vegetarian items (i.e., all specials were vegetarian). The vegetarian no request condition uses the same note as Study 3, and is very similar to the notes in the over field experiments.
9.1.4. Dependent Measures
Perceived Coercion
We assessed coercion with four measures. The first was a three-item scale with questions about how annoyed, pressured, or manipulated the note made participants feel (adapted from prior research [
34]). Each was assessed using a Likert response:
“If you saw this while ordering food, to what extent would you feel annoyed?” (1 = Not at all annoyed, 5 = Extremely annoyed)
“If you saw this, to what extent would you feel that you were being pressured to order a [meatless dish/special]?” (1 = No pressure at all, 5 = A great deal of pressure)
“If you saw this, to what extent would you feel like people were trying to manipulate you?” (1 = Not at all manipulative, 5 = Extremely manipulative)
A second measure assessed how helpful or unhelpful participants found the note:
“How helpful or unhelpful do you think this note is?” (1 = Very unhelpful, 6 = Very helpful without a midpoint; due to error the scale is out of 7 for the special no request condition, 1 = Very unhelpful, 4 = Neither helpful nor unhelpful, 7 = Very helpful)
A third item assessed how participants would feel if the intention of the restaurant was, in fact, to use this messaging to persuade them: “Would you find it annoying if a company advertised its [meatless/special] dishes this way?” (1 = Not at all annoying, 5 = Extremely annoying).
A fourth item assess how participant would feel, generally, if a restaurant were to try to persuade its customers to buy a vegetarian dish or a special: “Would you find it annoying if a company tried to persuade you to order one of their [meatless/special] dishes?” (1 = Not at all annoying, 5 = Extremely annoying).
Perceived Intent
Prior to the coercion items, participants responded to items assessing the perceived intentions of the restaurant in putting the note on the menu. Five choices drew on the top responses to the open-ended question in Study 5 (“Why do you think the restaurant put this note on the menu?”). Participants were asked “If you were at a restaurant and read this note in a menu, which of the following thoughts, if any, would come to mind for you?” Participants then read, “I would think the restaurant is trying to… (check all that apply),” and were given the following options:
Attract vegetarians or vegans to the restaurant (attract, Veg conditions), OR attract people to the restaurant (attract, Special conditions)
Improve people’s impressions of the company or their ‘brand’ (brand)
Show they pay attention to what their customers want and are accommodating (responsive)
Do something good (for health, for the environment, etc.) (CSR)
Persuade customers to buy a meatless dish (persuade, Veg conditions), OR persuade customers to buy a Special (persuade, Special conditions)
9.2. Results
We report the primary results from each condition across measures in
Table 7.
9.2.1. Perceived Coercion
In absolute terms, participants in the Vegetarian No Request condition—the note resembling our intervention in Studies 1–4—reported feeling between “not at all” and “a little” coerced on the 3-item scale due to the note, that is how annoyed, manipulated and pressured they felt. Despite this low mean, roughly 8% of participants felt either “moderately” or “a lot” of coercion. Importantly, these levels were significantly lower than among participants who saw the same note but with a direct request to order a vegetarian dish, suggesting the effectiveness of replacing the direct request with text emphasizing the responsiveness of the restaurant to customer preferences.
When the restaurant advertised specials, coercion was low regardless of the request condition, and did not significantly differ from the Vegetarian No Request condition.
Across conditions, participants did not feel the note was particularly helpful or unhelpful (M = 3.66, SD = 1.37). We found no differences on this measure by condition, F (2, 338) = 0.557, p = 0.573. (This comparison excludes the special direct request condition which was measured on a different scale.)
Participants felt no more annoyed by the prospect of a company generally advertising its vegetarian dishes than its specials: participants in the vegetarian note conditions anticipated feeling similarly annoyed (directionally less) than those in the special note conditions, t (448) = −1.63, p = 0.103. However, participants in both vegetarian conditions anticipated feeling “a little” annoyed if a company were to try to persuade them using the note to order a vegetarian dish. Further, they were more annoyed at the prospect of a restaurant using the note specifically to persuade them to order vegetarian dishes than specials, t (450) = 2.05, p = 0.041.
9.2.2. Intent
Nearly 70% participants in the Vegetarian No Request condition, which mirrored the note used in our field experiments, expected that the note was put there to attract vegetarians.
Participants in the Vegetarian No Request condition were more likely to think that the note they read was meant to improve the restaurant’s brand image, to show that the restaurant was being responsive to their customers, and was placed on the menu because the restaurant was trying to do something socially responsible for health or the environment, rather than trying to persuade them to buy certain dishes.
9.3. Discussion
In general, participants in all conditions reported feeling low levels of coercion (annoyance, pressure, or manipulation) due to the note, although 8% of participants who saw a note like the one used in our interventions felt at least moderate levels of coercion, which suggests there may be room for improvement. Further, the second line of this note designed to dissuade people from seeing the note as a direct request significantly reduced feelings of coercion. This note caused the same or less coercion than a similar note with an appeal to ordering specials.
Generally, the note used in the field experiments led to greater perceptions that the restaurant had prosocial intentions rather than coercive intentions. Regardless of the directness of the appeal, participants were much less likely to perceive the note to be persuading them to buy something when the note was about vegetarian items than when it was about specials, even when the vegetarian direct request appeal literally read, “Try one of our plant-based dishes today!” When the note was about vegetarian items, participants were more likely to believe that the restaurant was doing something good, that the restaurant was responsive to customers wants, and that they were trying to improve their brand image. However, like Study 5, we find evidence that most participants thought the note was meant to appeal to vegetarians specifically, who are not our intervention’s target. Overall, this study provides evidence that the note is unlikely to harm perceptions of restaurants in any of the ways we examined, compared to traditional advertisements for specials in menus.
10. Study 7: Increasing Visibility via Note Position and Medium
Study 5 found that people may not notice dynamic norm notes in menus. In a supplemental study, we tested one method of increasing visibility, simply making the note larger, which did not yield clear benefits (see Study S1). In Study 7 we attempt to increase visibility by moving the note to a more primary visual location, the top left corner of the page [
38], and representing the text as a physical note appended to the menu. To help ensure that our attempts to increase visibility did not come at the cost of other important properties, we also include measures regarding the note’s perceived accuracy, if it is perceived as normal or as strange, and whether it causes people to feel coerced. If the note is perceived as inaccurate, strange or causes coercion, it may undermine the messages effectiveness.
10.1. Materials and Methods
10.1.1. Participants
1,025 adults with a unique IP address in the United States took part through Amazon’s Mechanical Turk in a “4–5 min Psychology Survey” for 50 cents. Those who may have participated in Studies 5–6 were ineligible to participate. The same criteria were used to drop participants as in Study 6, including 2.4% likely coming from non-U.S. participants, 2.2% of total participants for faulty dish selection, 7.9% for smart phone use, 9.6% for waiting for the page timeout, and 0.8% for failing to answer free responses.
This left a sample of 791 participants. Of the remaining participants, 47.7% self-identified as men, 52.0% as women, and 0.3% as non-binary. The mean age was 36.7. Roughly 200 participants per condition, with four conditions, yields over 80% power to detect medium-small effect sizes in differences between ratings of intervention materials (d = 0.3).
10.1.2. Procedure
Participants were given the same menu task and instructions as Study 6, followed by questions about the menu and note.
10.1.3. Manipulation
Participants were randomly assigned to one of four conditions: Control, Original Note, Corner Note, and Clipped Corner Note (see
Figure 6). The control menu had no note. The remaining three conditions each had a note with the same text about a customer trend toward increasing selection of vegetarian items. In the Original Note condition, the note from Study 3 was used, and thus was on the right side of the menu, about one-third of the page down. The Corner Note condition approximately doubled the size of the note and font size, and put it in the upper left-most corner of the menu. Eye tracking research has found that the top-left corner is often viewed first when people scan a menu for something to purchase [
38]. Further, the convention in English (and other languages) is that the top left is where one begins to read a document. The Clipped Corner Note condition was the same size and had the same placement as the Corner condition, but was printed on green paper and shown as if it were paper-clipped to the menu. This was meant to also take advantage of the custom of placing a physical note on top of another document to signal that it is meant to be seen first. Vegetarian items were marked with a leaf on both sides of the item name.
10.1.4. Dependent Measures
Visibility
The same recall questions as those used in Study 5 were included.
Note Ratings
Two of the norm rating questions from Study 5 were included:
“How accurate or inaccurate would you think this note is?” (1 = Very inaccurate, 6 = Very accurate)
“How normal or strange do you think this is?” (1 = Very strange, 7 = Very normal)
Perceived Coercion
Two coercion questions from Study 6 averaged and used as a scale:
“If you saw this while ordering food, to what extent would you feel annoyed?” (1 = Not at all annoyed, 5 = Extremely annoyed)
“If you saw this, to what extent would you feel that you were being pressured to order a meatless dish?” (1 = No pressure at all, 5 = A great deal of pressure).
10.2. Results
We report the primary results from each condition across measures in
Table 8.
10.2.1. Visibility
As compared to the participants in the Original Note condition, those in the Corner Note and Clipped Corner Note condition were more likely to report that they saw the note, and had read it.
10.2.2. Note Ratings
All notes were rated as being between slightly and mostly accurate, and between neutral and slightly normal. The Corner Note and Clipped Corner Note were rated as being more accurate and more normal than the Original Note.
10.2.3. Perceived Coercion
Participants reported feeling less coerced in response to the Corner Note than the Original Note.
10.3. Discussion
Repositioning the note to the top left of the menu increased the visibility of the note, especially when it was paper clipped to the corner. However, many people still could not recall the contents accurately. We also found that participants felt less coerced by the Corner note than by the other two conditions. And placing a note in the corner was also seen as more normal and accurate than the original note.
While a paperclipped note may be hard to mass produce, an image of a colored note is highly scalable. In Study S2, we find that virtually the same benefits as the paper-clipped note can be achieved with a colored note on the menu (see
Supplemental Material). Overall, it appears that a note with a contrasting color in the top left corner of the menu may enhance visibility: While the original notes used in the intervention were seen by roughly 25%–50% of participants in Studies 5–6, Studies 7 and S2 find that the Corner note and variants are seen by 60%–75% of participants.
11. Study 8: Improving the Norm Referent
Studies 5 and 6 found that many people interpreted the note to be about or for vegetarians, rather than for people in general, let alone people who eat at least some meat—precisely the people who must be reached to reduce the consumption of meat. If meat-eaters think the message is not about people like them, it may be ineffective. How could the message be revised to increase the relevance of the social referent, so that customers see this message as being for and about people like themselves? One challenge in this setting is to find a referent that feels relevant to people in a generic restaurant context, where they may have little affiliation with their fellow customers (unlike members of a university community at a campus eatery, as in Study 1). Study 8 represents the dynamic norm in terms of a variety of referent groups that people may feel are relevant, including one that is directly about “non-vegetarians.”
Changing the norm referent might also impact important factors such as how believable the norm message is. For each condition, we assess the ratings of the note from prior studies (accuracy of the statement, whether it is strange or normal, if people find it sincere, and whether it leads them to feel coerced), as well as the proportion of vegetarian dishes ordered by each condition. Given that the effectiveness of the referent hinges on the note being read, Study 8 also uses the techniques from prior studies to increase the visibility of the note.
11.1. Materials and Methods
11.1.1. Participants
Overall, 1713 adults with unique IP addresses in the United States took part, through Amazon’s Mechanical Turk, in a “4–5 min Psychology Survey” for 50 cents. Those who may have participated in Study 5–7 were ineligible to participate. The same criteria were used to drop participants as in Study 7, including 4.1% responses likely coming from non-U.S. participants, 1.2% of total participants for faulty dish selection, 8.1% for smart phone use, 9.3% for waiting for the page timeout, and none for failing to answer free response questions.
This left a sample of 1324 participants. Of the remaining participants, 43.2% self-identified as men, 56.5% as women, and 0.2% as non-binary. The mean age was 36.9. Roughly 165 participants per condition, with eight conditions, yields over 80% power to detect medium-small effect sizes in differences between ratings of intervention materials (d = 0.35). Further, 7.2% of participants reported being vegetarian and were dropped from the analysis of whether their meal choice contained meat, leaving 1200 participants for that measure. In a comparison of the control condition against all note conditions, this study is 80% powered to detect an effect of a roughly 7 percentage point shift (e.g., from 18% to 25%). Notably, this would not be powered enough to detect the effects from our prior field experiment, but with improvements on visibility of the note now in place, larger effects may be possible.
11.1.2. Procedure
Participants were given the same menu task and instructions as Study 6, followed by questions about the menu and note.
11.1.3. Manipulation
Participants were randomly assigned to one of eight conditions: Control, Americans, Our Community, Customer Change, Customer Choice, Non-Vegetarians, People, and People Like Us. The Control condition did not have a note on the menu. The corner style note (from Study S2) was used for all seven referent conditions. The note read “Have you heard? [Referent] are choosing less meat and more plant-based dishes.” The referents were filled in with the condition names. Further, two versions of the “customers” referent condition were created to help investigate the effect of emphasizing customers’ choice. Given prior findings on coercion, we felt it may be helpful to include language that reassured participants of their autonomy regarding food choice. In the Customers Change condition the subtext of the note read: “To accommodate this change, we offer great plant-based dishes,” while in the Customer Choice condition it read: “To accommodate this choice, we offer great plant-based dishes.” All other note conditions used the “change” language.
11.1.4. Dependent Measures
The same dependent measures were used from Study 7.
11.2. Results
We report the primary results from each condition across measures in
Table 9.
11.2.1. Visibility
Participants’ likelihood of noticing or fully reading the note did not vary significantly by condition, F (6,1153) = 1.40, p = 0.213. However, participants did differ by condition in whether they accurately recalled the note’s content, F (6,1153) = 2.43, p = 0.025. Specifically, participants were most likely to recall the content accurately in the Non-Vegetarians condition and least likely in the People Like Us condition.
11.2.2. Note Ratings
Accuracy significantly varied between the different notes tested, F (6,1143) = 2.87, p = 0.009, where People and Customer Choice were seen as more accurate, while Customer Change, Americans, and People Like Us were relatively less accurate.
Sincerity significantly varied across the different notes tested, F (6,1142) = 2.193, p = 0.041, where Community and Customer Choice were seen as more sincere, while Customer Change, Americans, and People Like Us were relatively lower in sincerity.
Rated normalcy of the note varied marginally by condition, F (6,1141) = 1.875, p = 0.082. Participants felt that Community and People were more normal, while Customer Change was relatively more strange.
There were no differences in feelings of coercion by condition, F (6,1153) = 0.714, p = 0.638.
11.2.3. Vegetarian Selection
In collapsing all referent conditions as one note condition, there is no significant difference between the notes (M = 0.384, SD = 0.49) and the control (M = 0.314, SD = 0.47),
p = 0.11,
z = 1.60. However, we find that all norm conditions directionally ordered more vegetarian dishes than the control condition (see
Figure 7). In particular, we find that the Non-Vegetarians (
z = 1.68,
p = 0.094) and People Like Us (
z = 1.80,
p = 0.073) conditions ordered marginally more vegetarian dishes than the control, by roughly 10 percentage points. All other conditions did not significantly differ from the control (all
ps > 0.10).
11.3. Discussion
Looking across the multiple indicators taken here, it appears that norm referents for “Community” and “Non-Vegetarians” are promising options for the intervention. These two conditions are the only ones to appear at the top or middle of the comparison set on measures of visibility, recall, sincerity, accuracy, normalcy, at the low end of coercion, and are trending higher in their proportion of vegetarian dishes selected.
12. Study 9: Comparison to Original Note
Study 8 found that notes with dynamic norms that use “non-vegetarians” and “our community” members as referent groups lead to positive perceptions of the norm message and approached significance in ordering more vegetarian dishes. However, Study 8 was not well powered to detect smaller differences in vegetarian dish selection. In Study 9, we aim to compare these notes in a larger sample, with the improvements to visibility and referent groups, to the original note used in one of our field studies, as well as to a no note control.
12.1. Materials and Methods
12.1.1. Participants
Overall, 4980 adults with unique IP addresses in the United States took part, through Amazon’s Mechanical Turk, in a “4–5 min Psychology Survey” for 50 cents. Those who may have participated in Study 5–8 were ineligible to participate. The same criteria were used to drop participants as in Study 7, including 2.2% of responses likely coming from the non-U.S. participants, 0.9% of the total participants for faulty dish selection, 8.3% for smart phone use, 10.5% for waiting for the page timeout, and 0.1% for failing to answer free responses.
This left a sample of 3888 participants. Of the remaining participants, 41.5% self-identified as men, 57.8% as women, and 0.7% as non-binary. The mean age was 35.5. Moreover, 6.4% of participants indicated they were vegetarian, and were dropped from the analysis of whether their meal choice contained meat, leaving 3571 participants for that measure.
Roughly 900 participants per condition, with four conditions, yields 80% power to detect roughly a 7% difference between conditions in ordering more vegetarian dishes. While a final test of the improvements of this intervention would be with actual ordering behavior, and be powered sufficiently to detect smaller effects that may be realistic in field contexts such as the 1–3 percentage point change observed in the best circumstances in Studies 1–4, the present study allows us to estimate whether larger effects may be in possible with the improvements made to the note. A larger sample size also permits exploratory analysis contrasting effects for those who read the note vs. those who did not.
12.1.2. Procedure
Participants were given the same menu task and instructions as Study 6, followed by questions about the menu and note.
12.1.3. Manipulation
The same manipulation was used as Study 8, however there were only two referent conditions (Community and Non-Vegetarians), and the Original note that was used in Study 7. This note is originally from Study 3 and slightly adapted by removing regional language to match an Amazon Mechanical Turk sample. This was designed so that the content of the note in the original field study could be compared with the contents of the notes that have been developed over the course of these prior online studies.
12.1.4. Dependent Measures
The same dependent measures were used from Study 8.
12.2. Results
12.2.1. Vegetarian Selection
Compared to the Original note, the Non-Vegetarian note resulted in marginally more vegetarian dishes ordered,
z = 1.91,
p = 0.056. However, compared to the Control condition, the selection of vegetarian dishes was not different in any condition, all
zs < 1.07,
ps > 0.28 (see
Figure 8)
We report the additional results from each condition across measures in
Table 10.
12.2.2. Visibility
Compared to the Original Note, participants reported seeing and reading the note more often in Non-Vegetarian and Community conditions. However, compared to the Original note, there was no difference by condition in the percent of participants who recalled the dynamic norm accurately in the note. However, more participants did recall this information in the Non-Vegetarian note than the Community condition, z = 2.81, p < 0.01.
12.2.3. Note Ratings
Compared to the Original note, the Non-Vegetarian note and the Community note were rated as less accurate and sincere. However, the Community note was rated as marginally more normal than the Original Note.
12.2.4. Perceived Coercion
Compared to the Original note, participants in both the Non-Vegetarian note and the Community note conditions felt more coercion.
12.3. Discussion
The Non-Vegetarian note outperformed the note originally used in Study 3 (and 4), in terms of vegetarian dishes selected and visibility. The Community note did show significant increases on these measures. However, the Non-Vegetarian and Community notes did lead people to feel slightly greater coercion. Reactance related to these feelings did not, however, outweigh the gains in visibility and overall impact on food selected. Finally, unlike in Study 8, the Non-Vegetarian note did not have a clear improvement over a no note control in vegetarian dishes ordered, although directionally it did lead to fewer meat orders.
13. General Discussion
Across Studies 1–4, we incorporated dynamic-norm messaging into restaurant and the web-based menus in a scalable intervention to promote the consumption of vegetarian dishes. Studies 1–3 found modest increases in orders of vegetarian dishes from the intervention (1–2.5 percentage point shift of all purchases), although some these studies were underpowered and effects did not always reach significance. Further, exploratory analyses found substantial heterogeneity of effects in Studies 1–3. Study 1 found that the largest effects for patrons with a connection to the restaurant and the norm referent used, namely returning customers and members of the campus community at a campus eatery. Study 2 did not collect the full volume of observations planned, due to the abrupt closure of the business. With a smaller than planned sample, the intervention the 2.5 percentage point increase in vegetarian entrée orders observed was not significant. The originally planned study with the originally planned sample size did have sufficient power to detect an effect this size. Study 3 found a significant effect among the full sample, with lunch at a fine dining Italian restaurant. Meanwhile, in Study 4, which took place at the same restaurant as Study 3, but during the more expensive dinner hours, found the dynamic norm notes significantly reduced vegetarian ordering. Here, we also found moderation effects: customers who bought more items drove this backfiring effect, consistent with research showing that people who are higher in socio-economic status can experience reactance in response to social norms and thus resist such social influence to maintain their autonomy.
One interpretation for these results is that the dynamic-norm intervention may be better suited for contexts where people feel a connection with fellow customers (or other norm referents used), such as feeling they belonged to a common community, and less well suited for contexts where people are vulnerable to experiencing psychological reactance and thus resisting normative appeals, such as among wealthier customers at more expensive restaurants. However, the present studies were not designed to test these interpretations; thus, exploring them is an important direction for future research.
Studies 5–9 identify a number of areas for improvement in the intervention delivery and contents. First, most consumers likely did not read the notes used in the field studies, due to poor visibility of the note. We find that the visibility of the note was improved by placing it in a visually prominent area of the menu (the top left corner) and by using contrasting colors. However, large numbers of participants still failed to accurately recall its contents. Second, a common interpretation of the note was that it was about vegetarians or catering to vegetarians; hence, meat-eaters would not believe the note was for people like them, and therefore were unlikely to be influenced by it. We found that the norm can be augmented by selecting a referent that meat-eaters have a connection to, whether a member of a common community (Study 1), or a group that clearly included them—“non-vegetarians” (Studies 8 and 9).
When these changes were implemented in online surveys, the note was more likely to be read, and potentially more persuasive in changing ordering than the notes used in Studies 1–4. However, these results were on hypothetical lunch orders and were at times marginal or not significant in comparison to a neutral control. Moreover, critical comparisons of tests on ordering in online studies were underpowered to detect the small effects, 1–3 percentage point changes, that may be realistic in this context. Taken together, there appears to be substantial room for improvement in the development of a dynamic norm intervention in restaurant menus, which may yield stronger and more consistent results than those found in our initial field studies.
Effective, scalable, low-cost interventions to reduce meat consumption that have been rigorously tested under real-world conditions with large samples are not yet well documented. Considering that this intervention has little upfront or operational costs, even modest results may justify the inclusion of dynamic norm statements in restaurant menus.
Limitations and Future Directions
While the online studies in the present research begin to identify opportunities to enhance the impact of the intervention, field experiments with behavioral data remain the gold-standard for evaluating such improvements. We need field research to assess whether the changes documented here would produce more substantial and robust effects. Based on our results, future studies should assess notes that are (1) highly visible, (2) pretested to ensure customers have some connection to the norm referent used, so that the note is interpreted to be for and about people like them, (3) take place in settings that cater largely to working-class and middle-class customers, including fast food, fast casual, casual dining, premium casual, or family style restaurants, but not fine dining at dinner, and (4) be powered enough to detect effects as small as 1–3 percentage points.
Many psychological interventions find heterogeneity of effects across more representative samples [
25]. While the exploratory findings demonstrating heterogeneity are substantiated by related research on social norms, confirmatory research would help clarify these effects, and thus identify where and with whom dynamic norm effects on meat consumption are stronger or weaker.
14. Conclusions
We find that an intervention incorporating dynamic norms into restaurant menus to reduce meat consumption can yield positive but modest results, perhaps increasing vegetarian orders and reducing meat orders by approximately 2 percentage points across a number of real-world restaurant settings and online studies. Yet, this intervention can be improved in terms of its visibility and content, highlighting the possibility of larger effects. Generally, the costs of such an intervention are minimal, which may make even modest gains worth the investment.

 ,
, 


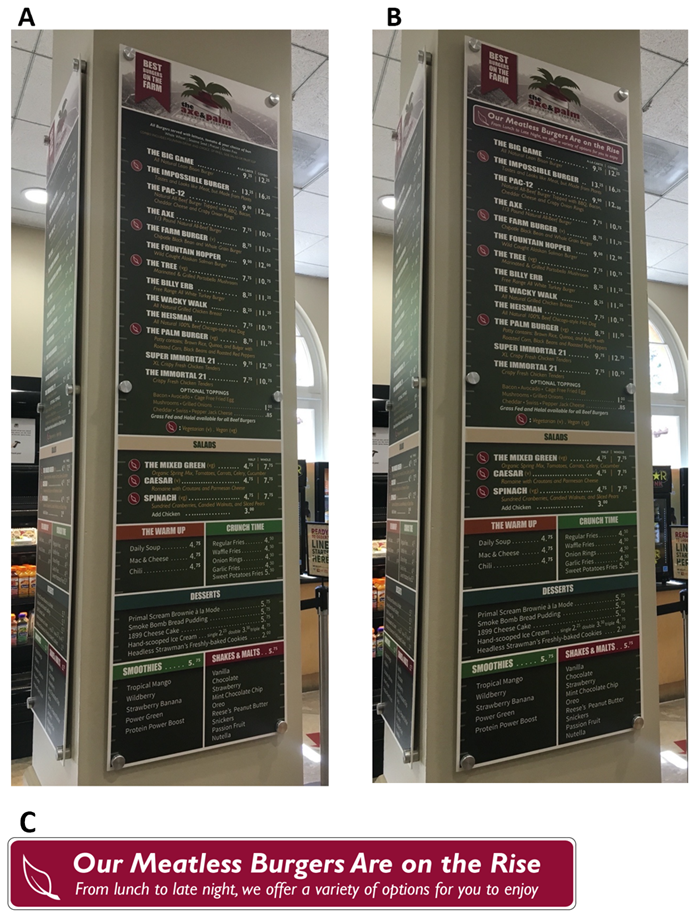