1. Introduction
Energy is an important enabler for sustaining people’s lives and achieving a country’s economic development. Through technological advancement, the global energy access rate has been largely improved over the past few decades. However, today, approximately 1 billion people around the world still have no access to electricity, and 2.7 billion people, which is equivalent to half the population in developing countries, rely on traditional fuels for cooking and heating [
1]. The situation for rural areas in developing countries is even worse, as they lack resources and infrastructure for access to modern energy. Many rural electrification projects have taken the approach of a grid-extension option, as it is considered a conventional way of supplying electricity. However, high reliance on the traditional fuels is not sustainable and exacerbates environmental damage. Therefore, the rural electrification project should aim for improving not just the energy access rate, but also access to sustainable energy services.
Many recent studies have confirmed that off-grid energy systems are economically viable, particularly in the areas with special geographical features, such as island or landlocked states. Lal and Raturi (2012) conducted a techno-economic analysis of a hybrid mini-grid system for the Fiji Islands and found out that the hybrid energy system (HES) of a PV, wind turbine, and diesel generator is the most ideal option [
2]. In the study of a small island in Greece which suffers from electricity shortage, the system configuration of a PV, wind turbine, battery, and internal combustion electrical generator using biogas is proposed as an optimal energy system that can meet the electrical and thermal demands of the island [
3]. Similarly, in the case of a resort located in Kuda Bandos Island in the Maldives, Jung et al. (2018) found out that a PV system incorporated with an energy storage system (ESS) is economically feasible and can reach grid-parity within the project lifetime, though a system with an advanced ESS remains an expensive option [
4]. While these studies have used Hybrid Optimization of Multiple Energy Resources (HOMER) for techno-economic feasibility analyses, Nernini et al. (2014) took a different approach by using a multi-criteria analysis and presented a number of benefits of deploying renewable and HESs in isolated areas, like the Brazilian Amazon [
5].
The economic viability of an off-grid energy system is also confirmed in many case studies of remote rural areas. The studies are particularly concentrated in African and South Asian countries, since most of these countries encounter the issues of not only energy shortage, but also adverse climate change impacts, and therefore need to find a way to supply energy in a more sustainable way. According to Mondal and Denich (2009), the study compared and analyzed the different configurations of renewable energy systems (RESs) for three remote rural areas in Bangladesh in order to define the optimal system as well as its optimum size [
6]. The analysis results showed that the HES, including 6 kW of PV, a 10 kW diesel generator, and a battery is the most economically feasible option for the target location. A similar study was conducted in Shahzad et al. (2017) for a remote rural village in the Punjab province of Pakistan, which mainly consists of agricultural farms and residential houses [
7]. This study performed HOMER simulation along with cost analysis and determined that the hybrid system of PV and biomass is economically feasible to be deployed in this region. The feasibility analysis of the HES of PV and a low-cost and advanced type of ESS was performed for a remote rural village in Myanmar by Kim and Jung (2018) [
8]. This study suggested that, although the rural village in Myanmar lacks resources, a leap-frogging approach which indicates the adoption of an advanced type of ESS in the HES is an economically viable option. The economic feasibility of HES is also proven in case studies of Nigeria. Ani and Abubakar (2015) designed a hypothetical electrification project for a rural health clinic in Nigeria and showed that the HES of PV, wind turbine, and battery is suitable for the health clinic and can be employed in other places where the electrical demand is relatively low [
9].
There are some studies which have taken a step further to determine the break-even grid-extension distance to observe to what extent the off-grid system is recommended. Using HOMER, Brenna et al. (2016) tested various system configurations for a rural community located far away from Addis Abba and computed the break-even grid-extension distance for each of the top three optimal systems [
10]. The computed break-even distances are between 45.7 and 48.3 km, depending on the system configuration. As the study location is 100 km away from the nearest grid, the off-grid system is suggested for the selected location. Yimen et al. (2018) also performed a techno-economic analysis of a renewable energy system (HRES) for a rural area in Cameroon and determined the break-even distance of 12.78 km [
11]. Since the selected location is 18 km away from the power transformer, the study concluded that the proposed HRES is a better option.
Based on the aforementioned studies, the off-grid energy system is confirmed as an economically viable option in many islands and remote rural areas. However, there are few studies focused on the renewable energy system in North Korea due to the limited information and data of the country. Among the few studies on North Korea’s energy system, a couple of reports have highlighted the potential for renewable energy development in North Korea. According to Kwak (2018), North Korea is currently active in developing a mini-grid system by enacting relevant laws and policies, and there is a rising number of houses and commercial buildings in North Korea that are being established with solar panels these days [
12]. Thus, this study assessed that the potential for renewable energy systems, particularly solar PV systems, is high in North Korea. Bing and Lee (2017) pointed out the rich renewable resources in North Korea and viewed that the prospect of a renewable energy system is bright in North Korea [
13].
Considering these points, this study designs a virtual electrification project for a small rural village in North Korea and compares the net present costs (NPCs) and levelized costs of energy (LCOEs) of off-grid systems and grid extension in order to determine the most cost-effective system. Moreover, this study computes the break-even grid-extension distance to confirm the cost-effectiveness of the off-grid system for the selected location. This study has its significance in two aspects. First, to the authors’ best knowledge, this study is the first to perform the cost analysis of an off-grid system for North Korea using a quantitative method. Although Kwak (2018) and Bing and Lee (2017) evaluated the off-grid system in North Korea, the arguments made in both reports are qualitative assessments based upon the news articles and macroeconomic indicators of North Korea, which is different from our study. This study proves the cost-effectiveness of the off-grid system through the NPCs, LCOEs, and break-even distances computed using HOMER and cost calculations. Second, it is the first study focusing on a rural area of North Korea in the context of energy development. Like Kwak (2018) and Bing and Lee (2017), Kim and Kim (2019) provide an analysis of North Korea’s energy sector, but this is a country-level evaluation which focuses on air pollutants caused by the energy sector [
14]. Our study, however, provides a site-specific analysis focusing on a rural village in North Pyongan, North Korea by utilizing the meteorological data of the site, and explores the question of whether the off-grid system is more cost-effective than the grid extension.
This paper is structured as follows. In the
Section 2, it provides an overview of the energy situation by providing the electrification rate, trend of energy supply, and generation by source in North Korea.
Section 3 mainly discusses how this study is designed to compare the off-grid system and on-grid system. It also describes in detail the input data for a HOMER simulation. In addition, the cost data and equations used for estimating the NPC and LCOE of grid extension are also introduced in
Section 1.
Section 4 mainly discusses the results and analysis of our study. It first provides the comparison of the NPCs and LCOEs of on-grid and off-grid energy systems. Then, it describes how the break-even distance of an off-grid system is calculated, and presents the results. Then, a sensitivity analysis is carried out to ascertain how the results change depending on different discount rates. Lastly,
Section 5 summarizes this study’s findings with some implications.
2. Overview of Energy Situation in North Korea
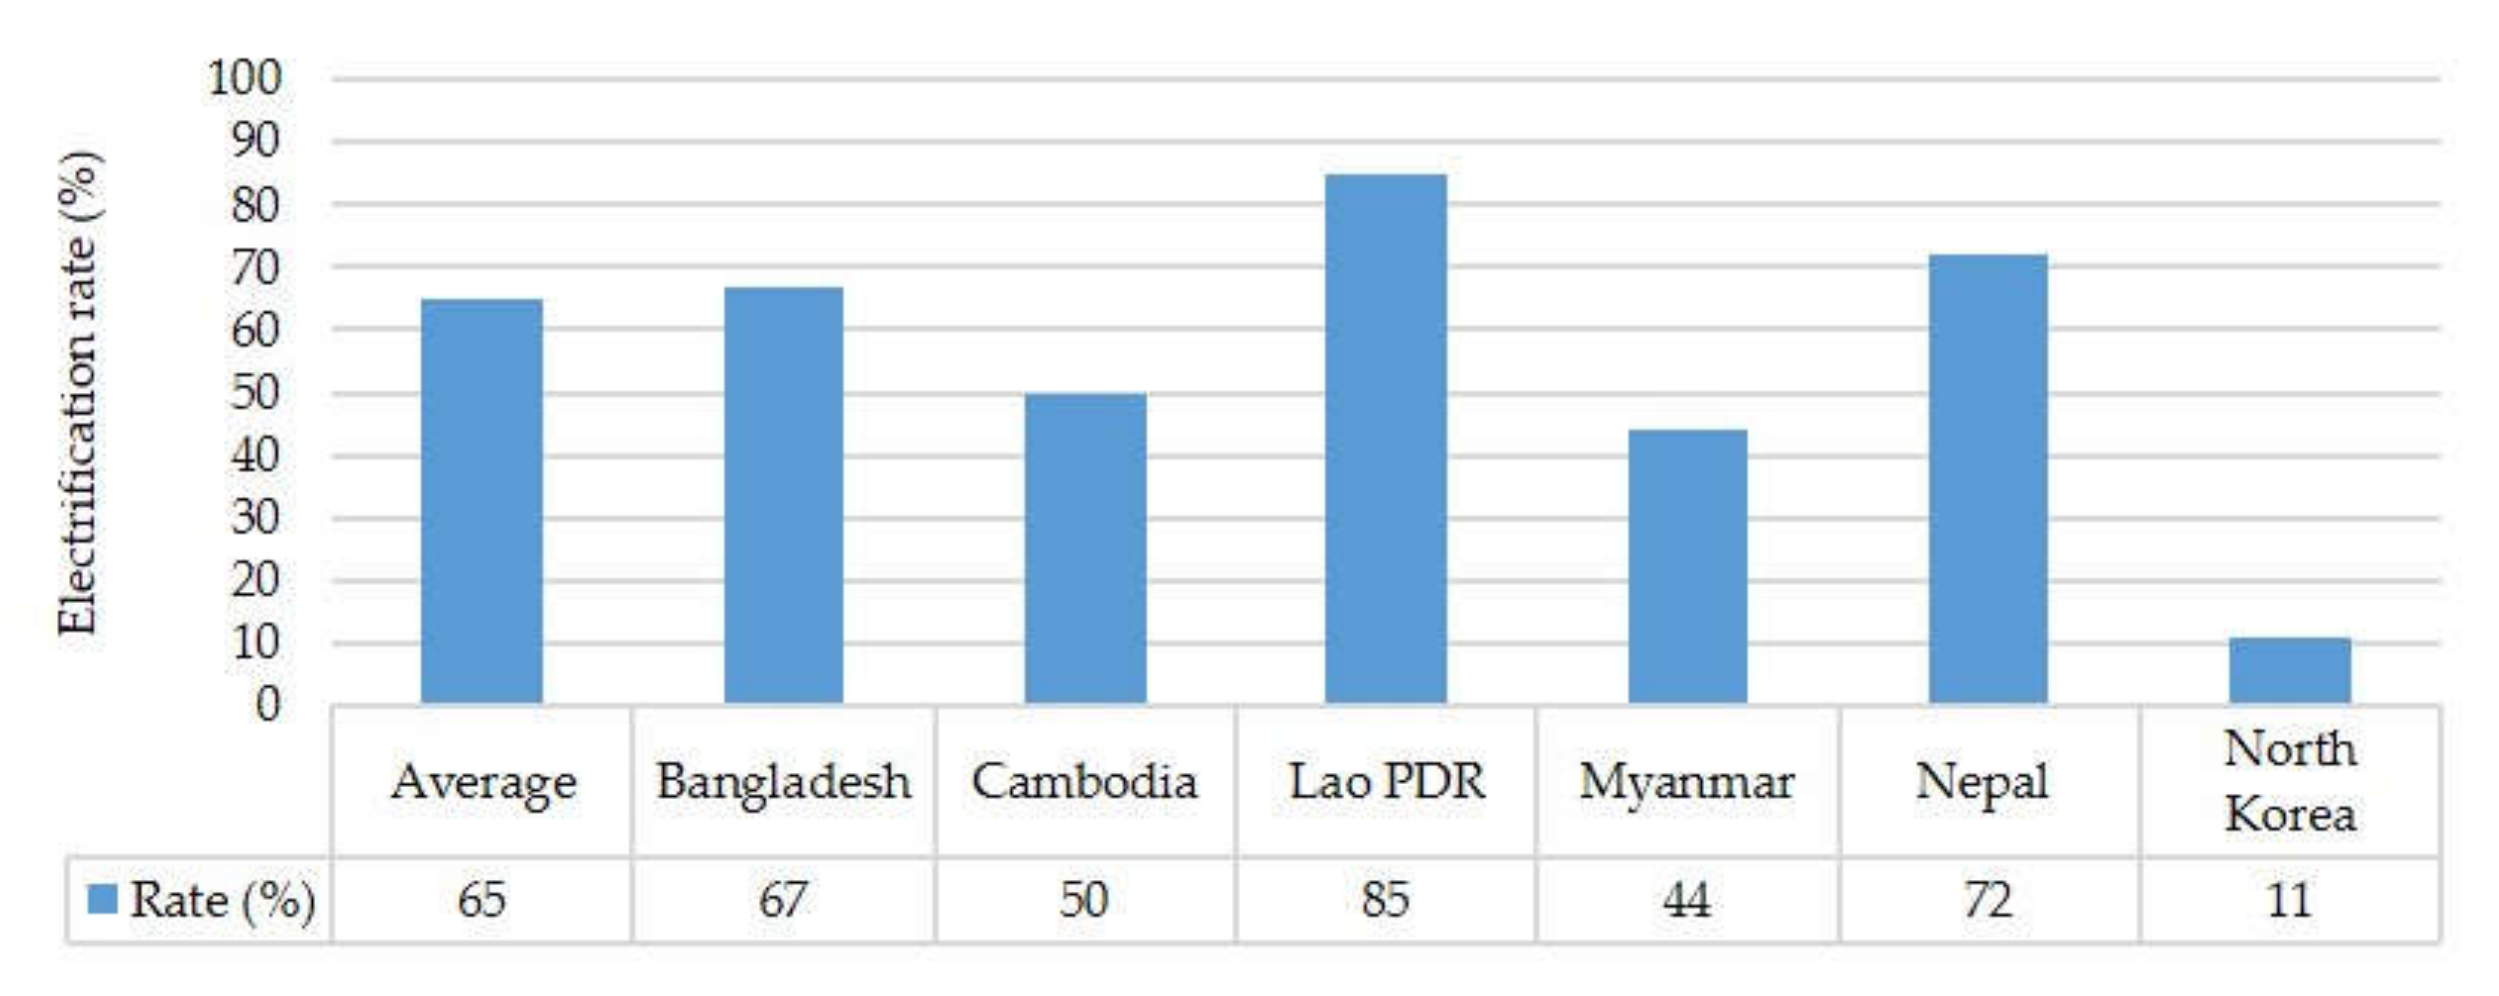
The power sector of North Korea currently faces many challenges. The national electrification rate of North Korea is only 27 percent, which is far below the 89 percent average for developing Asian countries [
15] (p. 116). The situation in rural areas is even worse, as only 11 percent of the rural population has access to electricity, whereas the average of developing Asian countries is 81 percent (see
Figure 1). The Energy Information Administration (EIA) also indicates that many existing electricity infrastructures in North Korea are outdated and in need of repair [
16]. North Korea’s electrification rate, therefore, is currently ranked at the bottom for developing Asian countries.
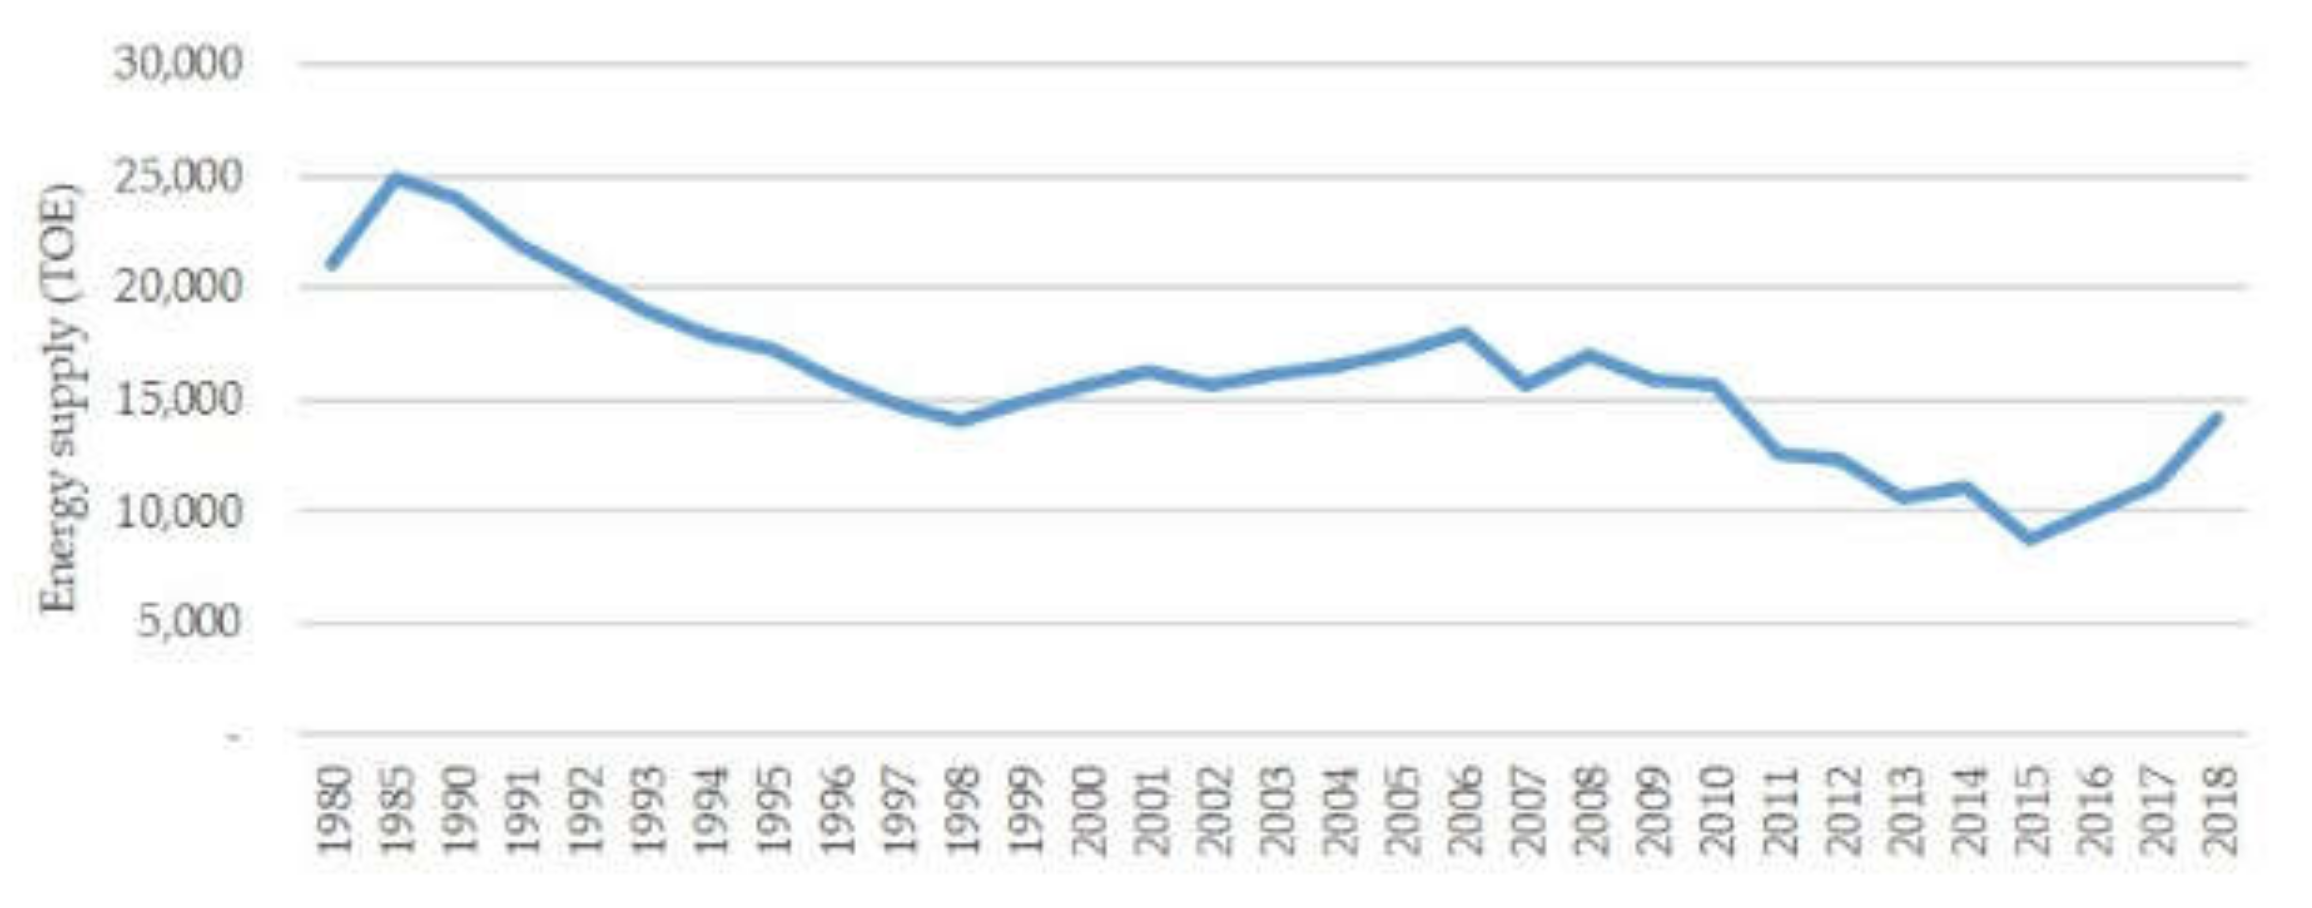
North Korea’s electricity supply shows a decreasing trend. The supply has been significantly reduced over the past approximately three decades. Due to the Arduous March, one of the greatest famines and economic downturns in North Korean history, the energy supply as well as demand plummeted in the early 1990s, as shown in
Figure 2. Since then, North Korea has experienced difficulty in recovering from the downturn. The total energy supply was only 9,910 Tonnes of Oil Equivalent (TOE) in 2016 [
17]. This indicates that North Korea is suffering from a chronic electricity shortage.
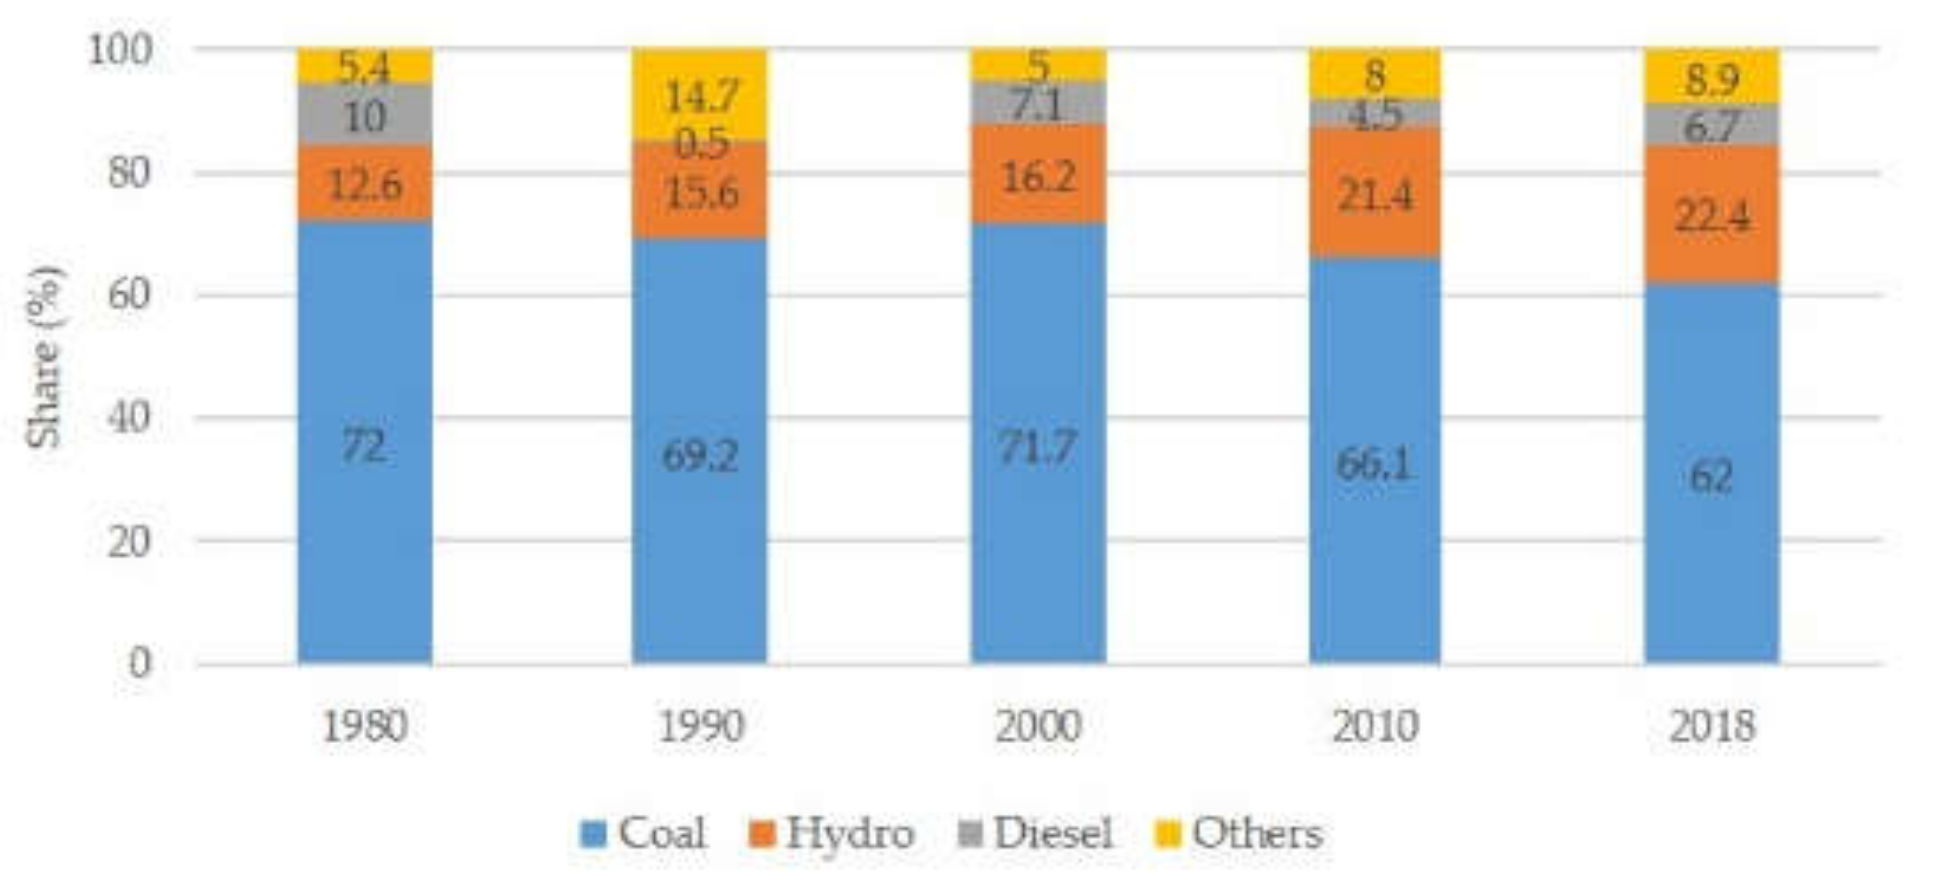
Another serious problem intrinsic to the North Korean power sector is heavy reliance on traditional fuels, particularly coal and hydropower. As shown in
Figure 3, coal and hydropower have long been the two main energy sources in North Korea. The heavy reliance on these sources is problematic for North Korea, since it leads to depletion of natural resources and environmental destruction. From 2000, North Korea began to construct dams in order to increase power generation, which, in fact, increased the proportion of hydropower generation (see
Figure 3, [
17]). However, the dams were constructed without a thorough review of their environmental impact, which resulted in serious environmental consequences, such as the collapse of the ecosystem and frequent landslides [
18] (p. 26). In addition, North Korea has maximized the use of coal in power generation, as it is endowed with rich mineral reserves [
19]. However, coal accounts for almost 50 percent of the power generation sources, which suggests that coal is over-extracted and supplies are likely to be depleted in the near future. Moreover, many North Koreans are currently using biomass as a daily energy source, mostly wood and crops [
18] (pp. 25). This is also a burden for the environment, as it leads to excessive logging and causes deforestation. Considering these aspects, North Korea should seek a way to increase electricity generation in more environmentally sustainable ways.
3. Materials and Methods
This study is designed for a small village located in Kibong-ri, Cholsan-gun, North Pyongan (39.5975, 124.6311), an un-electrified rural area [
20,
21,
22] (pp. 35, see
Figure 4). Based on Bing and Lee (2017), the area along the west coast in North Korea has rich wind resources, particularly in the summer, so it is known as an ideal environment for wind power generation [
13] (pp. 47, 49–51). In addition, the average daily radiation of the site is higher than in the northern European countries, namely France and Germany [
13] (pp.56). These facts indicate that the site has favorable conditions for an off-grid system. In
Section 3, the NPCs and the LCOEs of off-grid and on-grid systems are compared to find the most cost-effective energy system for the selected location. HOMER is used as a simulation tool for testing the economic and technical viability of different energy system configurations, which include solar PV, wind turbines, diesel generators, and batteries. In this process, two types of energy system configurations are tested based upon battery type: A conventional type of lead–acid battery and an advanced type of lithium-ion based ESS. After comparing the NPCs and LCOEs of an off-grid system and grid extension, this study also finds the range of break-even grid-extension distances. In the end, this study observes how this range changes in relation to different discount rates.
3.1. HOMER Simulation for an Off-Grid System
The HOMER simulation software, developed by the National Renewable Energy Laboratory (NREL) in the United States, allows the user to design various types of energy systems by inputting the technical specifications and costs of system components. The system components as well as natural resources can be defined by either HOMER or the user. HOMER contains a library of system components, of which it contains the data and technical specifications. In addition, it also includes up-to-date data on natural resources, such as solar radiation, temperature, and wind speed. However, the data of these components can be customized by the user. Lastly, the user should input the hourly electrical load of the selected site. With these data inputs, HOMER performs numerous simulations to define an optimal system that matches the supply and demand to serve desired loads. In addition, it allows the user to conduct sensitivity analyses for further assessment. Due to the various functions of HOMER with customized options, many studies have used it as a tool for conducting techno-economic feasibility analyses of off-grid energy systems [
3,
6,
7,
8,
11,
23,
24,
25]. Due to the various functions within HOMER with customized options, this study also uses HOMER to derive the NPC and LCOE of the most effective off-grid energy system for the selected location.
3.1.1. Load
The energy load is one of the important input factors in HOMER simulation. HOMER requires an hourly energy load in order to test the technical feasibility of a system designed in HOMER, or whether the system could meet different loads by hour. However, the target location is currently unelectrified, and it is nearly impossible to obtain the data for the actual energy loads of rural residential areas in North Korea at this moment. Thus, this study uses a synthesized load based on survey results about residential energy consumption gathered from 257 North Korean defectors [
18] (pp. 37). This survey asked in detail about the defectors’ hometowns and the types and daily usages of electrical appliances used at their houses in North Korea. We apply this information to configuring home appliances and their usage when calculating the electric load. However, the results from the defectors from Pyongyang are excluded, as Pyongyang is one of the most developed cities in North Korea. This study also refers to several other studies on rural electrification to adjust the load and generate a more realistic load pattern for the selected village. In addition, this study assumes that each household in the village has four family members, as this is the most common size in the rural area of North Pyongan [
26] (pp. 233–234).
Based on the survey results, we designed a household energy load, in which the energy is mainly used for lighting, entertaining, and cooling. This energy use pattern aligns with the energy demand for rural households in other regions [
27]. In addition, this study includes energy demand for heating, since North Korea experiences cold winters, and there is evidence that some households use a small heater [
18] (p. 23). Considering all of these, the electric load for a single household is calculated (see
Table 1). There is variation in lighting usage, as households use 0.5 hours less and more during summer and winter, respectively, due to the timing of sunset and sunrise. In addition, fans and heaters are used only for summer and winter, respectively. We assume that there are 120 households in the village and calculate the total load.
The load profile for this village in Kibong-ri shows variation throughout the day and the year. Based on the assumption and calculation, the electricity demand for this village is 5857 kWh per year. The demand is low during spring and fall and high during winter due to the use of heaters (see
Figure 5). The peak demand appears at nighttime, and a slight increase in demand in the morning and daytime from 11 to 12 (see
Figure 6). We assume that the energy demand for a household reaches a peak when all family members are at home. Thus, we set the nighttime as the peak load time, when all family members return home from work or school. The hourly load patterns described in
Figure 7. are typical for rural villages, as other rural residential areas show similar load patterns [
28,
29,
30,
31]. The demand at night is maximized in winter, as households use heaters at night. The demand increases in the morning, when people prepare to go to work and school, but this is not as high as the peak at night. There is a slight increase during the daytime for doing house chores, such as doing laundry and ironing. It is increased more during the summer, as households use fans during the daytime.
3.1.2. System Inputs
This study designs two types of energy system configurations based on different battery chemistries. In this study, a 1 kW of solar PV, a 100 kW wind turbine, and diesel generator are selected as base components for both system configurations, and one unit of either a lead–acid battery or lithium-ion battery is installed in each system configuration, as described in
Figure 7. Since this is a rural electrification project in a developing country, we take the lowest-cost option by using low-cost PV and a wind turbine manufactured in China for the simulation. As described in
Figure 7, this study applies a lead–acid battery and lithium-ion battery to each configuration in order to investigate the difference between NPC and LCOE due to the difference in battery chemistry and performance. Cost information is summarized in
Table 2, and a detailed technical specification of each of the system components is listed in
Appendix A.
3.1.3. Renewable Resources
The target location for this study is located at Kibong-ri, Cholsan-gun, North Pyongan, which is in the northwest of the country. As this site is adjacent to the Yellow Sea, it features an oceanic climate. The temperature is moderate throughout the year, and the annual average is estimated as 9.14 °C [
32,
33]. Such characteristics are favorable for operating PV systems because the systems do not operate at full capacity under extreme weather conditions.
The data on the solar global horizontal index (GHI) with the clearness index and wind speed for the selected site (39.5975, 124.6311) were retrieved from NASA and manually input in HOMER [
33]. The annual average of daily radiation is 4.18 kWh/m
2, with monthly variations; the highest and lowest radiation occurs in May and December, respectively (see
Figure 8). From April to June, this site reaches higher levels of daily radiation, above 5.0 kWh/m
2, whereas the radiation remains as low as 3.0 kWh/m
2 from November to January. Another important factor determining the performance of the PV system is the clearness index, which is the fraction of radiation that reaches a location. Like the solar GHI, the clearness index of this site has monthly variations, but remains higher than 0.5 on most days, except during the rainy season, from June to August. Due to the geographical features, there is a strong wind coming from the Yellow Sea. The wind speed data was measured at 50 m above the ground, and the annual average of wind speed is 5.61 m/s with slight variations by season (see
Figure 9). The wind speed drops as low as 4.53 m/s during the summer, but it remains higher than 5.0 m/s on most days throughout the year.
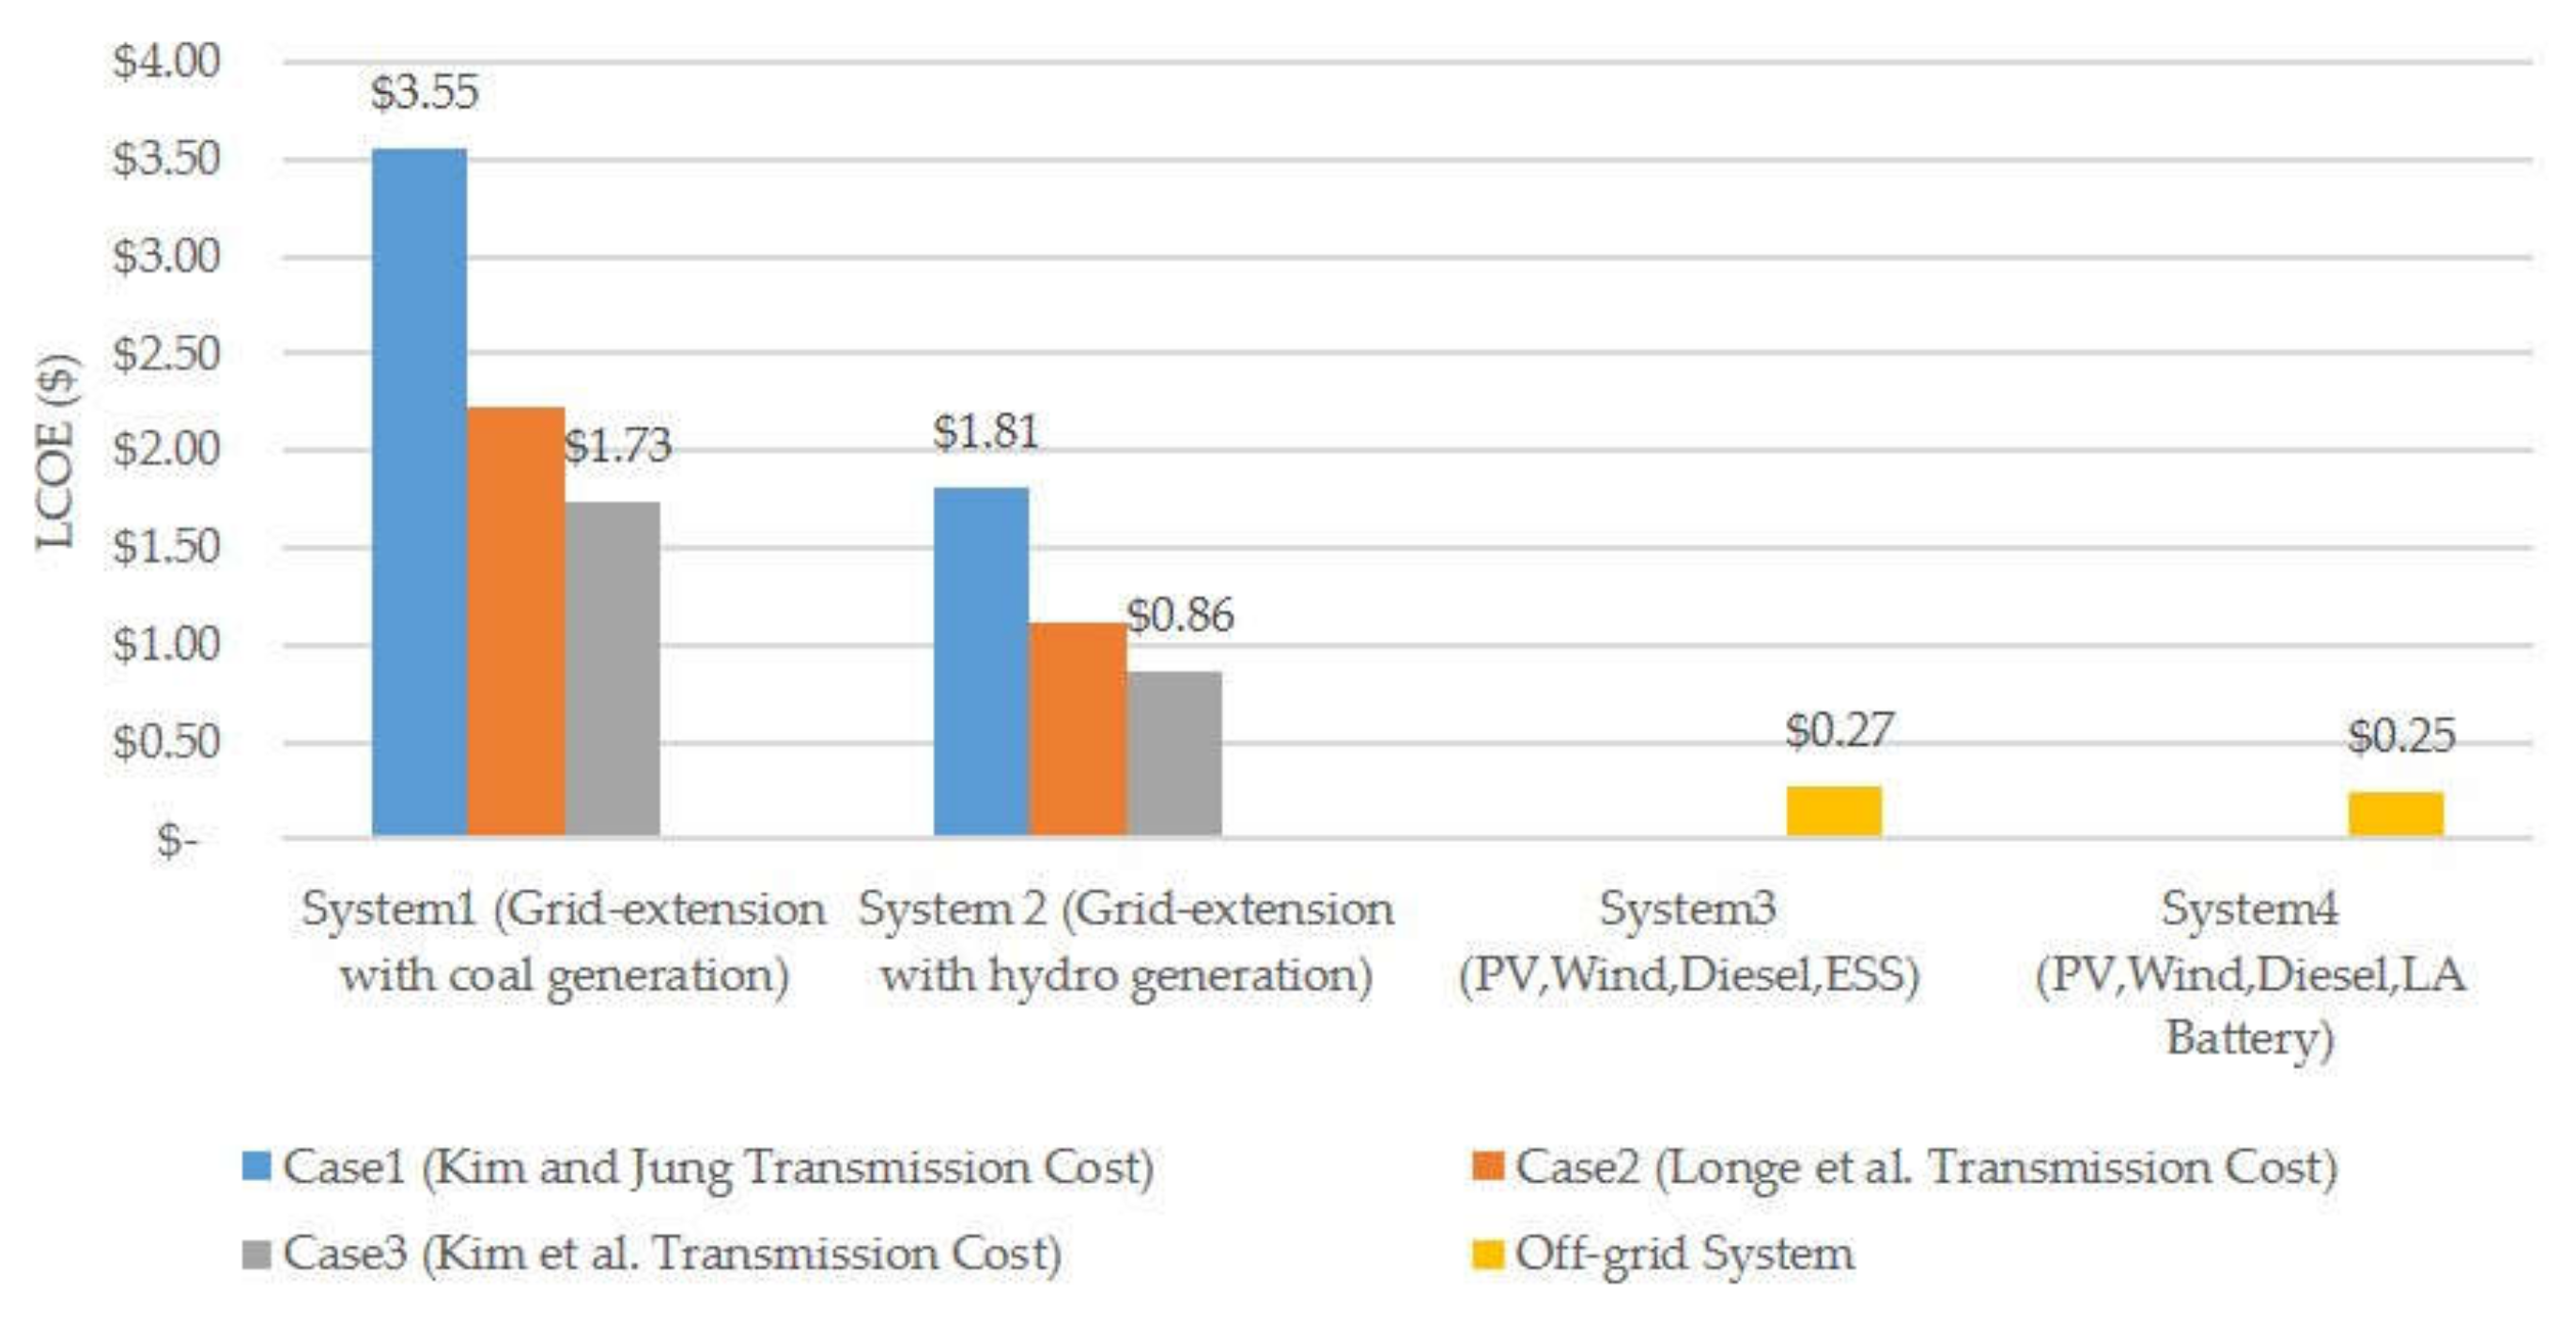
3.2. Calculation of NPC and LCOE for the On-Grid System
The costs for a grid-extension system are largely divided into three components—generation, transmission, and distribution. Each of the three components is comprised of three sub-components—capital cost, operation and maintenance (O&M) cost, and replacement cost. There exist two power plants—hydro and coal—near the target village, and the study assumes the use of these two power plants. According to the Korea Development Bank (2014), the hydro and coal power plants located in Sinuiju and Anju are 70 and 40 years old, respectively [
19] (pp. 148, 178). This indicates that the value of these facilities is nearly zero. For these reasons, we do not take into account the capital cost of generation in the calculation of NPC and LCOE. In addition, no major replacement is assumed for this study because the project is only focused on a 20 year long window. In general, there is a wide range of capital costs for transmission line construction. Thus, this study refers to three different sets of capital cost data and calculates a total of six NPCs and LCOEs.
3.2.1. Generation Cost
In this part, the annual O&M cost and fuel cost are considered for calculating the generation cost. The fuel cost is only calculated in the case of coal generation. With the given values of heat rate and heat content, this study uses the equation described below (Equation (1)) and calculates the amount of coal required for generating 1 kWh of power [
34]. Using this calculated value and the energy load of the village with the price of coal set at 0.05 USD/kg, the annual fuel cost for the coal power plant is calculated based on the equation presented below (Equation (2)). Referring to Dapice (2017) and Penn State College of Earth and Mineral Sciences, the annual O&M costs for both cases of power generation are estimated [
35,
36].
3.2.2. Transmission Cost
Two cost components are considered for calculating the transmission cost: Capital cost and annual O&M cost. The capital cost of transmission varies based on geographical features of the location and local labor costs. As this study focuses on a rural electrification project, it references costs from studies on rural electrification projects in South Africa, South Korea, and Myanmar with the range of costs between 18,232 to 43,500 USD/km [
8,
37,
38]. Taking these costs into account, we have measured the distance between the power plants and the village to estimate the distance of transmission lines that need to be extended. The nearest coal-fired power plant is located in Anju, which is about 100 km away from the target village. The hydropower plant is located at the Chongchon River, and the nearest substation connected from this power plant is at Sinuiju, which is about 52 km away from the site [
18,
19].
3.2.3. Distribution Cost
Similarly to transmission, the distribution process also comprises two types of cost components: capital cost of distribution lines and annual O&M cost. Cost information from the Latin America case is used as a reference for calculating the capital cost. NRECA International, Ltd. (2010) presents five different single-phase lines along with the respective costs, which are presented as US dollar per kilometer [
39]. In this study, the average of these five costs is used for calculating the capital cost. In addition, we estimate the distribution lines required for the village using Google Earth. In
Figure 10, yellow-highlighted lines along the village roads represent the required distribution lines, which are estimated as 5.5 km. Based on the Earth Institute (2014), the annual O&M cost is assumed as 1 percent of the capital cost for distribution lines [
40].
5. Conclusions
North Korea currently faces two critical issues in the energy sector. First, the national electrification rate is extremely low and the rate for rural areas is even lower. Another issue is the heavy reliance on traditional energy sources, which consistently exacerbates the environmental situation. Thus, the country needs to increase the energy supply by using more clean and renewable resources. In this case, the deployment of an off-grid system can be an optimal solution for the remote rural areas, as previously verified in many case studies. This study, therefore, has designed a virtual electrification project in a small rural village in North Pyongan, located far away from the grid, and investigated the most cost-effective option for the site. The cost comparison results showed that an HES equipped with a PV, wind turbine, battery, and diesel generator is found out to be the most cost-effective. Even an HES with a lithium-ion based ESS has lower NPC as well as LCOE than the grid-extension option. The computed break-even distances also confirmed that an HES is the more cost-effective option for the selected site, as the site requires at least 52 km of transmission lines, which exceeds the break-even grid-extension distances.
The results indicate that an HES is a more cost-effective way of supplying electricity to the remote rural villages that require more than 20.57 km of transmission line. If we assume the maximum cost for the grid-extension option, the break-even distance shortens to 9.69 km, which means that an HES will be a cost-effective option for more areas in North Korea. Currently, North Korea’s grid system is significantly degraded, so the transmission loss will be significant, in fact. Considering this aspect, the deployment of an HES is a more promising option for the remote rural region.
Moreover, many uncertainties and internal and external risks exist in North Korea at this moment. Thus, it would be reasonable to apply a discount rate that is even higher than 12% if this kind of rural electrification project is implemented in North Korea. Then, the break-even distance will become shorter than in our findings. This implies that an HES will be an even more cost-effective option in reality.
However, it should be noted that these results may not be consistent in other cases. The performance of an off-grid system is dependent on the natural resources of the site, which have a notable effect on the NPC. Thus, the optimal system configuration may differ by site. In addition, the result may be different by the target location’s electricity demand. For instance, the off-grid system may have a limit; to cover the electricity demand of industrial complexes in a remote rural region, an on-grid system using conventional generation may be more cost-effective. In addition, there is a limitation in our study that the study was conducted under hypothetical conditions constructed based on a survey of North Korean defectors and the literature of other rural developing countries. If more detailed data regarding the energy consumption pattern of the village become available, our study can provide more concrete results. As an alternative, the study can be further developed by establishing different energy consumption scenarios of the region and observing the cost-effectiveness of the HES. Despite some of these limitations, our study is notable in that it is the first study to prove the cost-effectiveness of an HES in a rural village in North Korea through the quantitative analysis and results. Since there only exist the studies on the energy sector of North Korea, which are either qualitative analyses or macro-level of analyses, our site-specific analysis of an HES in the aspect of cost is unique and clearly distinguished from the existing studies. In addition, the cost-effectiveness of the HES confirmed in this study provides a significant implication in that the deployment of HESs can play a major role in accelerating the electrification rate of the rural areas in North Korea.


