Article

Quantification of Greenhouse Gas Emissions from Wood-Plastic Recycled Composite (WPRC) and Verification of the Effect of Reducing Emissions through Multiple Recycling

1
Graduate School of Bioresources, Mie University, Tsu 514-8507, Japan
2
Graduate School of Life and Environmental Sciences, Kyoto Prefectural University, Kyoto 606-8522, Japan
*
Author to whom correspondence should be addressed.
Sustainability 2020, 12(6), 2449; https://doi.org/10.3390/su12062449
Submission received: 4 March 2020 / Accepted: 19 March 2020 / Published: 20 March 2020
(This article belongs to the Section Energy Sustainability)

Abstract

:
Wood-plastic recycled composite (WPRC) is a building material that uses certain amounts of recycled wood and/or plastic materials contained in wood-plastic composites. They are characterized by multiple recycling processes in which products that become post-consumer materials are technically able to be recycled to produce WPRC products. However, there is no research case that quantifies the effect of reducing greenhouse gas (GHG) emissions for the feature of multiple recycling. In this study, we quantified GHG emissions during the life cycle of WPRC that was manufactured by companies certified to the Japanese Industrial Standard (JIS) A 5741, using the life cycle assessment method. The following conclusions were revealed in this study. (1) The GHG emission of the targeted WPRC was 3489 kg-CO2e/t, and the emission rates from the WPRC production process and the combustion of WPRC waste were found to be particularly high. (2) It was found that setting the recycled material rate of plastic materials to 100% would reduce GHG emissions by 28% (1316 kg-CO2e/t) compared to when the recycled material rate was 0%. (3) It was also found that GHG emissions can be reduced by up to about 28% by multiple recycling of WPRC. It can be said that this study set a benchmark of GHG emissions for WPRC produced in Japan.

1. Background and Purpose

The Paris Agreement, a framework for climate change control, came into effect in November 2016, and measures to significantly reduce greenhouse gas (GHG) emissions are required in all aspects of society. CO2 is a major GHG. In Japan, CO2 emissions from the construction sector account for approximately one-third of the total emissions [1], and it is recognized as an area where countermeasures are highly important. Therefore, comprehensive evaluation of the environmental efficiency of buildings and significant reductions of GHG emissions are urgently needed.
LEED (Leadership in Energy and Environmental Design), BREEAM (BRE Environmental Assessment. Method), and GB tool (Green Building Tool) are well-known systems for evaluating the environmental performance of buildings. Comparative studies of these evaluation systems are underway [2,3]. In this, for example, an evaluation factor included in LEED is the use of building materials that quantify GHG emissions based on the life cycle assessment (LCA) method. CASBEE, the Japanese version of the environmental efficiency evaluation system for buildings, has been displaying life cycle CO2 emissions in building evaluation results since the 2008 version, indicating the environmental efficiency of the building quantitatively [4]. LCA is an effective method for quantitative analysis of GHG emissions, and the importance of LCA for buildings is growing.
Many previous studies have quantified GHG emissions by performing LCA of buildings and have been systematically summarized in several reviews [5,6]. In addition, comparative studies have been conducted on the effects of reducing GHG emissions by replacing interior walls and windows [7] and exterior walls [8] with environment friendly products. Further, it has been pointed out that GHG emissions resulting from the building usage processes account for a large proportion of overall GHG emissions from buildings [5,9,10]. The introduction of high-performance energy-saving equipment to buildings will minimize emissions from the use and maintenance processes [11]. In addition, the use of renewable energy to power building use and maintenance processes can significantly reduce GHG emissions. There have been some advanced studies on the introduction of renewable energy having good price parity, suggesting the potential for future wind and solar deployments [12,13,14]. If emissions reductions from the use and maintenance steps are realized, the rate of emissions from the other processes, that is, the manufacturing and procurement steps for building materials and the disposal and recycling processes for building materials, becomes relatively large, and the importance of countermeasures increases. An LCA review of building materials points out that there is little data on building materials in the LCA database, so it is necessary to accumulate basic knowledge [15].
Wood-plastic recycled composite (WPRC) is a building material that uses certain amounts of recycled wood and plastic materials contained in wood-plastic composite (WPC) [16,17]. These materials are mainly used as exterior deck materials. They are characterized by multiple recycling processes in which products that become post-consumer materials are technically able to be recycled to produce WPRC products [18]. This high environmental consideration differentiates these materials from others.
JIS A 5741 in the Japanese Industrial Standard (JIS) [19] stipulates the types and blending rates of recycled materials used as raw materials for WPRC, basic physical properties required in WPRC, and their testing methods. Additionally, WPRC manufactured at JIS-certified factories are also marketed. Moreover, WPRC products that have obtained JIS certification are designated under the “Basic Policy on Promoting Green Procurement” as specified procurement items under the “Green Purchasing Law”. In this manner, the marketing of environmentally friendly products is becoming a popular trend.
Previous studies on LCA of WPC include that of Bolin and Smith [20], who described a case where WPC using HDPE (High Density Polyethylene) as a plastic raw material was used as a deck material and compared it with a solid wood deck treated with alkaline copper quaternary (ACQ). For this LCA, WPC was modeled as if manufactured from 50% recycled wood flour, 25% post-consumer recycled HDPE, and 25% virgin HDPE. In addition, a sensitivity analysis was performed where all HDPE used was virgin HDPE. Sensitivity analysis showed that WPC made with post-consumer recycled HDPE was less impactful than those made with virgin HDPE. The results showed that WPC made with consumer HDPE was less impactful than those made with virgin HDPE. In addition, Philipp et al. [21] performed LCAs on WPCs in their own research and found that in WPC made of virgin materials, the more the amount of wood used, the lower the potential environmental impacts. In WPC made with a high amount of secondary wood, processing of secondary wood particles contributes to the overall environmental impacts because secondary plastic granulates are directly useable in the context of an established market for high-quality secondary plastic granulates. These studies are important findings that suggest that the use of recycled materials in plastic-based materials will reduce the environmental impact. However, foreground data are rarely collected at the production step for important processes.
GHG emissions during the WPRC life cycle were quantified in our 2009 study based on production-level foreground data provided by eight WPRC manufacturing companies [22]. In addition, the reduction in GHG emissions in comparison to WPCs was also revealed. However, the number of companies that acquired the JIS A 5741 certification increased to the current four in 2011, and GHG emissions from WPRC based on JIS standards have not been quantified. In addition, there is no research case quantifying the effect of reducing GHG emissions through multiple recycling.
Therefore, in this study, we quantified GHG emissions during the life cycle of WPRC manufactured by JIS A 5741-certified companies. In addition, we conducted a simulation showing changes in GHG emissions when the mixing rate of recycled materials was changed and verified the effects of the mixing rate of recycled materials on GHG emissions. Furthermore, to clarify the GHG emission reduction effect of multiple recycling, multiple scenarios were simulated and GHG emissions in each scenario were compared.

2. Evaluation Target and Methods

2.1. Evaluation of GHG Emissions from the Life Cycle per Ton of WPRC Products

GHG emissions from the WPRC life cycle were calculated using the LCA method. The evaluation targets were WPRC products manufactured by four companies that acquired the JIS A 5741 certification, and the functional unit was one ton of these products. This is because the shape of the product varied depending on the manufacturing companies, so setting the basic unit as weight was most appropriate. The system boundary was from the cradle to the grave. Figure 1 shows the life cycle flow diagram. The shapes of wood-based and plastic-based raw materials upon arrival at the factory during the raw material procurement step differed depending on each company. Therefore, in Figure 1, each company is denoted as Pattern A (1 company), Pattern B (2 companies), and Pattern C (1 company).
This section explains data collection during each process. Foreground data were collected as much as possible through interviews with the four companies being evaluated. For those processes where foreground data could not be collected, conditions were set based on the scenario and background data that seemed reasonable. The data were collected for one year from April 2016 to March 2017.

2.2. Evaluation of GHG Emissions When the Recycling Rate of Plastic-Based Raw Materials Is Changed

JIS A 5741 defines the recycling rate of raw materials as 40% or more, and WPRC available in the market has various recycling rates. However, in most cases, recycled materials such as building demolition materials, wood shavings generated at sawmill, and timber from forest thinning are used as wood-based raw materials, and virgin materials are not included. Therefore, in this study, all wood-based raw materials were considered recycled materials, and the GHG emissions were estimated by changing the recycling rate of plastic-based raw materials. All other raw materials such as pigments and additives were virgin materials.

2.3. GHG Emission Reduction Effect by Multiple Recycling of Used WPRC

WPRC has the advantage of “multiple recycling” in that we can collect used products such as deck materials and repeatedly use them as raw materials for WPRC. In evaluating the GHG emission reduction effect resulting from this multiple recycling, we referred to the evaluation scope proposed by Wada et al. [23]. Then, the evaluation range was set as shown in Figure 2, and the GHG emissions from WPRC were calculated. The life cycle flow of product A in the multiple recycling case presented in Figure 2 was assumed to occur as shown in Figure 1; the life cycle flow of product B was set as shown in Figure 3, and data were collected. The data collection method for each process was the same as that explained in Section 2.1.
In the multiple recycling cases, scenario 1 was first established in which all the used WPRC materials generated in the “disposal and recycling step” in the life cycle of product A were recycled as raw materials, except for those that were landfilled. Next, it was assumed that some of the used WPRC had degraded quality and some were difficult to recover owing to problems in the construction environment. Therefore, scenario 2 was established in which 50% of the used WPRC were recovered and recycled. In addition, for comparison, scenario 3 was set considering the case without multiple recycling, representing the current situation.
By comparing the GHG emissions between these scenarios, we examined the effects of multiple recycling on GHG emission reduction.

3. Results and Discussion

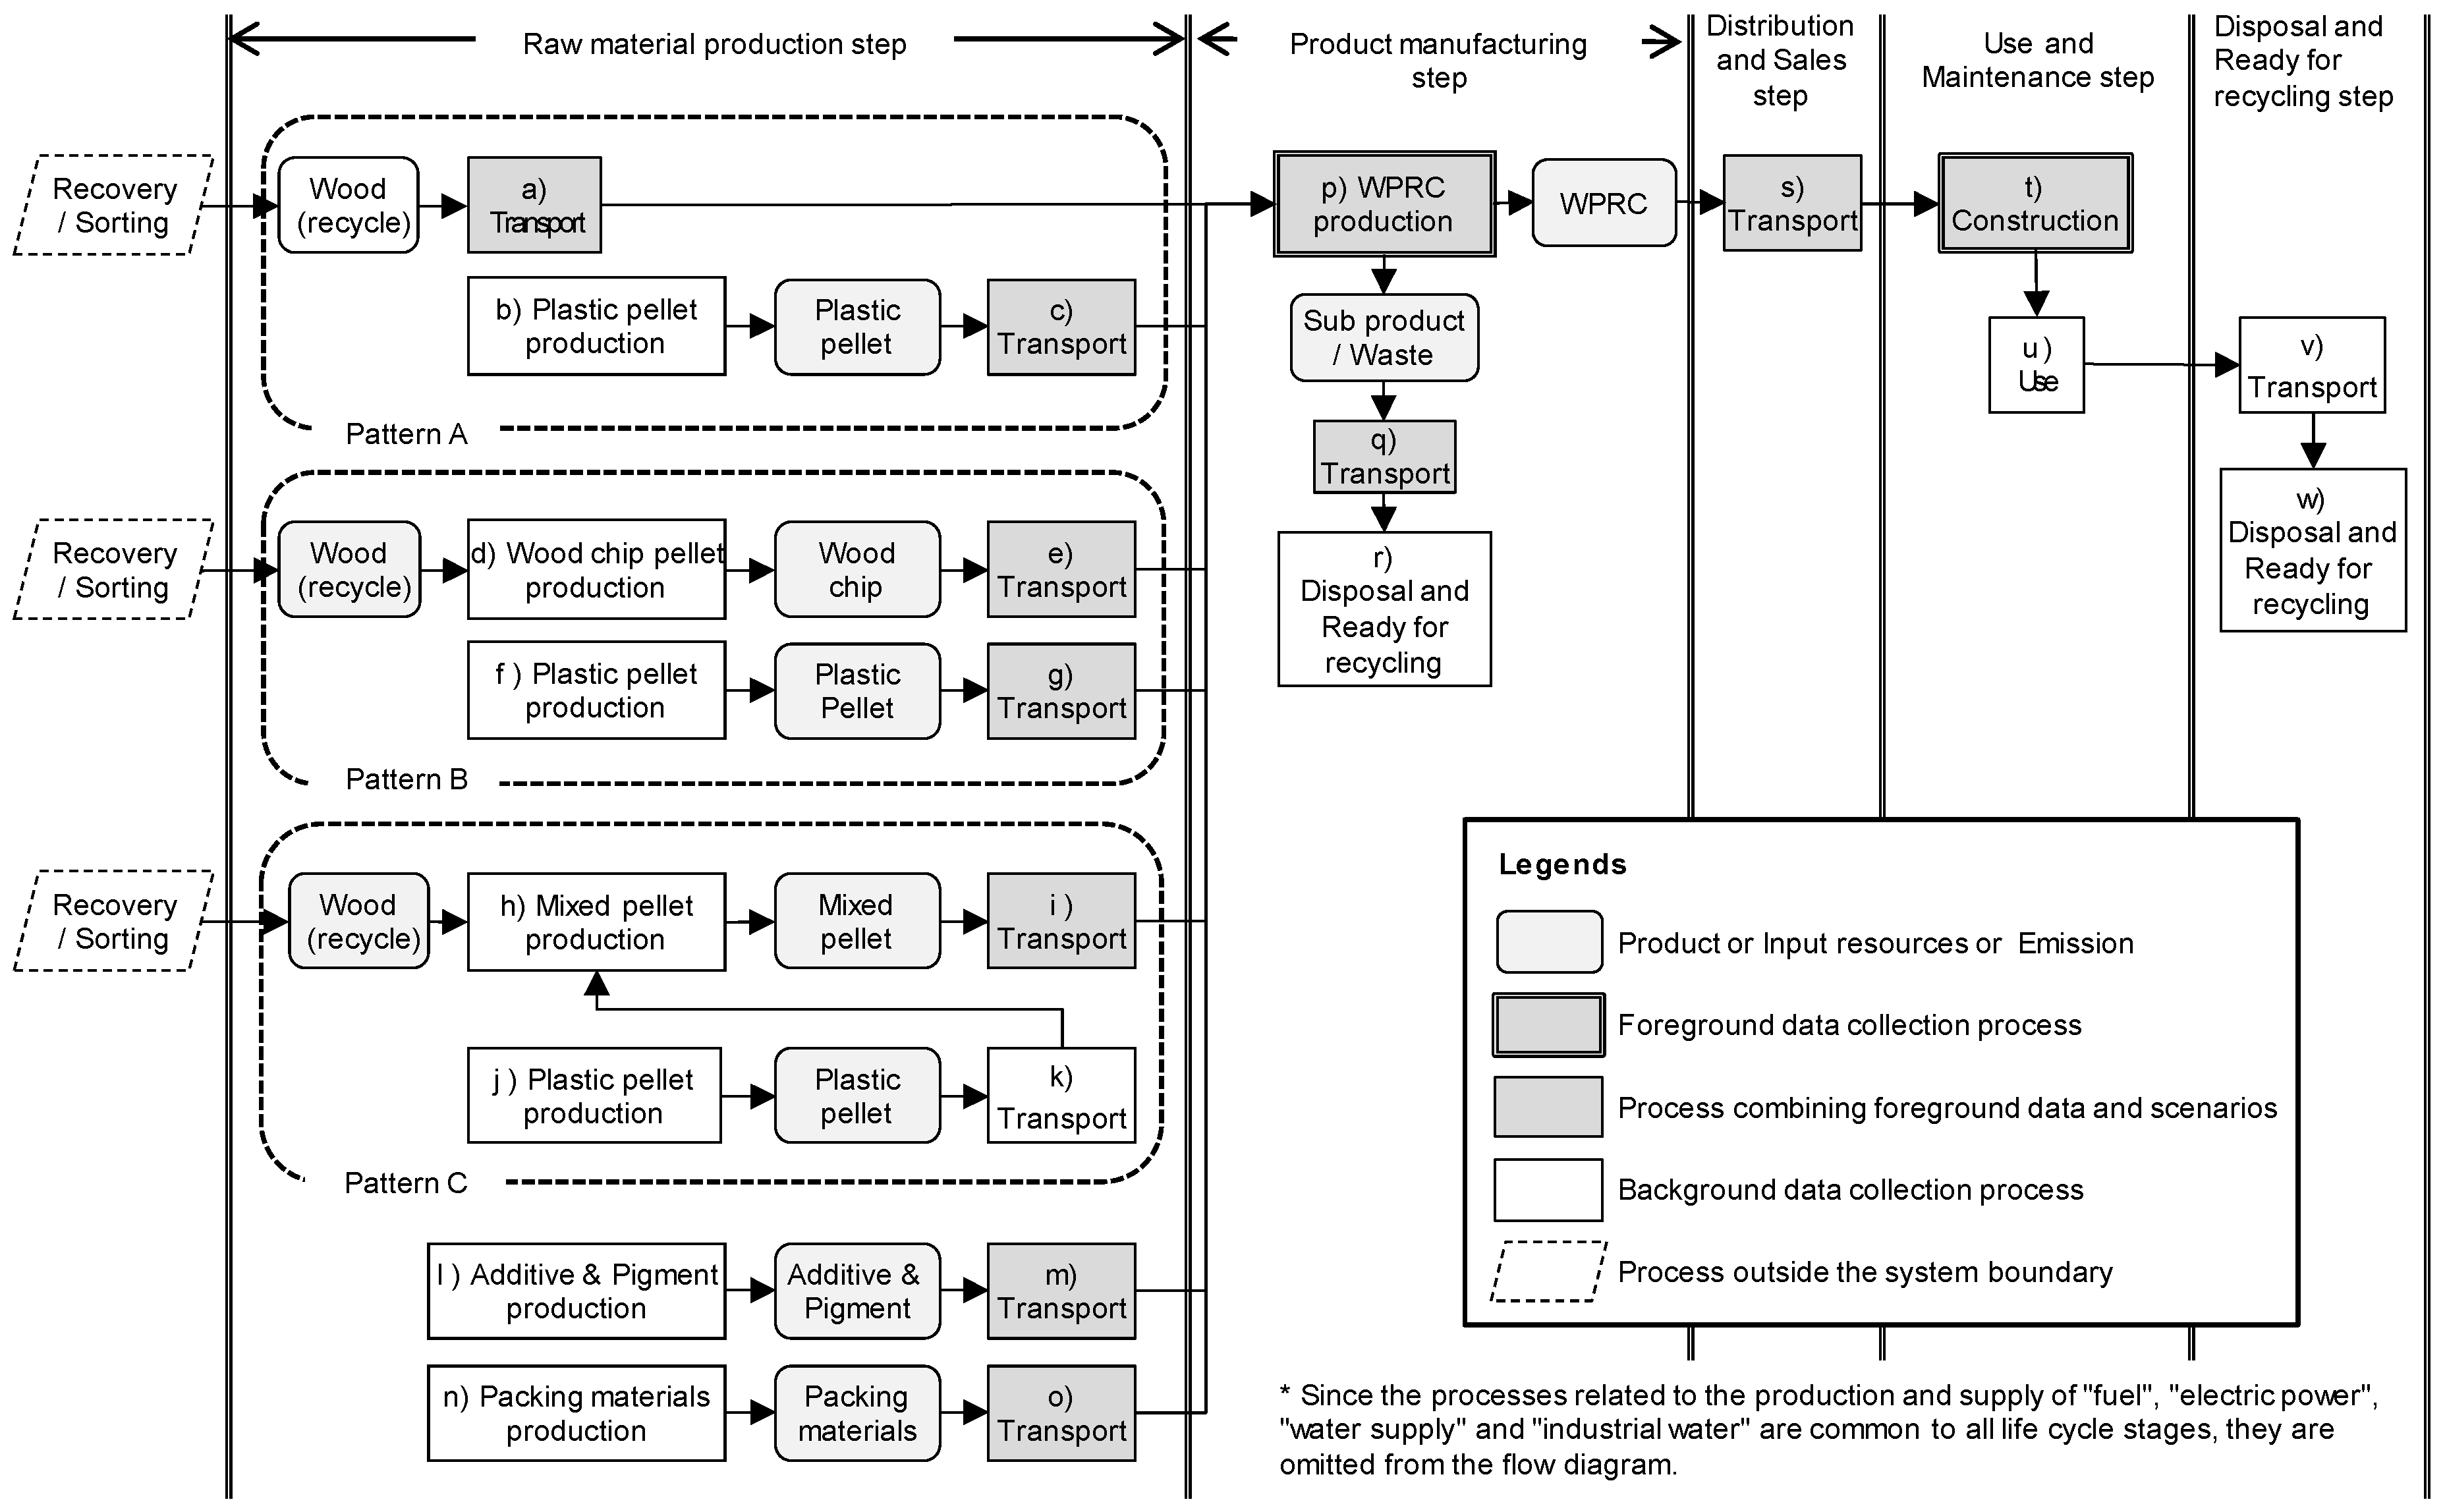
3.1. Life Cycle Inventory per Ton of WPRC Product

Table 1 presents the life cycle inventory per ton of WPRC products obtained using the data provided by the target companies. The values in the table are weighted average values obtained by weighting the data obtained from the four companies by the annual production of WPRC products. The alphabets listed in the “Corresponding Figure 1 process” column are linked to those in the Figure 1 process. The production and transport processes for mixed pellets are included in the procurement process for wood-based raw materials. This is because much of the energy consumed in the mixed pellet production process is used to produce wood flour from wood-based materials. The various steps in the WPRC product life cycle are discussed below.

3.1.1. Raw Material Production Step

Foreground data were obtained for the type and input of each raw material. As a result, the wood-based raw materials, plastic-based raw materials, and pigments and additives to produce WPRC were blended in the ratio 47:43:10.
In addition, the recycling rate of the WPRC targeted in this study was approximately 86%. The breakdown is that 100% of the wood-based raw materials were recycled materials, with approximately 91% of the plastic-based raw materials being recycled materials. Since no foreground data were obtained for the ratio of recycled materials of pigments and additives, all were set as virgin materials (recycled material ratio 0%). Table 1 shows the types of resources used as additives and pigments.
For each transportation process, foreground data on the location of each raw material dealer were collected. Further, the shortest distance was identified by searching the distance between the store and WPRC production base using Google Maps. As for the means of transportation, part of c) transport in Figure 1 was railway transportation. The rest was truck transport. We also collected information on truck standards but could not obtain accurate information except that some of a) transport and e) transport in Figure 1 was with 2 ton trucks. Therefore, the scenario from wood-plastic composite (PA-CB-01) in the Carbon Footprint Product Criteria for Carbon Foot Communication Program (CFP-Program) [24] was used. The CFP program is a system for displaying GHG emissions from the life cycle of products and services implemented in Japan. In this scenario, if foreground data cannot be obtained, domestic transportation can assume the use of a 10 ton truck and a loading rate of 50%. The homeward path was also included in the system boundary with a loading rate of 0%. For truck loading rates, a lower loading rate was used if foreground data were not available, to avoid underestimating the analysis results. The same applies when adopting a scenario below.

3.1.2. Product Manufacturing Step

For producing the product in the product manufacturing step, in general, a compounding step of melting and mixing a wood-based raw material, a plastic-based raw material, a pigment, an additive, and the like is first performed, and then the process is shifted to an extrusion molding step.
Foreground data were collected on the resources and waste generated in this process based on the data provided by each company and interviews.
Regarding the treatment of waste generated in the product manufacturing step, waste types and emissions were calculated based on data provided by each company. Foreground data on disposal and recycling methods could not be collected, so data from the Ministry of the Environment was cited [25]. In other words, 78.5% of the generated waste was incinerated, 1.1% was directly landfilled, and 20.4% was recycled. CO2 emissions from incineration were counted from plastic-based raw materials, but those from wood-based materials were not counted as carbon neutral. Regarding the transport process of waste, the scenario from wood-plastic composite (PA-CB-01) [24] among carbon footprint product type standards in the CFP-Program is quoted as “2 ton truck, transport distance 100 km, loading rate 25%”. The homeward path was also within the system boundary with a loading rate of 0%. The waste transport distance was set based on the assumption that the WPRC manufacturing company and waste disposal facility were in the same prefecture.

3.1.3. Distribution and Sales Step

Regarding the transportation process in the distribution and sales step, it was difficult for any company to specify the distribution routes from the WPRC production base because they were diverse and national. Therefore, the transportation scenario from wood-plastic composite (PA-CB-01) [24] was established involving the following conditions: 10 ton truck, transportation distance of 1000 km, and loading rate of 50%. The product transport distance was twice as long as the road distance (about 500 km) between Tokyo and Osaka, the major cities in Japan. This is a reasonable setting for nationwide sales of products.

3.1.4. Use and Maintenance Step

For the construction process, we collected data on the usage time of electrical equipment when fabricating WPRC as deck materials from each company. The power consumption when producing one ton of products was calculated from the average power consumption of the electrical equipment. For usage process, during the usage period, maintenance was not performed, and we did not consider input resources and emissions during this step.

3.1.5. Disposal and Ready for Recycling Step

For waste treatment scenarios, as the foreground data could not be collected, the processing situation in the data of the Ministry of the Environment [25] was considered as in Section 3.1.2. In other words, 78.5% of the generated waste was incinerated, 1.1% was directly landfilled, and 20.4% was recycled. CO2 emissions from incineration were counted from plastic-based raw materials, but those from wood-based were not counted as carbon neutral. Regarding the transportation process, a scenario was quoted from wood-plastic composite (PA-CB-01) [24], and it was set as “2 ton truck, transportation distance 50 km, loading rate 50%”. The homeward path was also within the system boundary with a loading rate of 0%. The waste transport distance was set based on the assumption that the WPRC manufacturing company and waste disposal facility were in the same prefecture. It was shorter than the transport distance between the WPRC manufacturing company and the waste disposal facility set in Section 3.1.2. This was because WPRC manufacturing companies are often located away from urban areas.

3.2. GHG Emissions from the Life Cycle per Ton of WPRC Products

The inventory data presented in Table 1 were multiplied by the GHG emission intensity, and the GHG emissions (kg-CO2e/t) were calculated using the build-up method. The results are given in Table 2. The GHG emission intensity was calculated mainly using IDEA v2.2, a life cycle inventory database. IDEA v2.2 is provided by the Society and LCA Research Group of the National Institute of Advanced Industrial Science and Technology (AIST), the Safety Science Research Institute, and the Japan Environmental Management Association for Industry (JEMAI). This database covers the economic activities of all businesses (excluding some services) in Japan. It also strongly supports LCA with a resolution of 3800 or more data sets [26].
The GHG emission during the life cycle of one ton of WPRC products was 3489 kg-CO2e/t. The unit “CO2e” means CO2 equivalent, and indicates that various GHG emissions were converted to CO2 using the global warming potential.
Philipp et al. set the GHG emissions from WPRC for modules A1–A3 in the system boundary of cradle to gate, in accordance with EN 15804 and EN 16485, at 780 kg-CO2e/t [21]. The setting scenario was “Recycled materials are used for both wood-based and plastic-based materials, and the mass rate of wood is 58%”. The setting conditions were close to those in our study. A simple comparison cannot be made, due to differences in the calculation conditions between the previous study and this study, but GHG emissions within the same system boundary are 1920 kg-CO2e/t in this study, which is about 2.5 times higher than that in the previous study. The reason is that in the previous study, the electricity used in the WPRC production process was derived from renewable energy composed of hydropower and biomass energy, whereas in this study, the GHG emission intensity of electricity in Japan was used. Fossil fuels such as coal, oil, and natural gas account for over 70% of Japan’s power mix. This difference in GHG emission intensity from electric power has a great effect.
It was found that emissions from the product manufacturing step and disposal and ready for recycling step were the highest, accounting for approximately 1/3 of the total emissions. Emissions during the product manufacturing step accounted for a large percentage of the entire life cycle; moreover, it was found that the efficiency and energy saving potential of the production line in the factory significantly contributed reductions in GHG emissions. In addition, the proportion of emissions from combustion of waste was high. Thus, GHG emissions could be reduced by reducing the rate of incineration and increasing the rate of recycling.

3.3. GHG Emissions When the Recycling Rate of Plastic-Based Raw Materials Is Changed

Based on the results of the WPRC life cycle inventory discussed in Section 3.1, the recycling rate of the plastic-based raw materials that were input was changed, as mentioned in Table 3, to verify its effect on GHG emissions. It was assumed that the wood-based raw materials had a recycling rate of 100%, and the wood-based raw materials, plastic-based raw materials, and the pigments and additives were mixed in the ratio 47:43:10.
The results are shown in Figure 4. When the recycling rate is 100% (Pattern 1), the GHG emission from the WPRC was 3363 kg-CO2e/t, the lowest among all patterns. When this result was compared with Pattern 7 (only wood-based materials were considered recycled materials) where the GHG emissions were the largest, it was found that Pattern 1 had only approximately 75% of the GHG emissions observed in Pattern 7.
As mentioned in Section 2.2, JIS A 5741 defines the recycling rate of raw materials as 40% or more. Therefore, even when only the virgin material is used as the plastic raw material as in Pattern 7, the definition of WPRC is applicable. However, as there is a large difference in GHG emissions between the case of actively using plastic-based materials for recycling and the case of not using them, it is necessary to increase the recycling rate of plastic-based raw materials.

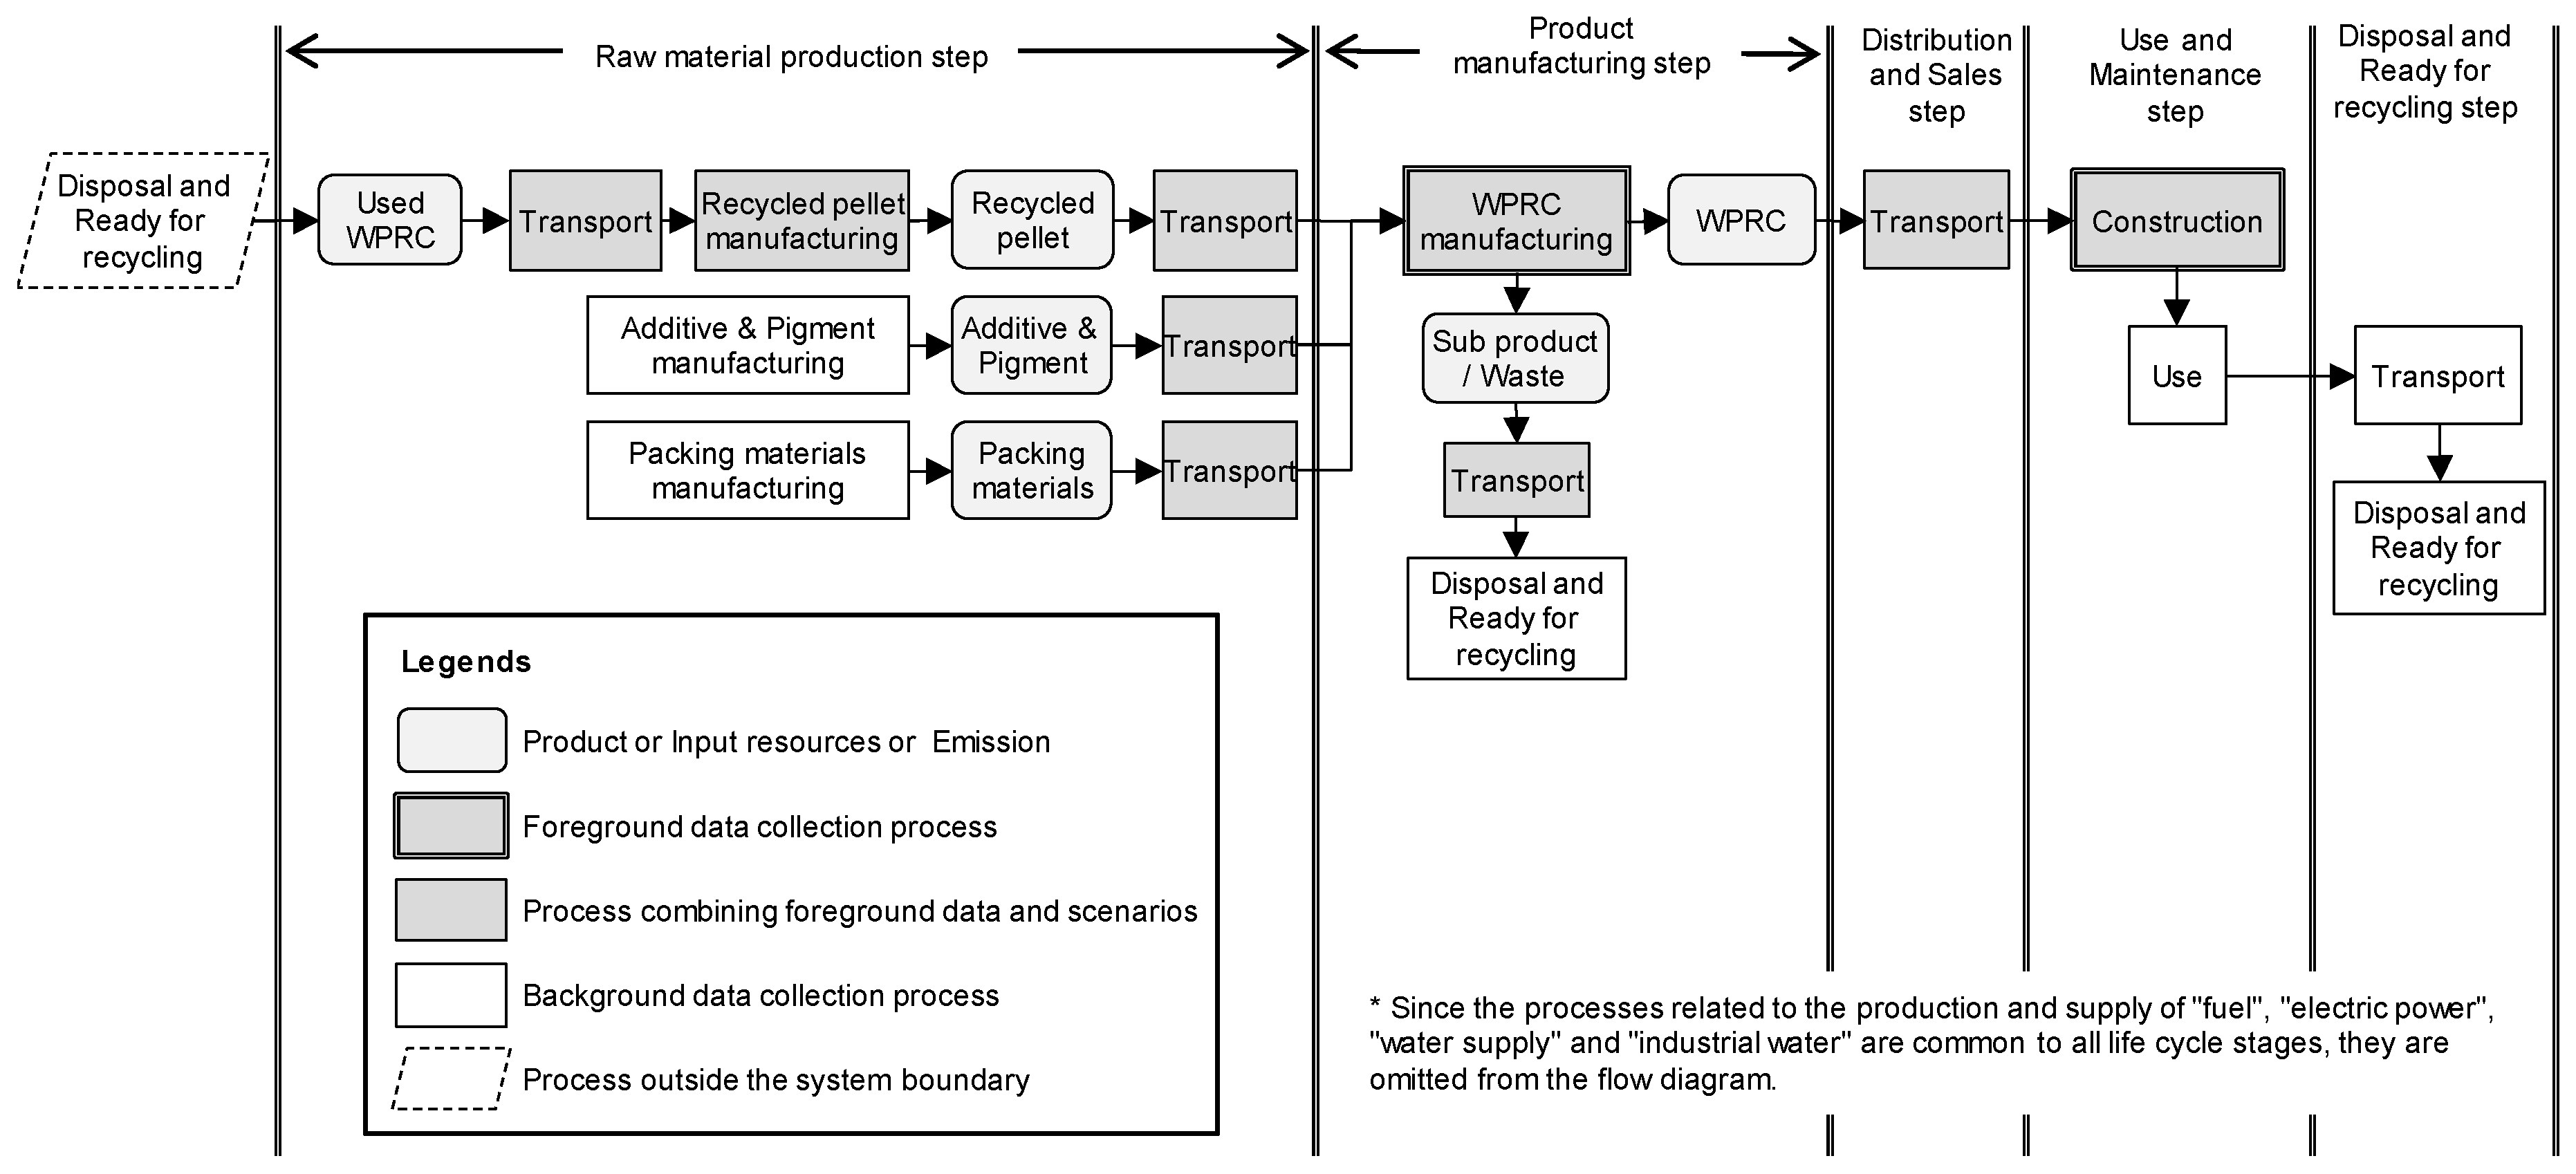
3.4. GHG Emission Reduction Effect by Multiple Recycling of Used WPRC

3.4.1. Life Cycle Inventory per Ton of WPRC Products

The disposal method of used WPRC generated in the disposal and ready for recycling step in life cycle flows of product A (Figure 1) and product B (Figure 3) was set as follows with reference to the Ministry of the Environment data [25]. The waste in scenario 1 is 98.9% recycled and 1.1% landfilled, while that in scenario 2 is 50% recycled, 48.9% incinerated, and 1.1% landfilled.
Based on the above findings, Table 4 presents the inventory data per ton of WPRC products collected for the life cycle flow (Figure 3) of product B in the multiple recycling case (scenarios 1 scenario 2). In scenarios 1 and 2, the WPRC recycled raw material procurement process replaces the wood-based raw material procurement process and plastic-based raw material procurement process in the raw material production step of the life cycle of product B. The product manufacturing, distribution and sales, and use and maintenance steps are the same as those described in Table 1 and are thus not mentioned again in Table 4. In the raw material production step, recycled pellets were produced from used WPRC products after collection and sorting. Regarding the transportation of recycled pellets, distribution beyond the borders of prefectures was assumed both in the transportation process of WPRC products to the recycled pellet production base and in that from the recycled pellet production base to the WPRC production base. For this reason, the transport conditions were set as follows based on literature: transportation distance of 500 km and truck transport (10 ton truck, loading rate 50%) [24]. The homeward path was included in the system boundary.
The inventory data of product A in scenarios 1 and 2 and the inventory data in scenario 3 are the same as those described in Section 2.1.

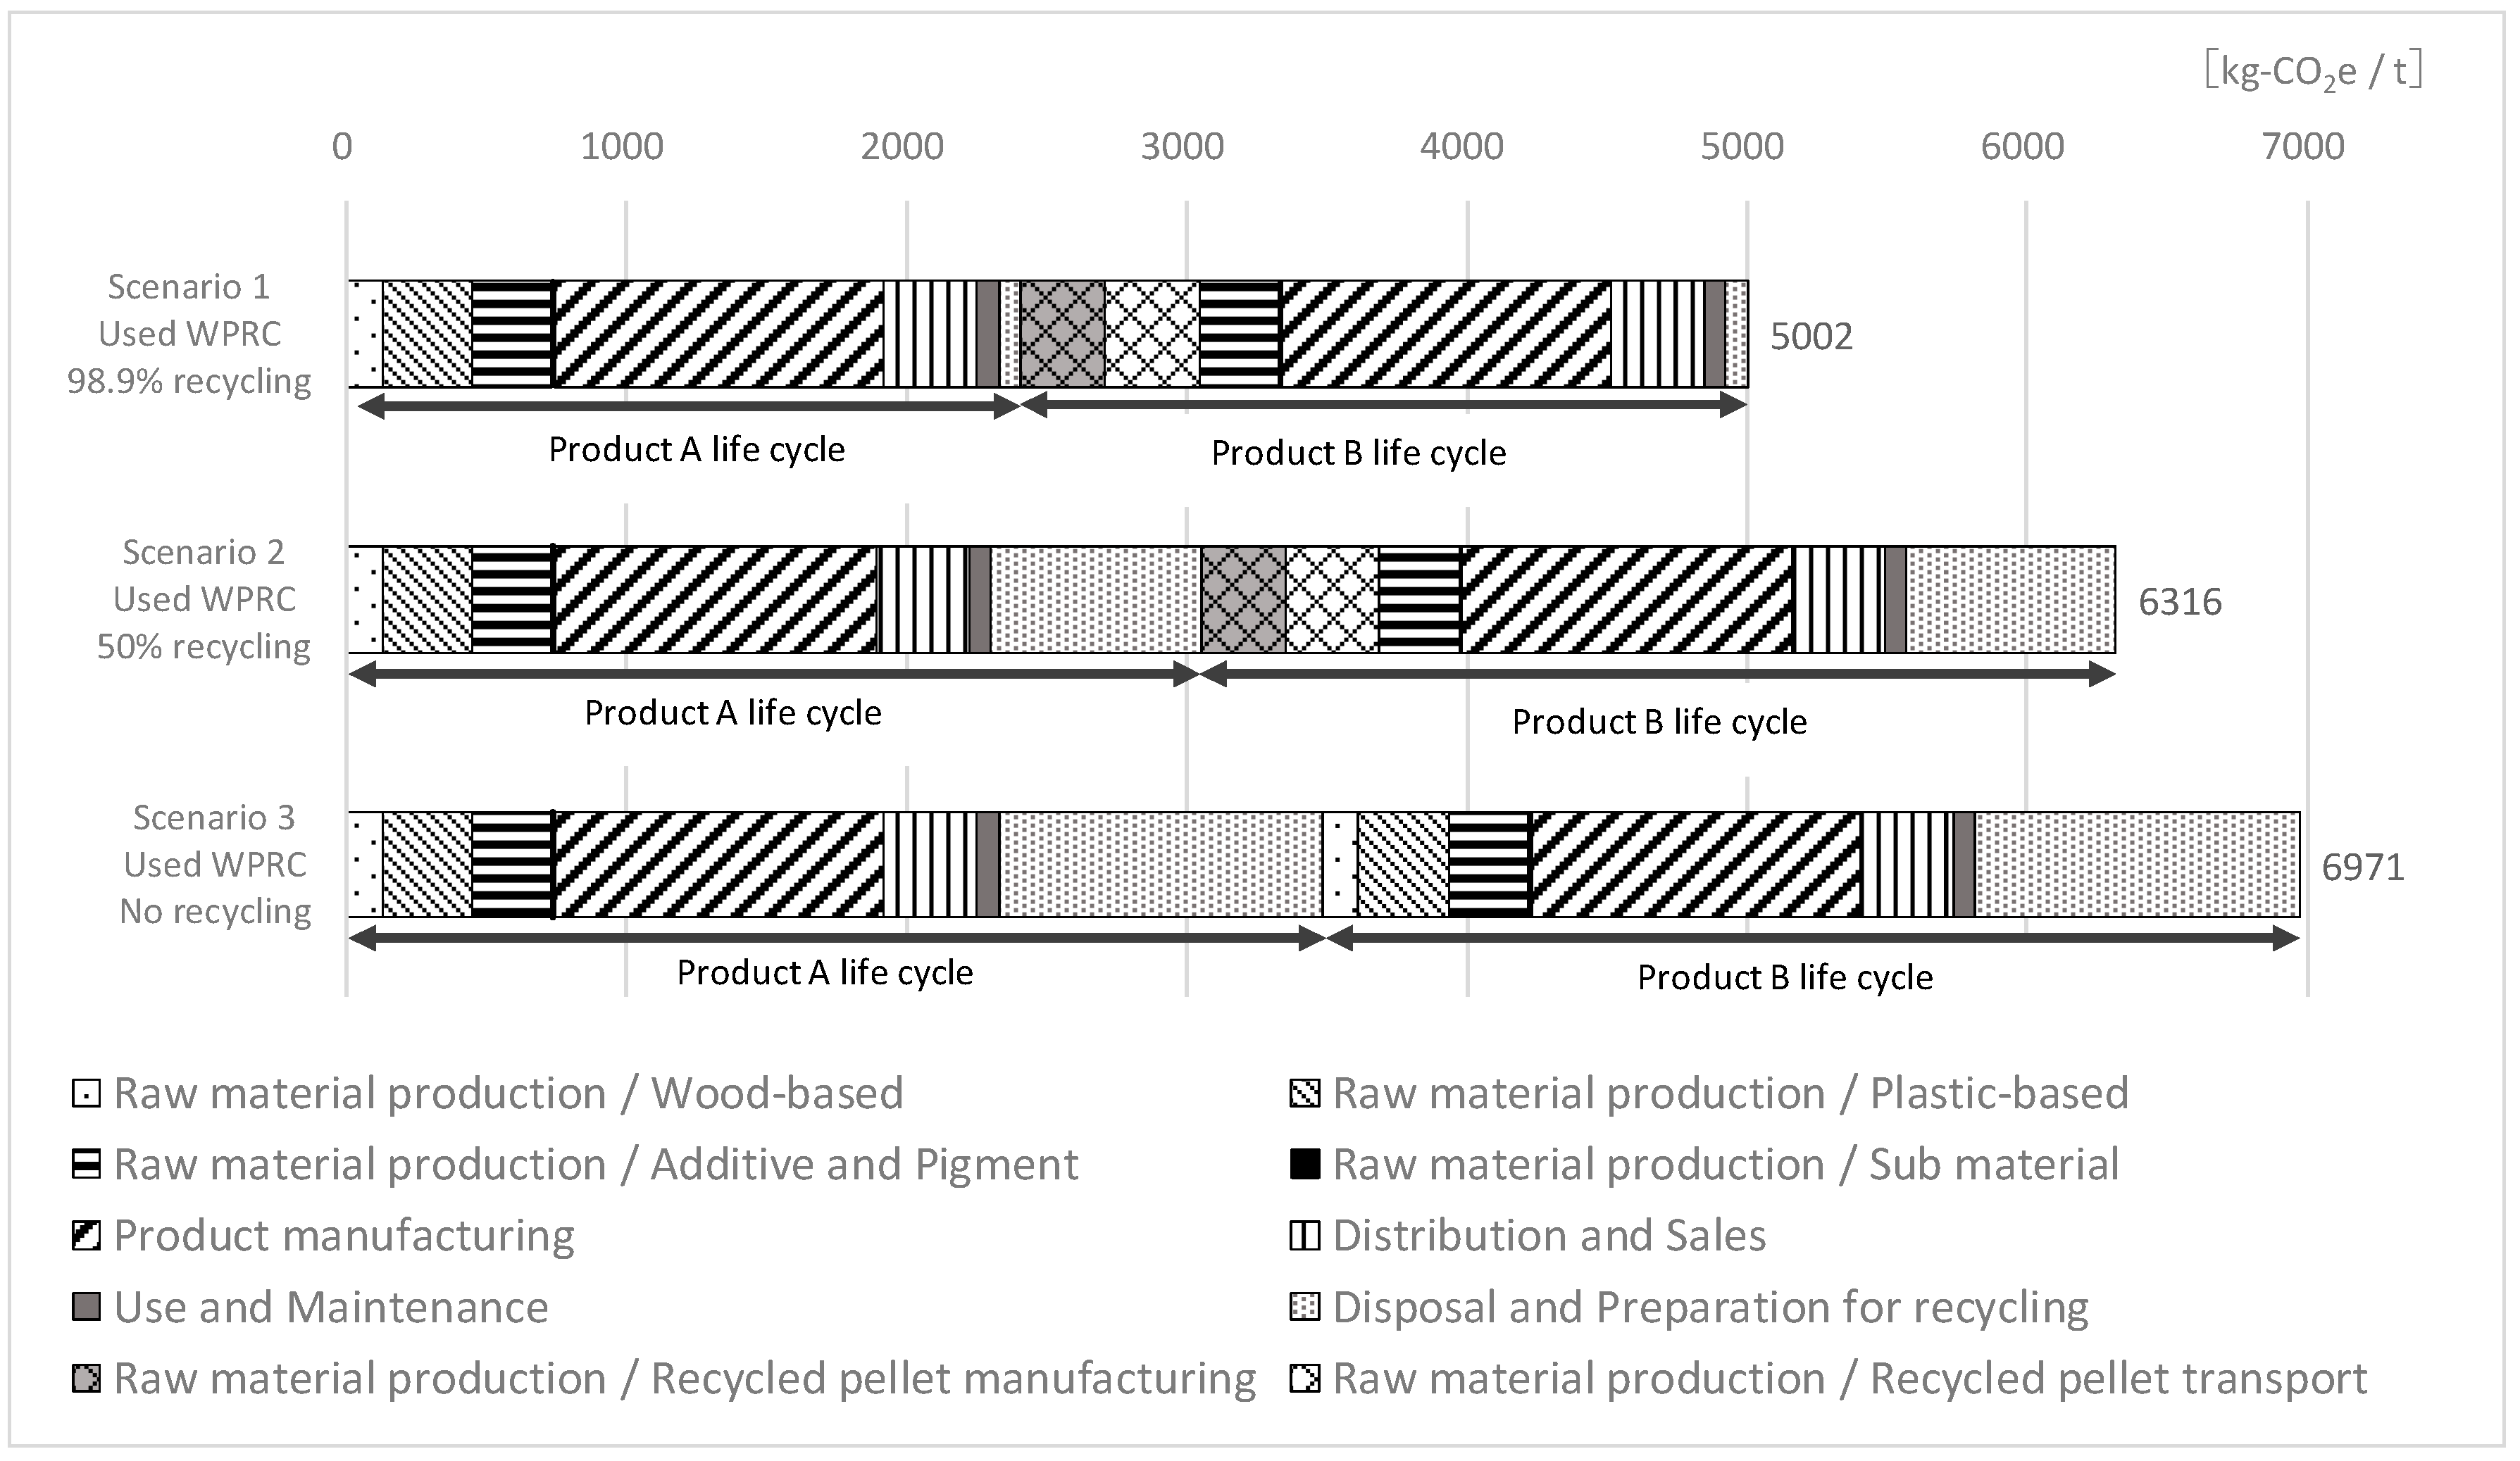
3.4.2. GHG Emission Reduction Effect by Multiple Recycling

Figure 5 shows the results of calculating the GHG emissions (kg-CO2e/t) by multiplying the collected inventory data by the GHG emission intensity using the build-up method. The GHG emissions were 5002 kg-CO2e/t for scenario 1, 6316 kg-CO2e/t for scenario 2, and 6971 kg-CO2e/t for scenario 3.
From these results, it is evident that scenario 1 has a GHG emission reduction effect of approximately 28% compared to scenario 3, and scenario 2 has an effect of approximately 9%. As clarified in Section 3.2, GHG emissions from combustion of waste during incineration account for a large percentage of the total GHG emissions. Therefore, the reduction in the proportion of used WPRC subjected to incineration owing to multiple recycling significantly contributed to the reduction in GHG emissions.
However, when comparing the raw material procurement stage of product B between scenarios, the GHG emission in scenario 3 was approximately 744 kg-CO2e/t, whereas it was 933 kg-CO2e/t in scenario 1 and 2. In other words, the GHG emissions in the multiple recycling cases are larger. In particular, in scenario 1, the GHG emissions from the raw material procurement stage of product B account for approximately 19% of the total emissions; thus, the impact is significant. This is partly because long-distance transportation scenarios involve crossing the borders of prefectures during transportation. When implementing a multiple recycling system, it is important to consider efficient transportation to collect used WPRC products to reduce GHG emissions.

4. Conclusions

This study targeted WPRC products manufactured by companies that have acquired the JIS A 5741 certification. It quantified the GHG emissions from the life cycle of these products, evaluated the effect of the mixing rate of recycled materials on GHG emissions, and analyzed the GHG emission reduction effect resulting from multiple recycling. The following conclusions could be drawn from the findings of this study:
  • The GHG emission during the life cycle of the targeted WPRC materials was 3489 kg-CO2e/t, and the ratio of the emission from the product manufacturing process in the product manufacturing step and the combustion of waste process in the disposal and ready for recycling step was found to be particularly high.
  • For the raw materials used in the preparation of WPRC, GHG emissions were calculated assuming that the recycling rate of wood-based materials was 100%, but the recycling rate of plastic-based materials fluctuated between 0% and 100%. It was found that setting the recycled material rate of plastic materials to 100% would reduce GHG emissions by 28% (1316 kg-CO2e/t) compared to when the recycled material rate was 0%.
  • We found that GHG emissions can be reduced by up to approximately 28% through multiple recycling of WPRC. In the multiple recycling cases, GHG emissions from the disposal of used WPRC could be significantly reduced, while emissions from the transportation process of the used WPRC were relatively large.
Through this study, we were able to quantify the environmental performance of WPRC whose quality was standardized by the JIS from the viewpoint of GHG emissions. The results of this study are based on data provided by all Japanese companies that have acquired JIS certification for WPRC. This is a benchmark for GHG emissions from WPRC products made in Japan and is an important achievement for determining the direction of GHG emission reduction measures for the entire industry.
Finally, in the future, if a WPRC manufacturing company considers expanding product sales based on research results, it will be necessary to obtain a type II environmental label, such as EPD (Environmental Product Declaration). Furthermore, to implement multiple recycling of WPRC in society, it is necessary to construct a system for collecting and recycling raw WPRC. This is a future issue to be solved socially.

Author Contributions

Conceptualization, Y.F. (Yuki Fuchigami), K.K. and Y.F. (Yuzo Furuta); software and data analysis, Y.F. (Yuki Fuchigami); validation, Y.F. (Yuki Fuchigami) and K.K.; writing—original draft preparation, Y.F. (Yuki Fuchigami); writing—review and editing, K.K. and Y.F. (Yuzo Furuta); project administration, Y.F. (Yuzo Furuta). All authors read and approved the manuscript and author contributions.

Funding

This work was supported by JSPS KAKENHI grant number JP18K14500.

Acknowledgments

In carrying out this research, we received valuable data from Akita Wood Co., Ltd., Air Water Ecoroca Co., Ltd., Eco Wood Co., Ltd., and Fukuvi Chemical Industry Co., Ltd. In addition, we received valuable advice from the Environmental Indicators Working Group of WPRC Group of Japan Construction Materials and Housing Equipment Industries Federation. We express our gratitude here. We would like to thank Editage (www.editage.com) for English language editing.

Conflicts of Interest

The authors declare no conflict of interest.

References

  1. Architectural Institute of Japan. Building LCA Guidelines Revised Edition; Maruzen Publishing: Tokyo, Japan, 2013. [Google Scholar]
  2. Saldaña-Márquez, H.; Gómez-Soberón, J.M.; Arredondo-Rea, S.P.; Gámez-García, D.C.; Corral-Higuera, R. Sustainable social housing: The comparison of the Mexican funding program for housing solutions and building sustainability rating systems. Build. Environ. 2018, 133, 103–122. [Google Scholar]
  3. Saldaña-Márquez, H.; Gámez-García, D.C.; Gómez-Soberón, J.M.; Arredondo-Rea, S.P.; Corral-Higuera, R.; Gómez-Soberón, M.C. Housing indicators for sustainable cities in middle-income countries through the residential urban environment recognized using single-family housing rating systems. Sustainability 2019, 11, 4276. [Google Scholar] [CrossRef] [Green Version]
  4. Kobayashi, K.; Isobe, T. LCA utilizatopm for buildings: Current situation and future issues. AIJ J. Technol. Des. 2018, 24, 1129–1134. [Google Scholar]
  5. Ramesh, T.; Prakash, R.; Shukla, K.K. Life cycle energy analysis of buildings: An overview. Energy Build. 2010, 42, 1592–1600. [Google Scholar] [CrossRef]
  6. Cabeza, L.F.; Rincón, L.; Vilariño, V.; Pérez, G.; Castell, A. Life cycle assessment (LCA) and life cycle energy analysis (LCEA) of buildings and the building sector: A review. Renew. Sustain. Energy Rev. 2014, 29, 394–416. [Google Scholar] [CrossRef]
  7. Gámez-García, D.C.; Saldaña-Márquez, H.; Gómez-Soberón, J.M.; Arredondo-Rea, S.P.; Gómez-Soberón, M.C.; Corral-Higuera, R. Environmental challenges in the residential sector: Life cycle assessment of Mexican social housing. Energies 2019, 12, 2837. [Google Scholar] [CrossRef] [Green Version]
  8. Gámez-García, D.C.; Gómez-Soberón, J.M.; Corral-Higuera, R.; Saldaña-Márquez, H.; Gómez-Soberón, M.C.; Arredondo-Rea, S.P. A cradle to handover life cycle assessment of external walls: Choice of materials and prognosis of elements. Sustainability 2018, 10, 2748. [Google Scholar] [CrossRef] [Green Version]
  9. Tonooka, Y. Housing LCA and environmental load data base. J. Life Cycle Assess. Jpn. 2017, 13, 126–133. [Google Scholar] [CrossRef]
  10. Liu, Y.; Guo, H.; Sun, C.; Chang, W. Assessing cross laminated timber (CLT) as an alternative material for mid-rise residential buildings in cold regions in China-A life-cycle assessment approach. Sustainability 2016, 8, 1047. [Google Scholar] [CrossRef] [Green Version]
  11. Tettey, U.; Dodoo, A.; Gustavsson, L. Effect of different frame materials on the primary energy use of a multi storey residential building in a life cycle perspective. Energy Build. 2019, 185, 259–271. [Google Scholar] [CrossRef]
  12. Morea, D.; Antonio, L. Islamic finance and renewable energy: An innovative model for the sustainability of investments. In Proceedings of the 2016 AEIT International Annual Conference, Capri, Italy, 5–7 October 2016. [Google Scholar]
  13. Morea, D.; Antonio, L. An innovative model for the sustainability of investments in the wind energy sector: The use of green Sukuk in an Italian case study. Int. J. Energy Econ. Policy 2017, 7, 53–60. [Google Scholar]
  14. Campisi, D.; Gitto, S.; Morea, D. Shari’ah-compliant finance: A possible novel paradigm for green economy investments in Italy. Sustainability 2018, 10, 3915. [Google Scholar] [CrossRef] [Green Version]
  15. Martínez-Rocamora, A.; Solís-Guzmán, J.; Marrero, M. LCA databases focused on construction materials: A review. Renew. Sustain. Energy Rev. 2016, 58, 565–573. [Google Scholar] [CrossRef]
  16. Kiguchi, M.; Kobayashi, M. Performance and technical trends of wood plastic composites (WPCs). Wood Ind. 2012, 67, 50–55. [Google Scholar]
  17. Gardner, D.J.; Han, Y.; Wang, L. Wood-plastic composite technology. Curr. For. Rep. 2015, 1, 139–150. [Google Scholar] [CrossRef] [Green Version]
  18. Kojiro, K. Eco-friendly wood and plastic recycled composite (WPRC). Sol. Energy 2014, 40, 7–13. [Google Scholar]
  19. Japanese Standards Association. JIS A 5741, Wood-Plastic Recycled Composite; Japanese Standards Association: Tokyo, Japan, 2016; pp. 1–21. [Google Scholar]
  20. Bolin, C.A.; Smith, S. Life cycle assessment of ACQ-treated lumber with comparison to wood plastic composite decking. J. Clean. Prod. 2011, 19, 620–629. [Google Scholar] [CrossRef]
  21. Philipp, F.S.; Jan, L.W.; Sebastian, R.; Andreas, K. Life cycle assessment of wood-plastic composites: Analysing alternative materials and identifying an environmental sound end-of-life option. Resour. Conserv. Recycl. 2017, 117, 235–248. [Google Scholar]
  22. Fuchigami, Y.; Kojiro, K.; Furuta, Y. Life cycle CO2 of wood plastic recycled composites. J. Environ. Eng. Trans. AIJ 2011, 76, 83–89. [Google Scholar] [CrossRef] [Green Version]
  23. Wada, Y.; Miura, H.; Hirata, A. Study on evaluation method of environmental impact on the phase of recycle for life cycle assessment. Environ. Syst. Res. 1994, 22, 141–146. [Google Scholar] [CrossRef]
  24. Carbon Footprint Communication Program. Certified CFP-PCR Number: PA-CB-01, Wood-Plastic Composites; Carbon Footprint Communication Program: Tokyo, Japan, 2011; pp. 1–16. [Google Scholar]
  25. General Waste Discharge and Treatment Status, etc. Available online: https://www.env.go.jp/press/files/jp/105331.pdf (accessed on 18 November 2019).
  26. IDEA LCA Database. Available online: http://www.idea-lca.jp/ (accessed on 10 February 2020).
Figure 1. Wood-plastic recycled composite (WPRC) life cycle flow chart (source: author’s elaboration).
Sustainability 12 02449 g001
Figure 2. Evaluation boundary for evaluating multiple recycling (source: author’s elaboration).
Sustainability 12 02449 g002
Figure 3. Life cycle flow diagram of product B in a multiple recycling case (refer to Figure 2) (source: author’s elaboration).
Sustainability 12 02449 g003
Figure 4. WPRC GHG emissions when changing the recycling rate of plastic-based raw materials (source: author’s elaboration).
Sustainability 12 02449 g004
Figure 5. GHG emission reduction effect by multiple recycling of used WPRC (source: author’s elaboration).
Sustainability 12 02449 g005
Table 1. Lifecycle inventory per ton of WPRC product (source: author’s elaboration).
StepProcessSpecific ProcessUnitQuantityCorresponding Figure 1 Process
Raw material productionWood-based raw material productionProductionWood chipm38.78 × 10−1d)
Transport (outward)Truck (10 t, loading rate 50%)tkm2.17 × 102a), e)
Transport (homeward)Truck (10 t, no loading)km4.31 × 101a), e)
Transport (outward)Truck (2 t, loading rate 50%)tkm2.51 × 100a), e)
Transport (homeward)Truck (2 t, no loading)km2.51 × 100a), e)
Mixed pellet productionElectricitykWh6.34 × 101h)
Mixed pellet productionLight oilL3.64 × 10−2h)
Mixed pellet productionKeroseneL1.86 × 10−1h)
Mixed pellet productionWaterworksm36.32 × 10−2h)
Mixed pellet transport (outward)Truck (10 t, loading rate 50%)tkm4.37 × 100i)
Mixed pellet transport (homeward)Truck (10 t, no loading)km8.74 × 10−1i)
Plastic-based raw material productionProductionVirgin plastickg4.14 × 101b), f), j)
ProductionRecycled plastickg4.05 × 102b), f), j)
Transport (outward)Truck (10 t, loading rate 50%)tkm1.21 × 102c), g), k)
Transport (homeward)Truck (10 t, no loading)km2.43 × 101c), g), k)
Transport (outward)Railwaytkm2.36 × 101c)
Pigments and Additives productionProductionComputerizing agentkg8.74 × 100l)
ProductionSkid (Part 1)kg5.73 × 100l)
ProductionSkid (Part 1)kg4.47 × 101l)
ProductionPigmentkg3.04 × 101l)
ProductionStabilizerkg1.23 × 101l)
ProductionAntioxidantkg1.30 × 100l)
Transport (outward)Truck (10 t, loading rate 50%)tkm6.20 × 101m)
Transport (homeward)Truck (10 t, no loading)km1.24 × 101m)
Sub material productionProductionCardboard sheetm29.79 × 100n)
ProductionStretch filmkg2.02 × 10−1n)
ProductionBanding bandkg1.10 × 10−1n)
ProductionAir capkg2.77 × 10−1n)
ProductionWood palletm31.56 × 10−2n)
Transport (outward)Truck (10 t, loading rate 50%)tkm5.74 × 10−1o)
Transport (homeward)Truck (10 t, no loading)km1.15 × 10−1o)
Product productionWPRC productionProductionElectricitykWh1.99 × 103p)
ProductionWaterworksm38.33 × 10−1p)
ProductionIndustrial waterm33.18 × 100p)
ProductionLight oilL8.20 × 10−1p)
ProductionGasolineL2.27 × 10−1p)
ProductionKeroseneL6.36 × 10−1p)
ProductionGaskg2.83 × 10−3p)
ProductionBunker AL4.95 × 100p)
Disposal and Ready for recyclingTransport (outward)Truck (2 t, loading rate 25%)tkm2.96 × 100q)
Transport (homeward)Truck (2 t, no loading)km5.92 × 100q)
Waste disposal (Defective)Incinerationkg1.14 × 101r)
Waste disposal (Defective)Landfillkg1.60 × 10−1r)
Waste disposal (Defective)Ready for recyclingkg2.96 × 100r)
Waste disposal (Plastic)Incinerationkg2.15 × 100r)
Waste disposal (Plastic)Landfillkg3.01 × 10−2r)
Waste disposal (Plastic)Ready for recyclingkg5.58 × 10−1r)
Waste disposal (Wood scrap)Incinerationkg1.24 × 101r)
Distribution and SalesDistributionTransport (outward)Truck (10 t, loading rate 50%)tkm1.00 × 103s)
Transport (homeward)Truck (10 t, no loading)km2.00 × 102s)
Use and MaintenanceUseConstructionelectricitykWh1.49 × 102t)
Disposal and Ready for recyclingDisposal andReady for recyclingTransport (outward)Truck (2 t, loading rate 50%)tkm5.00 × 101v)
Transport (homeward)Truck (2 t, no loading)km5.00 × 101v)
Waste disposalIncinerationkg7.85 × 102w)
Waste disposalCombustion of plastic and pigments/additiveskg4.20 × 102w)
Waste disposalLandfillkg1.10 × 101w)
Waste disposalReady for recyclingkg2.04 × 102w)
Table 2. WPRC greenhouse gas (GHG emissions) (per ton of product) (source: author’s elaboration).
StepProcessGHG Emissions (kg-CO2e/t)Emission Rate (%)
Raw material productionWood-based raw materialProduction5.34 × 1011.5%
Transport7.61 × 1012.2%
Plastic-based raw materialProduction2.80 × 1028.0%
Transport3.97 × 1011.1%
Pigments and AdditivesProduction2.64 × 1027.6%
Transport2.07 × 1010.6%
Sub material9.87 × 1000.3%
Product manufacturingWPRC production1.15 × 10332.9%
Waste disposal2.69 × 1010.8%
Distribution and SalesDistribution3.34 × 1029.6%
Use and MaintenanceConstruction7.63 × 1012.2%
Disposal and Ready for recyclingTransport4.77 × 1011.4%
Waste disposal3.65 × 1011.0%
Waste combustion1.07 × 10330.8%
Total3.49 × 103100%
Table 3. Simulation pattern of recycling rate of plastic-based raw materials (source: author’s elaboration).
PatternRecycling Rate of Plastic-Based Raw Materials (%)Recycling Rate of the Entire Product (%)
110090
29186
37780
45370
53060
6750
7047
Note: Pattern 2 is the subject of this research. All wood-based raw materials are recycled materials, and all pigments and additives are virgin materials. The mixing rate of wood-based raw materials, plastic-based raw materials, and pigments and additives is 47:43:10.
Table 4. Lifecycle inventory of product B in multiple recycling case (per ton of WPRC product) (source: author’s elaboration).
StepProcessSpecific ProcessUnitQuantity
Senario1Senario2
Raw material productionRecycled Pellet productionTransport (outward)Truck (10 t, loading rate 50%)tkm5.00 × 102
Transport (homeward)Truck (10 t, no loading)km1.00 × 102
ProductionRecycled Pellett1.00 × 100
Transport (outward)Truck (10 t, loading rate 50%)tkm5.00 × 102
Transport (homeward)Truck (10 t, no loading)km1.00 × 102
Pigments and Additives productionProductionCompatibilizing agentkg8.74 × 100
ProductionSkid (Part 1)kg5.73 × 100
ProductionSkid (Part 1)kg4.47 × 101
ProductionPigmentkg3.04 × 101
ProductionStabilizerkg1.23 × 101
ProductionAntioxidantkg1.30 × 100
Transport (outward)Truck (10 t, loading rate 50%)tkm6.20 × 101
Transport (homeward)Truck (10 t, no loading)km1.24 × 101
Sub material productionProductionCardboard sheetm29.79 × 100
ProductionStretch filmkg2.02 × 10−1
ProductionBanding bandkg1.10 × 10−1
ProductionAir capkg2.77 × 10−1
ProductionWood palletm31.56 × 10−2
Transport (outward)Truck (10 t, loading rate 50%)tkm5.74 × 10−1
Transport (homeward)Truck (10 t, no loading)km1.15 × 10−1
Disposal and Ready for recyclingDisposal and Ready for recyclingTransport (outward)Truck (2 t, loading rate 50%)tkm5.00 × 101
Transport (homeward)Truck (2 t, no loading)km5.00 × 101
Waste disposalIncinerationkg0.00 × 1004.88 × 102
Waste disposalCombustion of plastic and pigments/additiveskg0.00 × 1002.61 × 102
Waste disposalLandfillkg1.10 × 1011.10 × 101
Waste disposalReady for recyclingkg9.91 × 1025.01 × 102

