Article

Inventory, Distribution and Geometric Characteristics of Landslides in Baoshan City, Yunnan Province, China

1
Institute of Crustal Dynamics, China Earthquake Administration, Beijing 100085, China
2
Key Laboratory of Active Tectonics and Volcano, Institute of Geology, China Earthquake Administration, Beijing 100029, China
3
Beijing Meteorological Information Center, Beijing Meteorological Service, Beijing 100089, China
4
Yunnan Earthquake Agency, Kunming 650224, China
*
Author to whom correspondence should be addressed.
Sustainability 2020, 12(6), 2433; https://doi.org/10.3390/su12062433
Submission received: 4 February 2020 / Revised: 17 March 2020 / Accepted: 18 March 2020 / Published: 20 March 2020

Abstract

:
Inventorying landslides in mountainous areas is of great importance for prevention of geologic hazards. This study aimed to establish a detailed landslide inventory of Baoshan City, Yunnan Province, China, based on a large set of high-resolution satellite images from Google Earth. The landslides of this region were divided into two groups, i.e., recent landslides and old landslides. The spatial distribution and geometric characteristics of the two kinds of landslides were analyzed, respectively. Results show that 2427 landslides are present in the study area, including 2144 recent landslides and 283 old landslides with a total area of 7.2 km2 and 97.6 km2, respectively. The recent landslides occurred primarily at steep slopes with higher elevation, while old landslides took place at gentle terrains. For the slope position, most landslides, whether old or recent, cluster near ridges. The lower boundary of the recent landslides is far away from the valley, while the accumulation area of the old landslide is closer to the valley. The H/L (height to length) ratios are basically the same for all landslides, ranging from 0.2 to 0.5. Old landslides have larger mobility, as their travel distances are longer than recent landslides at the same height. The results would be helpful for further understanding the development and spatial distribution of the landslides in Southwest China, and also provide essential support for the subsequent landslide susceptibility mapping and geologic hazard assessment in this area.

1. Introduction

Landslide is downslope movement of soil, rock, and organic materials under the gravity effect and also the landform that results from such mass wasting [1]. Landslides can be caused by earthquakes, rainfall, and human activity. Statistics show that the number of casualties caused by landslides reaches 4600 every year over the world [2].
Detailed and accurate landslide inventory maps record the location, magnitude, characteristics, type of movement, estimated age and other information of slope failures, which are important for studies on spatial distribution of the landslides [3,4,5,6], impact on landform evolution [7,8,9], and landslide susceptibility mapping and hazard assessment [10,11,12,13]. Landslide inventory maps can be divided into event-based, multi-temporal and historical inventories [14,15]. An event-based inventory shows landslides caused by a triggering factor, such as an earthquake or typhoon [16,17,18,19]. Multi-temporal inventories show landslides triggered by multiple events over longer periods (e.g., years to decades) [20]. A historical inventory map displays the cumulative distribution of many landslides over a period of tens to thousands of years [21,22,23], which can be at regional [22,23], national [24,25], continental [26,27] or global scales [2,28].
The visual interpretation of aerial photography (aerial photo interpretation; API) remains the common method to obtain information on landslides [29]. With the development of satellite technology, images obtained by optical sensors, including panchromatic (single band) and multispectral (multiple band) images, have become preferred data for landslide investigation and inventorying [4,30,31]. Especially, the Google Earth platform provides high-resolution and ultra-high-resolution optical satellite images (even multi-temporal images in some areas) worldwide, and permits to observe landforms from a three-dimensional (2.5-D) perspective, which have opened unparalleled opportunities for geologists and geomorphologists to conduct the landslide detection and mapping [32,33,34,35].
China is one of countries with the most frequent landslides in Asia and even in the world, which cause approximately 690 fatalities per year during 2000–2015 [24]. In this vast land, Yunnan province is one of the regions with this serious geological hazard. With mountainous terrain and active tectonics, major earthquakes and heavy rainfall often induce landslides in this area [36,37]. Previous studies of this region focused on the failure mechanism, characteristics of motion and accumulation of some typical large-scale landslides [38,39,40,41]. However, there are few studies about the regional characteristics and distributions of landslides, especially the establishment of the regional landslide inventory. This is because of a scarcity in data available about the landslide inventory map. Tian, et al. [42] established the co-seismic landslide inventory of the 2015 Ludian, Yunnan Mw6.5 earthquake based on the high-resolution images of the pre- and post-quake, which provided the data base for landslide susceptibility assessment for this seismic event.
Baoshan City, located in the western Yunnan Province, is a typical area with prominent landslide hazard. So far there is little work on landslide mapping for this city. To bridge this gap, this work prepared a detailed landslide inventory map of this area based on visual interpretation of high-resolution satellite images from Google Earth platform. The landslides identified in the study area were classified into old landslides and recent landslides. Their distribution and influencing factors were statistically analyzed, respectively. Their geometric characteristics and runout distances were examined.

2. Study Area

Baoshan city, with an area 19,000 km2, spans from 98°25′ to 100°02′ E and 24°08′ to 25°51′ N (Figure 1a). In tectonics, it lies at the southeastern margin of the Tibetan Plateau, where geodynamic interaction between the Sanjiang tectonic belt, Yangzi block and southeast of the East Himalayan syntaxis is very intense [43]. Four major faults cross through this area, namely, the Nujiang fault, Shidian fault, Kejie fault, and Lancanfjiang fault. The intense tectonic movement makes this area be seismically active, evidenced by more than six events of Ms ≥ 6 in the past century (http://10.5.109.26:8080/csds/).
The geomorphology of the Baoshan area is dominated by a complex landform with mountains, basins and river-valleys. Located in the southern edge of the Hengduan Mountains, its terrain inclines from northwest to southeast, from an elevation of 3780.9 m down to 535 m, about 1800 m on average. The rivers in this area are the tributaries of three major watersheds: Lancang River, Nujiang River and the Irrawaddy River, of which six rivers have catchments greater than 1000 km2. Due to tectonic uplift and stream incision, steep slopes and “V”-shaped valleys are prevail (Figure 1b). The area has a subtropical monsoon climate, with a mean annual temperature 14–17 °C, and an average annual rainfall 700–2100 mm.
Figure 1c illustrates the main strata exposed in the study area. Clastic rocks of the Upper Triassic Cretaceous (T) to the Cretaceous (C) are distributed in the east of the Lancangjiang fault. Metamorphic rocks and Cretaceous intrusive rocks are mainly exposed in the southeast of the Kejie fault. Carbonate and clastic rocks from Cambrian to Triassic are present between the Lancang River and Nujiang River. Thick tertiary claystone and Quaternary lacustrine clay were deposited between intermountain basins.

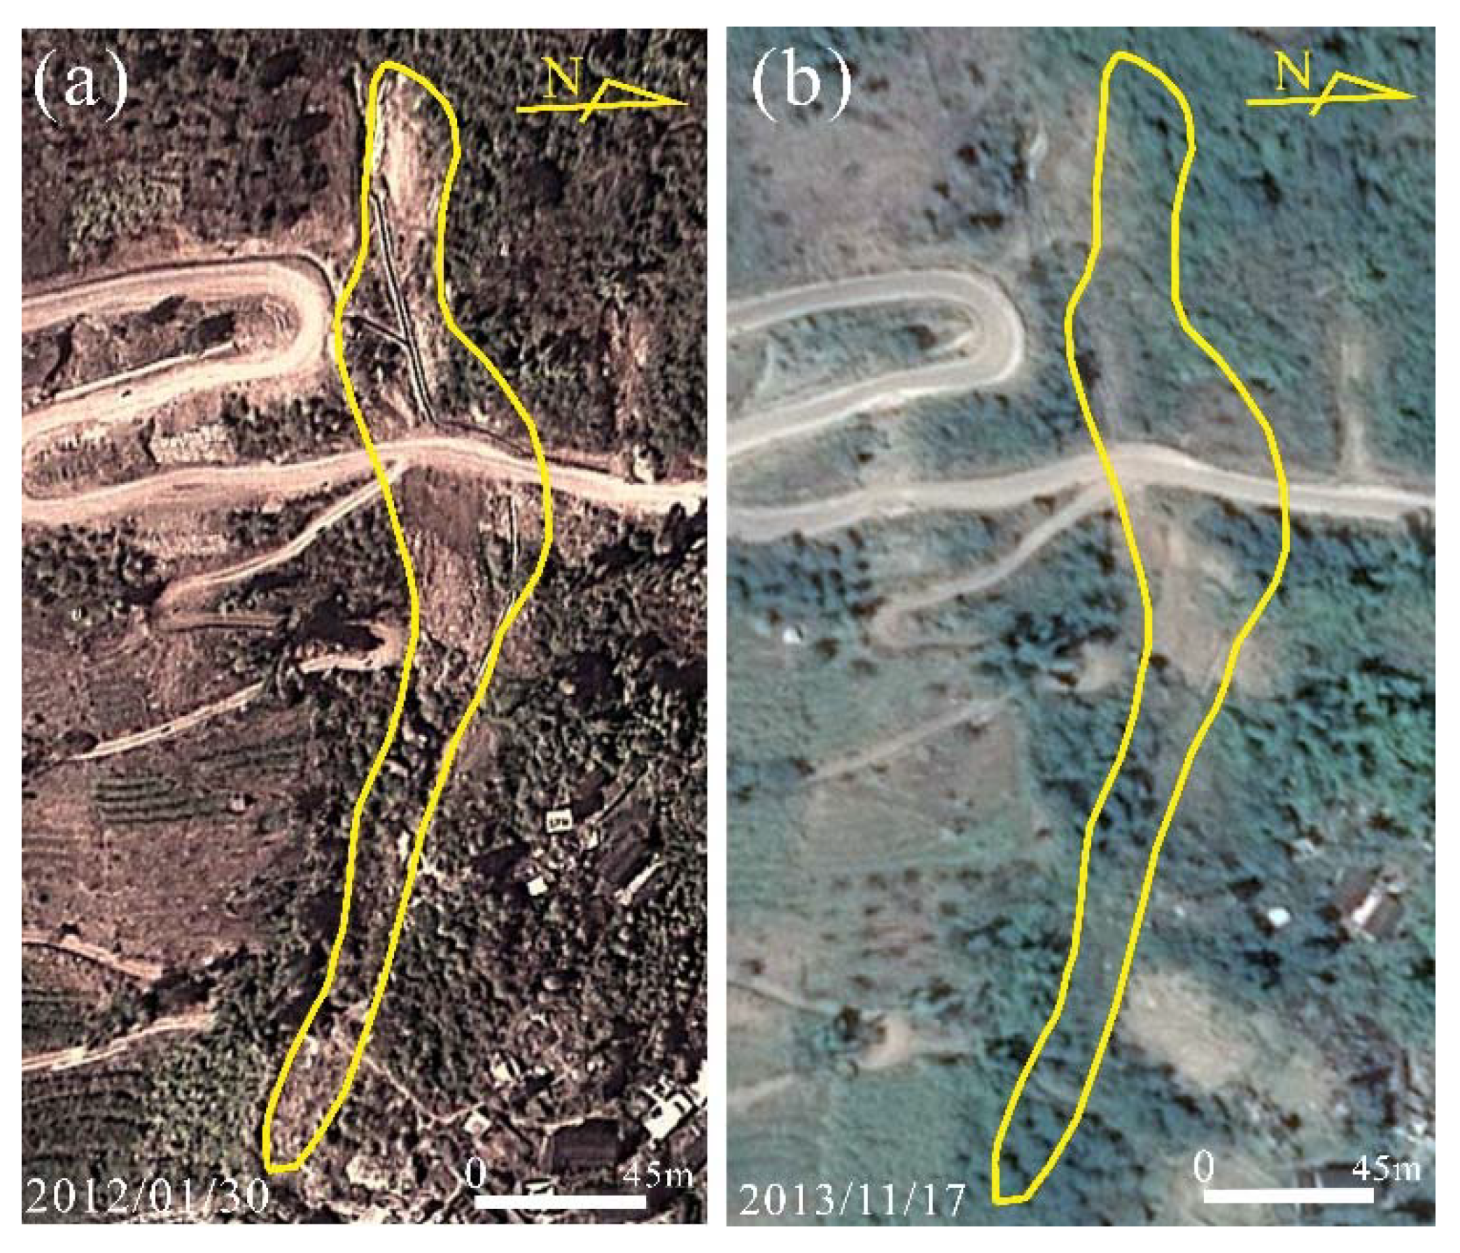
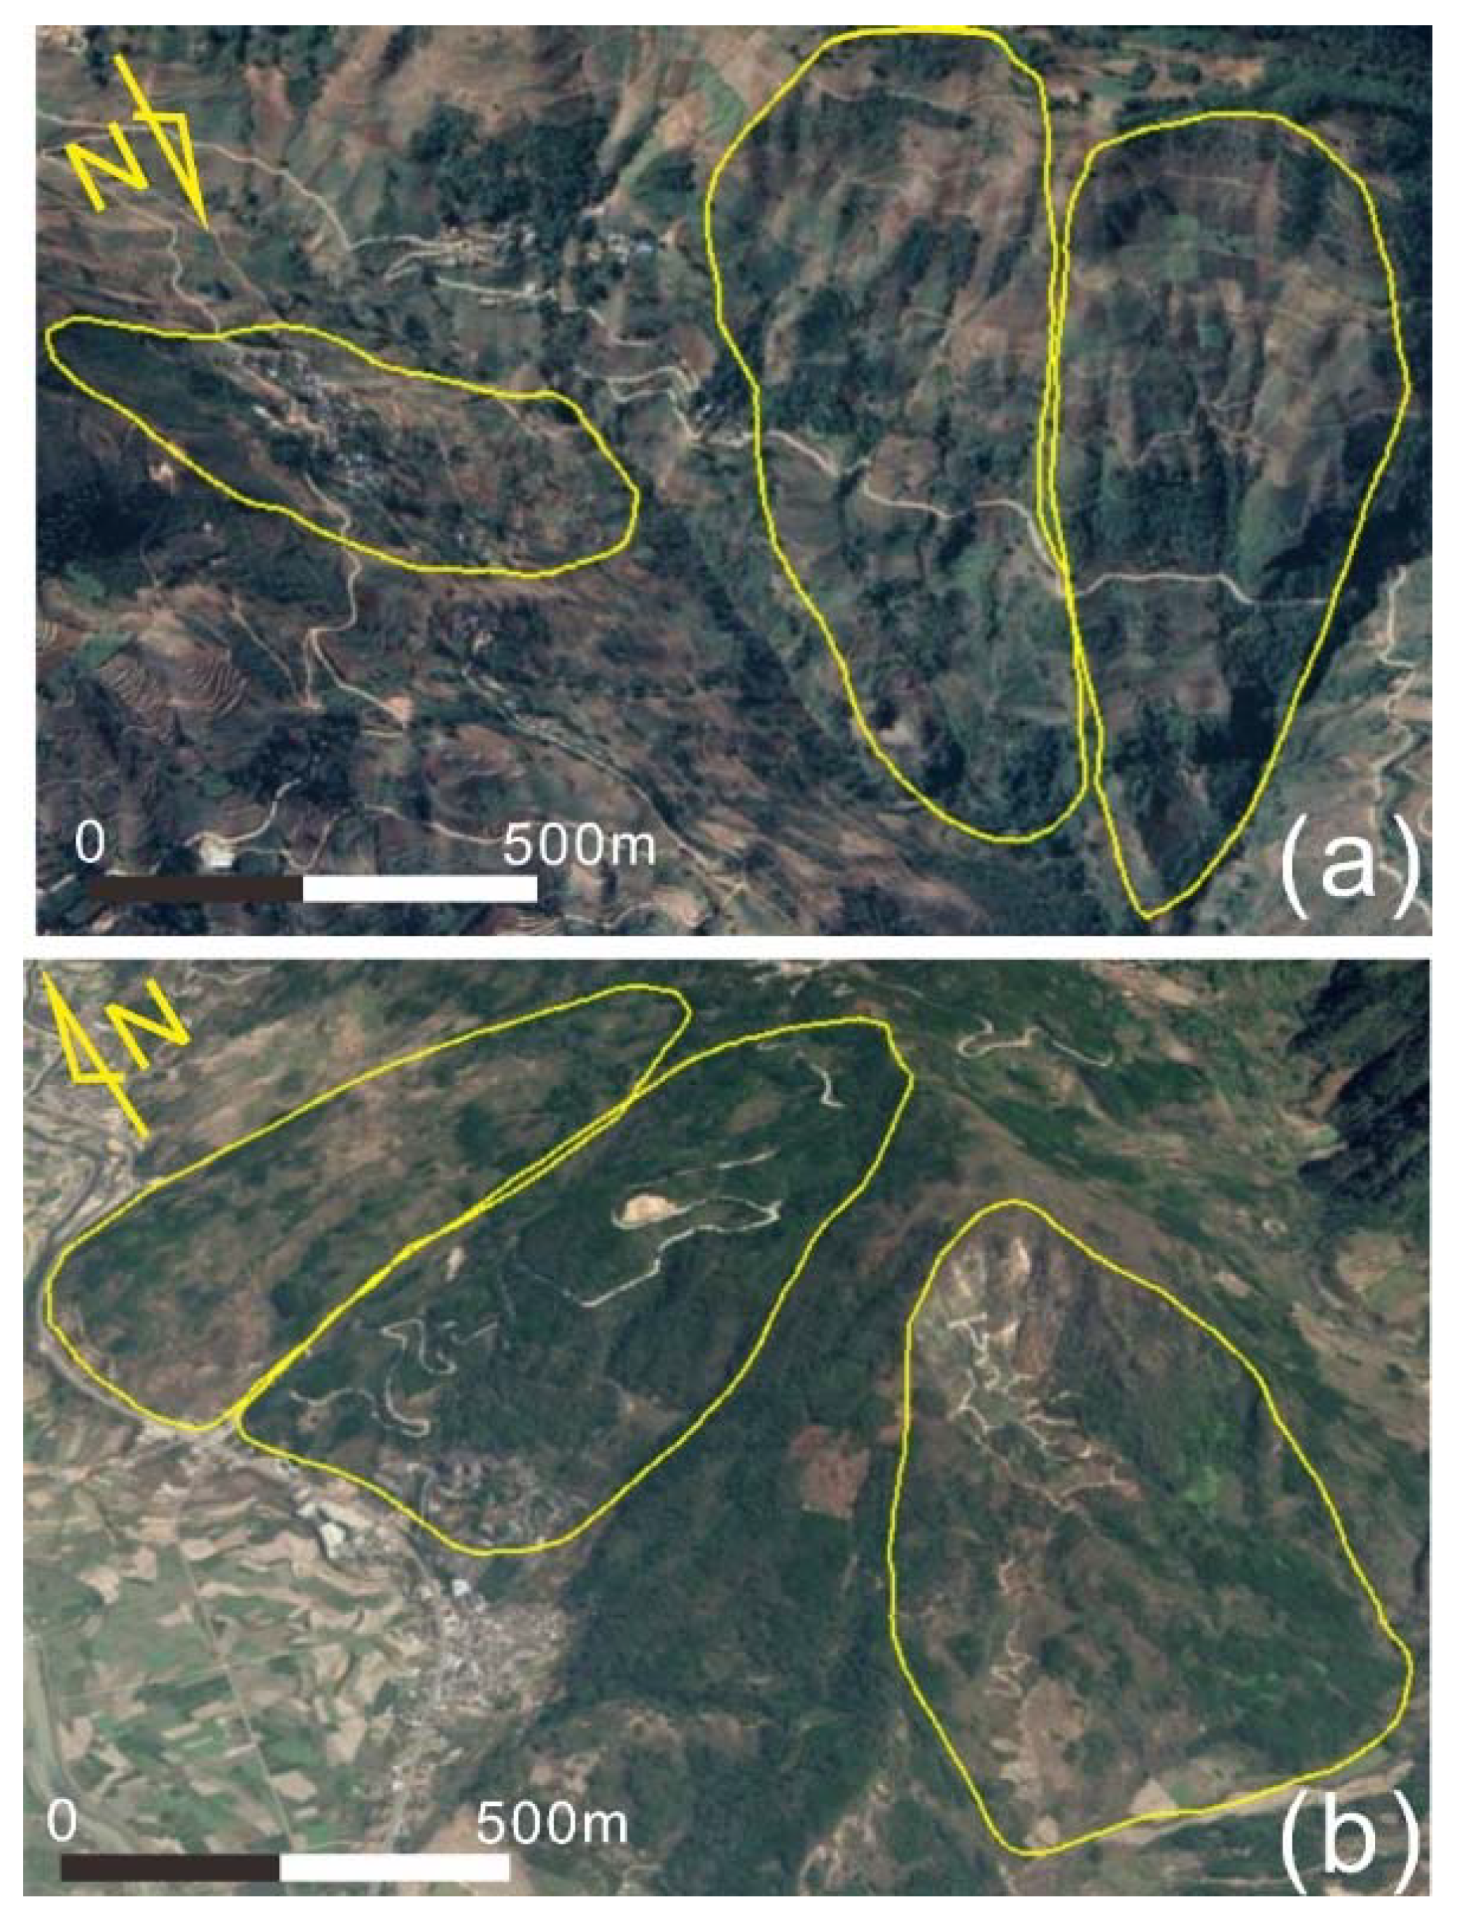
3. Landslide Inventory Map

In recent years, the Google Earth platform has been widely used in landslide investigation [33,44,45]. Google Earth contains available Landsat imagery (30 m or 15 m pan-sharpened), orthophotos (0.5–2 m), and high-resolution commercial satellite imagery (SPOT, FORMOSAT-2: 0.5–8 m; World View-1 and World View-2, 0.5–2.5 m) [35,46]. The satellite images are 100% coverage of the whole study area and mainly available from Feb 2009 to Jan 2018 (mainly including Feb 2009, Mar 2010, Oct 2012, Oct 2014, Nov 2017 and Jan 2018).
In this study, two types of identified landslides were considered, i.e., recent and old slope failures [47]. Their relative ages were estimated heuristically, relying on the appearance of the landslides on the aerial photographs (e.g., the presence or absence of a vegetation cover, of fluvial activity and erosion processes, including other landslides) [47,48]. The old landslides were large to very large, and are characterized by dismantled or partially eroded landforms, while the recent landslides were relatively smaller in size, better preserved, and less dismantled than the old slope failures [48].
The study area is covered by dense vegetation. Due to the warm and humid climate, vegetation recovery is fast after landsliding. For example, a large rock avalanche at the Wama village, Baoshan city occurred on 1st September 2010 which buried several buildings, killed eight people and 40 people were reported missing. As shown in Figure 2, the local vegetation has been recovered merely 3 years on, entirely covering the landslide body.
The identification of recent landslides was mainly based on the differences in color and texture on remote sensing images. We used the following criteria in the landslide visual interpretation processes: (1) Due to surface disruption or loss of the vegetative cover, the reflectivity of recent landslides was higher than non-landslide areas, so the recent landslides could be easily distinguished by surface disruption or loss of vegetative cover [10,31]. (2) For the images of different years at the same location, we identified the images in different years one by one. As long as there was a landslide in any year, we delineated the landslides with the latest sliding. Finally, we mapped all landslides in this area in the past decade. Figure 3 displays some recent landslides located in 25.52° N, 98.37° E and 25.23° N, 98.33° E. These landslides showed an obviously different appearance from the surrounding areas, featured by bright spots on images.
Cruden and Varnes [1] suggested that some landslides in the past remain visible in the landscape for thousands of years after they initially moved and then stabilized. Such landslides are called old events, most of which are deep-seated slope failures. with steep back walls and abnormally curved ridgelines, which can identified by the appearance of morphologic features (i.e., scarp, toe, lateral margin) [49]. Some inconsistencies in the sliding area imply that a landslide may have experienced multiple slides. The information of old landslides we need is not the latest sliding, but the largest sliding area. Therefore, our strategy of interpreting old landslides is to interpret the largest sliding area. On the remote sensing image, they generally exhibit spoon-shaped or ring-shaped landforms. Otherwise, the flat landslide accumulation areas are usually transformed into residential zones or bench terraces [50]. Figure 4 shows the typical old landslides, featured by bench terrace with irregular stepped distribution on the landslide mass.
Figure 5 is the landslide inventory map of the Baoshan area prepared by this work, including recent and old landslides. In total, 2427 landslides were identified, covering an area of 104.8 km2. The number of the recent landslides is 2144 with a total area of 7.2 km2, and the average area was 3351 m2. The area of individual landslides ranged from 50 to 174,800 m2. The number of the old landslides was 283 with a total area of 97.6 km2, and an average area of 344,950 m2. For individual old landslides, the largest was 4,794,000 m2, and the smallest was 590 m2. The probability density plot of the landslide size (area in m2) distribution by log-log coordinates is shown in Figure 6. It is noted that the scale of old landslides was larger than recent ones; most recent slope failures were concentrated in the area of 100–5000 m2, and the area of old landslides concentrated in 50,000–300,000 m2.

4. Data and Methods for Further Analysis

Previous studies have shown that the failure mechanism and stability of landslides are closely related to positions of the slopes [19,50,51]. In this study, we calculated the relative positions with respect to the top (the mountain ridge) and to the bottom (the river valley) of the slope according to the method proposed by Patrick Meunier (2008) [52]. Three parameters were used in the analysis, including “d” (the distance from the ridge crest to the nearest stream), “a” (the distance from the crown of the landslide to the ridge) and “b” (the distance from the toe of the landslide to the nearest stream) (Figure 7a). Detailed descriptions and calculation processes can be found in a previous study [52].
Geometric parameters are useful for determining the types and kinematic characteristics of landslides [53,54]. Among them, the equivalent coefficients of friction, that is, the landslide height-length ratio (H/L), represents the mobility of landslides [54]. Considering the data accuracy (DEM resolution is 12.5 m), we chose landslides with an area larger than 200 m2 and calculated geometric parameters. The length (L) of a landslide is the projected length between the crown and the toe along the sliding direction, and the height (H) of a landslide is the elevation difference between its crown and the toe (Figure 7b).
The DEM data used in this study was ALOS PALSAR DEM (resolution 12.5 m). The slope and aspect information were extracted from this DEM. Road information included all major and minor roads of the Baoshan area. River information was the main rivers and tributaries. Lithology data were derived from a 1:200,000 geological map. The rainfall distribution was obtained by interpolating the annual average precipitation data of 29 meteorological stations around the study area. The fault data were derived from a 1:200,000 Chinese active tectonic map [55]. Using GIS software, all of the influencing factor maps were transformed into a raster format with a grid cell of 12.5 × 12.5 m. These influencing factor maps are shown in Figure 8.
In this study, the probability density was used to describe the spatial distribution of landslides in each influencing factor in the study area, which is expressed as [56,57].
PD = N i _ l s N i _ t o t a l N i _ i n t e r 100 %
where PD is the probability density; i represents landslide type (recent landslides, old landslides, no landslides), N i _ l s represents the i’s area of each class; N i _ t o t a l represents the total i’s area in the study area; and N i _ i n t e r represents the i’s classification interval.
Otherwise, to identify the most relevant factors influencing the landslides, we calculated the landslide area ratio (LAR) following the methodology proposed by Migoń et al. (2017) [58]. The “landslide area ratio” means what portion of the area is occupied by landslide terrain in given intervals of slope, elevation, distance to roads, distance to river, annual precipitation, distance to fault. This parameter is calculated by
LAR = A c l a s s A a l l 100 %
where   A c l a s s is the landslide area of the class; A a l l is the total landslides area in the study region.

5. Results

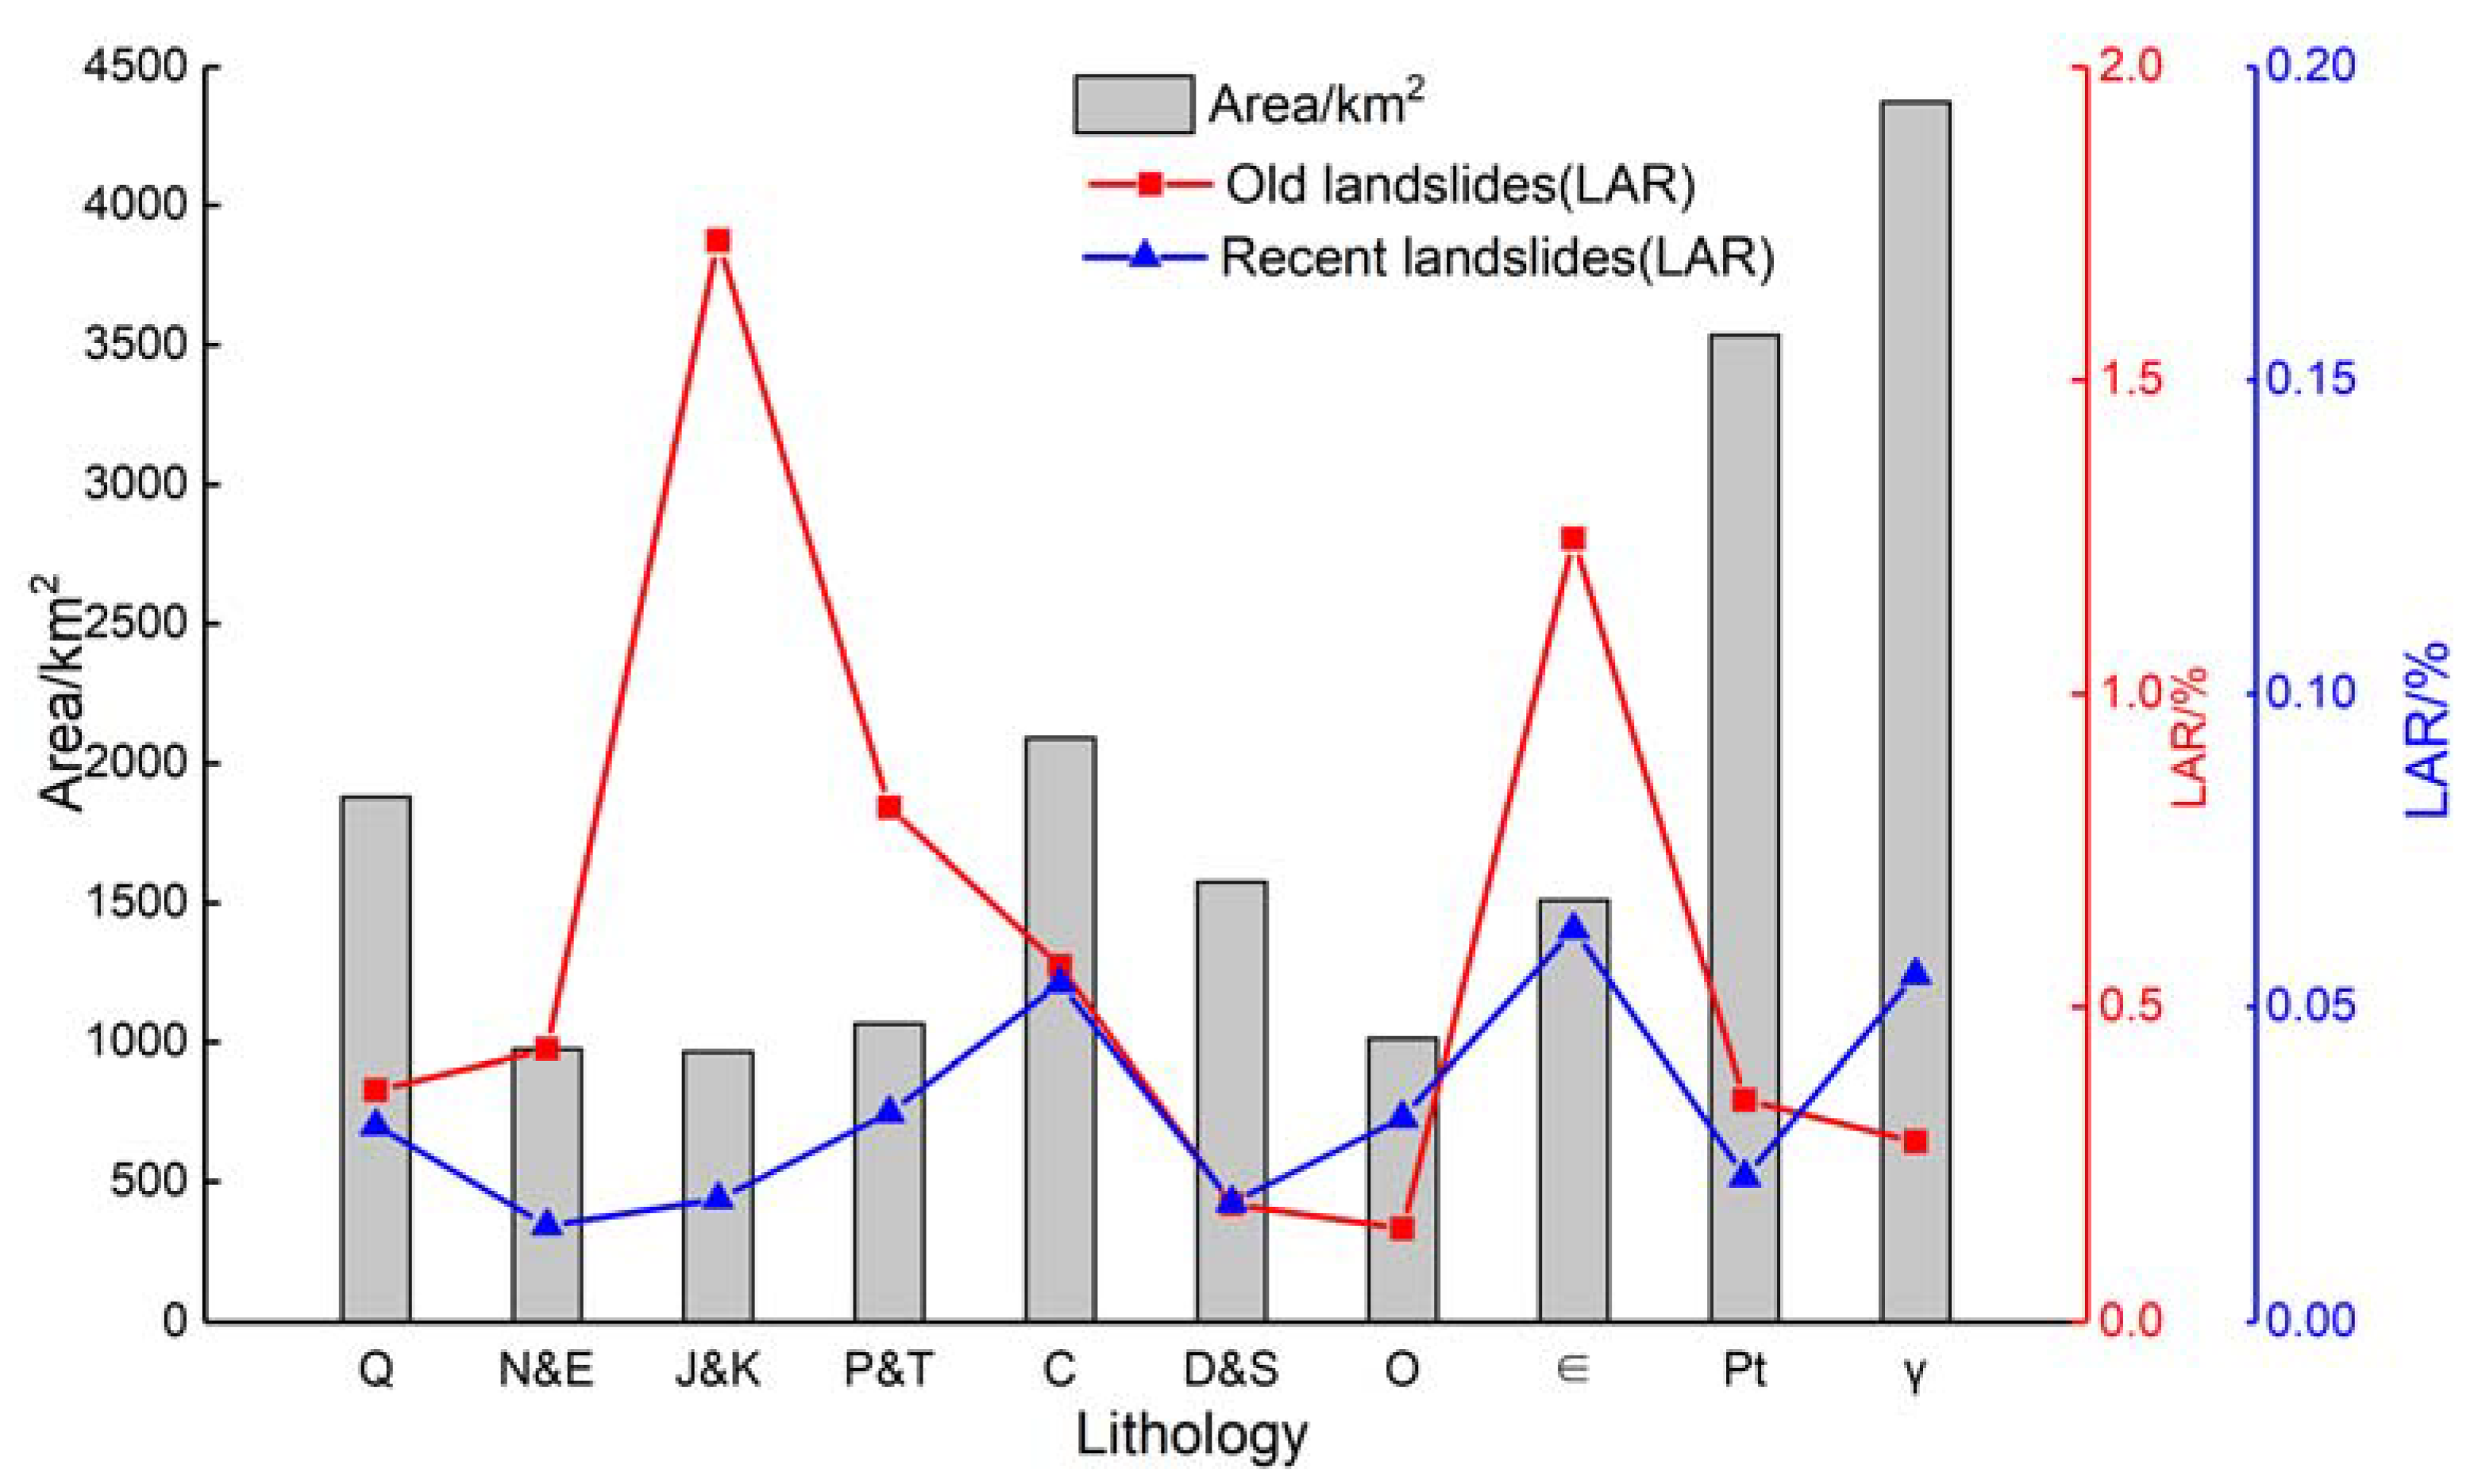
5.1. Correlation between Landslides and Influencing Factors

The analysis of the relationship between the landslides and topographic and geologic conditions were useful to clarify the influence of inner and outside factors on the occurrence of landslides. Figure 9 shows the probability density distribution of recent landslides, old landslides, and non-landslide areas in different influencing factors. General characteristics of the landslides are shown in Table 1. It is noted that with the increase of slope, the probability density of landslides increased first and then decreased, and most of the recent landslides clustered between 15–40°, while most of the old landslides occurred on slopes with the inclination of 10–30°. The average slopes of the recent landslides and the old landslides were 26.3 and 25.1°, respectively, whereas it was 20.9° for the non-landslide area. Overall, the recent landslides were mostly distributed in the areas with steeper slopes (Figure 9a).
For elevation, the trend of probability density in DEM was the same as that in slope. Most of the recent landslides were situated at elevations from 1680–1798 m, while old landslides were mainly at 1136–1242 m. Recent landslides generally occupied higher positions: the mean elevations of recent landslides and old landslides terrain were 1866.3 and 1403.6 m, respectively, whereas it was 1782.3 m for non-landslide terrain (Figure 9b). For the distance to rivers and distance to roads, most of the landslides, either recent or old, concentrated in the area of elevation <2000 m, and the landslide area quickly decreased with the increase of the distance (Figure 9c,d). However, the old landslides were greatly affected by drainages, almost all old landslides were distributed in the area within 1400 m away from the drainages (Figure 9d). In contrast, the recent landslides were more likely to be affected by the roads, because most of them concentrated in the area within 2000 m away from the roads (Figure 9c).
For rainfall, most of the old landslides were distributed at annual rainfall from 1032–1068 mm and 1212–1248 mm. While recent landslides were mainly at 1005–1050 mm and 1185–1230 mm (Figure 9e). For distance to the fault, most recent landslides were found within 10,000 m from the fault, while old landslides are within 8500 m (Figure 9f).
In addition, the landslide area ratio (LAR) was used as an index to represent the relative size of the landslide in each class of the influencing factors. Figure 10 shows the correlations between the LAR and the aforementioned influencing factors.
For the slope angle, the LAR of the old landslide increased for hill slopes with 45–50°, reaches 2.5% and then decreased with the slope increase. The recent landslides showed the same trend, within 65–70°, LAR reached 0.1% and then decreased with the slope increase (Figure 10a).
For elevation, the peak LAR of the old landslides, 1.5%, was present at elevations from 1000 to 1500 m, while the LAR of the recent landslides was the highest at 0.05% at the elevations of 2250–2500 m and 3000–3250 m (Figure 10b).
Overall, with the increase of distance to roads, the LAR of the old landslides decreased rapidly, with peak LAR of 0.629%, while the curve of recent landslides showed a trend of decreasing first, then suddenly increasing with a peak area LAR of 0.05% at the distance of around 15,000 m, and finally decreasing (Figure 10c). For distance to rivers, LAR of the recent landslides increased first and then decreased, with a peak LAR of 0.06%. While the LAR of old landslides decreased with the distance in the opposite way for the distance to roads, with a LAR of 0.8% at the distance of 4000–7000 m (Figure 10d). For annual average rainfall, it was easier to trigger landslides with rainfall of 1000–2200 mm (Figure 10e). For distance to the fault, when the fault distance was within 0–18,000 m, the LAR decreased with the increase of the distance to the fault, and the highest LAR of recent landslides and old landslides were within 2000–2500 m from the fault (0.05% and 3.1%), respectively (Figure 10f).
Figure 11 shows the relationship between the landslide and the slope aspect (facing direction of a slope). Figure 11a is the probability density distribution of the old landslides, recent landslides and non-landslide areas on different slope aspects. The non-landslide area was quite uniformly distributed in all aspects. However, recent landslides area was strongly biased 150–210°. From the statistical results of landslide area ratio (Figure 11b,c), aspects in the interval 45°–75° and 240°–300° appeared to be significant for old landslides. The peak landslide areal density 0.8% was present at the aspects from 280° to 310° for old landslides, while for the recent landslides, in the interval of 160°–180°, this value reached the maximum 0.07%.
Figure 12 shows the relationship between the landslides and the lithology units of different ages. In the study area, the lithology units of Neoproterozoic (Pt) and magmatic rock (γ) account for 18.6% and 23% of the study area, respectively. For recent landslides, the intrusive rocks and carboniferous rock had the largest LAR of 0.05% and 0.06%, respectively, indicating that the recent landslides were more likely to occur in the strata of Neoproterozoic and magmatic rock. For old landslides, the LAR in the Jurassic and Cretaceous (J&K) strata was the largest at 1.72%, which implies that the old landslides were more likely to occur in these units.

5.2. Landslide Position on Slopes

In order to visualize and describe the location of each landslide, we plotted their number density, area and relative distance to the ridge and stream on a fictitious slope profile (Figure 13). The results show that nearly 70% of recent landslides (as shown by the red region in the top of the virtual slope) occurred at the ridges (relative distance to the top less than 0.3) and were far away from the streams (relative distance to the stream more than 0.6), and the remaining landslides were at mid-slope positions. Most of old landslides occurred at the streams (relative distance to the stream less than 0.3), of which 80% (i.e., red high-density area) had lower boundary close to the streams (relative distance to the stream less than 0.5).

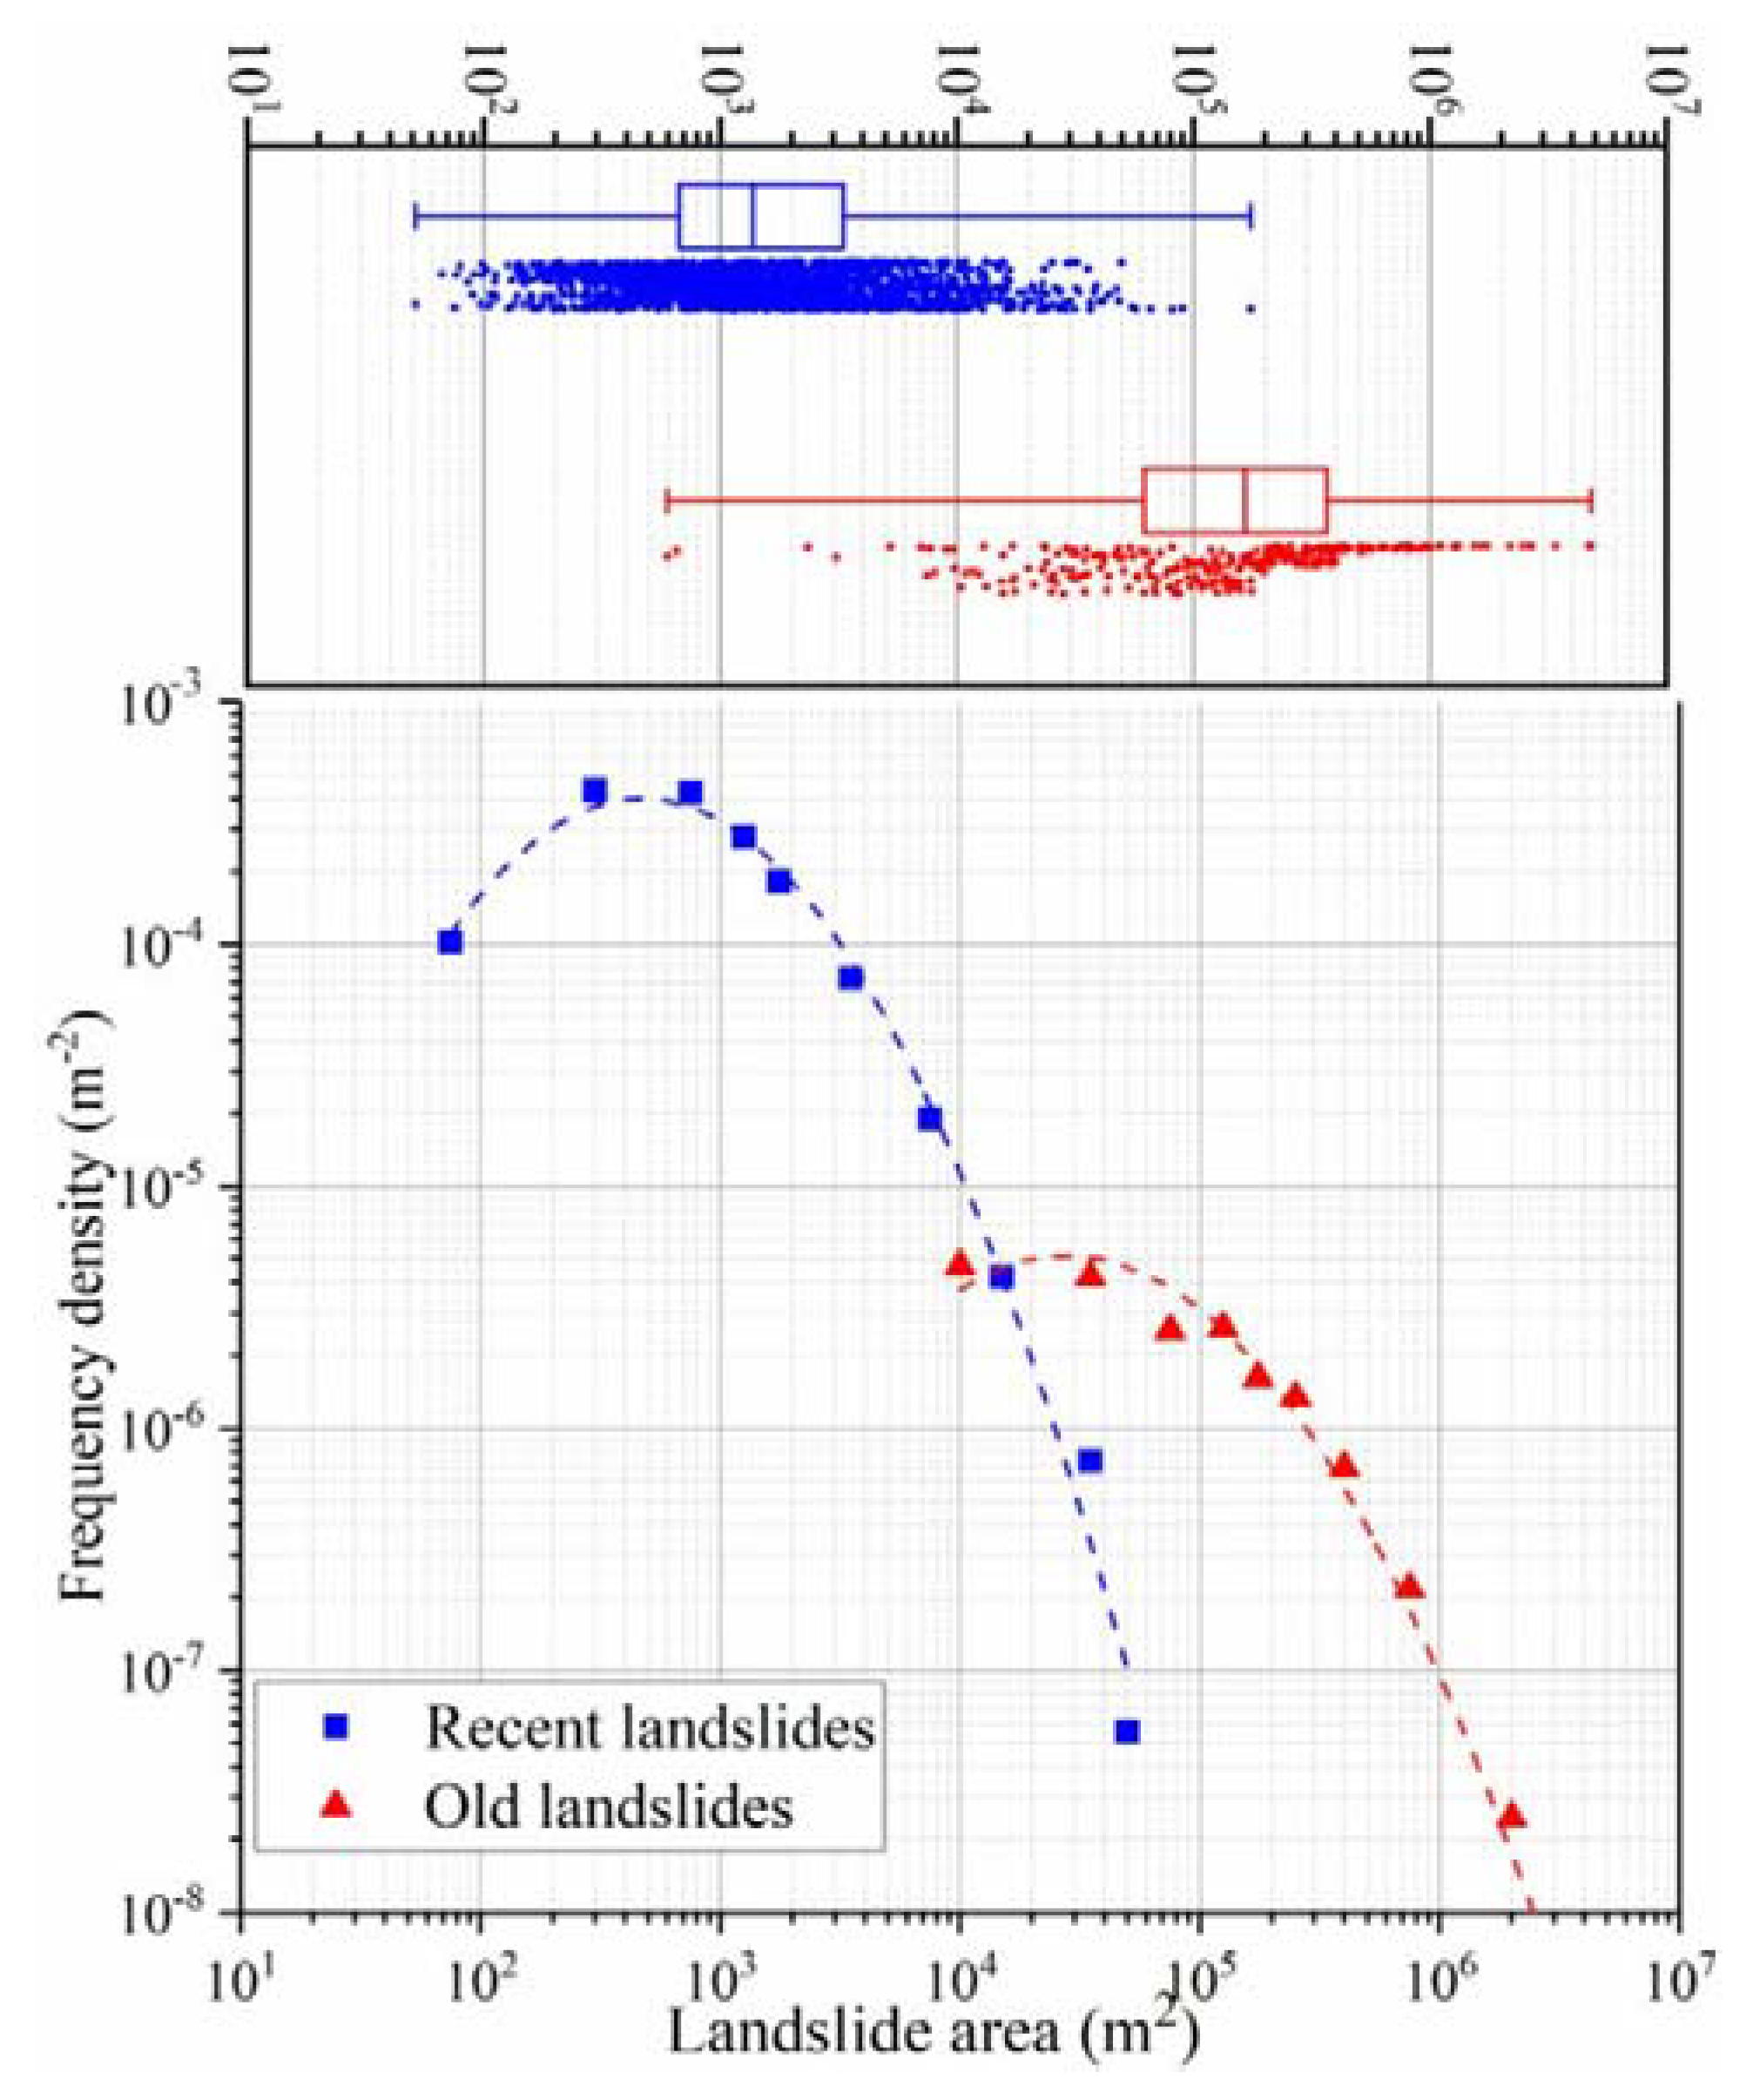
5.3. Geometric Characteristics of the Landsides

The relationship of the landslide height (H) versus travel distance (L) of all landslides is shown in Figure 14. For recent landslides, the height (H) of most landslides was less than 100 m, and the corresponding travel distance was between 0–200 m. The average H and L of the recent landslides were 29 m and 61 m, respectively. Most of the old landslides were distributed at landslide heights (H) less than 500 m, and the corresponding travel distance (L) was 10–1000 m, and the average H and L of the old landslides were 295 m and 622 m, respectively.
The empirical relationship between the H and L of the old and recent landslides were analyzed, expressed by
L r e c e n t = 6.3 H r e c e n t 0.80
L o l d = 7.1 H o l d 0.64
Figure 15 displays the probability densities of equivalent coefficients of friction (landslide height (H)/landslide travel distance (L)) of all landslides. Overall, the smaller the H/L value was, the higher the mobility of the landslides was. The H/L ratios of old and recent landslides ranged from 0.2 to 0.5 with averages of 0.45 and 0.5, respectively (Figure 14). On the whole, the empirical relationship between landslide height (H) and travel distance (L) was basically the same (Figure 14 and Figure 15). However, the travel distance of old landslides was much longer than recent landslides at the similar height (H). It indicates that old landslides had larger mobility.

6. Discussion

Mobility represents the runout characteristics of a landslide, often evaluated in terms of friction characteristics of the sliding bed and sliding surface and the topographic slope [4]. This study analyzed 1993 landslides with an area greater than 200 m2 in the study area. The H/L ratio is 0.4 (21°), which is basically consistent with the average slope (20.9°) in the study area. This shows that the landslide mobility in the study area is greatly affected by the terrain. In addition, previous studies have shown that the landslide mobility is directly proportional to the scale of the landslide, that is, the larger the landslide volume, the longer the travel distance, and the smaller the equivalent coefficients of friction of the landslide [59,60]. This can also be observed in Figure 14 and Figure 15. Compared with recent landslides, the old landslides have a larger volume. At the same height, the old landslides have greater mobility than the recent landslides.
Rainfall and earthquakes are the main landslide triggers [31,61]. Compared to rainfall-induced landslides, the scale of earthquake-induced landslides is relatively larger. Especially for some well-preserved old landslides of large scale, they are usually triggered by specific earthquake events [62,63]. Chang, et al. [64] found that earthquake-induced landslides often occur in ridge areas, while rainfall-triggered landslides mostly occur in mid-downhill areas. From Figure 13, most of the old landslides occurred in the ridge area, which shows that most old landslides may be closely related to seismic activity. Observed from the remote sensing images, most recent landslides are shallow-debris flow, which are usually triggered by rainfall. However, we find that many recent landslides also occurred in the ridge area. This is because in the Baoshan area earthquakes are frequent, the strength of rock mass is reduced and the cracks increase in the ridge area. Due to the abundant rainfall, water infiltrates into the rock mass through the cracks. With the increase of pore water pressure and the decrease of shear strength of the sliding surface, the landslides can occur.
Topography is one important internal factor to induce geological hazards [52]. The landform in the Baoshan area has the following characteristics: wide valleys, large topographic relief, and many river channels. Previous studies have shown that most historical landslides and earthquake-induced landslides occur in steeper areas [3,51,65]. The landslides in the Baoshan area are also more likely to occur in areas with relatively steep slopes. When slopes failed, the source materials slide from steep slopes to canyon or gully areas by gravity.
From the analysis of the relationship between the elevation and the recent or old landslide (Figure 9b), the recent landslides occurred primarily at places with higher altitudes. This may be because the vegetation in areas of high altitude is not easy to recover, and recent landslides occurring in these areas are more easily identified, while new those occurring in low-altitude areas are not easily identified due to rapid vegetation recovery. For the relationship between slope angle and the landslides (Figure 9a), the statistical results show that the recent landslides often occurred in the area with steeper slopes. We argued that the possible reason is that the old landslides were usually deep-seated landslides of a large scale, and the local terrain changed greatly after the sliding occurrence, resulting in the slope becoming gentler in the sliding area. However, the recent landslides had little influence on the local topography due to small scale. Meanwhile the DEM data used in this study is a post-event DEM with respect to the old landslides, so it is the slope that we can see after the landslide occurred, i.e., they are not the pre-failure conditions. This may also be one of the factors that affect the statistical results. For the relationship between slope aspect and the landslides (Figure 11), the density of the recent landslides in the three directions of SE, S, and SW is much higher than that in other directions, whereas the old landslides do not have this trend. This is because the rainfall in the area is mainly affected by the water vapor from the Indian Ocean to the south. Therefore, the south and adjacent slope aspects receive more rainfall than other directions. Under the action of rainfall softening and loading, these slopes are more prone to failure and slide. In the future study, the detailed analysis on the relationship of the landslide occurrence and influencing factors needs to be further made based on more data.

7. Conclusions

Based on Google Earth and remote sensing imagery, a landslide inventory of the Baoshan area, Yunnan, China was prepared in this work. A statistical analysis of the number, area and geometric parameters of the old landslides and recent landslides in the study area was conducted. In total, 2427 landslides were identified, covering 104.8 km2. Among them, the recent landslides are 2144 with a total area of 7.2 km2, and an average area of about 3351 m2, the old landslides are 283 with a total area of 97.6 km2 and an average area of about 345,000 m2.
Research suggests that the landslide occurrence is less affected by the rainfall and the fault but is greatly affected by the landform, especially slope and elevation. Recent landslides cluster in the slopes with 15°–40° and elevation with 1680–1798 m, while most of the old landslides occurred on slopes with the inclination of 10°–30° and elevations 1136–1242 m. From the landslide position, the source area of the landslides (whether old or recent landslides) are usually near the ridge area, while the accumulation areas of the old landslides are closer to the valleys. The geometric analysis of the landslides indicate that the average height of the recent landslides was 30 m and the average length was 60 m. The average height of the old landslide was 295 m and the average length was 620 m. Fitting their height (H) and length (L) yields the regression relationship: L recent = 6.3 H recent 0.80 and L old = 7.1 H old 0.64 . In contrast, old landslides had better mobility.
We expect that the new landslide inventory map of Baoshan city prepared in this work would be useful in the mapping landslide susceptibility and hazard assessment in the study area, and understanding the long-term impact of landslides on landform evolution.

Author Contributions

C.X. proposed the research concept, organized the landslide interpretation, and provided basic data. X.S. designed the framework and wrote the manuscript. S.M. participated in the writing and data analysis. L.S. and Y.L. provided basic data. All authors have read and agreed to the published version of the manuscript.

Funding

This study was supported by the Basic Scientific and Research Fund from the Institute of Crustal Dynamics, China Earthquake Administration (ZDJ2019-25), the Scientific Research Fund of Institute of Engineering Mechanics, China Earthquake Administration (2017QJGJ05-03), and the National Natural Science Foundation of China (41661144037).

Acknowledgments

We thank the anonymous reviewer and the editor, whose constructive and helpful comments improved this manuscript.

Conflicts of Interest

The authors declare that there are no conflicts of interest.

References

  1. Cruden, D.; Varnes, D.J. Landslide Types and Processes; National Academy Press: Washington, DC, USA, 1996; Volume 247, pp. 36–75. [Google Scholar]
  2. Petley, D. Global patterns of loss of life from landslides. Geology 2012, 40, 927–930. [Google Scholar] [CrossRef]
  3. Xu, C.; Xu, X.; Shyu, J.B.H. Database and spatial distribution of landslides triggered by the Lushan, China Mw 6.6 earthquake of 20 April 2013. Geomorphology 2015, 248, 77–92. [Google Scholar] [CrossRef] [Green Version]
  4. Roback, K.; Clark, M.K.; West, A.J.; Zekkos, D.; Li, G.; Gallen, S.F.; Chamlagain, D.; Godt, J.W. The size, distribution, and mobility of landslides caused by the 2015 Mw7.8 Gorkha earthquake, Nepal. Geomorphology 2018, 301, 121–138. [Google Scholar] [CrossRef]
  5. Marc, O.; Hovius, N. Amalgamation in landslide maps: Effects and automatic detection. Nat. Hazards Earth Syst. Sci. 2015, 15, 723–733. [Google Scholar] [CrossRef] [Green Version]
  6. Bucci, F.; Santangelo, M.; Cardinali, M.; Fiorucci, F.; Guzzetti, F. Landslide distribution and size in response to Quaternary fault activity: The Peloritani Range, NE Sicily, Italy. Earth Surf. Process. Landf. 2016, 41, 711–720. [Google Scholar] [CrossRef] [Green Version]
  7. Parker, R.N.; Densmore, A.L.; Rosser, N.J.; de Michele, M.; Li, Y.; Huang, R.; Whadcoat, S.; Petley, D.N. Mass wasting triggered by the 2008 Wenchuan earthquake is greater than orogenic growth. Nat. Geosci. 2011, 4, 449–452. [Google Scholar] [CrossRef] [Green Version]
  8. Borgatti, L.; Soldati, M. Landslides as a geomorphological proxy for climate change: A record from the Dolomites (northern Italy). Geomorphology 2010, 120, 56–64. [Google Scholar] [CrossRef]
  9. Bucci, F.; Cardinali, M.; Guzzetti, F. Structural geomorphology, active faulting and slope deformations in the epicentre area of the MW 7.0, 1857, Southern Italy earthquake. Phys. Chem. Earth 2013, 63, 12–24. [Google Scholar] [CrossRef]
  10. Shao, X.Y.; Ma, S.Y.; Xu, C.; Zhang, P.F.; Wen, B.Y.; Tian, Y.; Zhou, Q.; Cui, Y. Planet image-based inventorying and machine learning-based susceptibility mapping for the landslides triggered by the 2018 Mw6.6 tomakomai, Japan Earthquake. Remote Sens. 2019, 11, 978. [Google Scholar] [CrossRef] [Green Version]
  11. Ma, S.Y.; Xu, C. Assessment of co-seismic landslide hazard using the Newmark model and statistical analyses: A case study of the 2013 Lushan, China, Mw6.6 earthquake. Nat. Hazards 2019, 96, 389–412. [Google Scholar] [CrossRef]
  12. Xu, C.; Dai, F.; Xu, X.; Yuan, H.L. GIS-based support vector machine modeling of earthquake-triggered landslide susceptibility in the Jianjiang River watershed, China. Geomorphology 2012, 145–146, 70–80. [Google Scholar] [CrossRef]
  13. Steger, S.; Brenning, A.; Bell, R.; Glade, T. The propagation of inventory-based positional errors into statistical landslide susceptibility models. Nat. Hazards Earth Syst. Sci. 2016, 16, 2729–2745. [Google Scholar] [CrossRef] [Green Version]
  14. Guzzetti, F.; Cardinali, M.; Reichenbach, P.; Carrara, A. Comparing landslide maps: A case study in the Upper Tiber River Basin, Central Italy. Environ. Manag. 2000, 25, 247–263. [Google Scholar] [CrossRef]
  15. Klose, M.; Damm, B.; Highland, L. Databases in geohazard science: An introduction. Geomorphology 2015, 249, 1–3. [Google Scholar] [CrossRef]
  16. Xu, C.; Xu, X.W.; Yao, X.; Dai, F.C. Three (nearly) complete inventories of landslides triggered by the 12 May 2008 Wenchuan Mw 7.9 earthquake of China and their spatial distribution statistical analysis. Landslides 2014, 11, 441–461. [Google Scholar] [CrossRef] [Green Version]
  17. Xu, C.; Xu, X.; Shyu, J.B.H.; Zheng, W.; Min, W. Landslides triggered by the 22 July 2013 Minxian–Zhangxian, China, Mw 5.9 earthquake: Inventory compiling and spatial distribution analysis. J. Asian Earth Sci. 2014, 92, 125–142. [Google Scholar] [CrossRef]
  18. Chang, K.-T.; Chiang, S.-H.; Lei, F. Analysing the relationship between typhoon-triggered landslides and critical rainfall conditions. Earth Surf. Process. Landf. 2008, 33, 1261–1271. [Google Scholar] [CrossRef]
  19. Wu, C.-H.; Chen, S.-C.; Chou, H.-T. Geomorphologic characteristics of catastrophic landslides during typhoon Morakot in the Kaoping Watershed, Taiwan. Eng. Geol. 2011, 123, 13–21. [Google Scholar] [CrossRef]
  20. Galli, M.; Ardizzone, F.; Cardinali, M.; Guzzetti, F.; Reichenbach, P. Comparing landslide inventory maps. Geomorphology 2008, 94, 268–289. [Google Scholar] [CrossRef]
  21. Guzzetti, F.; Reichenbach, P.; Ardizzone, F.; Cardinali, M.; Galli, M. Estimating the quality of landslide susceptibility models. Geomorphology 2006, 81, 166–184. [Google Scholar] [CrossRef]
  22. Lazzari, M.; Gioia, D.; Anzidei, B. Landslide inventory of the Basilicata region (Southern Italy). J. Maps 2018, 14, 348–356. [Google Scholar] [CrossRef] [Green Version]
  23. Lupiano, V.; Rago, V.; Terranova, O.G.; Iovine, G. Landslide inventory and main geomorphological features affecting slope stability in the Picentino river basin (Campania, southern Italy). J. Maps 2019, 15, 131–141. [Google Scholar] [CrossRef] [Green Version]
  24. Lin, Q.; Wang, Y. Spatial and temporal analysis of a fatal landslide inventory in China from 1950 to 2016. Landslides 2018, 15, 2357–2372. [Google Scholar] [CrossRef]
  25. Damm, B.; Klose, M. The landslide database for Germany: Closing the gap at national level. Geomorphology 2015, 249, 82–93. [Google Scholar] [CrossRef]
  26. Haque, U.; Blum, P.; da Silva, P.F.; Andersen, P.; Pilz, J.; Chalov, S.R.; Malet, J.-P.; Auflič, M.J.; Andres, N.; Poyiadji, E.; et al. Fatal landslides in Europe. Landslides 2016, 13, 1545–1554. [Google Scholar] [CrossRef]
  27. Sepúlveda, S.A.; Petley, D.N. Regional trends and controlling factors of fatal landslides in Latin America and the Caribbean. Nat. Hazards Earth Syst. Sci. 2015, 15, 1821–1833. [Google Scholar] [CrossRef] [Green Version]
  28. Kirschbaum, D.B.; Adler, R.; Hong, Y.; Hill, S.; Lerner-Lam, A. A global landslide catalog for hazard applications: Method, results, and limitations. Nat. Hazards 2010, 52, 561–575. [Google Scholar] [CrossRef] [Green Version]
  29. Santangelo, M.; Marchesini, I.; Bucci, F.; Cardinali, M.; Fiorucci, F.; Guzzetti, F. An approach to reduce mapping errors in the production of landslide inventory maps. Nat. Hazards Earth Syst. Sci. 2015, 15, 2111–2126. [Google Scholar] [CrossRef] [Green Version]
  30. Xu, C. Preparation of earthquake-triggered landslide inventory maps using remote sensing and GIS technologies: Principles and case studies. Geosci. Front. 2015, 6, 825–836. [Google Scholar] [CrossRef] [Green Version]
  31. Guzzetti, F.; Mondini, A.C.; Cardinali, M.; Fiorucci, F.; Santangelo, M.; Chang, K.-T. Landslide inventory maps: New tools for an old problem. Earth Sci. Rev. 2012, 112, 42–66. [Google Scholar] [CrossRef] [Green Version]
  32. Pulighe, G.; Baiocchi, V.; Lupia, F. Horizontal accuracy assessment of very high resolution Google Earth images in the city of Rome, Italy. Int. J. Digit. Earth 2015, 9, 342–362. [Google Scholar] [CrossRef]
  33. Zhang, J.; Gurung, D.R.; Liu, R.; Murthy, M.S.R.; Su, F. Abe Barek landslide and landslide susceptibility assessment in Badakhshan Province, Afghanistan. Landslides 2015, 12, 597–609. [Google Scholar] [CrossRef]
  34. Conoscenti, C.; Rotigliano, E.; Cama, M.; Caraballo-Arias, N.A.; Lombardo, L.; Agnesi, V. Exploring the effect of absence selection on landslide susceptibility models: A case study in Sicily, Italy. Geomorphology 2016, 261, 222–235. [Google Scholar] [CrossRef]
  35. Rabby, Y.W.; Li, Y. An integrated approach to map landslides in Chittagong Hilly Areas, Bangladesh, using Google Earth and field mapping. Landslides 2019, 16, 633–645. [Google Scholar] [CrossRef]
  36. Li, W.-Y.; Liu, C.; Hong, Y.; Zhang, X.-H.; Wan, Z.-M.; Saharia, M.; Sun, W.-W.; Yao, D.-J.; Chen, W.; Chen, S.; et al. A public Cloud-based China’s Landslide Inventory Database (CsLID): Development, zone, and spatiotemporal analysis for significant historical events, 1949–2011. J. Mt. Sci. 2016, 13, 1275–1285. [Google Scholar] [CrossRef]
  37. Chen, X.; Zhou, Q.; Liu, C. Distribution pattern of coseismic landslides triggered by the 2014 Ludian, Yunnan, China Mw6.1 earthquake: Special controlling conditions of local topography. Landslides 2015, 12, 1159–1168. [Google Scholar]
  38. Yin, Y.; Xing, A.; Wang, G.; Feng, Z.; Li, B.; Jiang, Y. Experimental and numerical investigations of a catastrophic long-runout landslide in Zhenxiong, Yunnan, southwestern China. Landslides 2017, 14, 649–659. [Google Scholar] [CrossRef]
  39. Shi, C.; Li, D.-J.; Chen, K.-H.; Zhou, J.-W. Failure mechanism and stability analysis of the Zhenggang landslide in Yunnan Province of China using 3D particle flow code simulation. J. Mt. Sci. 2016, 13, 891–905. [Google Scholar] [CrossRef]
  40. Xing, A.; Wang, G.; Yin, Y.; Tang, C.; Xu, Z.; Li, W. Investigation and dynamic analysis of a catastrophic rock avalanche on September 23, 1991, Zhaotong, China. Landslides 2016, 13, 1035–1047. [Google Scholar] [CrossRef]
  41. Huang, R.Q. Some catastrophic landslides since the twentieth century in the southwest of China. Landslides 2009, 6, 69–81. [Google Scholar]
  42. Tian, Y.; Xu, C.; Xu, X.; Wu, S.E.; Chen, J. Spatial distribution analysis of coseismic and pre-earthquake landslides triggered by the 2014 Ludian MS6.5 earthquake. Seismol. Geol. 2015, 37, 291–306. [Google Scholar]
  43. Xu, X.; Wen, X.; Zheng, R.; Ma, W.; Song, F.; Yu, G. Pattern of latest tectonic motion and its dynamics for active blocks in Sichuan-Yunnan region, China. Sci. China Ser. D Earth Sci. 2003, 46, 210–226. [Google Scholar]
  44. Sato, H.P.; Harp, E.L. Interpretation of earthquake-induced landslides triggered by the 12 May 2008, M7.9 Wenchuan earthquake in the Beichuan area, Sichuan Province, China using satellite imagery and Google Earth. Landslides 2009, 6, 153–159. [Google Scholar] [CrossRef]
  45. Xu, C.; Shyu, J.B.H.; Xu, X. Landslides triggered by the 12 January 2010 Port-au-Prince, Haiti, Mw 7.0 earthquake: Visual interpretation, inventory compiling, and spatial distribution statistical analysis. Nat. Hazards Earth Syst. Sci. 2014, 14, 1789–1818. [Google Scholar] [CrossRef] [Green Version]
  46. Crosby, C. Lidar and Google Earth: Simplifying access to high-resolution topography data. Spec. Pap. Geol. Soc. Am. 2012, 492, 37–47. [Google Scholar]
  47. Keaton, J.R.; De Graff, J. Surface observation and geologic mapping. Spec. Rep. Natl. Res. Counc. Transp. Res. Board 1996, 247, 178–230. [Google Scholar]
  48. Santangelo, M.; Gioia, D.; Cardinali, M.; Guzzetti, F.; Schiattarella, M. Landslide inventory map of the upper Sinni River valley, Southern Italy. J. Maps 2014, 11, 444–453. [Google Scholar] [CrossRef] [Green Version]
  49. Eeckhaut, M.; Poesen, J.; Gullentops, F.; Vandekerckhove, L.; Hervás, J. Regional mapping and characterisation of old landslides in hilly regions using LiDAR-based imagery in Southern Flanders. Quat. Res. 2011, 75, 721–733. [Google Scholar] [CrossRef]
  50. Zhuang, J.; Peng, J.; Xu, C.; Li, Z.; Densmore, A.; Milledge, D.; Iqbal, J.; Cui, Y. Distribution and characteristics of loess landslides triggered by the 1920 Haiyuan Earthquake, Northwest of China. Geomorphology 2018, 314, 1–12. [Google Scholar] [CrossRef] [Green Version]
  51. Fan, X.; Scaringi, G.; Xu, Q.; Zhan, W.; Dai, L.; Li, Y.; Pei, X.; Yang, Q.; Huang, R. Coseismic landslides triggered by the 8th August 2017 Ms 7.0 Jiuzhaigou earthquake (Sichuan, China): Factors controlling their spatial distribution and implications for the seismogenic blind fault identification. Landslides 2018, 15, 967–983. [Google Scholar] [CrossRef]
  52. Meunier, P.; Hovius, N.; Haines, J.A. Topographic site effects and the location of earthquake induced landslides. Earth Planet. Sci. Lett. 2008, 275, 221–232. [Google Scholar] [CrossRef]
  53. Taylor, F.E.; Malamud, B.D.; Witt, A.; Guzzetti, F. Landslide shape, ellipticity and length-to-width ratios. Earth Surf. Process. Landf. 2018, 43, 3164–3189. [Google Scholar] [CrossRef]
  54. Tian, Y.; Xu, C.; Chen, J.; Zhou, Q.; Shen, L. Geometrical characteristics of earthquake-induced landslides and correlations with control factors: A case study of the 2013 Minxian, Gansu, China, Mw 5.9 event. Landslides 2017, 14, 1915–1927. [Google Scholar] [CrossRef]
  55. Deng, Q.D. Chinese Active Tectonic Map; Seismological Press: Beijing, China, 2007. [Google Scholar]
  56. Korup, O. Distribution of landslides in southwest New Zealand. Landslides 2005, 2, 43–51. [Google Scholar] [CrossRef] [Green Version]
  57. Pánek, T.; Břežný, M.; Kapustová, V.; Lenart, J.; Chalupa, V. Large landslides and deep-seated gravitational slope deformations in the Czech Flysch Carpathians: New LiDAR-based inventory. Geomorphology 2019, 346, 106852. [Google Scholar] [CrossRef]
  58. Migoń, P.; Jancewicz, K.; Różycka, M.; Duszyński, F.; Kasprzak, M. Large-scale slope remodelling by landslides—Geomorphic diversity and geological controls, Kamienne Mts., Central Europe. Geomorphology 2017, 289, 134–151. [Google Scholar] [CrossRef]
  59. Zhang, D.; Wang, G. Study of the 1920 Haiyuan earthquake-induced landslides in loess (China). Eng. Geol. 2007, 94, 76–88. [Google Scholar] [CrossRef]
  60. Scheidegger, A.E. On the prediction of the reach and velocity of catastrophic landslides. Rock Mech. 1973, 5, 231–236. [Google Scholar] [CrossRef]
  61. Barth, S.; Geertsema, M.; Bevington, A.R.; Bird, A.L.; Clague, J.J.; Millard, T.; Bobrowsky, P.T.; Hasler, A.; Liu, H. Landslide response to the 27 October 2012 earthquake (MW 7.8), southern Haida Gwaii, British Columbia, Canada. Landslides 2019. [Google Scholar] [CrossRef] [Green Version]
  62. Guo, C.; Du, Y.; Tong, Y.; Zhang, Y.; Zhang, G.; Zhang, M.; Ren, S. Huge long-runout landslide characteristics and formation mechanism: A case study of the Luanshibao landslide, Litang County, Tibetan Plateau. Geomorphology 2016, 35, 1332–1345. [Google Scholar]
  63. Zeng, Q.L.; Yuan, G.; Davies, T.; Xu, B.; Wei, R.; Xue, X.; Zhang, L. 10Be dating and seismic origin of Luanshibao rock avalanche in SE Tibetan Plateau and implications on Litang active fault. Landslides 2019. [Google Scholar] [CrossRef]
  64. Chang, K.-T.; Chiang, S.-H.; Hsu, M.-L. Modeling typhoon- and earthquake-induced landslides in a mountainous watershed using logistic regression. Geomorphology 2007, 89, 335–347. [Google Scholar] [CrossRef]
  65. Zhuang, J.; Peng, J.; Wang, G.; Javed, I.; Wang, Y.; Li, W. Distribution and characteristics of landslide in Loess Plateau: A case study in Shaanxi province. Eng. Geol. 2018, 236, 89–96. [Google Scholar] [CrossRef]
Figure 1. (a) Location of Yunnan province, China; (b) Shaded topographic map showing Baoshan city and historical earthquakes from 1512 to 2015; (c) The distribution of the lithology units of different ages. DYJF: Dayingjiang fault; NJF: Nujiang fault; KJF: Kejie fault; LCJF: Lancangjiang fault; SDF: Shidian fault.
Sustainability 12 02433 g001
Figure 2. Map showing the post-sliding images of Wama landslide from Google Earth. Their dates are 30th Jan 2012 (a) and 17th Nov 2013 (b). Yellow polygons denote the limit of the Wama landslide.
Sustainability 12 02433 g002
Figure 3. Map showing two locations of the old landslides from Google Earth. (a) The geographical location is 25.52° N, 98.37° E (b) The geographical location is 25.23° N, 98.33° E. Black polygons denote the boundaries of the landslides.
Sustainability 12 02433 g003
Figure 4. Map showing two recent landslides from Google Earth. (a) The geographical location is 24.69 N, 99.0 E. (b) The geographical location is 24.91 N, 98.39 E.
Sustainability 12 02433 g004
Figure 5. Landslide inventory map of Baoshan city including recent and old landslides.
Sustainability 12 02433 g005
Figure 6. Probability density plot of the landslide size (area in m2) distribution of the whole landslide inventory.
Sustainability 12 02433 g006
Figure 7. (a) Schematic of geometric parameters a, b, and d used in the analysis of landslide locations with respect to the ridge crest and stream; (b) Schematic showing a landslide.
Sustainability 12 02433 g007
Figure 8. Maps show the distribution of the influencing factors in the study area. (a) Slope angle; (b) Elevation; (c) Distance to roads; (d) Distance to river; (e) Annual precipitation; (f) Distance to fault.
Sustainability 12 02433 g008
Figure 9. Distribution of influencing factors within recent landslides, old landslides and non-landslide areas; (a) Slope angle; (b) Elevation; (c) Distance to roads; (d) Distance to river; (e) Annual precipitation; (f) Distance to fault.
Sustainability 12 02433 g009
Figure 10. Correlations of influencing factors with landslide abundance proxy (landslide area percentage); (a) Slope angle; (b) Elevation; (c) Distance to roads; (d) Distance to river; (e) Annual precipitation; (f) Distance to fault.
Sustainability 12 02433 g010
Figure 11. (a) Distribution of slope aspects within landslides and non-landslide areas; (b) correlations of slope aspect with landslide abundance proxy of recent landslides; (c) correlations of slope aspect with landslide abundance proxy of old landslides.
Sustainability 12 02433 g011
Figure 12. Classification of lithology and its relation with landslide area percentage (LAR).
Sustainability 12 02433 g012
Figure 13. Location of landslides with respect to ridge crests and streams. (a) Recent landslides; (b) Old landslides. The circle size represents the landslide scale; the landslide number density is displayed by different background colors, with red indicating comparatively high density and green indicating comparatively low density.
Sustainability 12 02433 g013
Figure 14. Empirical relationship between landslide height (H) and travel distance (L).
Sustainability 12 02433 g014
Figure 15. Probability density of the H/L of the landslides.
Sustainability 12 02433 g015
Table 1. Influence factors of two kinds of landslides and non-landslide area.
Variable Old-LRecent-LNon-L
Slope angle[°]Mean25.426.320.9
Max787185
Min000
Elevation[m]Mean1403.61866.31782.3
Max314334403722
Min555582493
Slope aspect[°]Mean176.7173.3176.5
Max360360360
Min−1−1−1
Distance to road[m]Mean242426013103
Max13,54213,99622,128
Min000
Distance to river[m]Mean153224382122
Max7156880710,552
Min000
Distance to fault[m]Mean7113.66174.77049.5
Max25,71823,77230,213
Min000
Rainfall[mm]Mean1219.61307.71255.7
Max184820722109
Min970.25975.19966.89
L represents the abbreviation of landslide; Old-L represents the old landslide; Recent-L represents the recent landslides; Non-L represents the non-landsliding area.

