Article

Pollution, Sources and Human Health Risk Assessment of Potentially Toxic Elements in Different Land Use Types under the Background of Industrial Cities

1
Institute of Nature Disaster Research, Department of Environment, Northeast Normal University, Changchun 130024, China
2
Key Laboratory for Vegetation Ecology, Ministry of Education, Changchun 130117, China
3
State Environmental Protection Key Laboratory of Wetland Ecology and Vegetation Restoration, Northeast Normal University, Changchun 130024, China
*
Author to whom correspondence should be addressed.
Sustainability 2020, 12(5), 2121; https://doi.org/10.3390/su12052121
Submission received: 29 January 2020 / Revised: 1 March 2020 / Accepted: 2 March 2020 / Published: 9 March 2020

Abstract

:
Residents in industrial cities may be exposed to potentially toxic elements (PTEs) in soil that increase chronic disease risks. In this study, six types of PTEs (Zn, As, Cr, Ni, Cu, and Pb) in 112 surface soil samples from three land use types—industrial land, residential land, and farmland—in Tonghua City, Jilin Province were measured. The geological accumulation index and pollution load index were calculated to assess the pollution level of metal. Meanwhile, the potential ecological risk index, hazard index, and carcinogenic risk were calculated to assess the environmental risks. The spatial distribution map was determined by the ordinary kriging method, and the sources of PTEs were identified by factor analysis and cluster analysis. The average concentrations of Zn, As, Cr, Ni, Cu, and Pb were 266.57, 15.72, 72.41, 15.04, 20.52, and 16.30 mg/kg, respectively. The results of the geological accumulation index demonstrated the following: Zn pollution was present in all three land use types, As pollution in industrial land cannot be neglected, Cr pollution in farmland was higher than that in the other two land use types. The pollution load index decreased in the order of industrial land > farmland > residential land. Multivariate statistical analysis divided the six PTEs into three groups by source: Zn and As both originated from industrial activities; vehicle emissions were the main source of Pb; and Ni and Cu were derived from natural parent materials. Meanwhile, Cr was found to come from a mixture of artificial and natural sources. The soil environment in the study area faced ecological risk from moderate pollution levels mainly contributed by As. PTEs did not pose a non-carcinogenic risk to humans; however, residents of the three land use types all faced estimated carcinogenic risks caused by Cr, and As in industrial land also posed high estimated carcinogenic risk to human health. The conclusion of this article provides corresponding data support to the government’s policy formulation of remediating different types of land and preventing exposure and related environmental risks.

1. Introduction

Industrial cities are well known for promoting a mixture of heavy industry and light industry while making significant use of mineral resources. This means that more frequent human activities, such as factory operations, pesticides, and fertilizers, and mining activities would lead to the soil in industrial cities being exposed to higher hazards of potentially toxic elements (PETs) [1]. Owing to the toxicity, non-biodegradation, and bioaccumulation of PTEs [2,3,4,5,6], the pollution of PTEs in the soil of industrial cities has attracted an extensive amount of attention [7,8,9]. PTEs from the soil enter the human body through inhalation, ingestion, and dermal contact [10,11] and cause harm to the human body after accumulation. For instance, long-term accumulation of cadmium causes osteoporosis and renal tubular injury [12]; damage to nerves, bones, and the immune system of human body results from the excessive intake of lead; and excessive zinc leads to nausea, vomiting, and even stomach cramps. In fact, high doses and long-term exposure to zinc leads to cholesterol imbalance and even infertility [13]. Arsenic is the most common carcinogenic substance in environmental media, causing health risks to the human body [14]. To avoid the threat of PTEs to the ecological environment and human health, it is very crucial to analyze the content of PTEs in the soil and assess the risks.
At present, there are many studies on the pollution of PTEs in farmland [15,16,17,18], including mining areas [3,19], parks [10], cities [4,20], etc., but they are all aimed at a single land type. There are obvious differences in soil properties under different land types, which will lead to differences in the contents of PTEs [21]. However, there are few studies that consider different land use types when carrying out pollution assessment and environmental risk assessment. Therefore, in this study, the soil of three land use types, namely, industrial land, residential land, and farmland, were collected and analyzed.
Pollution assessment of PTEs in soil includes a single index assessment method, such as the geological accumulation index [22], enrichment index [23], and pollution index (PI) [24], as well as comprehensive evaluation methods, such as the pollution load index [25] and Nemerow pollution evaluation methods [26]. Sources of PTEs in soils of industrial cities typically are a part of a complex system. Currently, multiple statistical methods are mainly used to distribute sources of harmful substances [27]. According to relevant research statistics, the most commonly used methods are principal component analysis and cluster analysis (CA). Principal component analysis can be classified as factor analysis (FA), and a simplified result of FA would be more convincing for data analysis [28]. Therefore, this study combines FA and CA to determine the possible sources of PTEs in soil. Meanwhile, spatial interpolation technology based on geostatistics is adopted to directly reflect the spatial distribution law of harmful substances in the soil, and unbiased estimation is conducted on the variable values of space objects at non-sampled locations [29,30]. Visualizing high-risk areas helps decision-makers to prioritize methods of remediation [31].
In this study, Tonghua City, an old industrial zone in northeast China, is selected as the research area. Tonghua City has the largest iron and steel joint enterprise in Jilin Province, established in 1958, and has a long history of industrial development. Presently, it can produce more than 10 million tons of steel per year. There are also many types of industrial enterprises located in this city. Dense population, heavy transportation, and active industrial activities all pose threats to the quality of the different types of soil available and to human health in this city. Until now, data on the content of PTEs and environmental risks in the soil in this area have not been released. In summary, the purpose of this study is the following: (1) collect topsoil from three different land use types (residential land, industrial land, and farmland) in Tonghua City, measuring the content of six PTEs and combining single-index and comprehensive evaluation methods to determine the pollution level of heavy metals; (2) explore the sources of PTEs in soil by combining the spatial distribution based on geostatistics and multivariate analysis; (3) conduct ecological risk and human health risk assessments of PTEs in different types of soil in the study area. These efforts will provide effective support to the government in controlling PTEs, repairing soil and managing industrial cities.

2. Materials and Methods
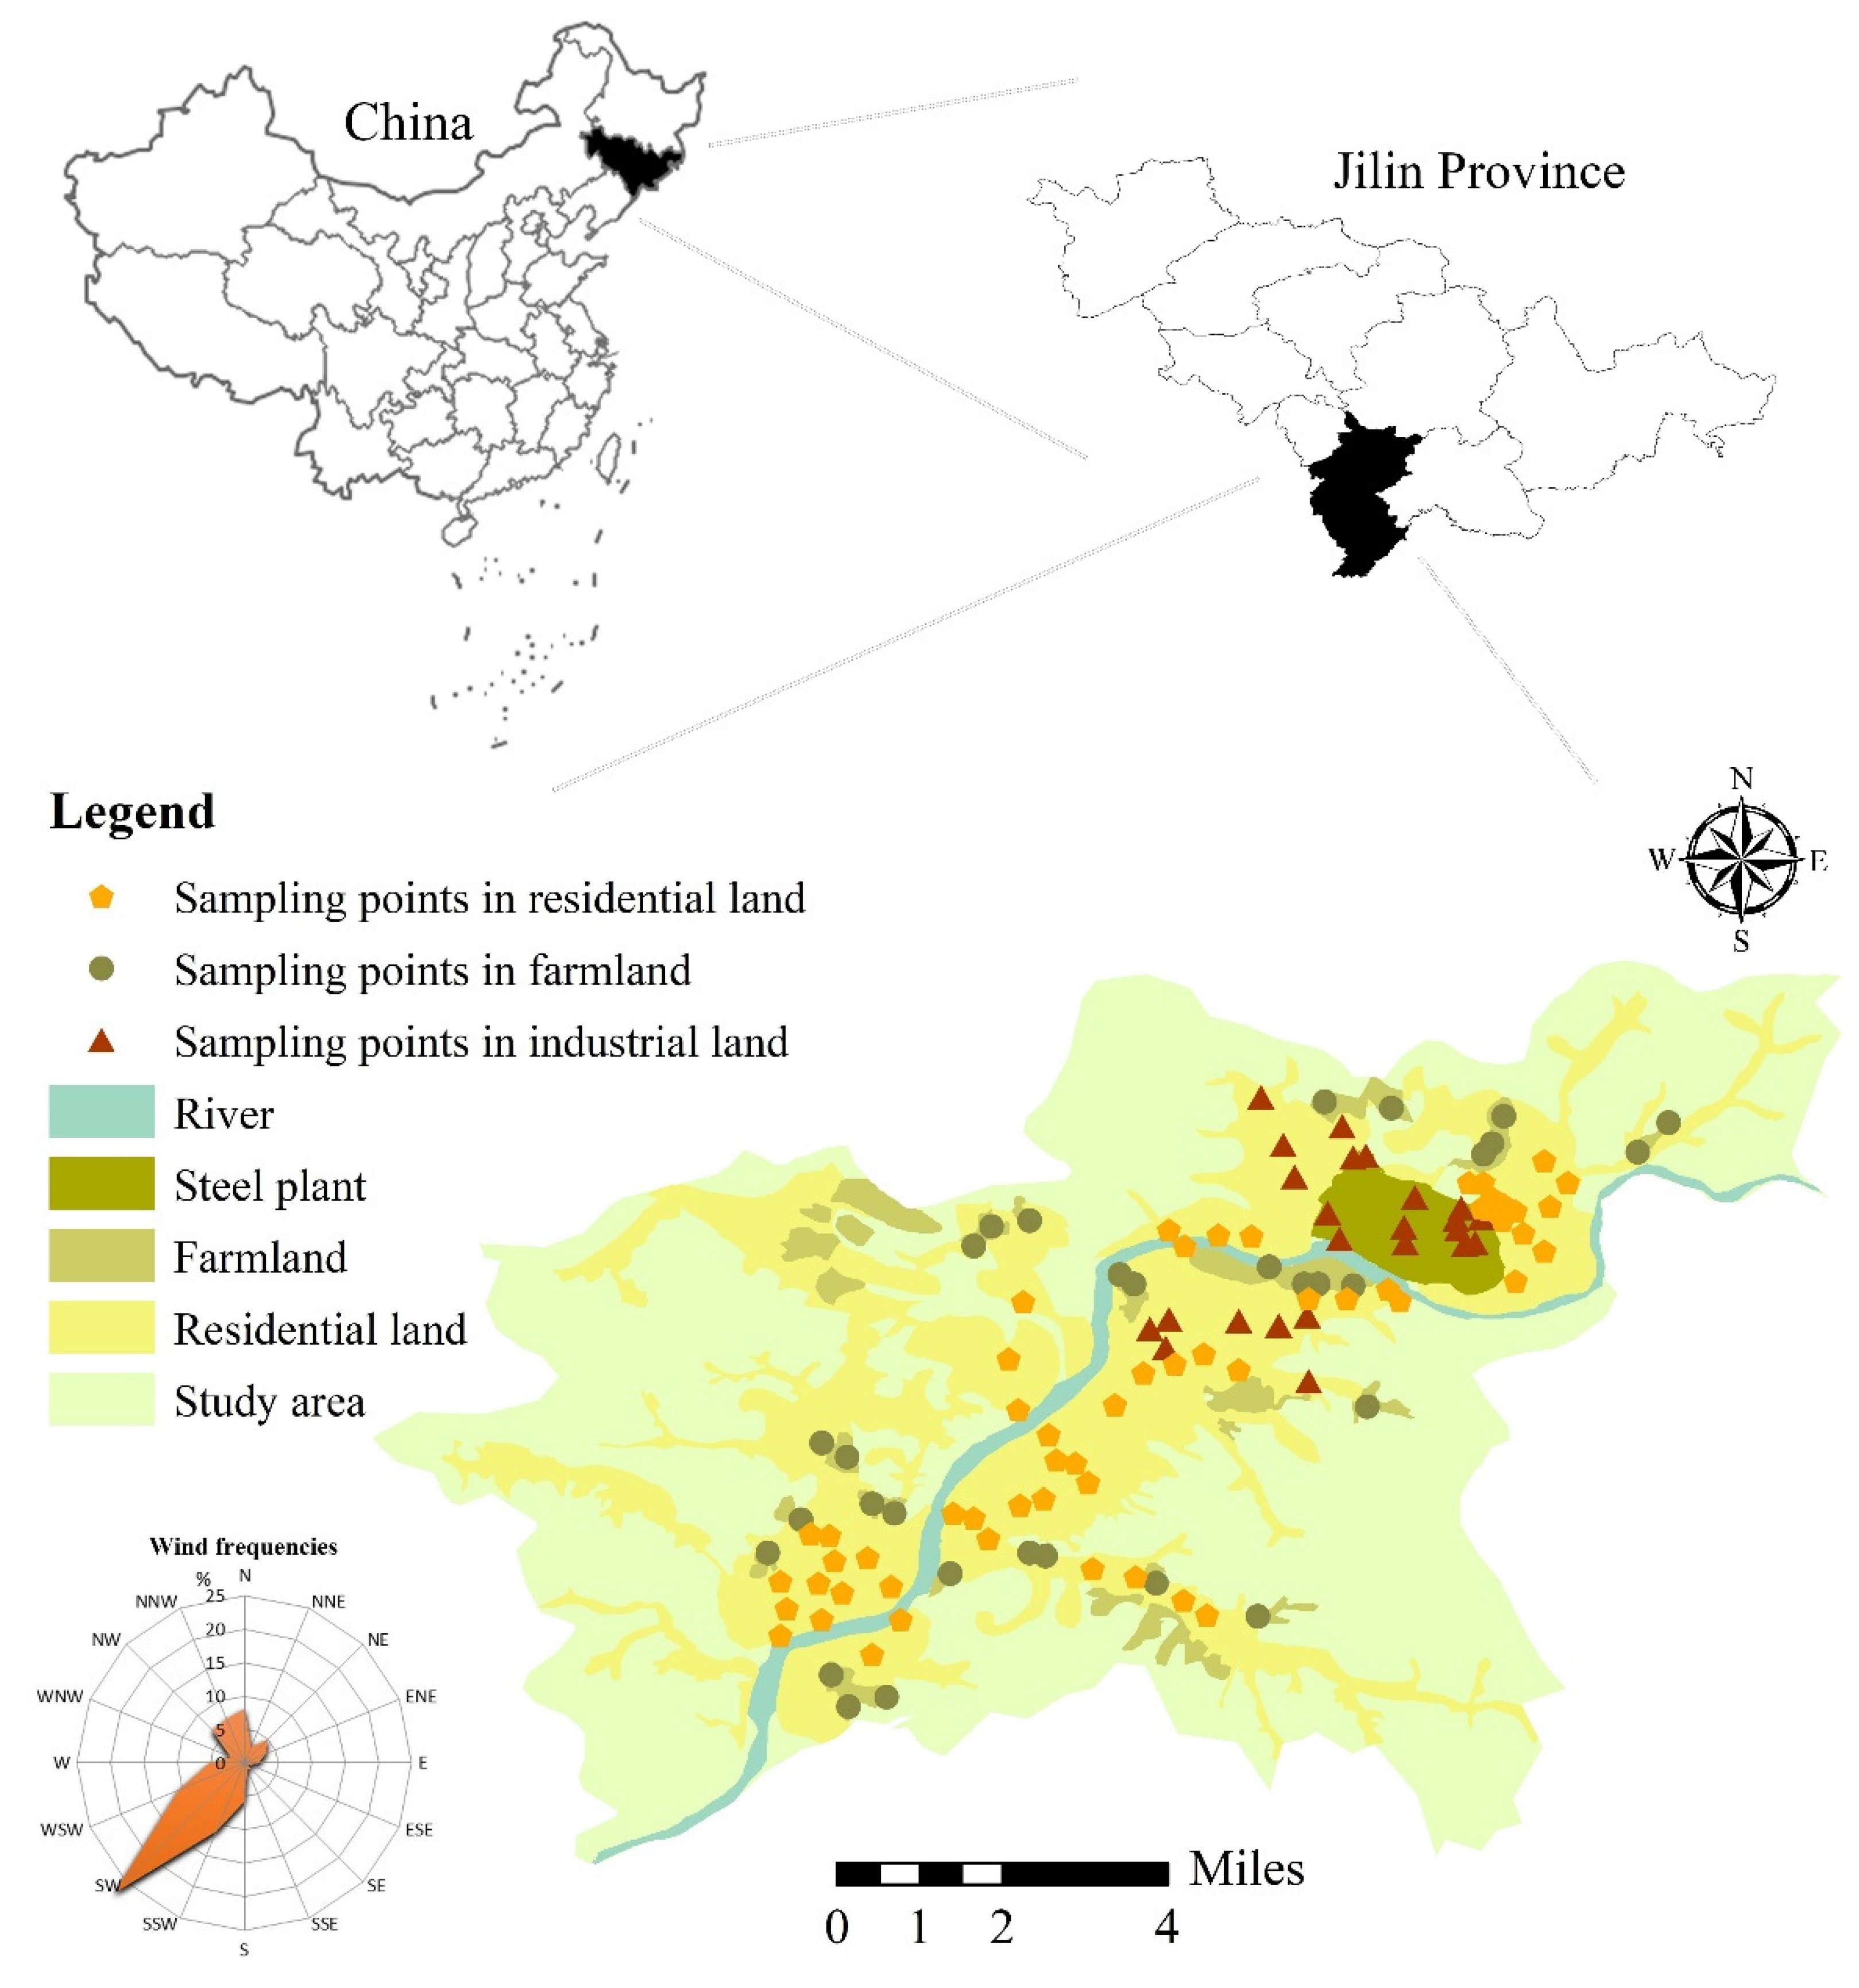
2.1. Study Area

This study was carried out in Tonghua City in the southern region of Jilin Province, China. Tonghua covers an area of 15,600 km2, of which more than two-thirds is mountainous. The terrain subsides from south to north, forming a topography of high elevation in the south and low elevation in the north. With a population of over 2.17 million, it is located between 40°52′–43°03′ N, 125°10′–126°44′ E. Tonghua resides in a humid climate zone in the temperate zone, with an annual average temperature of 5.5 °C and an annual average rainfall of 870 mm. Southwest winds prevail in Tonghua city all year round, and local wind direction data were collected and shown in Figure 1. Dongchang district and Erdaojiang district’s suburban besieged economic zone, and Erdaojiang district’s enterprises are mainly light industrial products, including chemicals, pharmaceuticals, food, machinery, building materials, mining, smelting, and printing products [32].

2.2. Sampling Collection and Analysis

A total of 112 soil samples (0–10 cm) were collected in Dongchang district and Erdaojiang district, which consist of samples from residential land (57), industrial land (24), and farmland (31). At each sampling point, a total of five samples were collected using stainless-steel shovels and then mixed into a composite sample. The sampling points were located by a hand-held global positioning system (GPS). Then, each sample was stored in a polyethylene bag after being collected on site and quickly transferred to the laboratory for experiment. The sampling site locations are shown in Figure 1.
After the samples were naturally air-dried, the plant roots, stones, and other materials were removed through a 2 mm nylon screen. Then, the samples were ground through a mortar, and all the samples were passed through a 0.15 mm nylon screen after grinding for subsequent experiments. Based on the National Standard Method of China (HJ 491-2009), the concrete steps of soil digestion were as follows: (1) a 0.25 g sample was weighed, sequentially adding HCl-HNO3-HClO4-HF, and heated on an electric heating plate to perform soil digestion; (2) the solution was decomposed until viscous, poured into a 50 mL volumetric flask, and 1% HNO3 was used as a constant volume; (3) the constant volume solution was filtered; (4) the filtered solution was extracted by a disposable syringe and made available for testing after passing through a 0.45 µm filter membrane. The contents of Zn, As, Cr, Ni, Cu, and Pb in the samples were measured by inductively coupled plasma-atomic emission spectrometry (Avio 200, PerkinElmer, MA, USA). Quality assurance and quality control procedures were carried out, including reference material certification (GSS series), blank tests for each group of samples, and repeating the analysis three times. The relative standard deviation of duplicate samples was under 10%. The detection limits of PTEs were 0.2, 0.02, 0.02, 0.01, 0.01, and 0.03 mg/kg for As, Ni, Cr, Cu, Zn, and Pb, respectively.

2.3. Method

2.3.1. Factor Analysis (FA)

The difference between FA and principal component analysis is the use of different mathematical methods. FA uses maximum original rotation technology to simplify the original data. The processed data can better explain the source of PTEs, and the new variables created have the same amount of information as the original data [33]. FA has seldom been used to study PTEs in soil [33]; however, there have been more studies on human and environmental behaviors in which FA was adopted [34]. Relevant studies showed that FA can link spatial variability to some mechanisms of toxic element sources [28].

2.3.2. Geo-Accumulation Index (Igeo)

The geological accumulation index is based on Muller’s formula and uses the ratio of the measured values of elements in soil to the geochemical background values to carry out pollution assessment [35]. Igeo was calculated by Equation (1):
I g e o   =   l o g 2 [ C n 1.5 B n ]
where Cn is the measured value of the element, Bn is the geochemical background value of a single element [36], and 1.5 is the correction index. Diagenesis is considered to possibly cause changes in the background value and is usually used to characterize sedimentary characteristics, rock geology, and other influences. According to the value of Igeo, its classification standard is shown in Table 1.

2.3.3. Pollution Load Index (PLI)

Meanwhile, pollution index (PI) was used to evaluate the pollution status of a single metal. PI was defined as the ratio of the measured value of the metal in the soil to the background value of the metal. According to different PI values, it is divided into three grades: low (PI ≤ 1), middle (1 < PI ≤ 3), and high (PI > 3). Here, we used the background values of soil elements in Jilin Province to perform the calculation [31]. To evaluate the overall pollution status of the soil, the pollution load index (PLI) was used rather than considering the influence of a single metal. PLI is calculated using the following expression (Equation (2)):
P L I   =   ( P I 1 × P I 2 × P I 3 × × P I n ) 1 n
where PI is the pollution index for each PTEs of each sample and n is the number of soil samples collected. According to Wei [37] and He [38], PLI is classified into six levels, as shown in Table 1.

2.3.4. Potential Ecological Risk Index

The potential ecological hazard index method was proposed by Swedish scientist Håkanson [34]. This method not only considers the content of PTEs but also the synergistic effect of multiple factors, toxicity level, pollution concentration, and environmental sensitivity to toxic elements. The potential ecological risk index (RI) is calculated by Equations (3)–(5):
R I = i n E j i
E j i = T n i × C j i
C j i C i / C n i
where C i is the measured concentration of metal i, C n i is the background value of metal i in Jilin Province [36], C j i is the pollution factor of metal i, E j i is the potential ecological risk index (RI) of a single metal, and T n i is the toxicity response factor of metal i. The toxic response factors for Cr, Ni, Cu, As, Zn, and Pb are 2, 6, 5, 10, 1, and 5, respectively [39]. The degree of ecological risk can be categorized, as shown in Table 1.

2.3.5. Heathy Risk Assessment

The model established by the U.S. Environmental Protection Agency was selected for human health risk assessment. The average daily dose of PTEs ingested by adults and children through three routes are calculated by the following Equations (6)–(8):
A D D i n g = C s o i l   ×   I n g R   ×   E F   ×   E D B W   ×   A T × 10 6
A D D i n h = C s o i l   ×   I n h R   ×   E F   ×   E D P E F   ×   B W   ×   A T
A D D d e r m a l = C s o i l × S A   ×   A F   ×   A B S   ×   E F   ×   E D B W   ×   A T × 10 6
where ADDing, ADDinh, and ADDdermal refer to the daily doses of metal absorbed through ingestion, inhalation, and dermal contact, respectively. Equations (6)–(8) were used for the calculation of non-cancer risks, whereas for carcinogens, the risks were calculated by the weighted average of resident exposure in children and adults, respectively, i.e., the lifetime average daily dose [40]. Calculation of the lifetime average daily dose of carcinogens entering the human body through three different paths are presented by Equations (9)–(11):
L A D D i n g = C s o i l   ×   E F A T   ×   [ ( I n g R   ×   E D B W ) c h i l d + ( I n g R   ×   E D B W ) a d u l t ]
L A D D i n h = C s o i l   ×   E F A T   ×   [ ( I n h R   ×   E D B W ) c h i l d + ( I n h R   ×   E D B W ) a d u l t ]
L A D D d e r m a l = C s o i l   ×   E F A T   ×   [ ( S A   ×   A F   ×   A B S   ×   E D B W ) c h i l d + ( S A   ×   A F   ×   A B S   ×   E D B W ) a d u l t ]
LADDing, LADDinh, and LADDdermal represent the lifetime average daily doses of ingestion, inhalation, and dermal contact, respectively. The parameter values involved in Equations (6)–(11) are listed in Table S1 (Supplementary materials).
Hazard quotient (HQ), hazard index (HI), and carcinogenic risk (CR) were used to assess the non-carcinogenic and cancer risks of PTEs to the human body. The HQ and HI are calculated by Equation (12), and the carcinogenic risk is calculated by Equations (13) and (14):
H I = H Q i = A D D i R f D i
C R   =   L A D D i   ×   S F i
T C R = i = 1 n C R
where the reference dose (RfD) refers to the maximum daily absorbed metal dose that will not cause harmful effects to children and adults. HQ is the sum of the ratio of the average daily dose to the reference dose under each exposure route, whereas HI is the sum of HQ. SF refers to the probability of daily occurrence of cancer per unit exposure; thus, the carcinogenic risk (CR) refers to the sum of the product of the lifetime average daily doses per exposure route and the probability of occurrence of cancer. The parameters involved in the formula are given in Table S2 (supplementary materials). If the average daily dose for each route is less than or equal to the corresponding reference dose, HQ ≤ 1, the considered metal under this route will not generate any non-carcinogenic risks to the human body. However, if ADDi > RfD, then HQ > 1, and it is likely that significant non-carcinogenic risks to the human body will be generated. Similarly, according to the further explanation of cancer risk range in the Regional Removal Management Levels (RMLs) User’s Guide by the U.S. Environmental Protection Agency in 2019 [41], CR less than 10−6 corresponds to very low estimated risk generated to human health. If 10−6 < CR < 10−4, estimated carcinogenic risk to the human body is acceptable risk range; however, if CR > 10−4, the human body has already suffered from a high estimated risk of cancer.

2.3.6. Statistical Analysis

SPSS 20 software (IBM, Armonk, NY, USA) and Excel 2013 were used for data analysis, and the figures were drawn using Origin 9.6 software (OriginLab, Hampton, MA, USA). ArcGIS 10.3 software (Esri, RedLands, CA, USA) was used for drawing the spatial distribution map of PTEs in the map. The kriging method was used for spatial distribution. Shi et al. [9] studied several spatial interpolation methods, including the inverse distance weighting (IDW), global/local polynomial interpolation (G/LPI), radial basis function (RBF), and kriging methods to obtain optimal results. They found that the kriging method exhibited better performance than the other methods. The kriging method can display the changes in space, output various maps, and minimize the errors of predicted values. In addition, kriging also showed great flexibility in other aspects and allows users to investigate spatial autocorrelation maps. Because the data did not conform to normal distribution, Minitab 17 software (State College, PA, USA) was used to perform the Box–Cox transformation of the data before the kriging method was applied. When identifying the sources of PTEs in the study area, FA and CA were adopted, and the cluster heat map of PTEs was drawn by Origin 9.6 software, which was used to compare with the FA results.

3. Results and Discussion

3.1. Concentration of PTEs

The concentrations of PTEs in three different land use types in the study area are listed in Table 2. The concentrations of As, Cr, Ni, Cu, Zn, and Pb were 0.4–70.6, 31–195.8, 0.2–55.6, 4–117.2, 18.4–802.2, and 0.2–273.2 mg/kg, respectively. Compared with the secondary standard of soil environmental quality in China [42], Pb in residential land did not exceed the standard value, whereas for Zn, 29 sites (50.88%) did exceed the standard value. In addition, compared with the secondary standard, for Ni, As, and Zn, four (16.67%), six (25%), and 20 (83.33%) sites, respectively, in industrial land exceeded the standard. Farmland was compared with the newly issued agricultural land soil pollution risk control standard (for trial implementation) [43]; results showed that Ni and Pb did not exceed the standard, only one site (3.23%) exceeded the standard for As and Cr, 2 sites (6.45%) for Cu, and for Zn, 27 sites (87.10%) exceeded the standard. Compared with the soil background values in Jilin Province [36], six PTEs in the three land use types all exceeded the corresponding background values. Specifically, under the three land use types, the amount of Cu, Ni, and Pb exceeding the background value was below 50%, whereas As, Cr, and Zn exhibited values greater than 50%, decreasing in the order of Zn > Cr > As.
The coefficient of variation is the ratio of the standard deviation to the average value of the obtained data. The coefficient of variation of the six metals had a descending order of Pb (191%) > Cu (96%) > As (90%) > Ni (81%) > Zn (66%) > Cr (43%). Among them, Pb exhibited a concentration that ranged from 0.2 to 273.2 mg/kg. The concentration varied greatly, and the coefficient of variation was greater than 100%, which indicated that Pb in the study area was very uneven compared with the five other PTEs; thus, it was very likely that human activity was responsible for the variation [44]. The coefficients of variation of Cu, As, Ni, and Zn are higher than 50%, showing high variability, which indicated that the concentrations of these four metals in the studied area reflect significant differences.
Judging from the concentration value of PTEs, the concentration level of the six PTEs in the study area was medium, and the soil in the study area faced pollution caused by the three metals—Zn, Cr, and As. Compared with the large heavy industrial cities listed in Table S3 and the cities with very dense population, such as Beijing, Shanghai, and Wuhan, the concentration of the study area was much lower, equivalent to that of medium industrial cities. Tonghua exhibited a medium population density and lower intensity of industrial activity than large heavy industry cities. As Tonghua City Iron and Steel Co., Ltd., established in 1958 with industrial activities having started earlier, is located in Tonghua, the observed pollution levels of Zn, Cr, and As were expected.

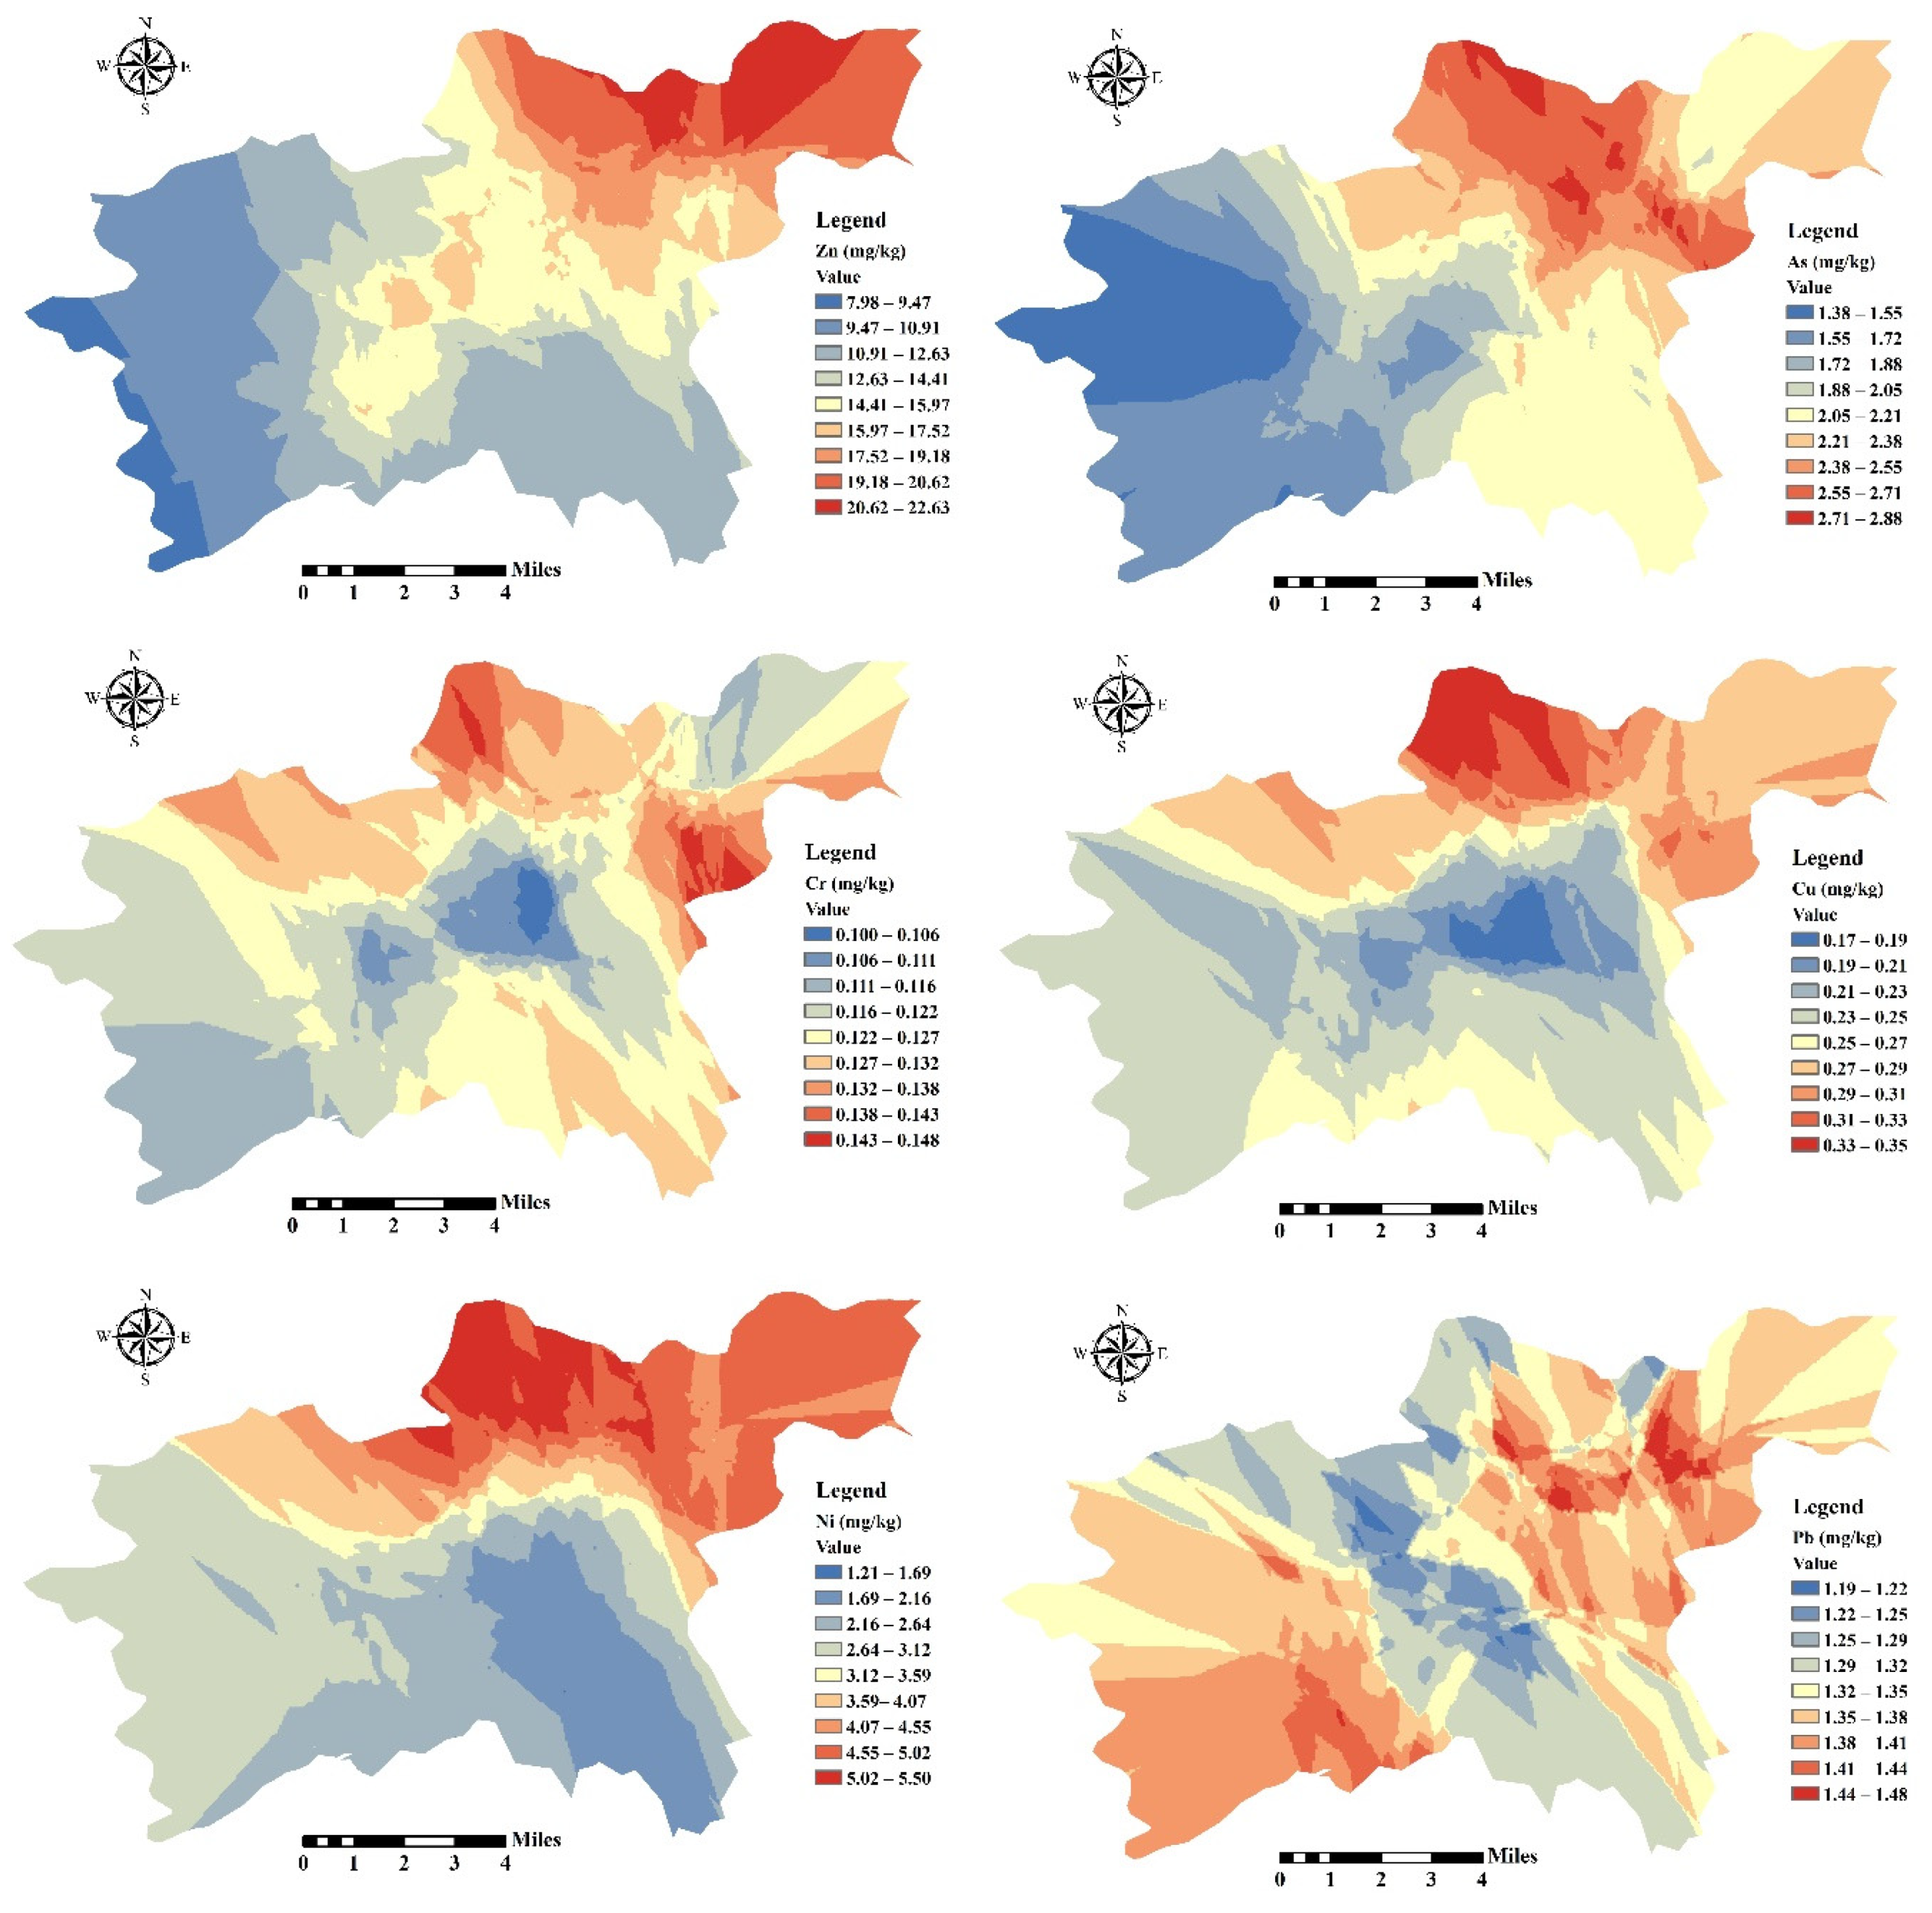
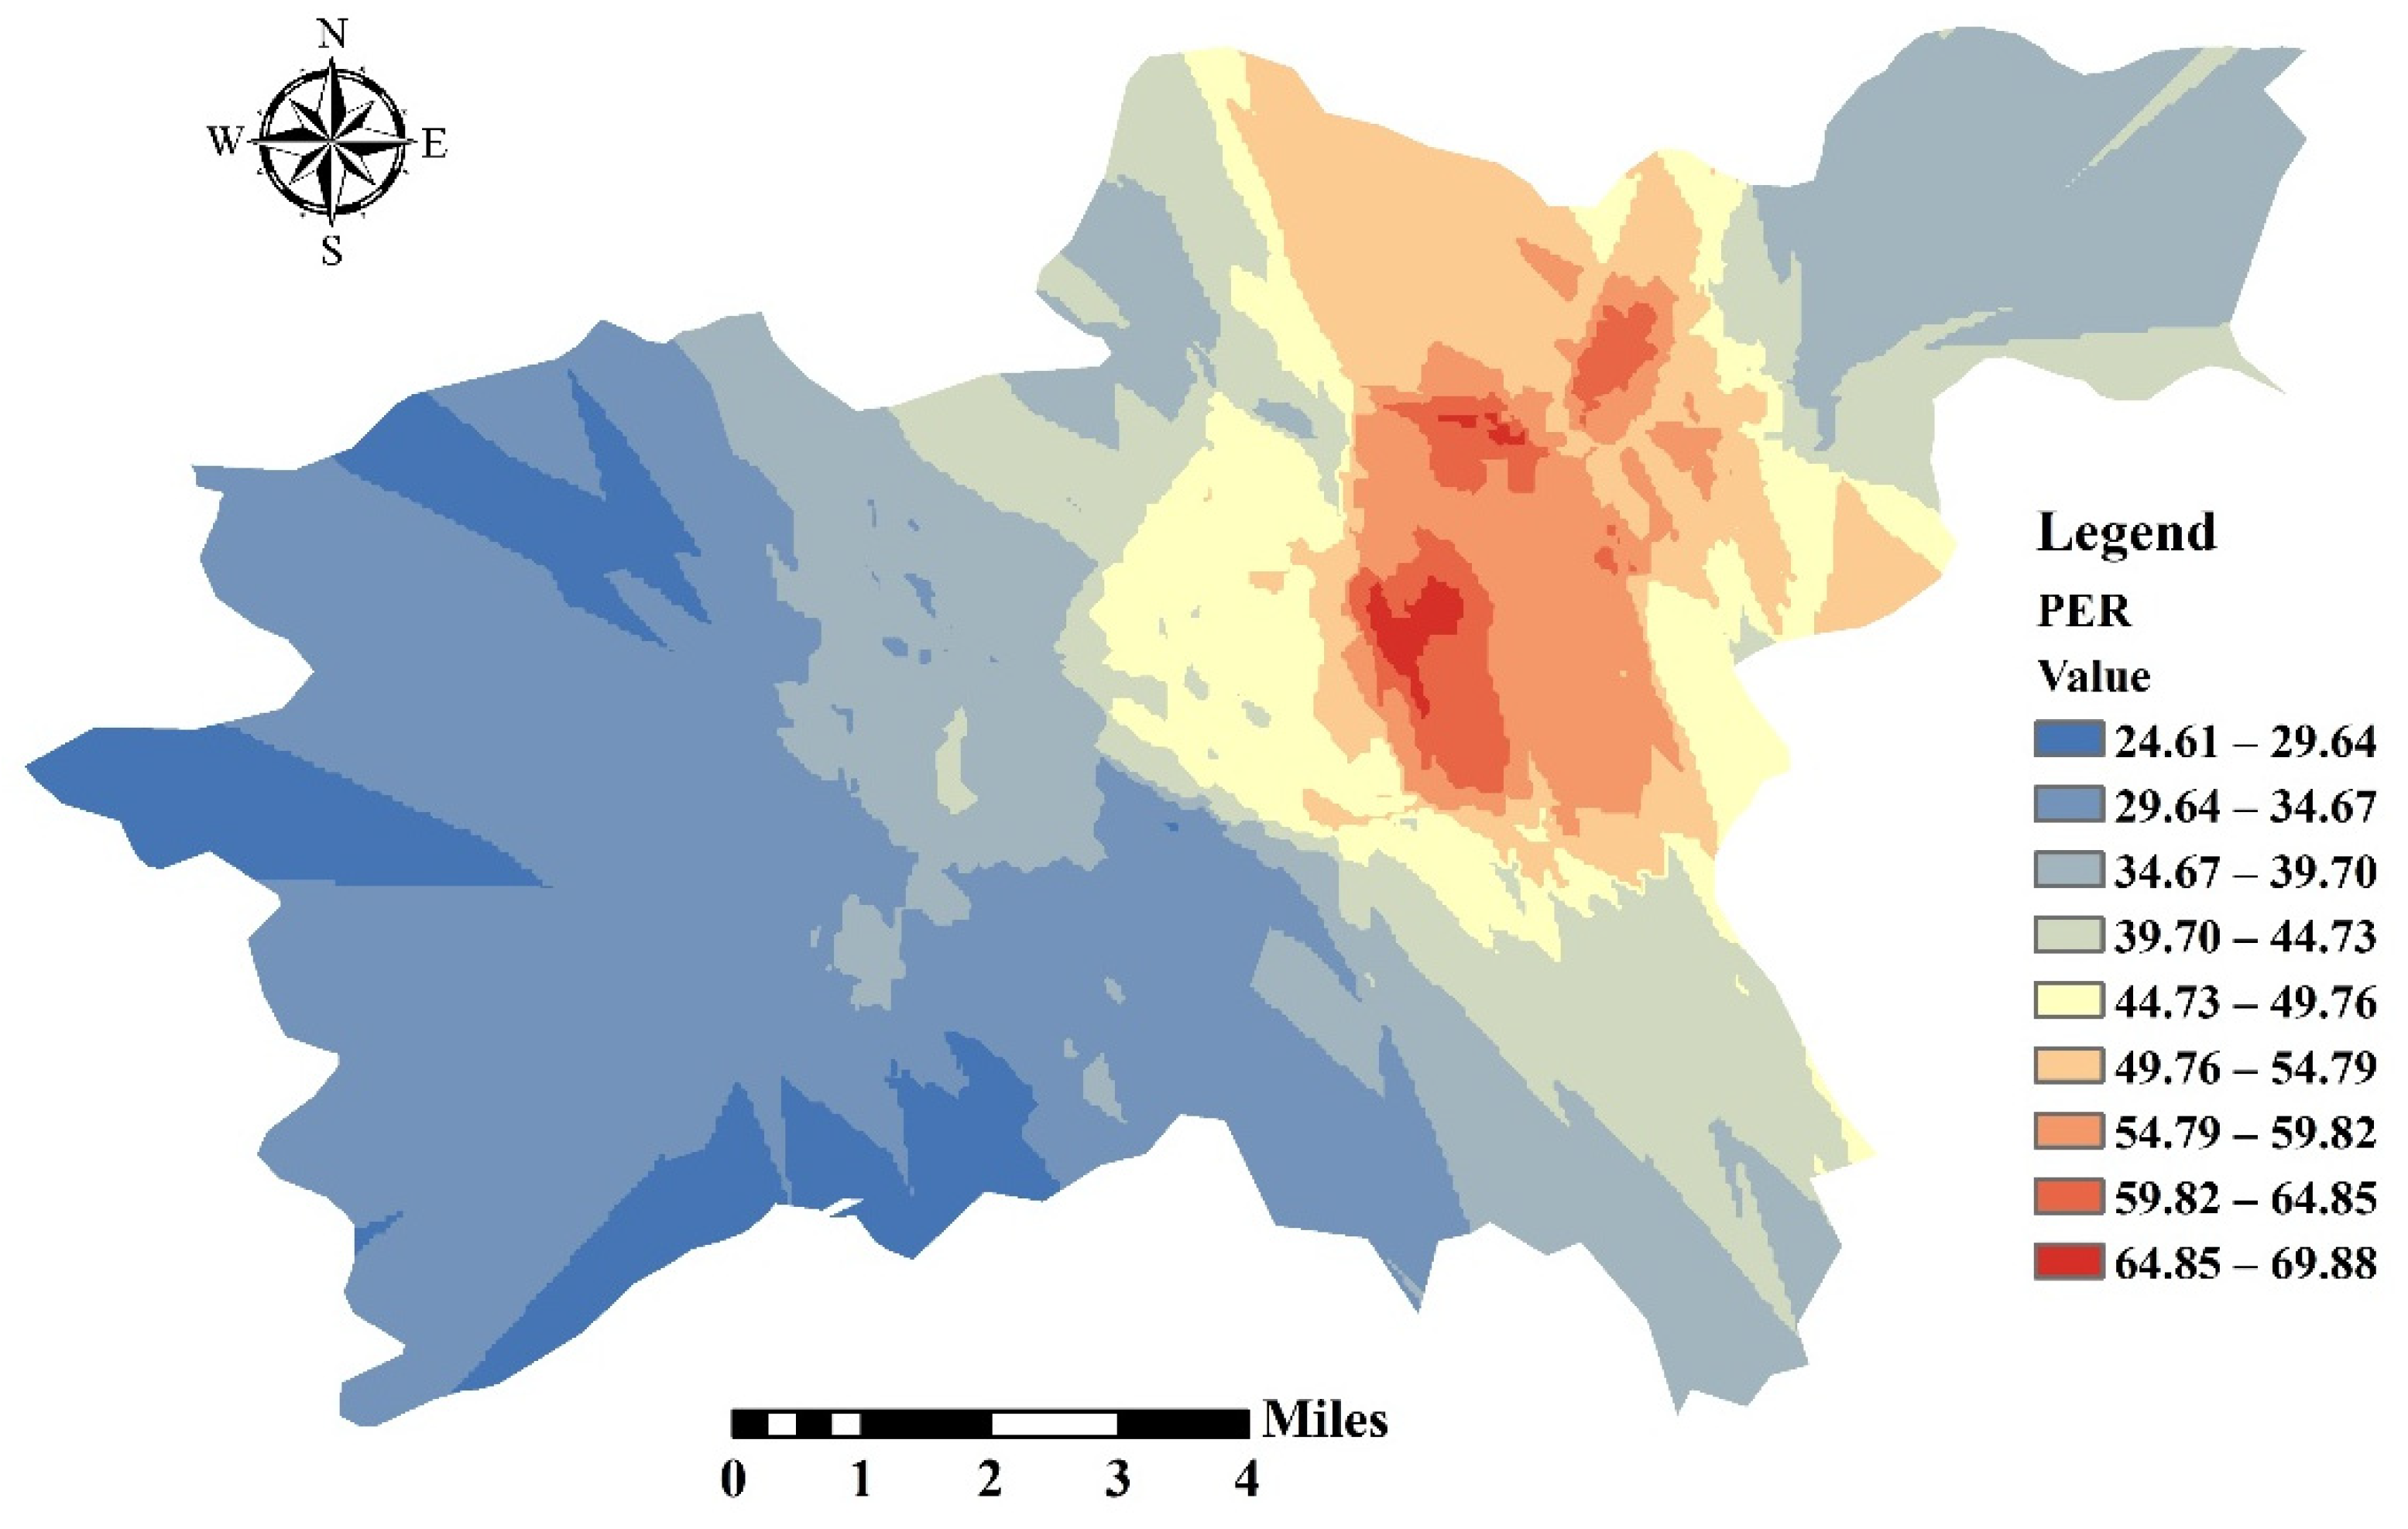
3.2. Spatial Distribution of PTEs

The spatial distribution patterns of the six PTEs in the study area are represented in Figure 2, in which red stands for high concentration and blue represents low concentration. Zn, Ni, Cu, Cr, and As all exhibited similar spatial distribution trends, with the distribution of the five metals concentrated in the northeast region of the study area and the concentrations of the other metals, except Cr, relatively low in the southwest, which may be related to the presence of the iron and steel plant in the northeast part of the study area. The largest and long-running steel manufacturing company in Jilin Province is located in the Erdaojiang district. Dust containing various metals is produced in the steel production process and falls on the nearby soil surface under the action of wind force, accumulating in the soil along with precipitation and other substances. Cr differed from the four metals, exhibiting a higher concentration distribution in the southwestern portion of the study area. Nevertheless, the distribution of Pb was not quite consistent with those of five metals, as Pb had a different distribution pattern with hotspots in the northeast and southwest regions of the study area. For this reason, the source of Pb may not be like those of the other five elements, which will result in a spatial distribution that is different from those of the other elements.

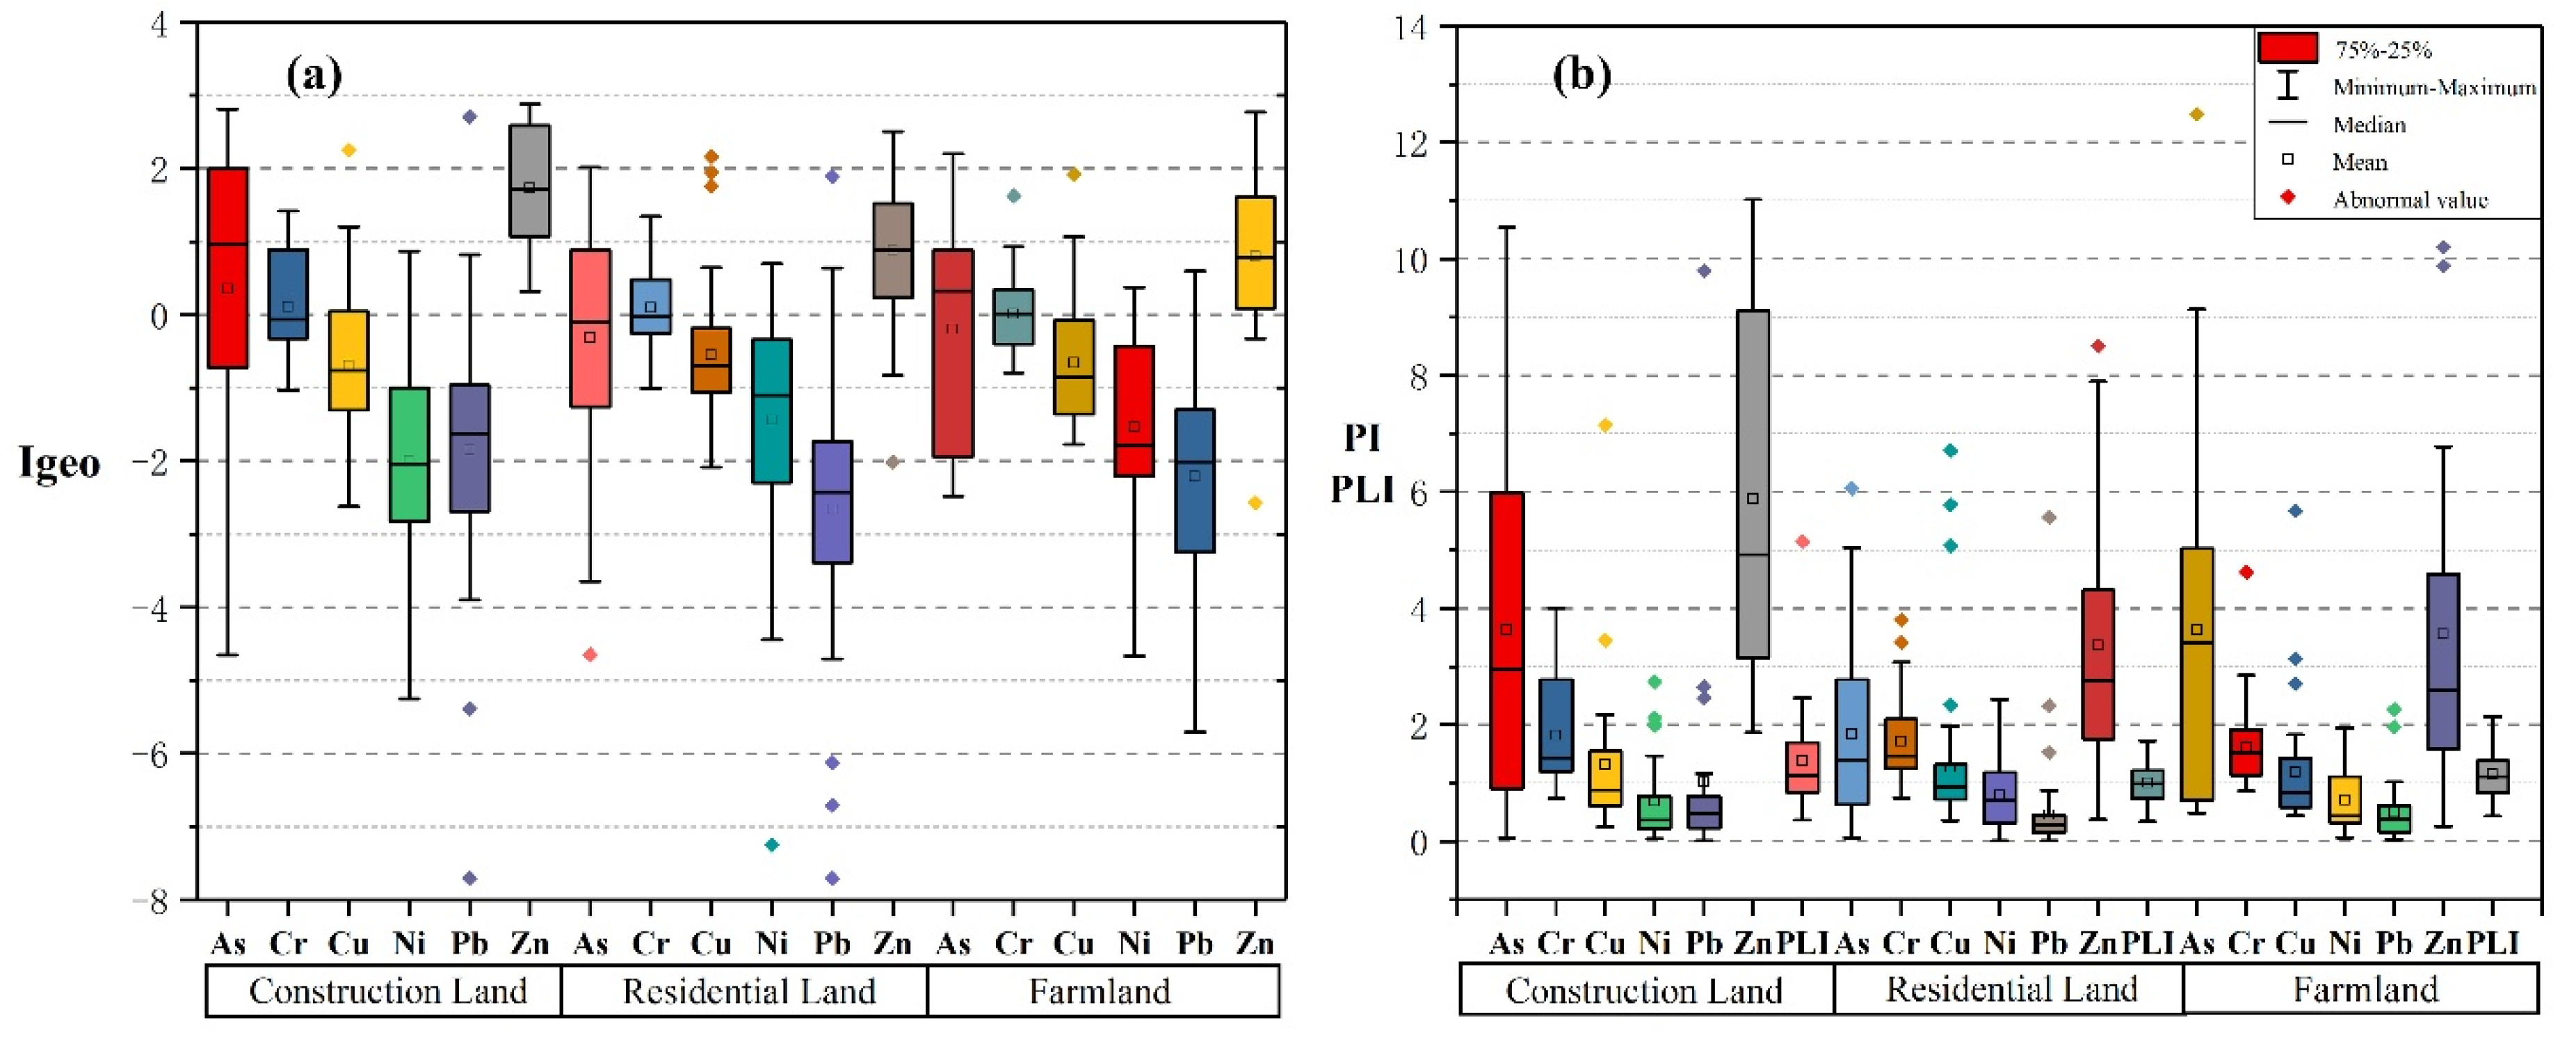
3.3. Pollution Assessment of PTEs

Igeo values of PTEs in industrial land and farmland soil decreased in the order of Zn > As > Cr > Cu > Ni > Pb, whereas those in residential land decreased in the order of Zn > Cr > As > Cu > Ni > Pb. Industrial land, residential land, and farmland exhibited Igeo values of Zn in the range of 1–3 of 79.17%, 47.37%, and 45.16%, respectively, and the pollution was moderate or moderate to severe. Zn pollution was serious in the research area, suggesting that Zn content originated from parent material and from human input. The spatial distribution map of Zn showed that the main source of Zn may be related to production from iron and steel plants. In addition, 50% of As in industrial land was within 1–2, indicating that the pollution of As in industrial land was also relatively serious. Approximately 50% of As in residential land and farmland was also in the range of 0–3, indicating that As also has slight pollution in these two land use types but at a smaller potentially harmful degree than found in the industrial cities. Notably, 51.61% of Cr in farmland was in the range of 0–2, which was higher than the other two types of land use. Almost no Cu, Ni, or Pb exceeded zero, indicating that the study area had not been polluted by these three metals.
The PI calculated according to the soil background value of Jilin province is shown in Figure 3b. The results show that the PI average of Ni and Pb in residential land and farmland was less than 1, whereas the average of Ni in industrial land was less than 1. This demonstrated that the three land use types were not polluted by Ni, and the residential land and farmland were not polluted by Pb. Specifically, the PI average values of Zn, As, Cr, Cu, and Pb in industrial land were 5.88, 3.63, 1.81, 1.31, and 1.01, respectively, the average values of Zn, As, Cr, and Cu in farmland were 3.56, 3.63, 1.62, and 1.19, respectively, and the average values of Zn, As, Cr, and Cu in residential land were 3.36, 1.84, 1.71, and 1.26, respectively. The above results showed that Zn and As had reached high pollution levels under the three land use types. Compared with other studies, the enrichment factor and pollution factor results of As in the Islam et al. study [11] showed that As had reached a very high pollution level. The research results of Mohammadi et al. on Iran’s industrial zone [24] also showed that As has reached a high pollution level. Meanwhile, consistent with the results of the iron and steel industrial zone in Anshan city in northeast China [45] and Russian smelters [23], Zn pollution has reached a high pollution level.
On this basis, the PLI values of the different land use types were calculated in order to comprehensively evaluate the pollution of PTEs in the soil in the study area. The three types of land use have reached a moderate pollution level, decreasing in the order of industrial land (1.38) > farmland (1.15) > residential land (1.00). It was worth noting that 20.83% of the soil in industrial land and 9.68% in farmland have reached the level of serious pollution. In summary, the soil in the study area was at a moderate pollution level.

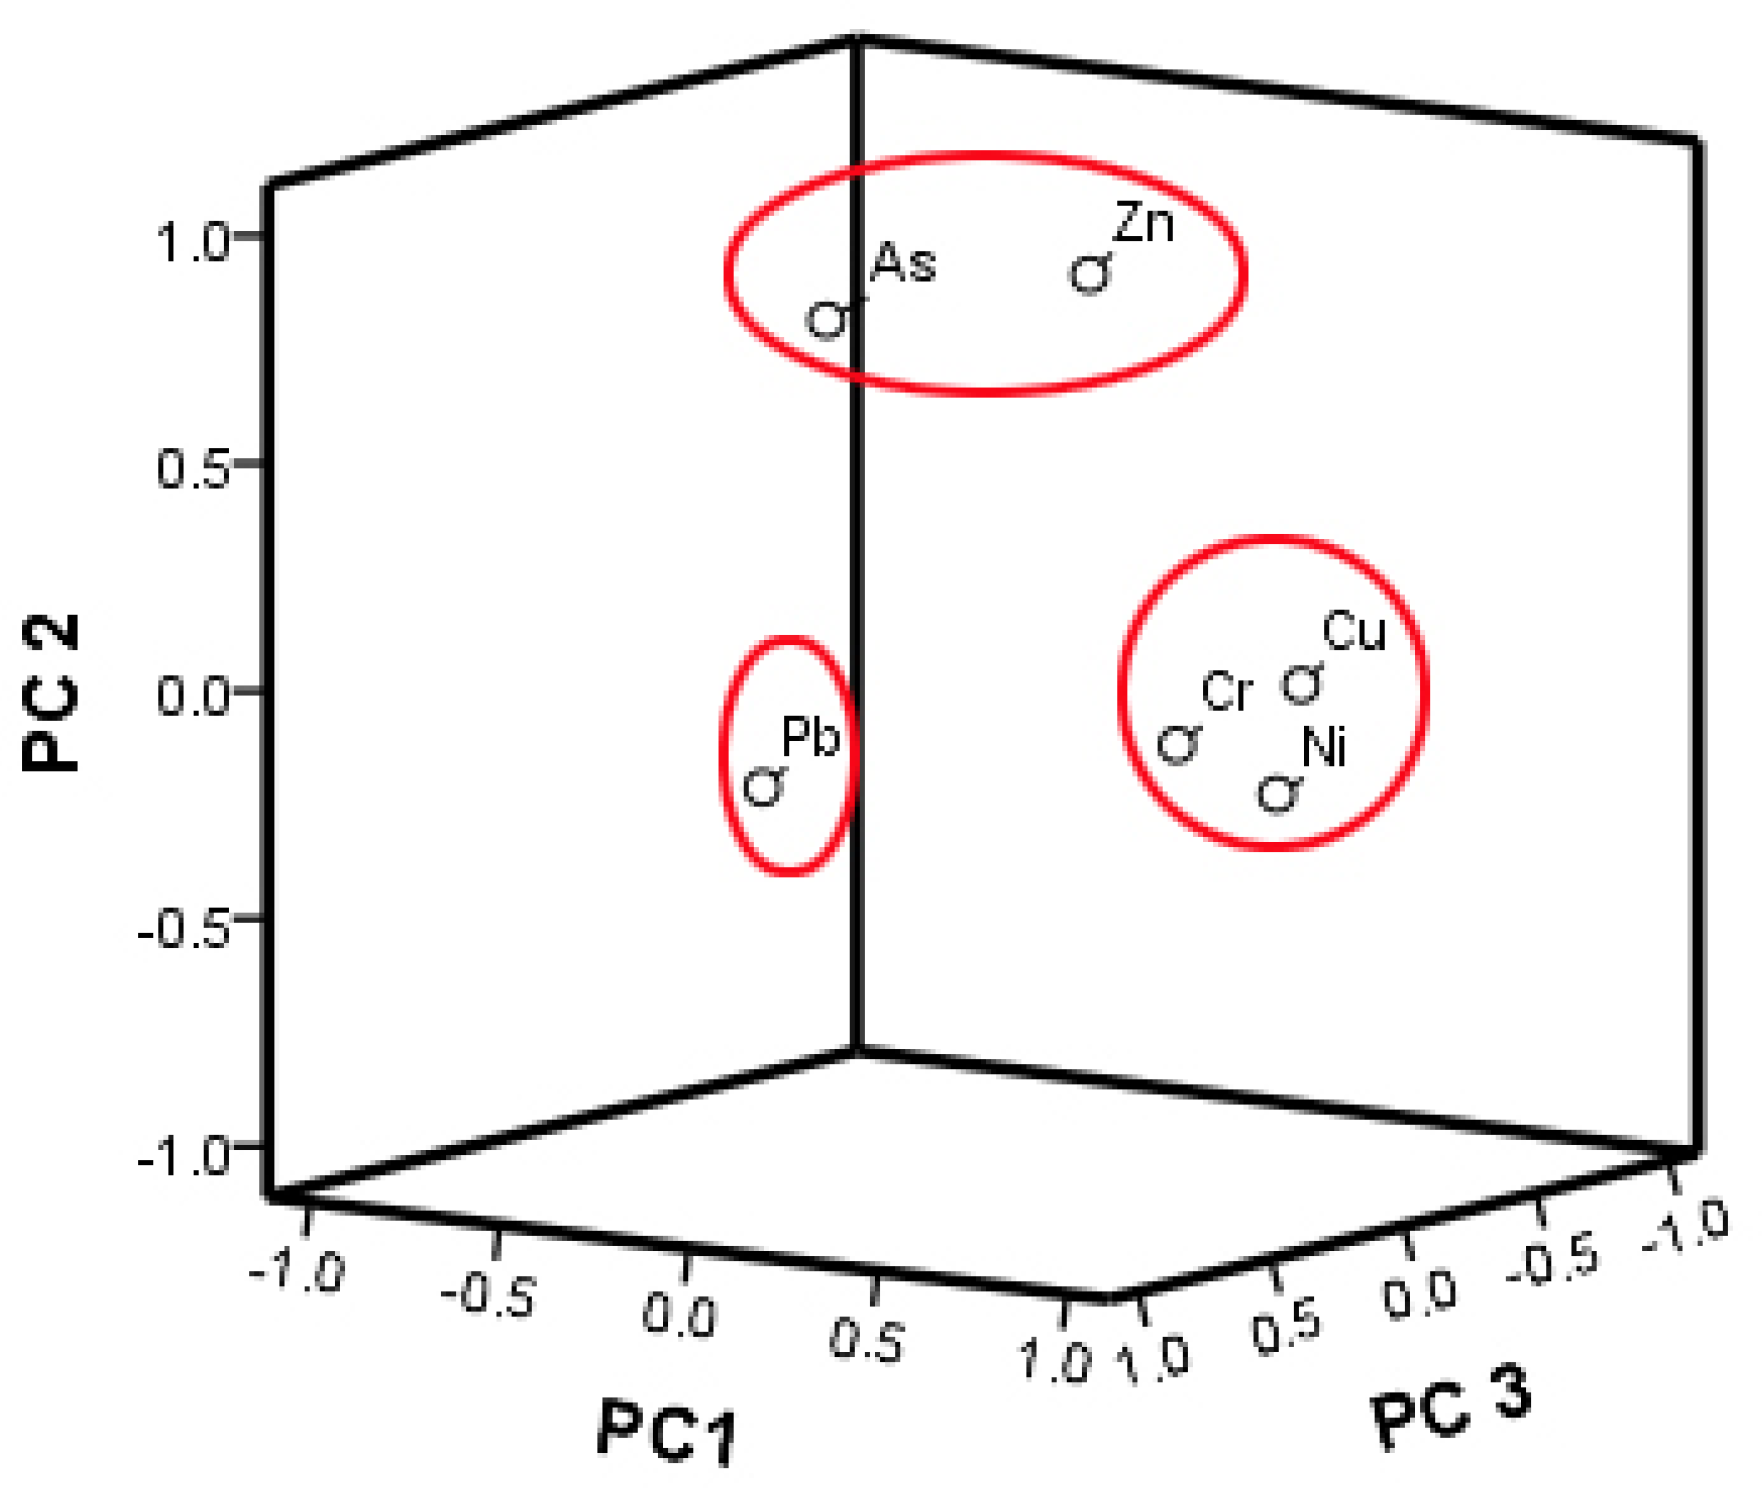
3.4. Source Identification of PTEs

FA and CA were used to identify the sources of PTEs in the soil of the study area. On the premise that the cumulative variance is 100.0%, six principal factors were obtained, and the cumulative contribution of the three principal factors extracted before and after rotation was 71.3%. The first principal factor after rotation included Cr, Ni, and Cu, which explained 31.8% of variance after rotation (Table 3). The second main factor mainly included Zn and As, with variance values of 0.847 and 0.738, respectively. The third principal factor included metals such as Pb and Cr; however, the variance of Pb was the maximum loading, reaching 0.952. Six PTEs had significantly higher variance for the three main causes (Figure 4), which indicated that these PTEs have different sources. Next, the sources of PTEs would be discussed according to the mean concentration of PTEs, pollution level, and spatial distribution obtained in this study.

PC1: Cr, Cu, Ni

Cr and Ni in the first principal component (PC1) was demonstrated to be derived from parent material and lithogenic sources in many studies [8,21,46]. However, as opposed to other studies [3,5,15,47], Cu in this study was not deemed to have an anthropogenic source; our results are consistent with those of Tian et al. [48]. The results of FA showed that Cu did not belong to the second principal component (PC2) but was a group with Cr and Ni in PC1. First of all, the mean concentrations of the three metals did not exceed the national soil environmental quality standards [42]; Ni did not even exceed the background value of the soil concentration in Jilin province [36]. However, Cr did exceed the background values of China (61.0 mg/kg). The spatial distribution patterns of Cu, Ni, and Cr were basically identical. Compared with the other two metals, Cr was enriched in the southeastern section of the study area, where building material factories and vehicle exhaust release some of the Cr in the electroplating process [47]. The rotated composition matrix showed that Cr contributed to all three factors, as Cr was a material used in the process of manufacturing automobile parts, and the decomposition of parts and components as well as tires during the use of the automobile releases Cr metal into the environment [49]. Thus, the enrichment of Cr was partly due to human factors. Cu and Ni in PC1 could be summarized as having natural sources, whereas Cr had a mixture of natural and artificial sources.

PC2: As, Zn

As and Zn were probably primarily from anthropogenic sources. The mean concentrations of the two metals exceeded the background value of the soil concentration in Jilin [36], and Zn even exceeded China’s secondary soil quality standard [42]. The evaluation results of Igeo and PLI also showed that the research area encountered serious Zn pollution and moderate As pollution. Similar spatial distribution maps of As and Zn demonstrated that these two metals were highly enriched around the steel plant. During the production activities of the steel plants, Zn pollutes the soil nearby with the emission of aerosol and dust [50]. In their respective studies, Shen [51] and Sun [8] also concluded that industrial practices would cause Zn pollution in the nearby soil. In addition, according to Tian’s research, the total As emission from coal-fired power plants nationwide reached 550 tons in 2007 [52]. Because the sampling time was just after heating in northeast China, coal-derived As from the atmosphere also settled on the surface of the soil. Some surveys reveal that Chinese coal contains a higher content of As than coal from other countries [3]. Therefore, PC2 was impacted by coal combustion and emissions from industrial activities.

PC3: Pb

Although the mean concentration of Pb was low and the results of the pollution assessment showed that no Pb pollution had been demonstrated in the study area, the variance of Pb in PC3 was the highest among the six PTEs, and the concentration range and coefficient of variation of Pb were both large, which indicated that human factors were most likely the cause [53]. The southwestern and northeastern regions of the study area are densely populated areas with heavy traffic; the spatial distribution map showed that Pb was significantly enriched in these two areas. Pb was the main traffic token [54], as Pb is released from the tail gas emissions after gasoline combustion, and the wear on automobile engines during braking and the use of catalysts produce lead emissions [55,56,57]. Once all cars used leaded gasoline. Since the Pb ban in gasoline was enacted, Pb has accumulated in the soil for decades, and the erosion of urban facilities and paint also release Pb into the environment [58]. Therefore, interpreting PC3 as traffic emission has a very strong basis.
Using matrix CA, cluster heat maps were drawn with the six PTEs as the x-axis and color from light to deep to represent the concentration from low to high, as shown in Figure 5. The results show consistency with that of FA. Six PTEs were divided into three groups, with Pb as a separate group, Cr, Ni, and Cu constituting a group, and Zn and As making up a group. Using these two methods, the three main sources of PTEs pollution were revealed, and the sources of PTEs in the study area were confirmed by combination with the spatial distribution maps of the six metals. On the whole, factors 2 and 3 both represented anthropogenic sources and explained 39.6% of the total accumulation, indicating that most of the PTEs in the study area come from anthropogenic influences. Therefore, controlling human activity is an effective means to reduce soil PTEs pollution from the source.

3.5. Potential Ecological Risk Assessment

The average potential ecological risk (PER) of the three types of land use was arranged in the order of industrial land (61.55) > farmland (55.65) > residential land (38.53), of which industrial land and farmland exceed a value of 40, reaching the moderate risk grade. In addition to As, the average potential ecological risks of the other five elements in the three land use types were less than 10. For industrial land, residential land, and farmland, 33.33%, 14.04%, and 41.94% of As exhibited PER values greater than 40, respectively, reaching the pollution level above moderate risk. In summary, the ecological risk caused by industrial land was the most serious, and the ecological risk to the research area was only caused by As.
Regardless of the different land use types, comprehensive consideration should be given to the overall soil environment in the study area, as its PER value ranged from 16.09 to 129.43, with an average value of 43.16. For the study area, 46.43% exceeded a PER value of 40, indicating that the overall ecological risk in the study area was at a moderate level, mainly due to the contribution of As. The distribution of the PERs in the study area is shown in Figure 6. Ecological risks showed a decreasing trend from the middle to both sides, and the eastern part of the center presented the highest ecological risks. It can be argued that the long-term operation of a celebrated steel factory was the primary reason for this scenario.

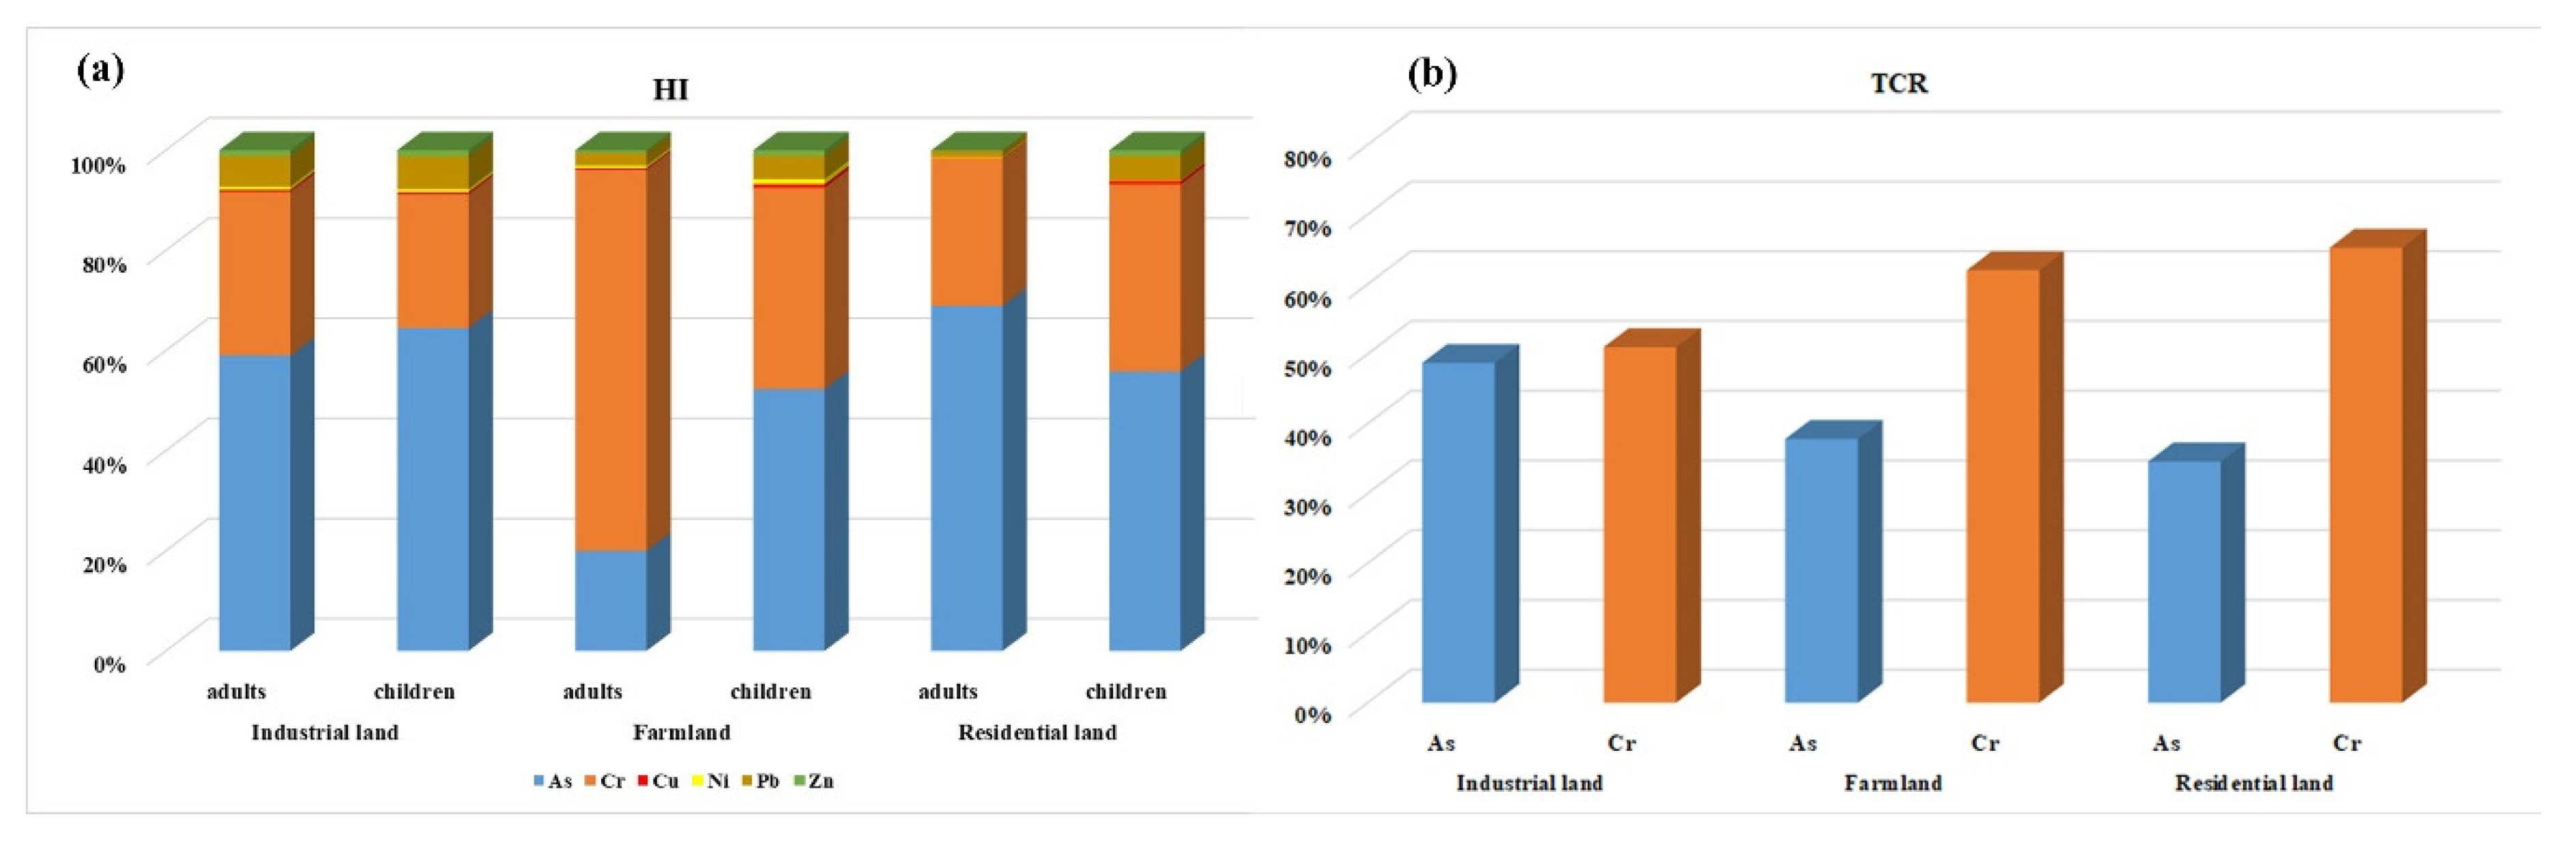
3.6. Human Health Risk Assessment

The non-carcinogenic risk values of PTEs to adults and children in the three land use types are summarized in Figure 7a and Table 4. No matter which result is exhibited, children consistently face higher non-carcinogenic risks than adults due to pica behavior, which has been mentioned in many studies [59]. The HI values of adults and children in the three land use types decreased in the order of farmland > residential land > industrial land. The most important contribution to adults and children in farmland and industrial land was ingestion, whereas the most important contribution in residential land was dermal contact.
Irrespective of land use, the largest contribution to non-carcinogenic risk to children was ingestion, accounting for 96.7%. Although many studies have shown that HQing was the main contribution route to the non-carcinogenic risks of children and adults [60,61,62], in this study, the contribution of the three routes to adults was different from that to children. The largest contribution route to adults was dermal contact, accounting for 71.1%, which was mainly on account of the contribution of HQdermal of Cr. The HI values of PTEs to adults were Cr > As > Pb > Zn > Ni > Cu from high to low, whereas for children, they were As > Cr > Pb > Zn > Ni > Cu. HI values of all PTEs were less than 1, which indicated that the six PTEs in the study area did not cause non-carcinogenic risks to children and adults in the study area.
Because Cu and Zn were not in the carcinogenic category, this study estimated the carcinogenic risks of the other four metals (Table 5), and found the contribution of Ni and Pb to estimated carcinogenic risk was almost zero; only the contribution of As and Cr are shown in Figure 7b. In the three types of land use, the CR value and total carcinogenic risk (TCR) values of Ni and Pb were less than the threshold value (10−4), indicating that these two elements exhibit almost no estimated carcinogenic risk to human health. On the contrary, the TCR values of Cr in the three land use types all exceeded the threshold (10−4), which indicated that Cr causes a high estimated cancer risk to residents. Moreover, ingestion was the most important manner in which Cr contributed to TCR. The TCR value of As in the soil of industrial land was also greater than the threshold value (10−4), indicating that of the three land use types, only As in the industrial zone caused high estimated carcinogenic risk. Among the three types of land use, the CR value of As decreased in the order of ingestion > dermal contact > inhalation.

4. Conclusions

In this study, pollution assessment, spatial distribution analysis, source analysis, and environmental risk assessment of six metals under three different land use types in a typical industrial city in northeast China (Tonghua City) were carried out. The average concentration of PTEs were found in decreasing order of industrial land > farmland > residential land, and the concentrations of Zn, Cr, and As were found to be higher. The results of the pollution assessment illustrated that Zn pollution carried the greatest health risk in the entire soil environment of the study area, and the pollution of As in industrial land and Cr in farmland also deserve considerable attention. The results of FA and CA showed that As and Zn from factor 2 came directly from industrial production activities and coal combustion, Pb from factor 3 was derived from vehicle emissions, Cu, Ni, and Cr from factor 1 originated from natural parent materials, and some Cr came from human sources. In the environmental risk assessment, with the exception of As, the other five elements did not show any contribution to the ecological risk. Overall, the ecological risk in the study area was at a moderate pollution level. Farmland produced the highest HI value to children, whereas As exhibited the highest non-carcinogenic risk to children among PTEs. However, the above corresponding values were all less than 1, indicating that human health in the study area was not facing non-carcinogenic risks. Residents in the three land use types should pay attention to the high estimated cancer risk caused by Cr and As in industrial land. Ingestion was the most important contribution to the high estimated cancer risk of Cr and As. These results indicated that local government should take the necessary measures for different land use types to avoid serious harm to local residents resulting from PTEs in the soil.

Supplementary Materials

The following are available online at https://www.mdpi.com/2071-1050/12/5/2121/s1, Table S1: Parameters and input assumptions for the health risk assessment, Table S2: Values of RfD (mg/kg/day) and SF (per mg/kg/day) for six toxic elements, Table S3: Average concentrations of heavy metals in soil from different regions.

Author Contributions

Data curation, Q.X. and Q.M.; Formal analysis, Q.X.; Investigation, Q.X., J.P. and G.R.; Methodology, Z.T. and X.L.; Resources, J.Z.; Supervision, J.Z.; Validation, J.Z.; Visualization, Q.X.; Writing—original draft, Q.X.; Writing—review & editing, Y.C. All authors have read and agreed to the published version of the manuscript.

Funding

This research was funded by the Key Scientific and Technology Research and Development Program of Jilin Province (20190303081SF); the Science and Technology Development Plan projects of Jilin Province (20180201033SF), and the Science and Technology Development Plan projects of Jilin Province (20170204035SF).

Acknowledgments

The authors are grateful to the time and insightful comments made by the anonymous reviewers to improve the quality of the manuscript.

Conflicts of Interest

The authors declare no conflict of interest.

References

  1. Li, X.Y.; Liu, L.J.; Wang, Y.G.; Luo, G.P.; Chen, X.; Yang, X.L.; Hall, M.H.P.; Guo, R.C.; Wang, H.J.; Cui, J.H.; et al. Heavy metal contamination of urban soil in an old industrial city (Shenyang) in Northeast China. Geoderma 2013, 192, 50–58. [Google Scholar] [CrossRef]
  2. Zhao, L.; Xu, Y.F.; Hou, H.; Shangguan, Y.X.; Li, F.S. Source identification and health risk assessment of metals in urban soils around the Tanggu chemical industrial district, Tianjin, China. Sci. Total Environ. 2014, 468–469, 654–662. [Google Scholar] [CrossRef] [PubMed]
  3. Liang, J.; Feng, C.T.; Zeng, G.M.; Gao, X.; Zhong, M.Z.; Li, X.D.; Li, X.; He, X.Y.; Fang, Y.L. Spatial distribution and source identification of heavy metals in surface soils in a typical coal mine city, Lianyuan, China. Environ. Pollut. 2017, 225, 681–690. [Google Scholar] [CrossRef] [PubMed]
  4. Wang, S.; Cai, L.M.; Wen, H.H.; Luo, J.; Wang, Q.S.; Liu, X. Spatial distribution and source apportionment of heavy metals in soil from a typical county-level city of Guangdong Province, China. Sci. Total Environ. 2019, 655, 92–101. [Google Scholar] [CrossRef] [PubMed]
  5. Lü, J.; Jiao, W.B.; Qiu, H.; Chen, B.; Huang, X.X.; Kang, B. Origin and spatial distribution of heavy metals and carcinogenic risk assessment in mining areas at You’xi County southeast China. Geoderma 2018, 310, 99–106. [Google Scholar] [CrossRef]
  6. Cai, L.M.; Wang, Q.S.; Luo, J.; Chen, L.G.; Zhu, R.L.; Wang, S.; Tang, C.H. Heavy metal contamination and health risk assessment for children near a large Cu-smelter in central China. Sci. Total Environ. 2019, 650, 725–733. [Google Scholar] [CrossRef]
  7. Mingkhwan, R.; Worakhunpiset, S. Heavy metal contamination near industrial estate areas in Phra Nakhon Si Ayutthaya Province, Thailand and human health risk assessment. Int. J. Environ. Res. Public Health 2018, 15, 1890. [Google Scholar] [CrossRef] [Green Version]
  8. Sun, L.; Guo, D.K.; Liu, K.; Meng, H.; Zheng, Y.J.; Yuan, F.Q.; Zhu, G.H. Levels, sources, and spatial distribution of heavy metals in soils from a typical coal industrial city of Tangshan, China. Catena 2019, 175, 101–109. [Google Scholar] [CrossRef]
  9. Shi, G.T.; Chen, Z.L.; Xu, S.Y.; Zhang, J.; Wang, L.; Bi, C.J.; Teng, J.Y. Potentially toxic metal contamination of urban soils and roadside dust in Shanghai, China. Environ. Pollut. 2008, 156, 251–260. [Google Scholar] [CrossRef]
  10. Gu, Y.G.; Gao, Y.P.; Lin, Q. Contamination, bioaccessibility and human health risk of heavy metals in exposed-lawn soils from 28 urban parks in southern China’s largest city, Guangzhou. Appl. Geochem. 2016, 67, 52–58. [Google Scholar] [CrossRef]
  11. Islam, S.; Ahmed, K.; Habibullah, A.M.; Masunaga, S. Potential ecological risk of hazardous elements in different land-use urban soils of Bangladesh. Sci. Total Environ. 2015, 512–513, 94–102. [Google Scholar] [CrossRef] [PubMed]
  12. Khan, M.A.; Khan, S.; Khan, A.; Alam, M. Soil contamination with cadmium, consequences and remediation using organic amendments. Sci. Total Environ. 2017, 601–602, 1591–1605. [Google Scholar] [CrossRef] [PubMed]
  13. Zhang, X.W.; Yang, L.S.; Li, Y.H.; Li, H.R.; Wang, W.Y.; Ye, B.X. Impacts of lead/zinc mining and smelting on the environment and human health in China. Environ. Monit. Assess. 2012, 184, 2261–2273. [Google Scholar] [CrossRef] [PubMed]
  14. Cai, K.; Li, C.; Song, Z.F.; Gao, X.; Wu, M.X. Pollution and health risk assessment of carcinogenic elements As, Cd, and Cr in multiple media—A case of a sustainable farming area in China. Sustainability 2019, 11, 5208. [Google Scholar] [CrossRef] [Green Version]
  15. Li, F.X.; Zhang, J.Q.; Cao, T.H.; Li, S.J.; Chen, Y.N.; Liang, X.H.; Zhao, X.; Chen, J.W. Human health risk assessment of toxic elements in farmland topsoil with source identification in Jilin Province, China. Int. J. Environ. Res. Public Health 2018, 15, 1040. [Google Scholar] [CrossRef] [PubMed] [Green Version]
  16. Peng, J.Y.; Li, F.X.; Zhang, J.Q.; Chen, Y.N.; Cao, T.H.; Tong, Z.J.; Liu, X.P.; Liang, X.H.; Zhao, X. Comprehensive assessment of heavy metals pollution of farmland soil and crops in Jilin Province. Environ. Geochem. Health 2019. [Google Scholar] [CrossRef]
  17. Adimalla, N.; Qian, H.; Wang, H. Assessment of heavy metal (HM) contamination in agricultural soil lands in northern Telangana, India: An approach of spatial distribution and multivariate statistical analysis. Environ. Monit. Assess. 2019, 191. [Google Scholar] [CrossRef]
  18. Doabi, S.A.; Karami, M.; Afyuni, M.; Yeganeh, M. Pollution and health risk assessment of heavy metals in agricultural soil, atmospheric dust and major food crops in Kermanshah province, Iran. Ecotoxicol. Environ. Saf. 2018, 163, 153–164. [Google Scholar] [CrossRef]
  19. Li, Z.Y.; Ma, Z.W.; van der Kuijp, T.J.; Yuan, Z.W.; Huang, L. A review of soil heavy metal pollution from mines in China: Pollution and health risk assessment. Sci. Total Environ. 2014, 468–469, 843–853. [Google Scholar] [CrossRef]
  20. Yadav, I.C.; Devi, N.L.; Singh, V.K.; Li, J.; Zhang, G. Spatial distribution, source analysis, and health risk assessment of heavy metals contamination in house dust and surface soil from four major cities of Nepal. Chemosphere 2019, 218, 1100–1113. [Google Scholar] [CrossRef]
  21. Jiang, H.H.; Cai, L.M.; Wen, H.H.; Hu, G.C.; Chen, L.G.; Luo, J. An integrated approach to quantifying ecological and human health risks from different sources of soil heavy metals. Sci. Total Environ. 2019. [Google Scholar] [CrossRef]
  22. Wang, N.; Han, J.; Wei, Y.; Li, G.; Sun, Y. Potential ecological risk and health risk assessment of heavy metals and metalloid in soil around Xunyang mining areas. Sustainability 2019, 11, 4828. [Google Scholar] [CrossRef] [Green Version]
  23. Kumar, A.; Tripti, M.M.; Kiseleva, I.; Maiti, S.K.; Morozova, M. Toxic metal(loid)s contamination and potential human health risk assessment in the vicinity of century-old copper smelter, Karabash, Russia. Environ. Geochem. Health 2019. [Google Scholar] [CrossRef] [PubMed]
  24. Mohammadi, A.A.; Zarei, A.; Esmaeilzadeh, M.; Taghavi, M.; Yousefi, M.; Yousefi, Z.; Sedighi, F.; Javan, S. Assessment of heavy metal pollution and human health risks assessment in soils around an industrial zone in Neyshabur, Iran. Biol. Trace Elem. Res. 2019. [Google Scholar] [CrossRef]
  25. Gruszecka-Kosowska, A.; Baran, A.; Wdowin, M.; Mazur-Kajta, K.; Czech, T. The contents of the potentially harmful elements in the arable soils of southern Poland, with the assessment of ecological and health risks: A case study. Environ. Geochem. Health 2020, 42, 419–442. [Google Scholar] [CrossRef] [Green Version]
  26. Wu, J.; Long, J.; Liu, L.; Li, J.; Liao, H.; Zhang, M.; Zhao, C.; Wu, Q. Risk assessment and source identification of toxic metals in the agricultural soil around a Pb/Zn mining and smelting area in southwest China. Int. J. Environ. Res. Public Health 2018, 15, 1838. [Google Scholar] [CrossRef] [Green Version]
  27. Cai, L.M.; Xu, Z.C.; Ren, M.Z.; Guo, Q.W.; Hu, X.B.; Hu, G.C.; Wan, H.F.; Peng, P.G. Source identification of eight hazardous heavy metals in agricultural soils of Huizhou, Guangdong Province, China. Ecotoxicol. Environ. Saf. 2012, 78, 2–8. [Google Scholar] [CrossRef]
  28. Hou, D.; O’Connor, D.; Nathanail, P.; Tian, L.; Ma, Y. Integrated GIS and multivariate statistical analysis for regional scale assessment of heavy metal soil contamination: A critical review. Environ. Pollut. 2017, 231, 1188–1200. [Google Scholar] [CrossRef]
  29. Goovaerts, P. Geostatistics in soil science: State-of-the-art and perspectives. Geoderma 1999, 89, 1–45. [Google Scholar] [CrossRef]
  30. Webster, R.; Oliver, M.A. Geostatistics for Environmental Scientists; John Wiley and Sons: Hoboken, NJ, USA, 2001. [Google Scholar]
  31. Maas, S.; Scheifler, R.; Benslama, M.; Crini, N.; Lucot, E.; Brahmia, Z.; Benyacoub, S.; Giraudoux, P. Spatial distribution of heavy metal concentrations in urban, suburban and agricultural soils in a Mediterranean city of Algeria. Environ. Pollut. 2010, 158, 2294–2301. [Google Scholar] [CrossRef]
  32. Wei, X.; Jiang, Y. Chronicles of Tonghua City; Jilin People’s Publishing House: Chang Chun, China, 2010. [Google Scholar]
  33. Romic, M.; Romic, D. Heavy metals distribution in agricultural topsoils in urban area. Environ. Geol. 2003, 43, 795–805. [Google Scholar] [CrossRef]
  34. Hou, D.; Al-Tabbaa, A.; Chen, H.; Mamic, I. Factor analysis and structural equation modelling of sustainable behavior in contaminated land remediation. J. Clean. Prod. 2014, 84, 439–449. [Google Scholar] [CrossRef]
  35. Muller, G. Index of geoaccumulation in sediments of the Rhine River. Geojournal 1969, 2, 108–118. [Google Scholar]
  36. CNEMC (The Chinese Environmental Monitoring Centre). The Background Values of Soil Elements in China; Chinese Environment Science Press: Beijing, China, 1990. [Google Scholar]
  37. Wei, B.G.; Yang, L.S. A review of heavy metal contaminations in urban soils, urban road dusts and agricultural soils from China. Microchem. J. 2010, 94, 99–107. [Google Scholar] [CrossRef]
  38. He, J.Y.; Yang, Y.; Christakos, G.; Liu, Y.J.; Yang, X. Assessment of soil heavy metal pollution using stochastic site indicators. Geoderma 2019, 337, 359–367. [Google Scholar] [CrossRef]
  39. Håkanson, L. An ecological Risk Index for Aquatic Pollution Control-A Sedimentological Approach. Water Res. 1980, 14, 975–1001. [Google Scholar] [CrossRef]
  40. Ferreira-Baptista, L.; De Miguel, E. Geochemistry and risk assessment of street dust in Luanda, Angola: A tropical urban environment. Atmos. Environ. 2005, 39, 4501–4512. [Google Scholar] [CrossRef] [Green Version]
  41. US EPA United States Environmental Protection Agency. Available online: https://www.epa.gov/risk/regional-removal-management-levels-rmls-users-guide (accessed on 1 March 2020).
  42. National Environment Protection Agency of China (SEPAC). Environmental Quality Standard for Soils (GB 15618-1995); Chinese Environment Science Press: Beijing, China, 1990. [Google Scholar]
  43. National Environment Protection Agency of China (SEPAC). Soil Environmental Quality Risk Control Standard for Soil Contamination of Agricultural Land (GB 15618-2018); Chinese Environment Science Press: Beijing, China, 1990. [Google Scholar]
  44. Keshavarzi, B.; Najmeddin, A.; Moore, F.; Moghaddam, P.A. Risk-based assessment of soil pollution by PTEs in the industrialized urban and peri-urban areas of Ahvaz metropolis, southwest of Iran. Ecotoxicol. Environ. Saf. 2019, 167, 365–375. [Google Scholar] [CrossRef]
  45. Xiao, Q.; Zong, Y.T.; Lu, S.G. Assessment of heavy metal pollution and human health risk in urban soils of steel industrial city (Anshan), Liaoning, Northeast China. Ecotoxicol. Environ. Saf. 2015, 120, 377–385. [Google Scholar] [CrossRef]
  46. Ma, Q.; Han, L.N.; Zhang, J.Q.; Zhang, Y.C.; Lang, Q.L.; Li, F.X.; Aru, H.; Bao, Y.B.; Li, K.W.; Alu, S. Environmental risk assessment of metals in the volcanic soil of Changbai Mountain. Int. J. Environ. Res. Public Health 2019, 16, 2047. [Google Scholar] [CrossRef] [Green Version]
  47. Jiang, Y.X.; Chao, S.H.; Liu, J.W.; Yang, Y.; Chen, Y.J.; Zhang, A.C.; Cao, H.B. Source apportionment and health risk assessment of heavy metals in soil for a township in Jiangsu Province, China. Chemosphere 2017, 168, 1658–1668. [Google Scholar] [CrossRef] [PubMed]
  48. Tian, K.; Huang, B.; Xing, Z.; Hu, W.Y. Geochemical baseline establishment and ecological risk evaluation of heavy metals in greenhouse soils from Dongtai, China. Ecol. Indic. 2017, 72, 510–520. [Google Scholar] [CrossRef]
  49. Li, H.H.; Chen, L.J.; Yu, L.; Guo, Z.B.; Shan, C.Q.; Lin, J.Q.; Gu, Y.G.; Yang, Z.B.; Yang, Y.X.; Shao, J.R.; et al. Pollution characteristics and risk assessment of human exposure to oral bioaccessibility of heavy metals via urban street dusts from different functional areas in Chengdu, China. Sci. Total Environ. 2017, 586, 1076–1084. [Google Scholar] [CrossRef] [PubMed]
  50. Zhong, B.Q.; Liang, T.; Wang, L.Q.; Li, K.X. Applications of stochastic models and geostatistical analyses to study sources and spatial patterns of soil heavy metals in a metalliferous industrial district of China. Sci. Total Environ. 2014, 490, 422–434. [Google Scholar] [CrossRef]
  51. Shen, F.; Liao, R.M.; Ali, A.; Mahar, A.; Guo, D.; Li, R.H.; Sun, X.N.; Awasthi, M.K.; Wang, Q.; Zhang, Z.Q. Spatial distribution and risk assessment of heavy metals in soil near a Pb/Zn smelter in Feng County, China. Ecotoxicol. Environ. Saf. 2017, 139, 254–262. [Google Scholar] [CrossRef]
  52. Shah, M.; Ilyas, A.; Akhter, G.; Bashir, A. Pollution assessment and source apportionment of selected metals in rural (Bagh) and urban (Islamabad) farmlands, Pakistan. Environ. Earth Sci. 2019, 78. [Google Scholar] [CrossRef]
  53. Tian, H.Z.; Wang, Y.; Xue, Z.G.; Qu, Y.P.; Chai, F.H.; Hao, J.M. Atmospheric emissions estimation of Hg, As, and Se from coal-fired power plants in China, 2007. Sci. Total Environ. 2011, 409, 3078–3081. [Google Scholar] [CrossRef]
  54. Tadesse, A.; Gereslassie, T.; Xu, Q.; Tang, X.J.; Wang, J. Concentrations, distribution, sources and ecological risk assessment of trace elements in soils from Wuhan, central China. Int. J. Environ. Res. Public Health 2018, 15, 2873. [Google Scholar] [CrossRef] [Green Version]
  55. Rastegari, M.M.; Keshavarzi, B.; Moore, F.; Sharifi, R.; Lahijanzadeh, A.; Kermani, M. Distribution, source identification and health risk assessment of soil heavy metals in urban areas of Isfahan province, Iran. J. Afr. Earth Sci. 2017, 132, 16–26. [Google Scholar] [CrossRef]
  56. Guan, Q.Y.; Wang, F.F.; Xu, C.Q.; Pan, N.H.; Lin, J.K.; Zhao, R.; Yang, Y.Y.; Luo, H.P. Source apportionment of heavy metals in agricultural soil based on PMF: A case study in Hexi Corridor, northwest China. Chemosphere 2018, 193, 189–197. [Google Scholar] [CrossRef]
  57. Smichowski, P.; Gomez, D.; Frazzoli, C.; Caroli, S. Traffic-related elements in airborne particulate matter. Appl. Spectrosc. Rev. 2007, 43, 23–49. [Google Scholar] [CrossRef]
  58. Rodríguez-Seijo, A.; Andrade, M.L.; Vega, F.A. Origin and spatial distribution of metals in urban soils. J. Soil. Sediment. 2017, 17, 1514–1526. [Google Scholar] [CrossRef]
  59. Rasmussen, P.E.; Subramanian, K.S.; Jessiman, B.J. A multi-element profile of house dust in relation to exterior dust and soils in the city of Ottawa, Canada. Sci. Total Environ. 2001, 267, 125–140. [Google Scholar] [CrossRef]
  60. Huang, Y.; Chen, Q.Q.; Deng, M.H.; Japenga, J.; Li, T.Q.; Yang, X.E.; He, Z.L. Heavy metal pollution and health risk assessment of agricultural soils in a typical peri-urban area in southeast China. J. Environ. Manag. 2018, 207, 159–168. [Google Scholar] [CrossRef] [PubMed]
  61. Cao, S.Z.; Duan, X.L.; Zhao, X.G.; Ma, J.; Dong, T.; Huang, N.; Sun, C.Y.; He, B.; Wei, F.S. Health risks from the exposure of children to As, Se, Pb and other heavy metals near the largest coking plant in China. Sci. Total Environ. 2014, 472, 1001–1009. [Google Scholar] [CrossRef]
  62. Yang, Q.Q.; Li, Z.Y.; Lu, X.N.; Duan, Q.N.; Huang, L.; Bi, J. A review of soil heavy metal pollution from industrial and agricultural regions in China: Pollution and risk assessment. Sci. Total Environ. 2018, 642, 690–700. [Google Scholar] [CrossRef]
Figure 1. Distribution of sampling sites in Tonghua City.
Sustainability 12 02121 g001
Figure 2. The spatial distribution of the six metals in the study area.
Sustainability 12 02121 g002
Figure 3. Box plots of (a) geo-accumulation (Igeo), (b) pollution index (PI), and pollution load index (PLI).
Sustainability 12 02121 g003
Figure 4. The results of factor analysis (FA) of six PTEs in the urban soils of the study area.
Sustainability 12 02121 g004
Figure 5. Clustering tree of matrix cluster analysis on the PTEs of urban soils of Tonghua.
Sustainability 12 02121 g005
Figure 6. Spatial distribution of potential ecological risk index in study area.
Sustainability 12 02121 g006
Figure 7. (a) Contribution of PTEs under three types of land use to the HI for adults and children; and (b) Contribution of As and Cr to total carcinogenic risk under three different land use types.
Sustainability 12 02121 g007
Table 1. The standards given for the geo-accumulation index, pollution load index, and potential ecological risk index.
Geo-Accumulation Index aPollution Load Index bPotential Ecological Risk Index c
ValueContamination LevelValueContamination LevelValueRisk Degree
<0practically unpollutedPLI ≤ 1unpolluted E j i < 40low risk
0−1unpolluted to moderately polluted1 ≤ PLI ≤ 2unpolluted to moderately polluted40 ≤ E j i < 80moderate risk
1−2moderately polluted2 ≤ PLI ≤ 3moderately polluted80 ≤ E j i < 160considerable risk
2−3moderately to strongly polluted3 ≤ PLI ≤ 4moderately to highly polluted160 ≤ E j i < 320high risk
3−4strongly polluted4 ≤ PLI ≤ 5highly polluted E j i ≥ 320very high risk
4−5strongly to extremely pollutedPLI > 5very highly polluted
≥5extremely polluted
a Muller [35], b Wei [37] and He [38], c Håkanson [39].
Table 2. Summary of potentially toxic element (PTE) concentrations (mg/kg) with basic statistical parameters for the urban soils collected around Tonghua.
Land Use TypesValuesAsCrNiCuZnPb
Residential land (57)Max40.6161.249.4110619155.2
Min0.431.60.25.8270.2
Mean12.572.6715.9620.74244.7712.65
CV0.820.390.730.920.621.72
Grade a401501050200250
Industrial land (24)Max70.6169.855.6117.2802.2273.2
Min0.4320.84136.20.2
Mean24.3376.8513.8721.54427.8628.31
CV0.840.501.111.080.561.91
Grade a401504050200250
Farmland (31)Max46.2195.839.493742.863.2
Min1.836.61.27.218.40.8
Mean13.4168.5014.2519.48258.9513.72
CV0.830.430.700.870.760.99
Grade b40150705090200
TotalMax70.6195.855.6117.2802.2273.2
Min0.4310.2418.40.2
Mean15.7272.4115.0420.52266.5716.30
CV0.90.430.810.960.661.91
Background c 6.742.420.316.472.827.9
a Chinese Soil Environmental Quality [42], b Agricultural Land Soil Pollution Risk Control Standard (Trial) [43], c Background value of Jilin [36].
Table 3. Rotated component matrix of PTEs in soil.
ElementsRotated Component Matrix
Factor 1Factor 2Factor 3
As−0.3690.7380.064
Cr0.711−0.0540.284
Cu0.8510.0530.016
Ni0.716−0.215−0.085
Pb0.084−0.1140.952
Zn0.1290.847−0.218
Table 4. The index of non-carcinogenic health risks of PTEs in urban soils of study area.
ElementsHealth IndexResidential LandIndustrial LandFarmland
HQingHQinhHQderHIHQingHQinhHQderHIHQingHQinhHQderHI
Asadults1.14 × 10−22.06 × 10−55.46 × 10−31.69 × 10−22.78 × 10−23.99 × 10−51.03 × 10−32.89 × 10−21.53 × 10−12.20 × 10−55.70 × 10−31.59 × 10⁻¹
children1.32 × 10−13.59 × 10−52.05 × 10−31.34 × 10−12.59 × 10−17.06 × 10−54.05 × 10−32.63 × 10−11.43 × 10−13.90 × 10−52.23 × 10−31.45 × 10⁻¹
Cradults8.31 × 10−35.13 × 10−46.59 × 10−27.47 × 10−28.79 × 10−35.42 × 10−46.69 × 10−31.60 × 10−27.83 × 10−34.83 × 10−45.96 × 10−26.80 × 10⁻²
children7.74 × 10−24.33 × 10−42.48 × 10−21.03 × 10−18.19 × 10−29.60 × 10−42.62 × 10−21.09 × 10−17.30 × 10−28.56 × 10−42.34 × 10−29.73 × 10⁻²
Niadults2.74 × 10−43.58 × 10−51.61 × 10−44.71 × 10−42.38 × 10−43.11 × 10−51.34 × 10−52.83 × 10−42.44 × 10-43.20 × 10−51.38 × 10−44.14 × 10⁻⁴
children2.55 × 10−36.34 × 10−56.05 × 10−52.67 × 10−32.22 × 10−35.50 × 10−55.25 × 10−52.33 × 10−32.28 × 10−45.66 × 10−55.40 × 10−53.39 × 10⁻⁴
Cuadults1.78 × 10−41.04 × 10−79.40 × 10−52.72 × 10-41.85 × 10−41.08 × 10−79.38 × 10−61.94 × 10−41.67 × 10−49.78 × 10−88.48 × 10−52.52 × 10⁻⁴
children1.66 × 10−31.84 × 10−73.54 × 10−51.70 × 10−31.72 × 10−31.91 × 10−73.67 × 10−51.76 × 10−31.56 × 10−31.73 × 10−73.32 × 10−51.59 × 10⁻³
Znadults2.81 × 10−41.65 × 10−72.23 × 10−45.04 × 10−-44.89 × 10−42.88 × 10−73.74 × 10−55.27 × 10−42.96 × 10−41.74 × 10−72.25 × 10−45.21 × 10−4
children2.62 × 10−32.92 × 10−78.37 × 10−52.70 × 10−34.56 × 10−35.09 × 10−71.46 × 10−44.71 × 10−32.76 × 10−33.08 × 10−78.83 × 10−52.85 × 10⁻³
Pbadults1.24 × 10−37.25 × 10−71.31 × 10−32.55 × 10−32.77 × 10−31.62 × 10−62.82 × 10−43.05 × 10−31.34 × 10−37.86 × 10−71.37 × 10−32.71 × 10⁻³
children1.15 × 10−21.28 × 10−64.93 × 10−41.20 × 10−22.59 × 10−22.87 × 10−61.10 × 10−32.70 × 10−21.25 × 10−21.39 × 10−65.34 × 10−41.30 × 10⁻²
HQ is hazard quotient; HI is hazard index.
Table 5. The index of carcinogenic health risks of PTEs in the urban soils of study area.
Land Use TypesHealth IndexAsCrNiPb
Residential
land
CRing6.56 × 10−51.29 × 10⁻⁴ 3.80 × 10⁻⁷
CRinh1.04 × 10−71.71 × 10−67.50 × 10−9
CRdermal3.38 × 10−6
TCR6.91 × 10−51.30 × 10−47.50 × 10−93.80 × 10⁻⁷
Industrial
land
CRing1.29 × 10−41.36 × 10⁻⁴ 8.52 × 10⁻⁷
CRinh2.05 × 10−71.80 × 10−66.51 × 10−9
CRdermal2.29 × 10−6
TCR1.32 × 10−41.39 × 10−46.51 × 10−98.52 × 10⁻⁷
FarmlandCRing7.12 × 10−51.21 × 10⁻⁴ 4.13 × 10⁻⁷
CRinh1.13 × 10−71.61 × 10−66.69 × 10−9
CRdermal3.57 × 10−6
TCR7.49 × 10−51.23 × 10−46.69 × 10−94.13 × 10⁻⁷
CR is the carcinogenic risk; TCR is the total carcinogenic risk.

