Article

Environmental Risk Assessment in Agriculture: The Example of Pistacia vera L. Cultivation in Greece

by
Georgios Bartzas
1,* and
Konstantinos Komnitsas
2
1
School of Mining and Metallurgical Engineering, National Technical University of Athens, 15780 Zografos, Athens, Greece
2
School of Mineral Resources Engineering, Technical University of Crete, 73100 Chania, Greece
*
Author to whom correspondence should be addressed.
Sustainability 2020, 12(14), 5735; https://doi.org/10.3390/su12145735
Submission received: 11 June 2020 / Revised: 3 July 2020 / Accepted: 14 July 2020 / Published: 16 July 2020

Abstract

:
In this study, an integrated environmental risk assessment (ERA) study involving frequent monitoring of both water and soil parameters (24 on total), was carried out to assess and compare the environmental risk quality of three pistachio (Pistacia vera L.) fields (two in Aegina island and one in Kilkis) based upon risk categories identified and assessed in terms of quality and quantity. In this context, vertical profiles and risk matrices were created for a 60-month period for the most important soil and water parameters i.e., soil pH, soil organic matter, soil salinity, heavy metals, and irrigation water quality. According to the obtained results, the two pistachio fields in Aegina exhibited reduced overall risk values, i.e., 17% and 27%, respectively after the adoption of sustainable cultivation practices, thus reflecting a transition from “medium to high risk” to “low to medium risk” environmental quality. On the other hand, overall risk values for the pistachio field in Kilkis were reduced by 34% and were lower compared to the ones obtained for the pistachio fields in Aegina. The better environmental profile identified for the entire period in Kilkis ranging from “medium risk” to “low risk” was the result of lower inherent risk associated with irrigation water quality and soil salinity. The proposed methodology can be easily applied in other agricultural areas and for similar cultivations in Greece and other Mediterranean countries.

1. Introduction

Contamination of soil and groundwater in agricultural areas has become a global concern today and limits its availability as a source of nutrients and resource for crop irrigation, respectively [1]. The associated impacts are more noticeable in areas suffering from desertification, salinization, soil erosion, or when soil nutrient content/availability and irrigation water resources are not sufficient to support intense agricultural activities [2]. The environmental risk assessment (ERA) offers a low-cost alternative to toxicological studies and can be used to evaluate changes of risk over time, caused from anthropogenic activities such as agriculture, industry, and urban development [3].
Environmental risk assessment involves analysis of information related to the environmental fate and behavior of chemicals in the environment (i.e., air, water, and land) integrated with an analysis of information on their effects on humans and ecological systems. In the case of polluted soils and sites, ERA includes a combination of chemical, biological, and ecological measurements that can be applied in situ and/or ex situ, according to the most recent ISO (International Standardization Organization) standards available [4]. It is therefore an important decision-making tool that can be used to identify existing environmental problems, prioritize agricultural management and regulatory efforts, predict potential risks of planned actions, and subsequently evaluate their effectiveness at field. However, the estimation of environmental risk is a complex procedure that generally requires a multidisciplinary approach in design and development [5]. It is usually based on generic standards (target and intervention values) that are used to assess the affected medium quality and classify media as clean, slightly, moderately, or heavily contaminated. The target values are protective levels and indicate the desired media quality, while the intervention values are indicative of serious contamination [6]. The assessment of risk for the population is a much more complex procedure and requires the establishment of human toxicological and eco-toxicological intervention values as well as exposure rates over various periods. In order to assess risk, hazards, or potential sources of contamination that may harm to a certain extent the surrounding ecosystem, environment should be first identified and then evaluated in terms of quality and quantity [7].
So far, most of the previous environmental risk studies related to agriculture have focused either on the safe use of wastewater for irrigation purposes or on evaluating N/P/K leaching based only on soil parameters [8]. To a large extent, the quality of the irrigation water plays the most critical role in minimizing negative impacts on agricultural development and in the strategy planning for water conservation in the long term. However, the irrigation water quality and the associated risks to soil characteristics and crop yield is often a complex phenomenon that depends on the combined effect of many parameters. To this end, a water quality index provides a single number that defines the overall water quality at a certain location and time based on several parameters. The objective of an index is to turn complex water quality data into information that is understandable and useable by the target stakeholders such as farmers and local authorities.
Therefore, in this study, an integrated ERA was carried out to timely assess and compare the environmental risk quality of three pistachio (Pistacia vera L.) fields located in Greece based upon risk categories identified and assessed in terms of quality and quantity. For that purpose, both water and soil parameters were carefully selected, and vertical profiles/risk matrices were employed to combine the obtained results in an overall risk impact output. To the best of our knowledge, no similar ERA studies are available in literature evaluating both soil and water quality parameters and assessing risk over time as a single value. Thus, this study aims to fill a gap and propose a low-cost and simple methodology that evaluates risk at field level as results from applied agricultural practices.

2. Materials and Methods

2.1. Pilot Fields

Two pistachio fields (AF1 and AF2) in Aegina island—central Greece and one (KF1) in Kilkis—northern Greece were fully monitored over a 60-month period (2013–2017) with their locations presented in Figure 1.
The two fields located in the northern part of Aegina island were selected because several agricultural activities and urban development have led to deterioration of irrigation water quality, depletion of underground water resources availability due to sea intrusion, as well as soil erosion and desertification at regional level [9,10]. On the other hand, the third pistachio field was selected in an agricultural area (Kilkis) where no significant water and soil degradation problems were noticed due to cultivation practices or were likely to develop during the monitoring period examined. Regarding climate conditions, the island of Aegina is characterized by semi-arid Mediterranean climate, with a mean annual temperature of 19 °C and an annual rainfall of 295 mm. On the other hand, the climate in Kilkis is humid continental with a mean annual temperature of 15 °C and an annual rainfall of 612 mm [11]. Further details of the main characteristics of the three pilot fields investigated in terms of cultivation practices used are given in the next section.

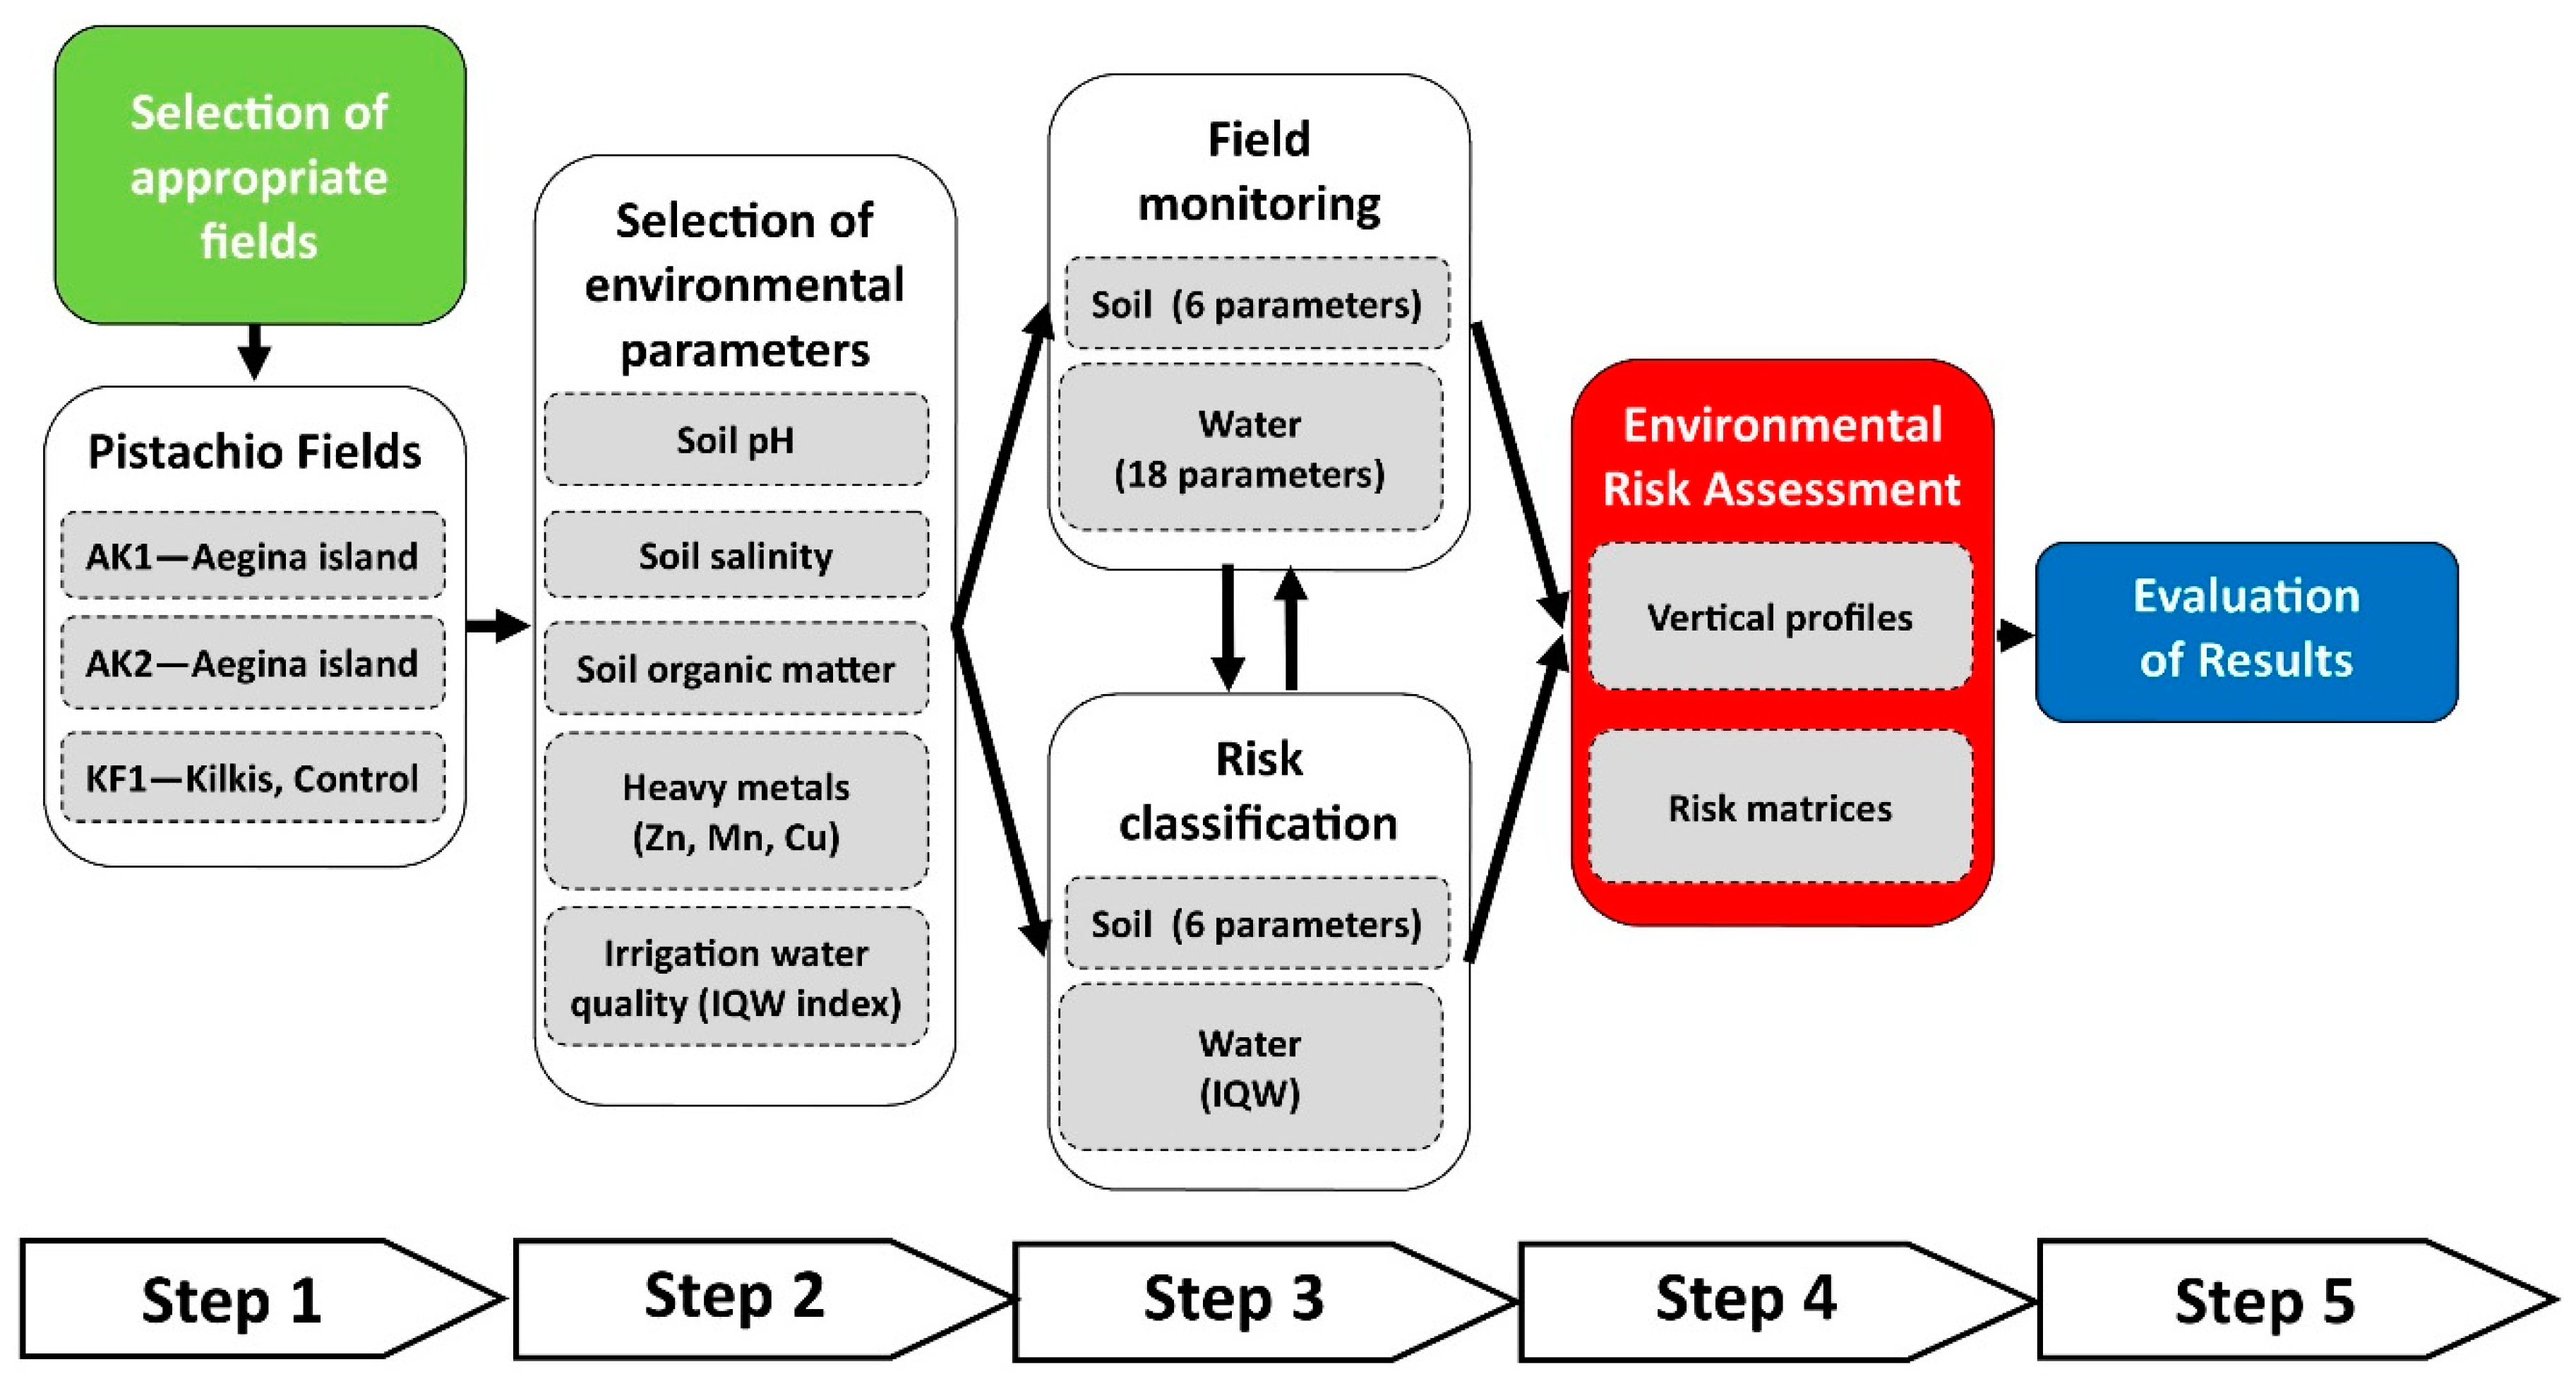
2.2. Environmental Risk Assessment Methodology

In this study, a detailed ERA methodology has been applied to assess the environmental quality of the pistachio fields under study as well as their improvement due to the application of the developed, in the frame of the AgroStrat project, sustainable strategies [12]. The approach followed is based on the broader principles of an ecological risk assessment, which include identification of environmental hazards, recipients of risk, exposure pathways and routes that lead to exposure, as well as assessment of the magnitude of risk [13,14,15]. The methodology was focused on the environmental characteristics and pressures identified in the study areas and involved five modular steps: (a) Selection of appropriate fields (pistachio production), (b) selection of the environmental parameters that fully reflect the challenges facing the areas under study in terms of water and soil quality, (c) monitoring of selected parameters at field along with their risk classification conducted to provide qualitative assessment, (d) monitoring of vertical profiles and risk matrices to combine risk elements and environmental impacts, and (e) evaluation of the obtained results (Figure 2).
In total, seven environmental parameters i.e., soil pH, soil organic matter, soil salinity, heavy metals content (Mn, Cu and Zn), and irrigation water quality (IWQ) have been evaluated during monitoring of vertical profiles and were then integrated into risk matrices to enable qualitative and quantitative risk assessment. The selection of these environmental parameters was based on their potential to thoroughly reflect the most important pressures that occur in the two areas under study along with the need to fully assess the environmental degradation at the three pistachio fields prior and after the adoption of sustainable practices (SP) and presented in Table 1 and Table 2, respectively. Overall, in each field, SP were based on specific integrated management scenarios that included sustainable fertilization, soil washing for salts reduction (in Aegina), and application of good practices to prevent soil erosion. Regarding solid waste and wastewater, the usual practice of their uncontrolled disposal on soil was replaced in both study areas by sustainable practices involving (i) valorization of solid wastes for the production of compost and biochar and their subsequent use as soil improver [16], and (ii) collection of wastewaters, mostly dehulling effluents, followed by evaporation in shallow sequential ponds; due to the dry climate prevailing in the island, evaporation was completed within 2–3 months. It is mentioned that after the SP application, a small increase of yield was observed in the fields AF1 and AF2 (Aegina), i.e., 4% and 4.5%, respectively, while in the case of KF1 in Kilkis, yield remained constant.
Among all environmental parameters selected, the quality of the irrigation water is considered as the most critical one for sustainable development in agriculture in semi-arid areas such as in Aegina island [17]. In this context, the IWQ index was selected in this study and presented in detail in the next section.

2.3. Irrigation Water Quality (IWQ Index)

The IWQ risk index was selected based on the fact that it is the only index that is recognized as suitable for spatially evaluating water quality for irrigation purposes. It was developed by Simsek and Gunduz [18], and uses a relatively large number of parameters i.e., electrical conductivity (EC), total dissolved solids (TDS), sodium adsorption ratio (SAR), sodium, chloride, boron, nitrate-nitrogen (NO3-N), bicarbonate (HCO3), and pH for the calculation of the risk index, which ensures the best representation of the hydrogeological setting. The numerical ratings and weights were defined using the well-established Delphi technique, which was first adopted by the US RAND Corporation in the 1950s [19] and is based on an iterative set of questionnaires designed to elicit experts’ knowledge and reach consensus [20]. Delphi is suitable for situations in which models are not fully practical or efficient because there is lack of appropriate technical, economic, or historical data and thus, expert opinions need to be established. The key elements of Delphi are anonymity, interaction, controlled feedback, and statistical aggregation of expert response. In this context, Delphi has several advantages over traditional surveys. The Delphi approach is frequently used in studies pertinent to agriculture or the food industry [21,22] as well as in other sectors. The customization followed in the present study makes the index suitable for producing comparable risk maps at regional scale.
The calculation of the IWQ index is based on the linear combination of the five different groups of IWQ parameters that have potential negative impacts or may cause hazards on soil quality and crop yield. In this technique, all five groups are simultaneously included in the assessment and are combined to form a single index value, which is then assessed to determine the suitability of the irrigation water. The water quality parameters from these groups were selected based on the guidelines for irrigation purposes provided by FAO [23] and are given in the Supplementary Materials (Table S1). These parameters not only best characterize the associated risk but can be also combined with others to form a general pattern of water quality for the particular resource. Furthermore, these parameters are arranged in such a way that the results obtained from this tool are easily understood by a non-technical decision maker who could use easily use this method.
In the IWQ risk index methodology, each one of the five parameters are given a weighing coefficient (Table 3), ranging from 1 to 5, so that the most and the least important groups in IWQ are given the highest (5) and lowest (1) points. As the salinity risk is considered to be the most important factor in IWQ assessment, the highest priority is given to salinity. On the other hand, the miscellaneous effects to sensitive crops are generally considered as the least important factor influencing the IWQ. Between these two extremes, the infiltration and permeability risk, specific ion toxicity, and trace element toxicity are rated in decreasing order of significance for IWQ.
The IWQ index is then calculated as:
I W Q   I n d e x = i = 1 5 G i
where, i is an incremental index and G represents the contribution of each one of the five risk categories that are important to assess the quality of an irrigation water resource.
Once the IWQ Index is evaluated, it is possible to identify areas with poor quality irrigation waters that are not suitable for irrigating agricultural fields. The lower the values of the IWQ Index the lower is the suitability of water for irrigation.

2.4. Field Monitoring

Soil and water sampling campaigns (five in total) were conducted in the three pistachio fields, namely AF1, AF2, and KF1, covering the period 2013–2017. Field monitoring took place during summer and winter to take into account seasonal variations in productivity and climate conditions. Soil samples were collected using auger equipment at the surface (0–30 cm), middle (30–60 cm), and bottom (60–90 cm) segments. Prior to analysis, soil samples were air dried at room temperature (25 °C), ground in a mortar, and screened to pass through a 10-mesh (2 mm) sieve. The main soil physical properties, namely pH, soil organic matter (SOM), salinity, as well as heavy metals content (Mn, Cu, and Zn) were determined as follows: Soil pH was measured in a 1:1 (water/soil) ratio using a digital pH meter (PHS-3C, Shanghai, China) while soil salinity (as electrical conductivity (EC)) was measured with a DDS-307 conductivity meter (soil/water = 1:5) (INESA Scientific Instrument, China). SOM was measured using the modified Walkley–Black acid digestion method [24] while heavy metals Mn, Cu, and Zn were determined using an inductively coupled plasma optical emission spectrophotometer (ICP–OES) (Optima2000, Perkin Elmer, Italy)
IWQ was taken into account in this study based on the linear combination (combined IWQ index) of five different groups of quality parameters i.e., Salinity, Infiltration and Permeability, Specific ion toxicity, Trace element toxicity, and Miscellaneous effects [18]. For that purpose and in parallel to soil sampling, water samples were collected at three predetermined depth intervals, 0–30 cm, 30–60 cm, and 60–90 cm, using 250-mL sampling bottles and stored at 4 °C prior to analysis. The main water quality parameters determined were: pH, EC, Na, Ca, Mg, K, HCO3/CO32−, Cl, SO42−, NO3, PO43−, Cu, Zn, Mn, Fe, calcium hardness, sodium adsorption rate (SAR), and residual Na. pH and EC were measured by a digital pH meter (PHS-3C, Shanghai, China) and a DDS-307 conductivity meter (INESA Scientific Instrument, Shanghai, China), respectively, while cations were determined using a Varian SPECTRAA 220 Atomic Absorption Spectrometer (Varian, Palo Alto, CA, USA) and anions using standard methods. Na was measured by using a Korning Spectrometer while P was measured in a UV-visible Spectrophotometer (Hitachi U3010, Tokyo, Japan).

2.5. Risk Classification

The risk for each potential pathway is usually considered as a combination of the probability that a hazard will reach a specific target (e.g., contamination of surface- and groundwater) along with the magnitude of harm, if this target is exposed to the hazard (e.g., the magnitude of harm if contaminated surface- or groundwater is used for irrigation purposes) [25]. The probability that a contaminant will reach a specific target in sufficient concentration to cause harm may be assessed qualitatively according to the scale: (i) High (certain or near certain to occur); (ii) medium (reasonably likely to occur); (iii) low (seldom likely to occur); or (iv) negligible (never likely to occur). The magnitude of harm is assessed as: (i) Severe (human fatality or irreparable damage to the ecosystem); (ii) moderate (e.g., human illness or injury, negative effects on ecosystem function); (iii) mild (minor human illness or injury, minor changes to ecosystem); or (iv) negligible (never likely to harm humans and ecosystem). Based on the aforementioned relationship and by taking into account the limits suggested by FAO [23] and Gallardo et al. [26], risk categories for the environmental parameters selected in this study were assessed and are described in detail in Appendix A. According to these risk categories identified, in terms of quality and quantity (Figure 3), several vertical risk profiles (each one is a separate indicator of environmental impact) were created over time for the three pilot fields under study.

3. Results and Discussion

3.1. Risk Assessment for Selected Environmental Parameters in the Pilot Fields

Vertical variation of soil pH and soil organic matter (SOM) in the three pilot fields investigated i.e., AF1 and AF2 (Aegina island) and KF1 (Kilkis) for selected sampling periods is shown in Figure S1a–c and Figure S1d–f, respectively. The vertical profile of soil pH in the pilot fields of Aegina, depending on the risk category identified (Appendix A), resulted in a transition from “low risk” to “negligible risk”, i.e., optimum for most crops, as a result of SP adoption (Figure S1a,b). On the other hand, the vertical profile of soil pH in the KF1 pilot field, depending on the risk category identified, proved that SP has significantly affected the environmental profile of pistachio cultivation, even though its initial conditions at month 8 (M8) were characterized by “medium to high risk” compared to “low risk” identified in the two pilot fields of Aegina for the same period. As a result, the risk category of soil pH in the pilot field KF1 changed from “medium to high risk” to “low risk”, thus decreased by three scales and provides satisfactory conditions for many crops according to Figure S1c. Vertical profile of soil organic matter (Figure S1d,e) in the pilot fields in Aegina, depending on the risk category identified, showed that pistachio cultivation reached “negligible risk” at M48 and M60 of the sampling period, due to the adoption of SP. It is important to note that an increase in soil organic matter is shown at depth 0–30 cm, thus indicating that SP had a significant effect in the upper parts of the soil profile; so, it is strongly believed that a better environmental profile will be achieved in the long term even for the lower parts. Regarding the KF1 pilot field (Kilkis), vertical profile of soil organic matter was classified as “medium to high risk” at M8 and shifted into “low risk” at M60 due to SP implementation (Figure S1f). In contrast to previous pilot fields, the deepest layer (60–90 cm) shows higher soil organic matter values than the shallower layers, indicating that stable nutrient conditions may prevail in the long term.
Vertical profiles of soil salinity, in terms of measured EC (in μS/cm), in the pilot fields in Aegina depending on the risk category identified (Figure S2a,b) resulted in “high risk” values at the sampling period prior to SP adoption (M8 to M32). However, a reverse trend from “medium to high risk” to “negligible risk” (2 risk classes for EC) was finally shown in the shallower soil layers at the latter periods of sampling (M48 and M60), as a result of the adoption of the proposed cultivation practices by the farmer. As can be seen, the soil profile in the AF1 pilot field was slightly to strongly saline, mainly due to over-pumping of groundwater and the sea water intrusion that followed [7]. Similar results were also obtained for the AF2 pilot field with transition from the “medium to high risk” to “negligible risk” (2 risk classes), due to SP effect even for the deeper layers compared to previous data. It is therefore evident that although pistachio presents significantly greater salt tolerance than other nut crops, soil salinity problems existed in the mature pistachio orchards (trees over 60 years old) in Aegina due to continuous application of highly saline irrigation water during summer over the last two decades [7,27]. Regarding the KF1 pilot field, vertical profile of soil salinity was classified in the “negligible risk” zone prior to and after the SP effect (Figure S2c). This indicates that non-saline conditions exist in the pilot field in Kilkis and therefore the effect of salinity to young pistachio orchard (age 18) and the surrounding environment is negligible.
Vertical variation of Mn, Cu, and Zn concentration (mg/kg) in the soil profile along with irrigation water quality in the three pilot fields investigated is presented in Figures S2d–f, S3a–c, and S3d–f, respectively. Vertical profile of Mn concentration in the pilot fields in Aegina, depending on the risk category identified (Figure S2d,e), resulted in “medium risk” values at the sampling periods prior to and after the SP effect. However, it is evident that concentration of Mn was distributed evenly in the entire soil depth because of the high Mn affinity with soil even in the deepest layers. Similarly, Shiwakoti et al. [28] found out that Mn concentration levels remained relatively constant over soil depth (up to 60 cm) when conventional tillage was employed for a long period. On the other hand, lower risk values were indicated for Mn in the pilot filed in Kilkis (KF1) denoting “low risk” after SP implementation (M48). However, it needs to be mentioned that Mn is the most commonly found element in the earth’s crust, so its determination at background levels needs to be carefully established prior to reaching conclusions, especially in cultivated soils.
Similar results to Mn were found for the Cu distribution in the vertical profiles (Figure S3a–c). However, a higher risk category was indicated in the shallower soil layers of the pilot fields in Aegina prior to SP adoption, due to spray application of fungicide (~3 kg/ha) in the form of copper oxychloride [3Cu(OH)2·CuCl] (see Table 1). Previous studies have shown that Cu accumulates in the surface soil when copper-based fungicides are applied at fields, but it decreases with depth and eventually reaches typical levels for natural soils at depths below 60 cm [29]. The low Cu content in the shallower soil layers may be also explained by the high content of SOM in Aegina (up to 9%) and the subsequent high binding affinity of Cu to the functional groups of SOM, namely carboxylic and phenolic [30]. After M48, medium risk conditions prevailed in AK1 and AK2 fields since no fungicide treatment was carried out during the application of SP. As in the case of Mn, the KF1 pilot field exhibited less harmful risk values for Cu, which ranged from the “medium” to “low risk” as the soil sampling depth increased to 90 cm. This may indicate that lower fungicide dose (by 50%) of copper hydroxide (1.5 kg/ha) was applied in the KF1 field compared to pistachio fields in Aegina until M32 and terminated after M48 due to SP implementation. For all soil depths, a very slight decrease of Cu content was observed over time, thus indicating that the effect of SP had lower magnitude in the KF1 pilot field in relation to the pistachio fields monitored in Aegina.
In terms of environmental risk assessment for Zn distribution, less harmful results were derived compared to Mn and Cu. For the entire 60-month period examined, AF1 pilot field exhibited constant risk values (medium) for Zn, even a sharp decrease of concentration values (up to 1.2 mg/kg) was measured as the soil sampling depth increased to 90 cm. Reversely, in the case of the AF2 pilot field, a trend towards lower risk due to increased Zn content was indicated at the later sampling periods (after M48) as a result of SP adoption. Similarly, the distribution of Zn in the pilot field in Kilkis (KF1), based upon the associated risk category (Figure S3f), resulted in lower risk values i.e., “low” and “low to medium” at the sampling periods after the SP effect (M48). The lower risk values for Zn obtained in the AF2 and KF1 pistachio fields at the latter sampling periods compared to AF1 are the result of foliar Zn fertilization applied after the SP effect for the first two orchards (see Table 2) [31]. Similar vertical-profile distributions, with higher Zn content near the soil surface, which gradually decreased with depth (up to 90 cm), were also determined in other studies involving continuous non-tillage treatment in wheat/sorghum cultivation fields for a period of eight years [32].
Finally, the vertical profile of irrigation water quality (Figure S4a,b), in terms of calculated IWQ index, in the pilot fields in Aegina, resulted in “high risk” and “medium risk” at the sampling periods prior to and after the SP effect, respectively. The high-risk values obtained in the AF1 and AF2 pistachio fields until M32 (prior to SP adoption) are most likely due to the use of saline water from the nearby coastline, as can be seen in Figure 1. However, the less harmful risk values (medium) obtained after the effect of SP indicate that the sustainable practices implemented after M48 (see Table 2), namely soil washing with excessive water and wastewater treatment in evaporation ponds, significantly improved the quality of the irrigation water in Aegina. On the other hand, IWQ values indicated (Figure S4c), as anticipated, better quality for irrigation water in the pilot field in Kilkis (KF1) compared to the ones in Aegina. In this case, the low-risk values prevailed after the SP effect are mainly due to applied soil washing practices rather than the better inherent physicochemical characteristics of the study area (no seawater intrusion and high soil permeability) compared to Aegina. It is known that the quality of irrigation water is highly important for the improvement of soil conditions and the achievement of higher yields, following the principles of agricultural sustainability [33].

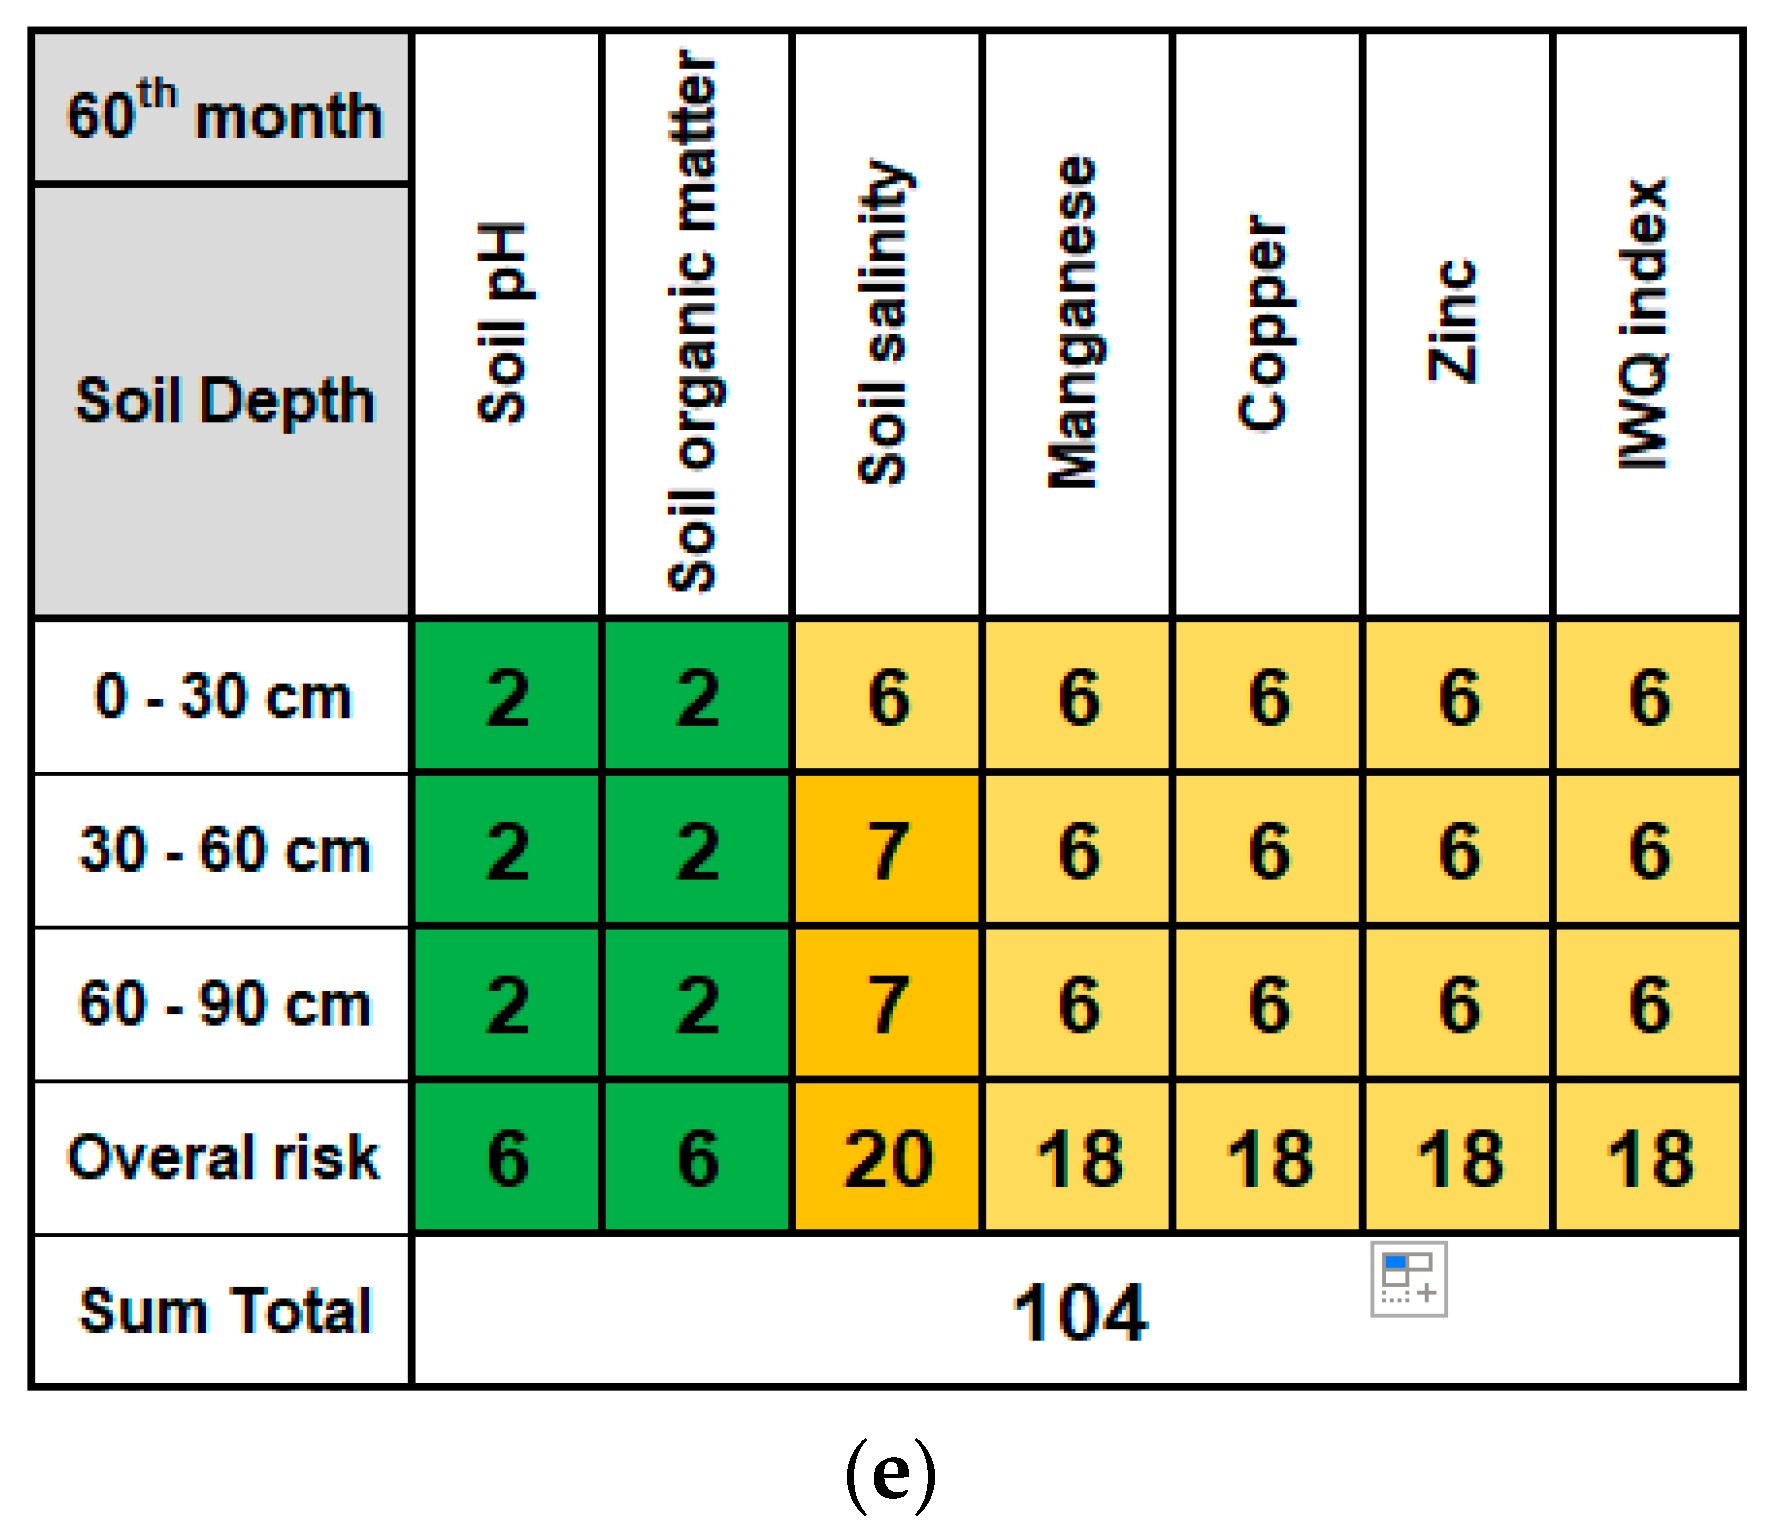
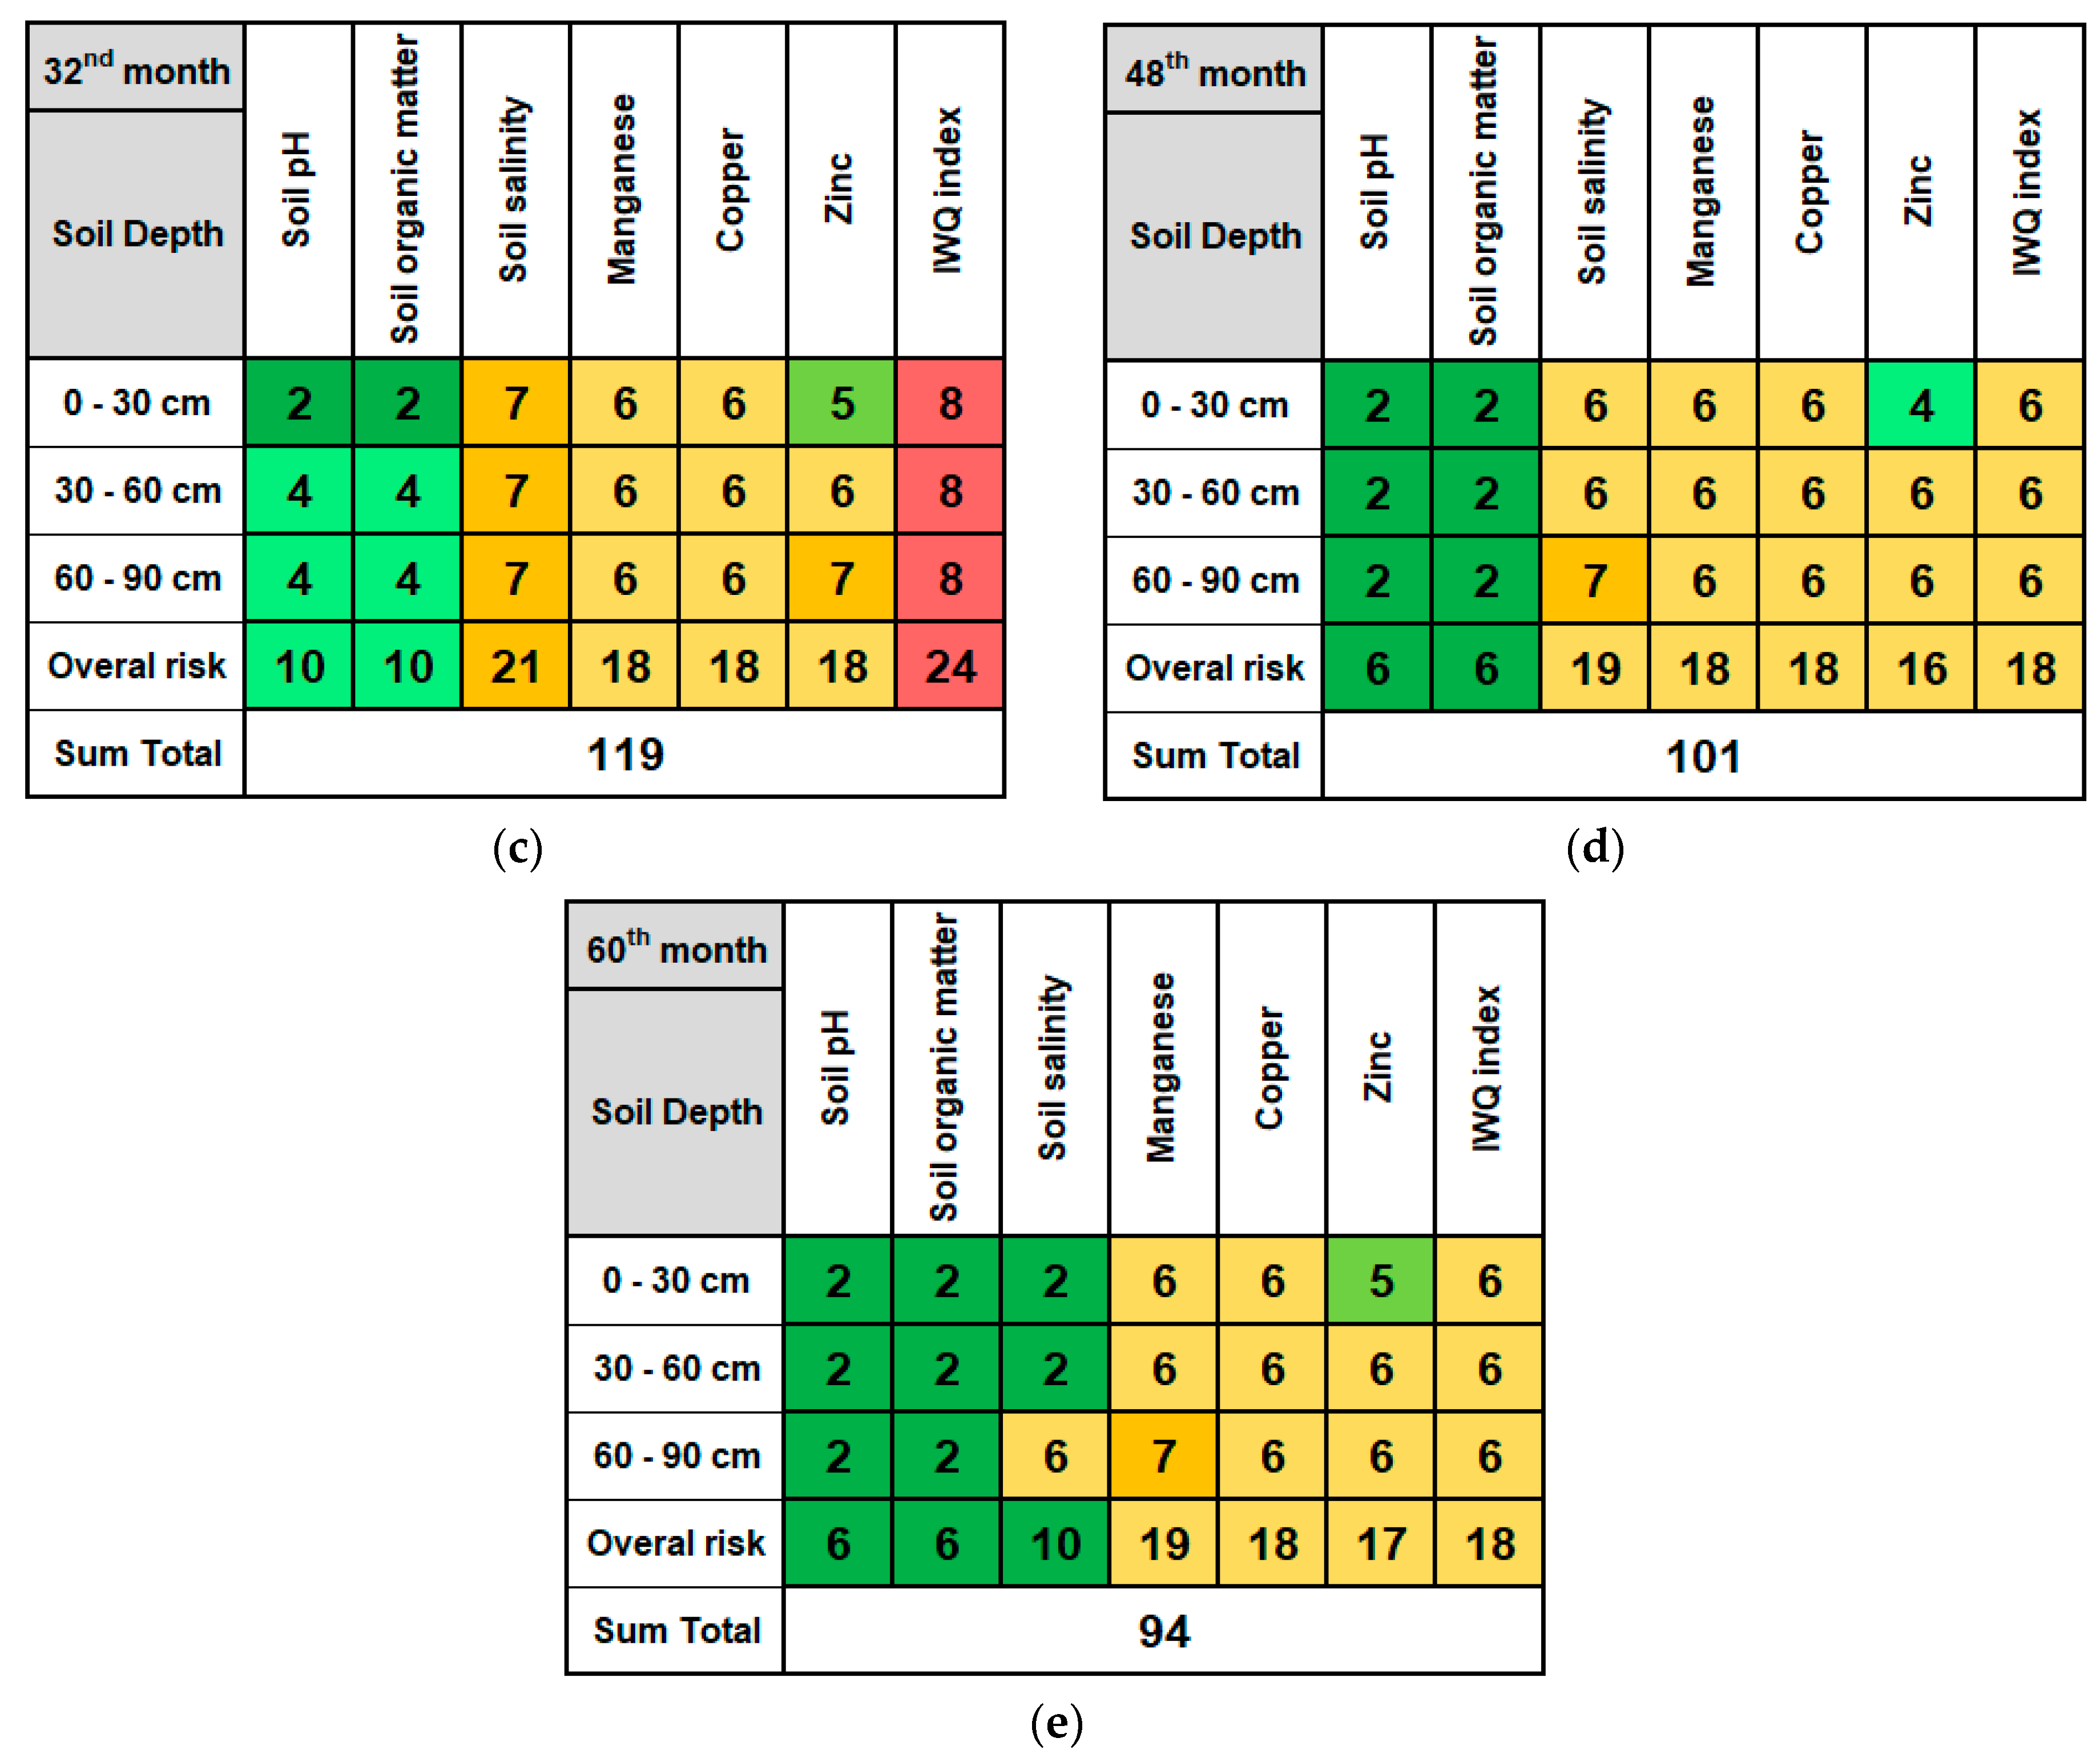
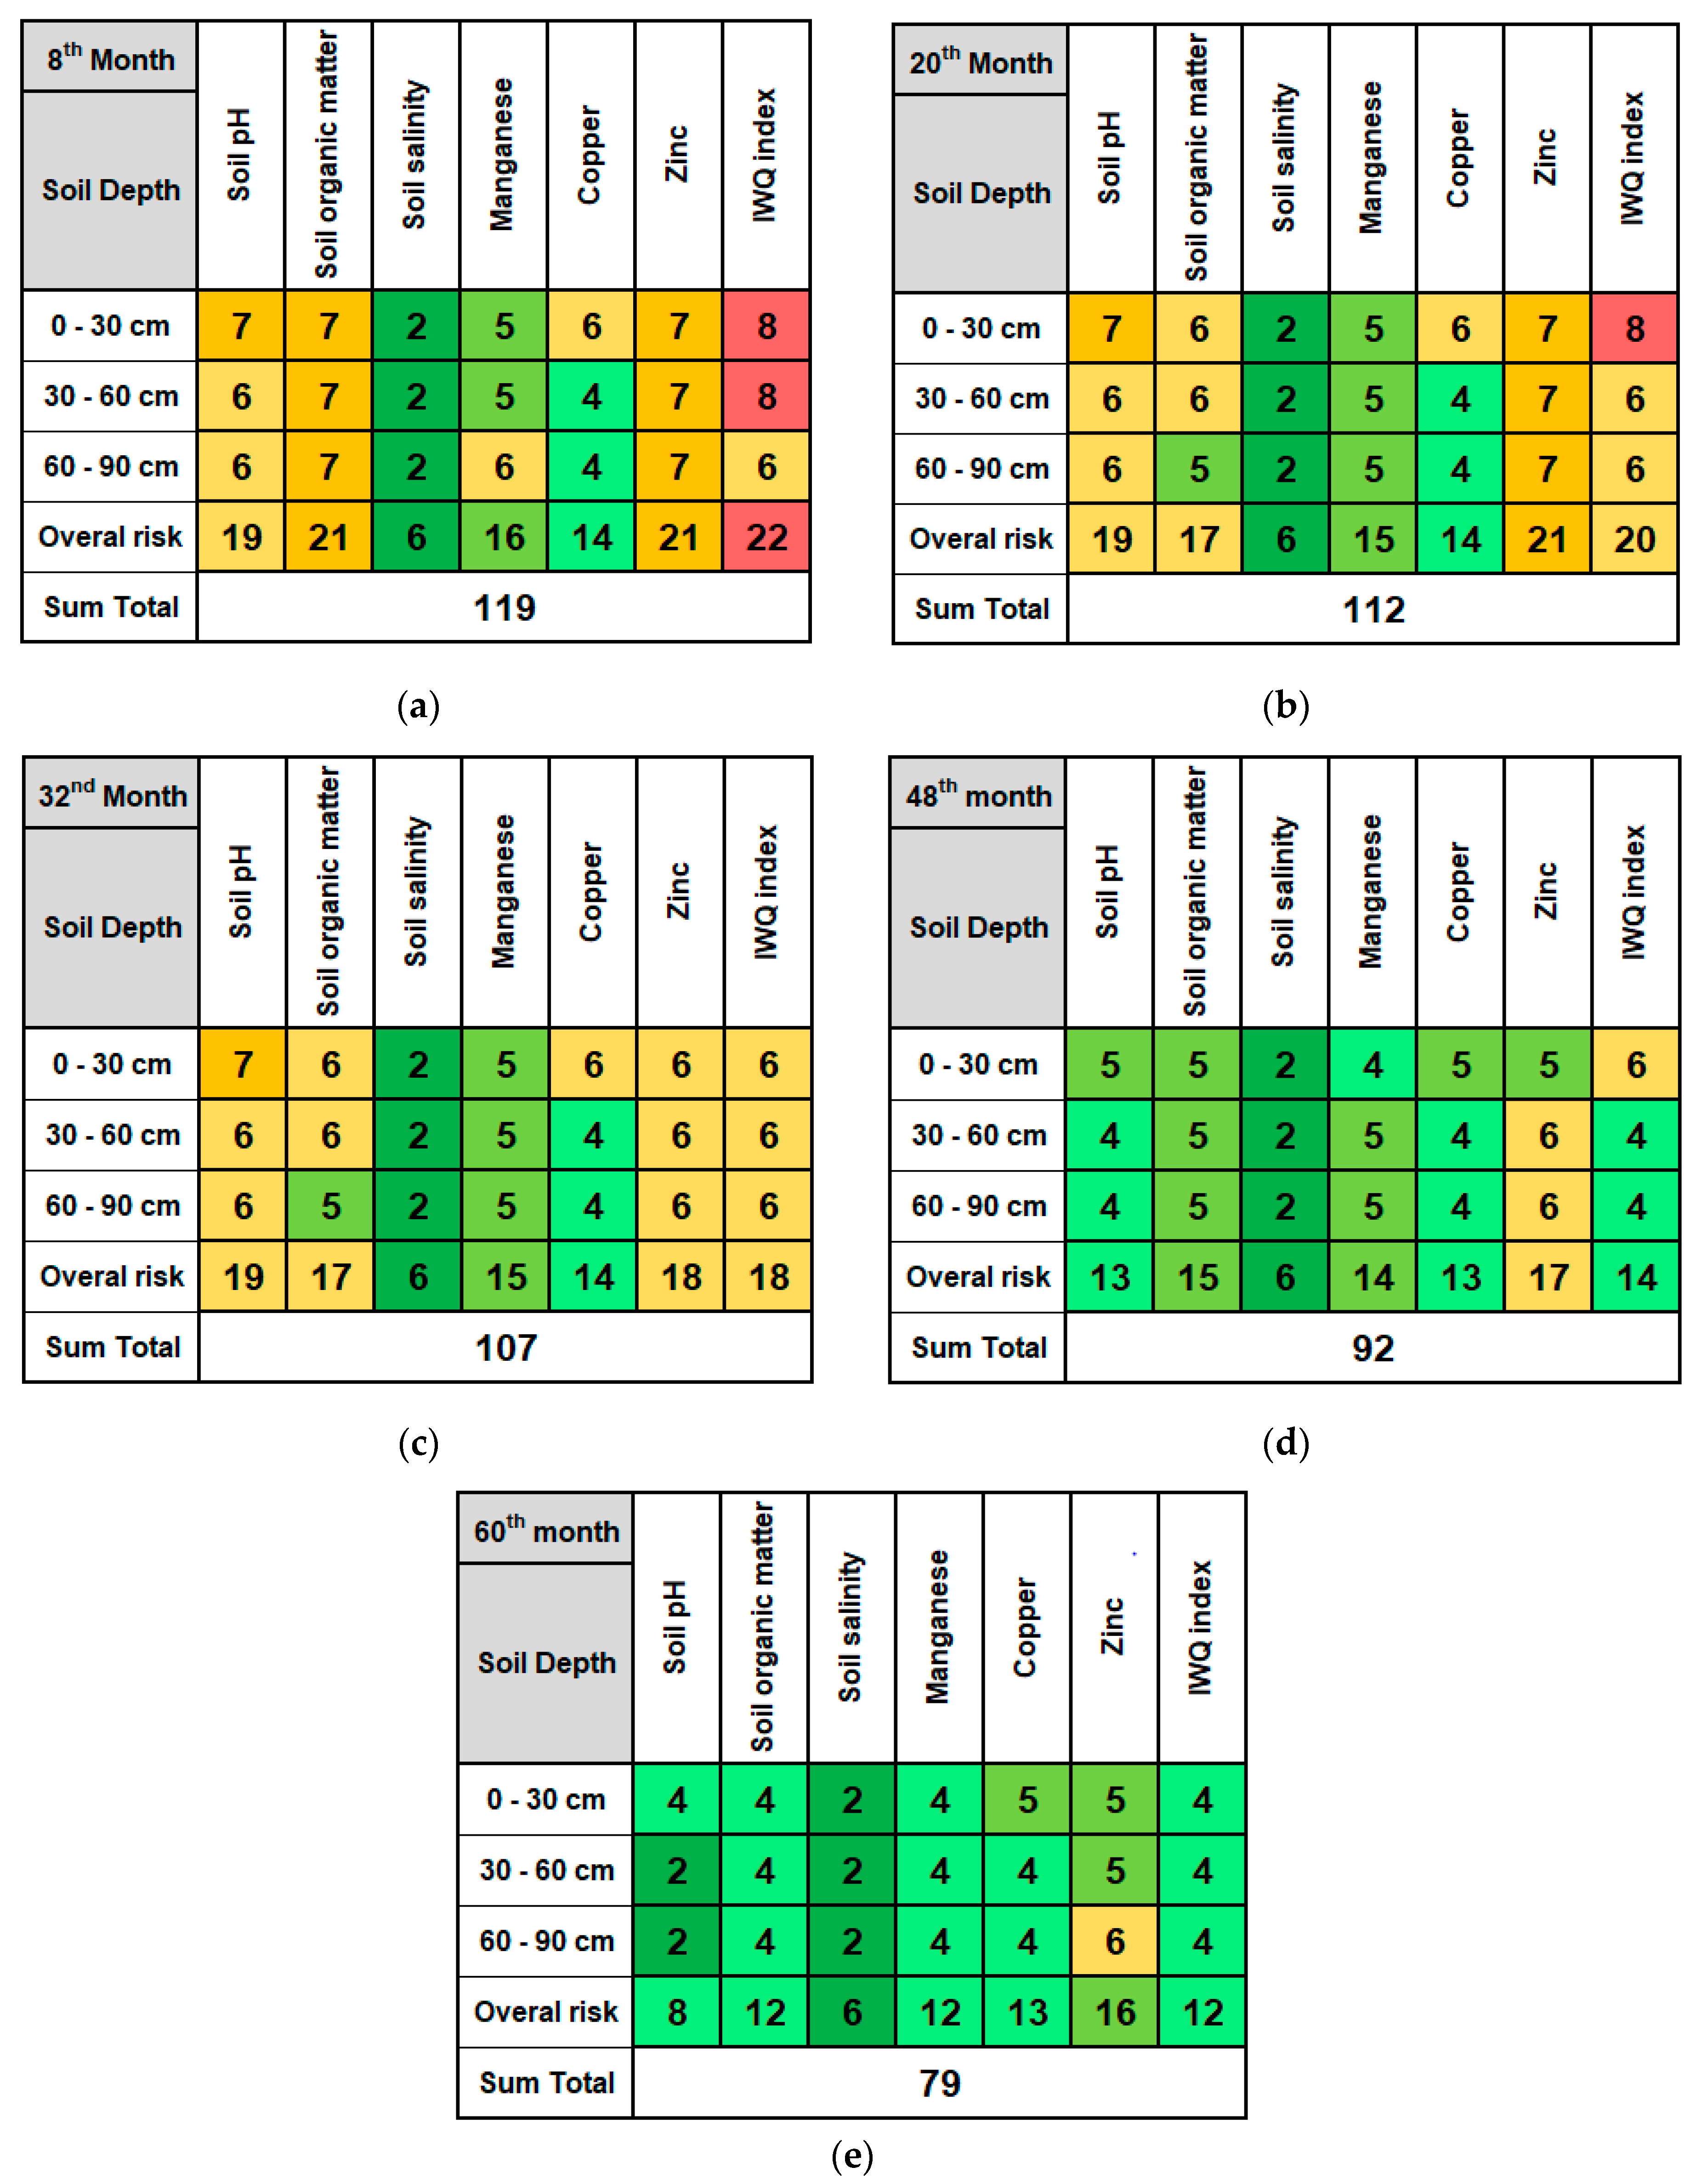
3.2. Overall ERA Results in the Pilot Fields—Risk Matrices

Five overall risk matrices were created for the pilot fields AF1 and AF2 in the Aegina island at M8, 20, 32, 48, and 60 as shown in Figure 4a–e and Figure 5a–e, respectively. Different level of risk and the corresponding ratings/values assigned per assessed environmental parameter were classified in terms of quality and quantity according to Figure 3.
By comparing risk matrices created prior to (until Μ32) and after the effect of SP (M48 and 60), it is obvious that signs of improvement in all risk parameters (except for Zn and Cu) were obtained in the pilot field of AF1, suggesting that the developed and applied SP strategies had a positive impact in the pistachio production. More specifically, the highest improvement was achieved for soil pH and soil organic matter, for which degradation risk was reduced by 50% and 54%, respectively, from the start of field monitoring (Μ8) until its end (Μ60). This result can be attributed to the proper application of agrochemicals/mineral fertilizers (two times per cultivation year/spring-summer) based on frequent monitoring of soil/irrigation water quality as well as due to the sustainable waste management practices adopted by the farmers. In this context, several wastewater and solid waste management practices were applied including (a) collection of wastewater and on-site evaporation into sequential ponds (over a two-month period as a result of the semi-arid conditions prevailing in Aegina island), (b) composting of the generated solid waste (hulls and culls) in an outdoor windrow aerated by periodic turning over a five-month period instead of dumping them at the field site, and (c) biochar production in a small-scale pyrolysis unit using a ring kiln operating in batch mode.
For the same period, soil salinity and irrigation water quality exhibited 13% and 25% lower risk, respectively, due to improved irrigation management practices that enhanced soil fertility and increased leaching efficiency as well as minimized the negative effects associated with soil salinity i.e., groundwater overpumping and sea water intrusion. Finally, in terms of heavy metals, 14% lower risk was calculated for Mn, while 11% and 6% greater risk was calculated for Cu and Zn, respectively. These impacts were mainly attributed to the sprayed doses of minor elements (Zn and Cu applied as sulfates) in the pilot field and their unavoidable leaching to cultivated soil due to irrigation [34,35]. Regarding the pilot field AF2, positive effect in all risk parameters (except for Mn) were obtained based on the degradation risk matrices created prior to (until M32) and after the effect of SP (M48 and M60). For the entire period (M8 to M60), the highest improvement was achieved for soil salinity, for which the degradation risk was reduced by 64% due to application of several soil washing practices (e.g., irrigation with water of good quality, or salt flushing) applied in this pilot field as a result of SP implementation, followed by soil organic matter (−57%) and soil pH (−50%), respectively.
The latter lower risk values were obtained as a result of the proper application of agrochemicals/mineral fertilizers (two times per cultivation year/spring-summer) along with the frequent monitoring of soil/irrigation water quality. Finally, in terms of heavy metals, 10% and 6% lower risk values were calculated for Cu and Zn due to SP adoption, respectively, while 6% greater risk was calculated for Mn, respectively. Since no further treatment with minor elements was applied in the AF2 pilot field, Cu and Zn exhibited lower concentration due to soil washing. On the other hand, it is believed that the greater concentration of Mn measured after the SP implementation in the AF2 field is attributed to the greater content of clay and silt in soil compared to AF1 field (70% vs. 48%) (Figure S5a,b), as also indicated in other studies [36].
Regarding the KF1 pilot field, five overall risk matrices were created in total in the beginning of field monitoring campaign (M8), and at M20, M32, M48, and M60 as shown in Figure 6a–e. Different levels of risk and the corresponding ratings/values assigned per assessed environmental parameter were classified in terms of quality and quantity according to Figure 3. As expected, positive effect in all risk parameters were obtained for the KF1 field based on the degradation risk matrices created prior to (until M32) and after the effect of SP (M48 and M60). For the entire period (M8 to M60), the highest improvement was achieved for soil pH (−58%) and irrigation water quality (−45%) in terms of risk identified.
In general, the total degradation risk values obtained from the five corresponding risk matrices in AF1 pilot field varied from 126 (M8) to 104 (M60), whereas the corresponding total degradation risk values for the AF2 pilot field varied from 128 (M8) to 94 (M60) (Table 4). According to the risk values presented in Table 4, both pilot fields located in Aegina exhibited lower risk after the SP application, thus indicating environmental improvement due to the applied sustainable strategies. The improvement was the result of activities such as proper irrigation and application of agrochemicals/mineral fertilizers based on frequent monitoring of soil/irrigation water quality, as well as proper management and use of pistachio wastes such as composting of solid waste and reuse as organic fertilizers/soil additives.
On the other hand, total degradation risk values obtained from the corresponding risk matrices in the KF1 field in Kilkis were lower compared to the ones indicated for the pilot fields in Aegina. The better environmental profile in Kilkis is mainly due to lower inherent risk as a result of better IWQ and reduced soil salinity in the study area. Thus, the total degradation risk values obtained in the KF1 pilot field varied from 119 (M8) to 79 (M60) and were reduced by 34%. However, for the same period, significantly reduced degradation risk values were observed in the pilot fields AF1 and AF2 i.e., 17% and 27%, respectively.

4. Conclusions

The present study was carried out to assess the improvement of environmental quality of three pistachio fields, two in Aegina and one in Kilkis in Greece, over time due to the developed and applied sustainable strategies in terms of prevailing climate conditions and quality of final product. In this context, first, several risk maps as vertical profiles were created for the most important soil and water parameters i.e., soil pH, soil organic matter, soil salinity, heavy metals content (Mn, Cu, and Zn), and irrigation water quality. Environmental risk assessment was conducted based upon risk categories identified and assessed in terms of quality and quantity. This approach enables, in an easily measured/defined way, the accurate evaluation of the improvement of the selected environmental parameters in the three studied pilot fields that potentially affect environmental media (mostly, soil, and water).
Based on the obtained results, slight to moderate improvement of environmental quality of the pilot fields in Aegina was identified based upon associated risk matrices. Both pilot fields exhibited lower risk values after the SP application, thus indicating the environmental improvement of the pistachio producing pilot area. To this context, lower risk was determined as a result of proper irrigation and soil washing practices applied, two-season-based application of agrochemicals/mineral fertilizers by taking into account the results of frequent monitoring of soil/irrigation water quality, as well as proper management and use of pistachio wastes i.e., composting of solid waste and reuse as organic fertilizers/soil additives. On the other hand, better environmental profile was identified in Kilkis compared to the pilot fields in Aegina mainly due to lower risk associated with improved irrigation water quality and reduced soil salinity.
The overall results obtained in this study showed that ERA tools such as vertical profiles and matrices can be useful in directing scientists, farmers, policy makers and other interested stakeholders to design, develop, and apply sustainable cultivation management practices, which will minimize and prevent the negative impacts during the life cycle of an agricultural product such as pistachio and improve the environmental quality in the affected areas, as well as the quality of life. Finally, it is believed that the methodology applied in this study has noticeable transferability potential and can be easily applied in other agricultural areas and in other cultivations in Greece and other Mediterranean countries.

Supplementary Materials

The following are available online at https://www.mdpi.com/2071-1050/12/14/5735/s1, Table S1: Irrigation water quality criteria classification, Table S2: Classification for infiltration and permeability risk, Table S3: Classification for trace element toxicity, Figure S1: Vertical variation of soil pH (a–c) and soil organic matter (d–f) in the pilot fields AF1, AF2 and KF1 for selected sampling periods, respectively, Figure S2: Vertical variation of soil salinity (a–c) and manganese (d–f) in the pilot fields AF1, AF2 and KF1 for selected sampling periods, respectively, Figure S3: Vertical variation of copper (a–c) and zinc (d–f) in the pilot fields AF1, AF2 and KF1 for selected sampling periods, respectively, Figure S4: Vertical variation of IWQ index (a–c) in the pilot fields AF1, AF2 and KF1 for selected sampling periods, respectively, Figure S5: Soil texture in the pilot fields of (a) AF1 and (b) AF2 according to universal soil classification

Author Contributions

Conceptualization, G.B. and K.K.; methodology, G.B.; software, G.B.; validation, G.B. and K.K.; investigation, G.B.; writing—original draft preparation, G.B.; writing—review and editing, K.K.; project administration, K.K.; funding acquisition, K.K. All authors have read and agreed to the published version of the manuscript.

Funding

This research was funded by the European Commission (LIFE+ Environment Policy & Governance) in the framework of the project “Sustainable strategies for the improvement of seriously degraded agricultural areas: The example of Pistacia vera L (AgroStrat)” www.agrostrat.gr, Grant number LIFE11 ENV/GR/000951.

Acknowledgments

The authors wish to acknowledge the assistance of two anonymous reviewers; their critical review and constructive comments improved the quality of the initially submitted manuscript.

Conflicts of Interest

The authors declare no conflict of interest.

Appendix A. Risk Categories Identified and Assigned for Selected Environmental Parameters Used in this Study

Appendix A.1. Soil pH

Agronomists and other soil scientists consider soil pH as the single most dominant variable of soil, because it affects plant nutrient availability by controlling the chemical and biological properties of the nutrients (N, P, and K). Depending on the suitability for cultivation and the associated environmental impact, soil pH is characterized by nine different risk zones based on its value (Figure A1). The optimum pH range for most crops range between 7.4 and 7.8, while satisfactory conditions for most crops also prevail at soil pH values between 6.0 and 7.4
Figure A1. Risk categories identified and assigned to soil pH.
Sustainability 12 05735 g0a1

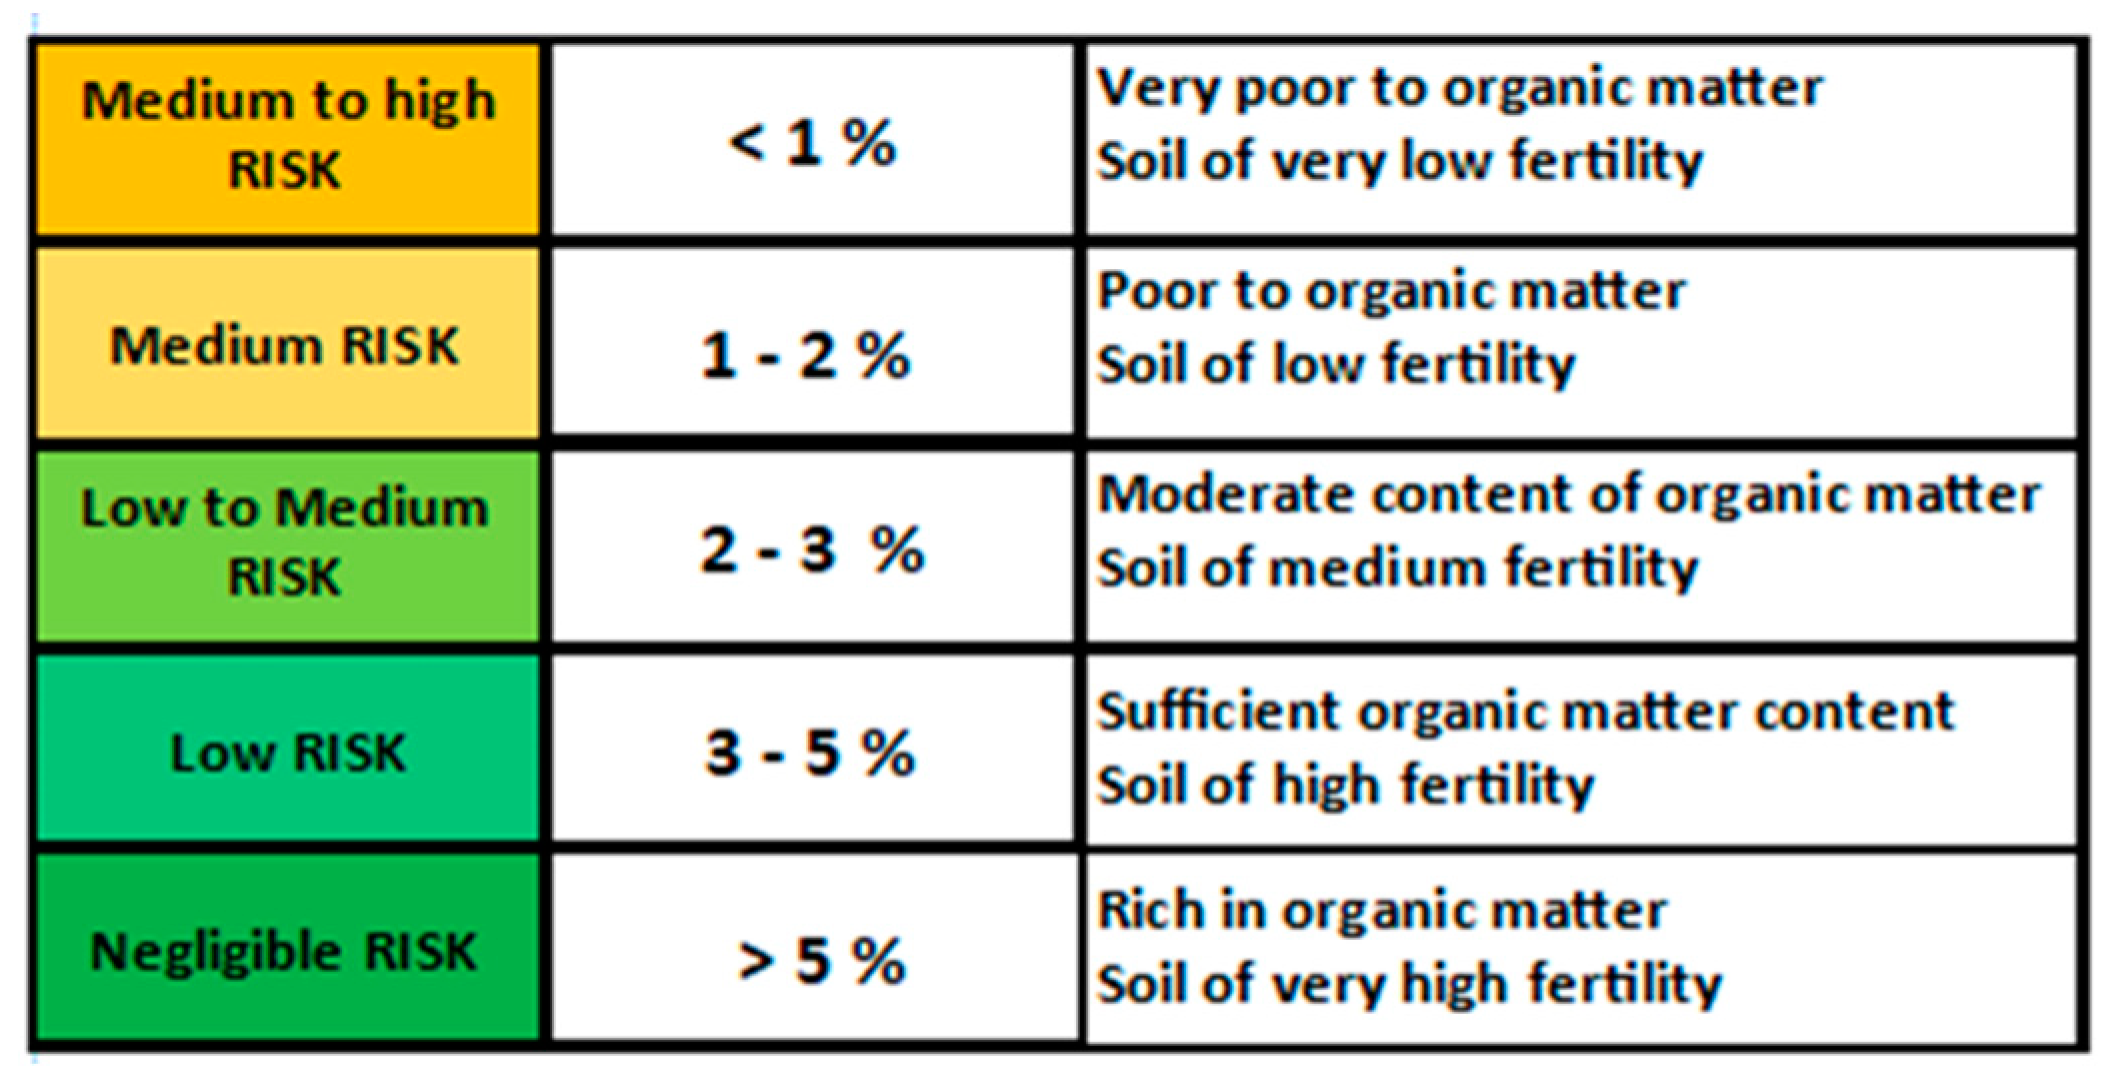
Appendix A.2. Soil Organic Matter

Soil organic matter is considered as the most important variable that influences sorption of compounds in soil and eventually predicts its future toxicity [37]. It mainly acts as storehouse of essential plant nutrients and plays an important role in maintaining soil fertility. Depending on its measured fraction (%), five risk categories were assigned as shown in Figure A2.
Figure A2. Risk categories identified and assigned to soil organic matter (in %).
Sustainability 12 05735 g0a2

Appendix A.3. Soil Salinity

Soil salinity is considered as a significant problem for agriculture under irrigation and an enormous threat to environmental resources and human health in many countries. It may cause ion toxicity, soil erosion, nutrient (N, Ca, K, P, Fe, Zn) deficiency, oxidative and osmotic stress on plants, and thus limits water uptake from soil and in turn yield. Soil salinity significantly minimizes the phosphorus (P) uptake by plants because phosphate ions precipitate in the presence of Ca ions [38,39]. The risk categories assigned to soil salinity were established for five classes, based upon measured electrical conductivity values in μS/cm (Figure A3).
Figure A3. Risk categories identified and assigned to soil salinity (in μS/cm).
Sustainability 12 05735 g0a3

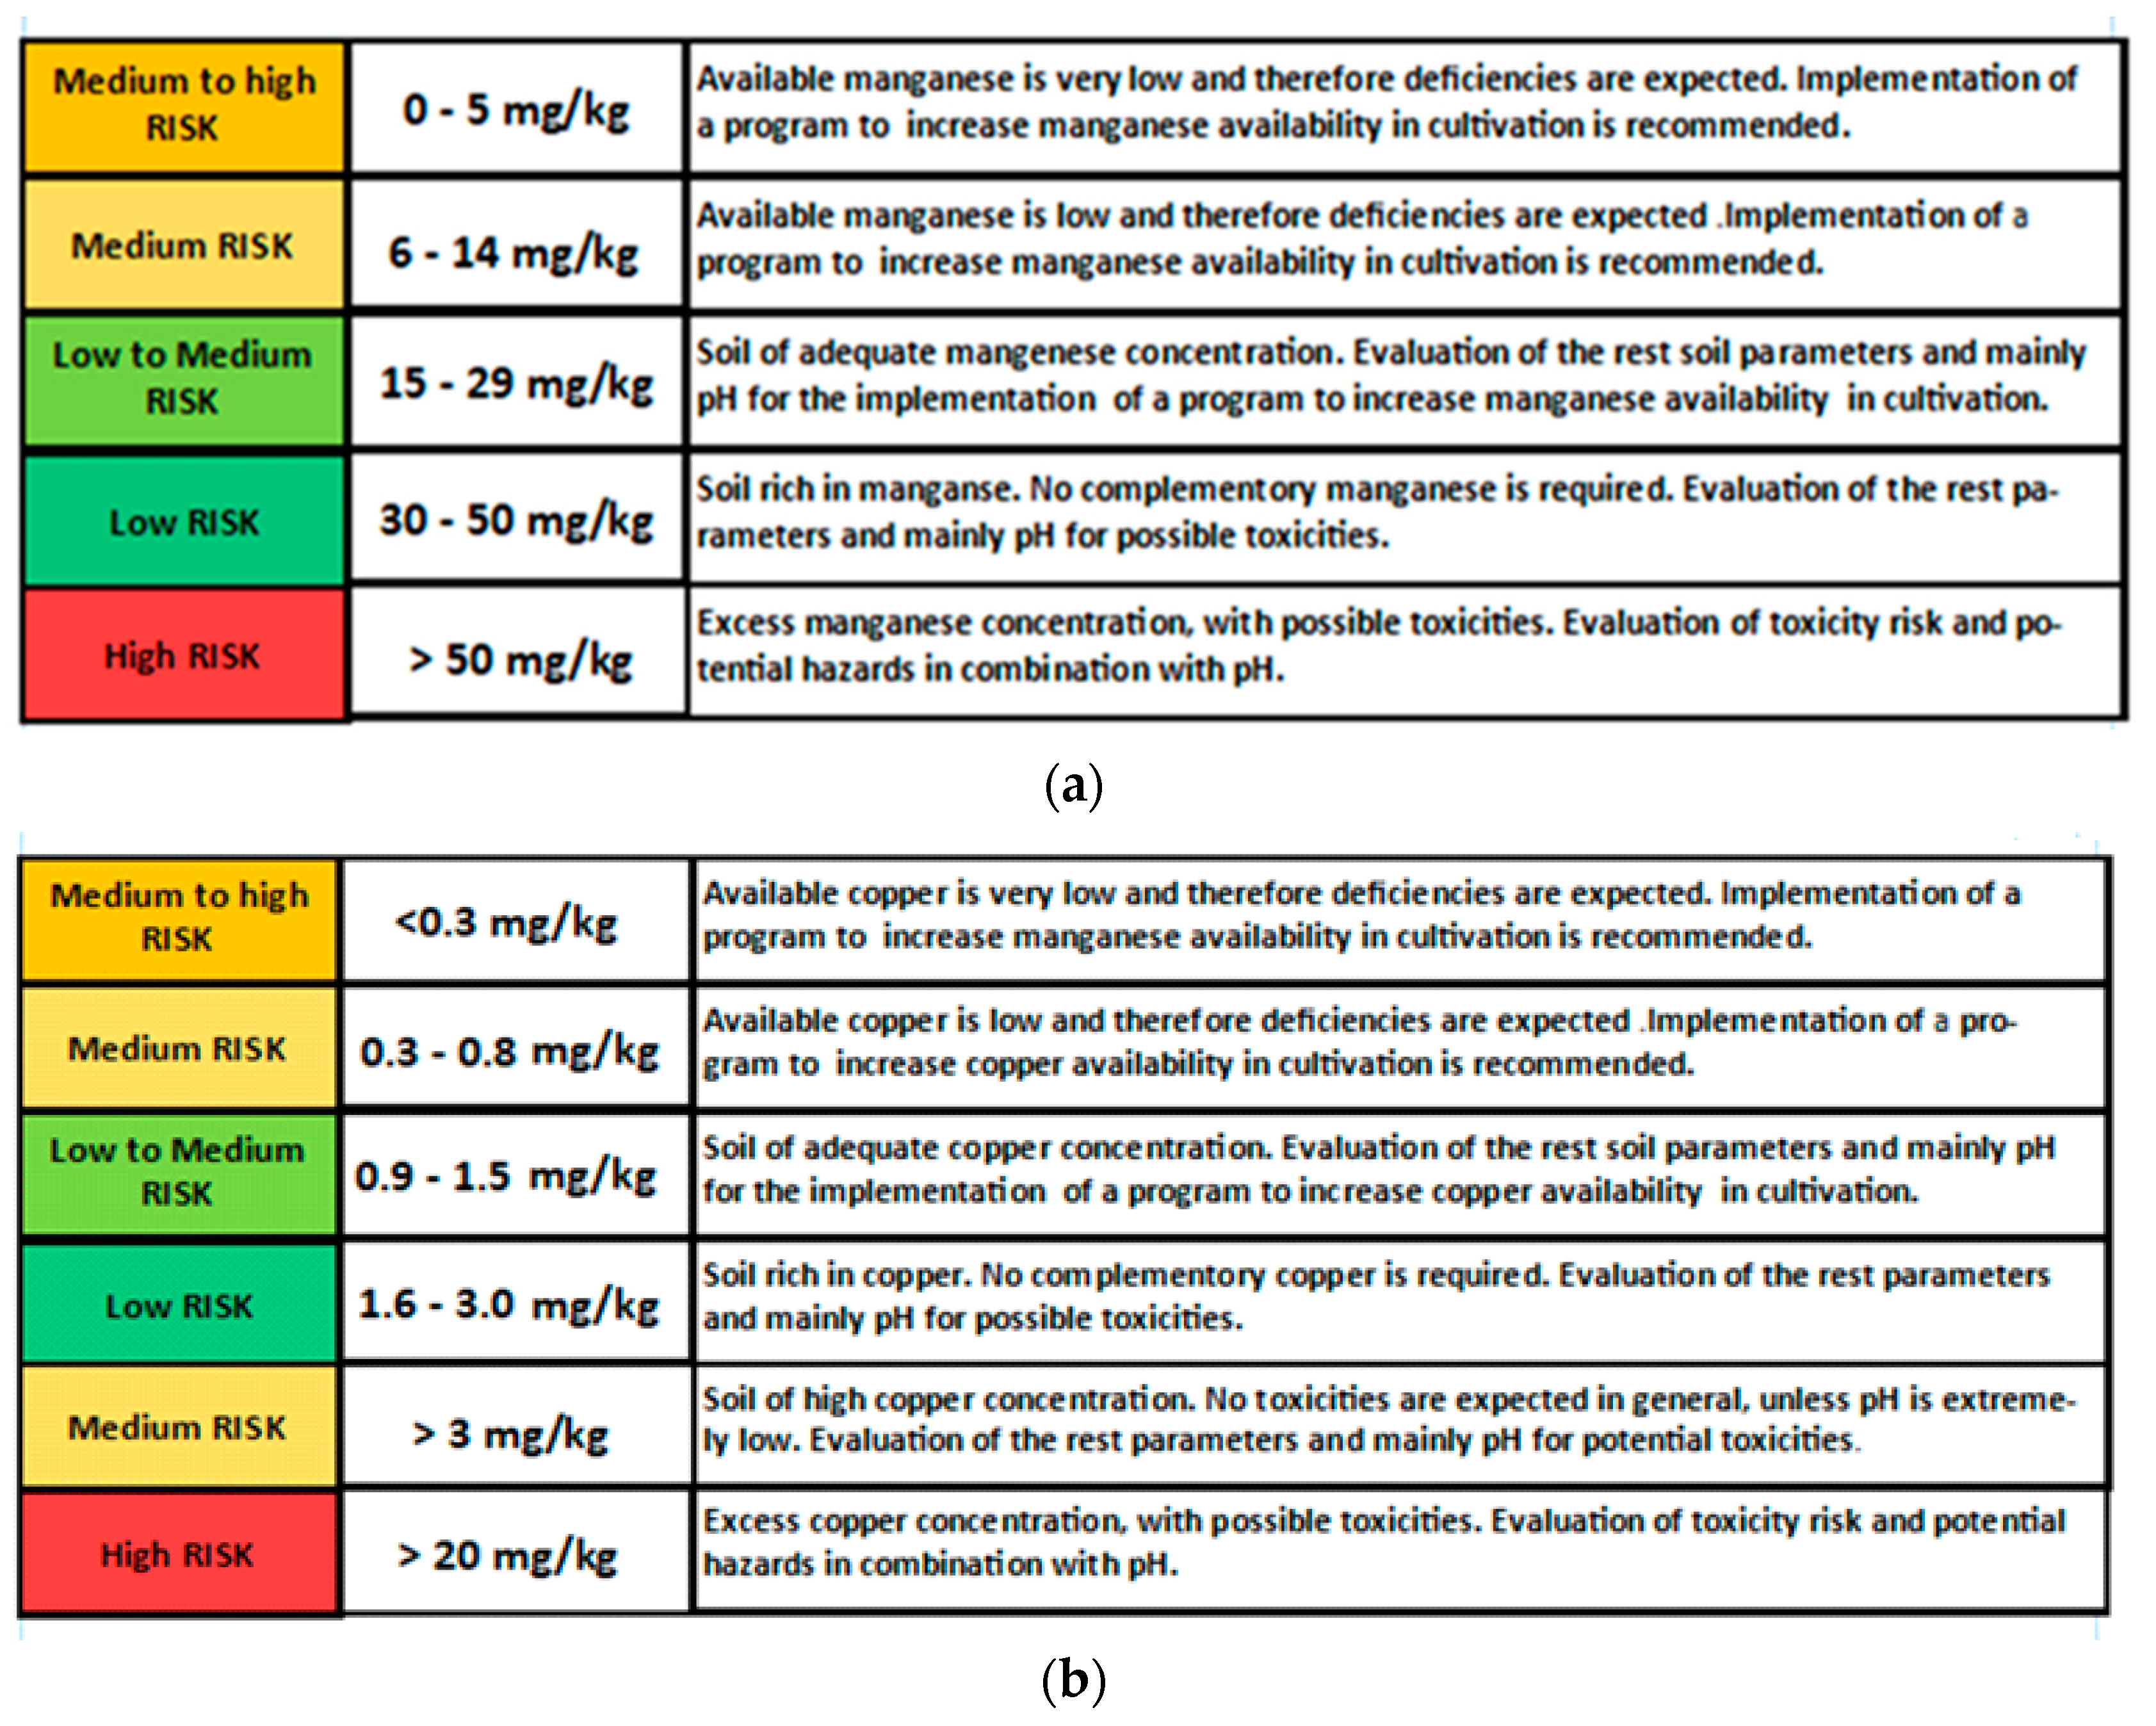
Appendix A.4. Heavy Metals

Regarding heavy metals, potentially toxic elements, namely Mn, Cu, and Zn, were selected since they have the highest probability to cause harm. Copper belongs to those elements that may be harmful in higher doses and cause gastrointestinal distress, damage to liver, the immune system, neurological-related problems, and reproductive ability [40]. On the other hand, even though Zn is an essential element for both plants and humans, it is toxic in high concentrations [6]. Therefore, it is important not only to control its concentration in agricultural soils, but also to take measures against its presence as it may cause direct toxic effects and, among others, problems related to gastrointestinal and immunologic human activities. Regarding Mn, it is well known that it is toxic to crops in acidic soils i.e., under waterlogging its availability in soils increases as soil pH decreases [40]. As a result, the risk categories identified and assessed for Mn, Cu, and Zn were based upon their content against specific thresholds for soil and water contamination and are provided in Figure A4a–c, respectively.
Figure A4. Risk categories identified and assigned to (a) Manganese (Mn), (b) Copper (Cu), and (c) Zinc (Zn) (in mg/kg).
Sustainability 12 05735 g0a4aSustainability 12 05735 g0a4b

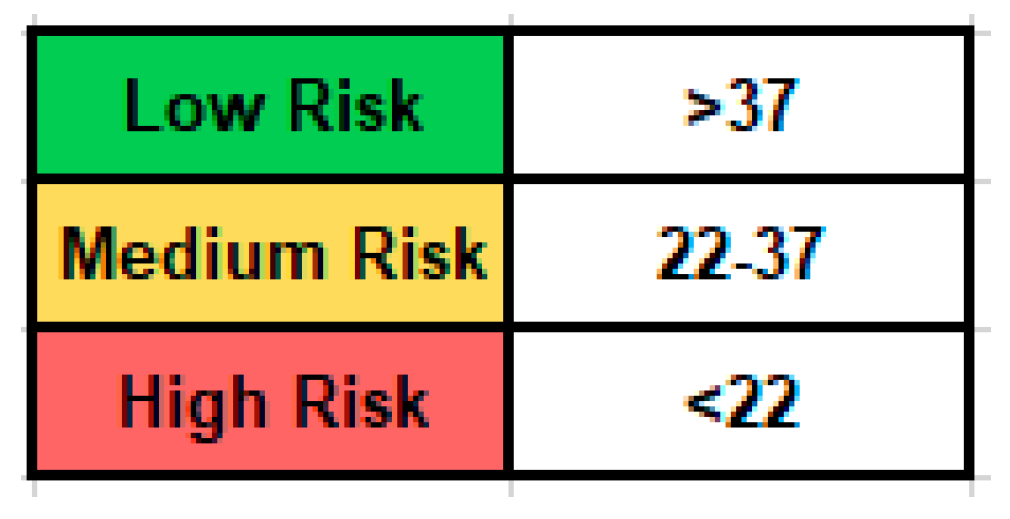
Appendix A.5. Irrigation Water Quality

Based on the values given in Table 3, the total value of the IWQ index is calculated according to the assigned different ratings (i.e., 1, 2, and 3) for each parameter and without changing its weighing coefficient. In this context, three risk categories were identified and assessed for IWQ index and are presented in Figure A5.
Figure A5. Risk categories identified and assigned to IWQ index.
Sustainability 12 05735 g0a5

References

  1. Bartzas, G.; Tinivella, F.; Medini, L.; Zaharaki, D.; Komnitsas, K. Assessment of groundwater contamination risk in an agricultural area in north Italy. Inf. Process. Agric. 2015, 2, 109–129. [Google Scholar] [CrossRef] [Green Version]
  2. Komnitsas, K.; Modis, K.; Doula, M.; Kavvadias, V.; Sideri, D.; Zaharaki, D. Geostatistical estimation of risk for soil and water in the vicinity of olive mill wastewater disposal sites. Desalin. Water Treat. 2016, 57, 2982–2995. [Google Scholar] [CrossRef]
  3. Bartzas, G.; Komnitsas, K. Life cycle analysis of pistachio production in Greece. Sci. Total Environ. 2017, 595, 13–24. [Google Scholar] [CrossRef] [PubMed]
  4. ISO (International Standardisation Organisation). Soil Quality. Procedure for Site-Specific Ecological Risk Assessment of Soil Contamination (Soil Quality TRIAD Approach); ISO: Geneva, Switzerland, 1920. [Google Scholar]
  5. Komnitsas, K.; Zaharaki, D. Assessment of human and ecosystem risk due to agricultural waste compost application on soils: A review. Environ. Forensics 2014, 15, 312–328. [Google Scholar] [CrossRef]
  6. Swartjes, F. Risk-based assessment of soil and groundwater quality in the Netherlands: Standards and remediation urgency. Risk Anal. 1999, 19, 1235–1249. [Google Scholar] [CrossRef]
  7. Bartzas, G.; Zaharaki, D.; Doula, M.; Komnitsas, K. Evaluation of groundwater vulnerability in a Greek island using GIS-based models. Desalin. Wat. Treat. 2017, 67, 61–73. [Google Scholar] [CrossRef]
  8. Jalali, M.; Jalali, M. Assessment risk of phosphorus leaching from calcareous soils using soil test phosphorus. Chemosphere 2017, 171, 106–117. [Google Scholar] [CrossRef]
  9. Bartzas, G.; Zaharaki, D.; Komnitsas, K. Assessment of Aquifer vulnerability in an agricultural area in Spain using the DRASTIC model. Environ. Forensics 2015, 16(4), 356–373. [Google Scholar] [CrossRef]
  10. Bartzas, G.; Komnitsas, K. Energy flow analysis of irrigated pistachio production in Aegina, Greece. Sustain. Energ. Technol. Assess. 2018, 28C, 73–80. [Google Scholar]
  11. NOA (National Observatory of Athens). Network of Meteorological Stations—Monitoring and Analysis. Available online: http://stratus.meteo.noa.gr/front (accessed on 10 September 2019).
  12. Bartzas, G.; Komnitsas, K. An integrated multi-criteria analysis for assessing sustainability of agricultural production at regional level. Inf. Process. Agric. 2020, 7, 223–232. [Google Scholar] [CrossRef]
  13. US EPA (United States Environmental Protection Agency). Conducting an Ecological Risk Assessment. Available online: https://www.epa.gov/risk/conducting-ecological-risk-assessment (accessed on 21 May 2020).
  14. Zolezzi, M.; Cattaneo, C.; Tarazona, J.V. Probabilistic Ecological Risk Assessment of 1,2,4-Trichlorobenzene at a Former Industrial Contaminated Site. Environ. Sci. Technol. 2005, 39, 2920–2926. [Google Scholar] [CrossRef] [PubMed] [Green Version]
  15. Paladino, O.; Seyedsalehi, M.; Massabò, M. Probabilistic risk assessment of nitrate groundwater contamination from greenhouses in Albenga plain (Liguria, Italy) using lysimeters. Sci. Tot. Environ. 2018, 634, 427–438. [Google Scholar] [CrossRef]
  16. Komnitsas, K.; Zaharaki, D.; Pyliotis, I.; Vamvuka, D.; Bartzas, G. Assessment of pistachio shell biochar quality and its potential for adsorption of heavy metals. Waste Biomass Valor. 2015, 6, 805–816. [Google Scholar] [CrossRef]
  17. Chartzoulakis, K.; Bertaki, M. Sustainable water management in agriculture under climate change. Agric. Agric. Sci. Procedia 2015, 4, 88–98. [Google Scholar] [CrossRef] [Green Version]
  18. Simsek, C.; Gunduz, O. IWQ index: A GIS-integrated technique to assess irrigation water quality. Environ. Monit. Assess. 2007, 128, 277–300. [Google Scholar] [CrossRef]
  19. Von der Gracht, H.A. Consensus measurement in Delphi studies: Review and implications for future quality assurance. Technol. Forecast. Soc. Chang. 2012, 79, 1525–1536. [Google Scholar] [CrossRef]
  20. Dalkey, N.C.; Helmer, O. An experimental application of the Delphi method to the use of experts. Manag. Sci. 1963, 9, 458–467. [Google Scholar] [CrossRef]
  21. Etxeberria, I.A.; Garayar, A.; Calvo Sánchez, J.A. Development of sustainability reports for farming operations in the Basque Country using the Delphi method. Rev. Contab. 2015, 18, 44–54. [Google Scholar]
  22. Ilic, S.; LeJeuneb, J.; Lewis-Ivey, M.L.; Sally Miller, S. Delphi expert elicitation to prioritize food safety management practices in greenhouse production of tomatoes in the United States. Food Control 2017, 78, 108–115. [Google Scholar] [CrossRef] [Green Version]
  23. Ayers, R.S.; Westcot, D.W. Water Quality for Agriculture; FAO Irrigation and Drainage Paper No. 29, Rev. 1; U.N. Food and Agriculture Organization: Rome, Italy, 1985. [Google Scholar]
  24. Nelson, D.W.; Sommers, L.E. Total Carbon, Organic Carbon, and Organic Matter. In Methods of Soil Analysis Part 3—Chemical Methods; Soil Science Society of America; American Society of Agronomy: Madison, WI, USA, 1996; pp. 961–1010. [Google Scholar]
  25. Komnitsas, K.; Modis, K. Soil risk assessment of As and Zn contamination in a coal mining region using geostatistics. Sci. Total Environ. 2006, 371, 190–196. [Google Scholar] [CrossRef]
  26. Gallardo, M.; Thompson, R.B.; Fernandez, M.D. Good Agricultural Practices for Greenhouse Crop Vegetable Crops: Principles for Mediterranean Climate Areas; FAO, Plant Production and Protection: Rome, Italy, 2013; p. 640. [Google Scholar]
  27. Assimakopoulou, A.; Nifakos, K.; Salmas, I.; Alyfantis, N. Preliminary study of the nutritional status of pistachio in Aegina, Greece. Commun. Soil Sci. Plant Anal. 2013, 44, 356–365. [Google Scholar] [CrossRef]
  28. Shiwakoti, S.; Zheljazkov, V.D.; Gollany, H.T.; Kleber, M.; Xing, B. Macronutrients in soil and wheat as affected by a long-term tillage and nitrogen fertilization in winter wheat-fallow rotation. Agronomy 2019, 9, 178. [Google Scholar] [CrossRef] [Green Version]
  29. Preston, W.; da Silva, Y.J.; do Nascimento, C.W.; da Cunha, K.P.; Silva, D.J.; Ferreira, H.A. Soil contamination by heavy metals in vineyard of a semiarid region: An approach using multivariate analysis. Geoderma Reg. 2016, 7, 357–365. [Google Scholar] [CrossRef] [Green Version]
  30. Brunetto, G.; Miotto, A.; Ceretta, C.A.; Schmitt, D.E.; Heinzen, J.; de Moraes, M.P.; Canton, L.; Tiecher, T.L.; Comin, J.J.; Girotto, E. Mobility of copper and zinc fractions in fungicide-amended vineyard sandy soils. Arch. Agron. Soil Sci. 2014, 60, 609–624. [Google Scholar] [CrossRef]
  31. Kallsen, C.E.; Holtz, B.; Villaruz, L.; Wylie, C. Leaf zinc and copper concentrations of mature pistachio trees in response to fertigation. Hort. Technol. 2000, 10, 172–176. [Google Scholar] [CrossRef]
  32. Franzluebbers, A.J.; Hons, F.M. Soil-profile distribution of primary and secondary plantavailable nutrients under conventional and no tillage. Soil Tillage Res. 1996, 39, 229–239. [Google Scholar] [CrossRef]
  33. Karakuş, C.B.; Yıldız, S. Evaluation for irrigation water purposes of groundwater quality in the vicinity of Sivas City Centre (Turkey) by using GIS and an irrigation water quality index. Irrig. Drain. 2020, 69, 121–137. [Google Scholar] [CrossRef]
  34. Keshavarz, P.; Malakouti, M.J.; Karimian, N.; Fotovat, A. The Effects of Salinity on Extractability and Chemical Fractions of Zinc in Selected Calcareous Soils of Iran. J. Agric. Sci. Tech. 2016, 8, 181–190. [Google Scholar]
  35. Eskandari, S.; Mozaffari, V. Interactive Effect of Soil Salinity and Copper Application on Growth and Chemical Composition of Pistachio Seedlings (cv. Badami). Commun. Soil Sci. Plant Anal. 2014, 45, 688–702. [Google Scholar] [CrossRef]
  36. Osman, K.T. Plant nutrients and soil fertility management. In Soils: Principles, Properties and Management; Springer: Heidelberg, Germany, 2013; pp. 129–159. [Google Scholar]
  37. Haynes, R.J. Soil Organic Matter Quality and the Size and Activity of the Microbial Biomass: Their Significance to the Quality of Agricultural Soils. In Soil Mineral Microbe-Organic Interactions; Huang, Q., Huang, P.M., Violante, A., Eds.; Springer: Heidelberg, Germany, 2008; pp. 201–231. [Google Scholar]
  38. Bano, A.; Fatima, M. Salt tolerance in Zea mays (L.) following inoculation with Rhizobium and Pseudomonas. Biol. Fertil. Soils 2009, 45, 405–413. [Google Scholar] [CrossRef]
  39. Sharma, B.; Molden, D.; Cook, S. Water use efficiency in agriculture: Measurement, current situation and trends. In Managing Water and Fertilizer for Sustainable Agricultural Intensification; Drechsel, P., Heffer, P., Magen, H., Mikkelsen, R., Wichelns, D., Eds.; International Fertilizer Industry Association (IFA): Paris, France; International Water Management Institute (IWMI): Colombo, Sri Lanka; International Plant Nutrition Institute (IPNI): Peachtree Corners, GA, USA; International Potash Institute (IPI): Horgen, Switzerland, 2015; pp. 39–64. [Google Scholar]
  40. ATSDR (United States Agency for Toxic Substances and Disease Registry). Toxicological Profile for Copper; U.S. Department of Health and Human Services: Washington, DC, USA, 2004; p. 272.
Figure 1. Location and altitude map of the three pilot fields studied in Aegina island (AF1 and AF2) and Kilkis (KF1).
Sustainability 12 05735 g001
Figure 2. Flow diagram of the integrated environmental risk assessment (ERA) methodology implemented stepwise in this study.
Sustainability 12 05735 g002
Figure 3. Classification of risk categories identified in terms of quality and quantity.
Sustainability 12 05735 g003
Figure 4. Overall risk matrices created for the pilot field of AF1 in the Aegina island at selected sampling periods i.e., (a) M8, (b) M20, (c) M32 (prior) and (d) M48 and (e) M60 (after the effect of SP).
Sustainability 12 05735 g004aSustainability 12 05735 g004b
Figure 5. Overall risk matrices created for the pilot field of AF2 in the Aegina island at selected sampling periods i.e., (a) M8, (b) M20, (c) M32 (prior) and (d) M48 and (e) M60 (after the effect of SP).
Sustainability 12 05735 g005aSustainability 12 05735 g005b
Figure 6. Overall risk matrices created for the pilot field of KF1 in Kilkis at selected sampling periods i.e., (a) M8, (b) M20, (c) M32 (prior) and (d) M48 and (e) M60 (after the effect of SP).
Sustainability 12 05735 g006
Table 1. Main cultivation characteristics of the three pistachio fields prior the effect of the sustainable practices (SP) applied.
Cultivation CharacteristicsPilot Fields
AF1AF2KF1
SpeciesPistacia vera. L
Cultivar nameAeginaAeginaPontikis
Area (ha)0.10.10.1
Orchard age (years)706018
Density (trees per ha)300250270
Average Yield (kg/ha) 1230220170
Harvest period1st week of September
Irrigation techniquedrip irrigation
Irrigation periodApril to September
Conventional Fertilization
Primary Nutrient Content (in kg/ha)
Νitrogen (N)23026590
Phosphorus (P)705090
Potassium (K)200190130
Pest control (in kg/ha)
Copper3.0 (oxychloride)1.5 (hydroxide)
Waste Management
Solids (culls, hulls, prunings, dead trees, etc.On farm dumping
Wastewaters (dehulling effluents)Uncontrolled disposal
1 Refers to the first 48-month period.
Table 2. Main cultivation characteristics of the SP applied in the three pistachio fields.
Cultivation CharacteristicsPilot Fields
AF1AF2KF1
Month SP applied484848
Yield (kg/ha) 1,2240 (+4%)230 (+5%)170 (−)
Sustainable irrigation2Soil washing (+12% water applied)Soil washing (+11% water applied)Soil washing (+5% water applied)
Sustainable Fertilization
(i) Primary Nutrient Content (in kg/ha)
Νitrogen (N)2140 (−39%)120 (−55%)90 (0%)
Phosphorus (P)
Potassium (K)
(ii) Secondary Nutrient Content (in kg/ha)
Iron (as Fe-EDDHA/6.5% Fe)4
Boron (as Borax/11% B)4.951.541.54
Zinc (Zn Sulfate /22.5 % Ζn)33
Sustainable Waste Management
Solids (culls, hulls, prunings, dead trees, etc.Composting in windrows/biochar productionComposting in windrowsComposting in piles
Wastewaters (dehulling effluents)Evaporation in two sequential pondsEvaporation in five sequential ponds
1 Refers to the last 12-month period (i.e., from M49-M60); 2 Change in quantity after the SP effect.
Table 3. Classification of risk based on irrigation water quality (IWQ) index parameters.
RiskWeightParameterRangeRatingSuitability
Salinity5Electrical conductivity (µS/cm)EC < 7003High
700 < EC < 30002Medium
EC > 30001Low
Infiltration and Permeability4See Table S2 in the Supplementary Materials for details
Specific ion toxicity3Sodium adsorption ratio (−)SAR < 3.03High
3.0 < SAR < 9.02Medium
SAR > 9.01Low
Chloride (mg/L)Cl < 1403High
140 < Cl < 3502Medium
Cl > 3501Low
Trace element toxicity2See Table S3 in the Supplementary Materials for details
Miscellaneous effects to sensitive crops1Nitrate-Nitrogen (mg/L)NO3 N < 5.03High
5.0 < NO3 N < 30.02Medium
NO3 N > 30.01Low
Bicarbonate (mg/L)HCO3 < 903High
90 < HCO3 < 5002Medium
HCO3 > 5001Low
pH7.0 < pH < 8.03High
6.5 < pH < 7.0 and
8.0 < pH < 8.5
2Medium
pH < 6.5 and pH > 8.51Low
Table 4. Overall risk values for the three pilot fields under study.
Month (M)Overall Risk Value for Pilot FieldsOverall Risk Category for Pilot Fields
AF1AF2AF3AF1AF2KF1
8 1126128119Medium to highMedium to highMedium
20 1124123112MediumMediumMedium
32 1121119107MediumMediumMedium
48 210910192MediumLow to MediumLow to Medium
60 21049479Low to MediumLow to MediumLow
1 Prior to SP application; 2 After SP application.

