Uncertainty in Flood Mitigation Practices: Assessing the Economic Benefits of Property Acquisition and Elevation in Flood-Prone Communities


Abstract
1. Introduction
2. Methods
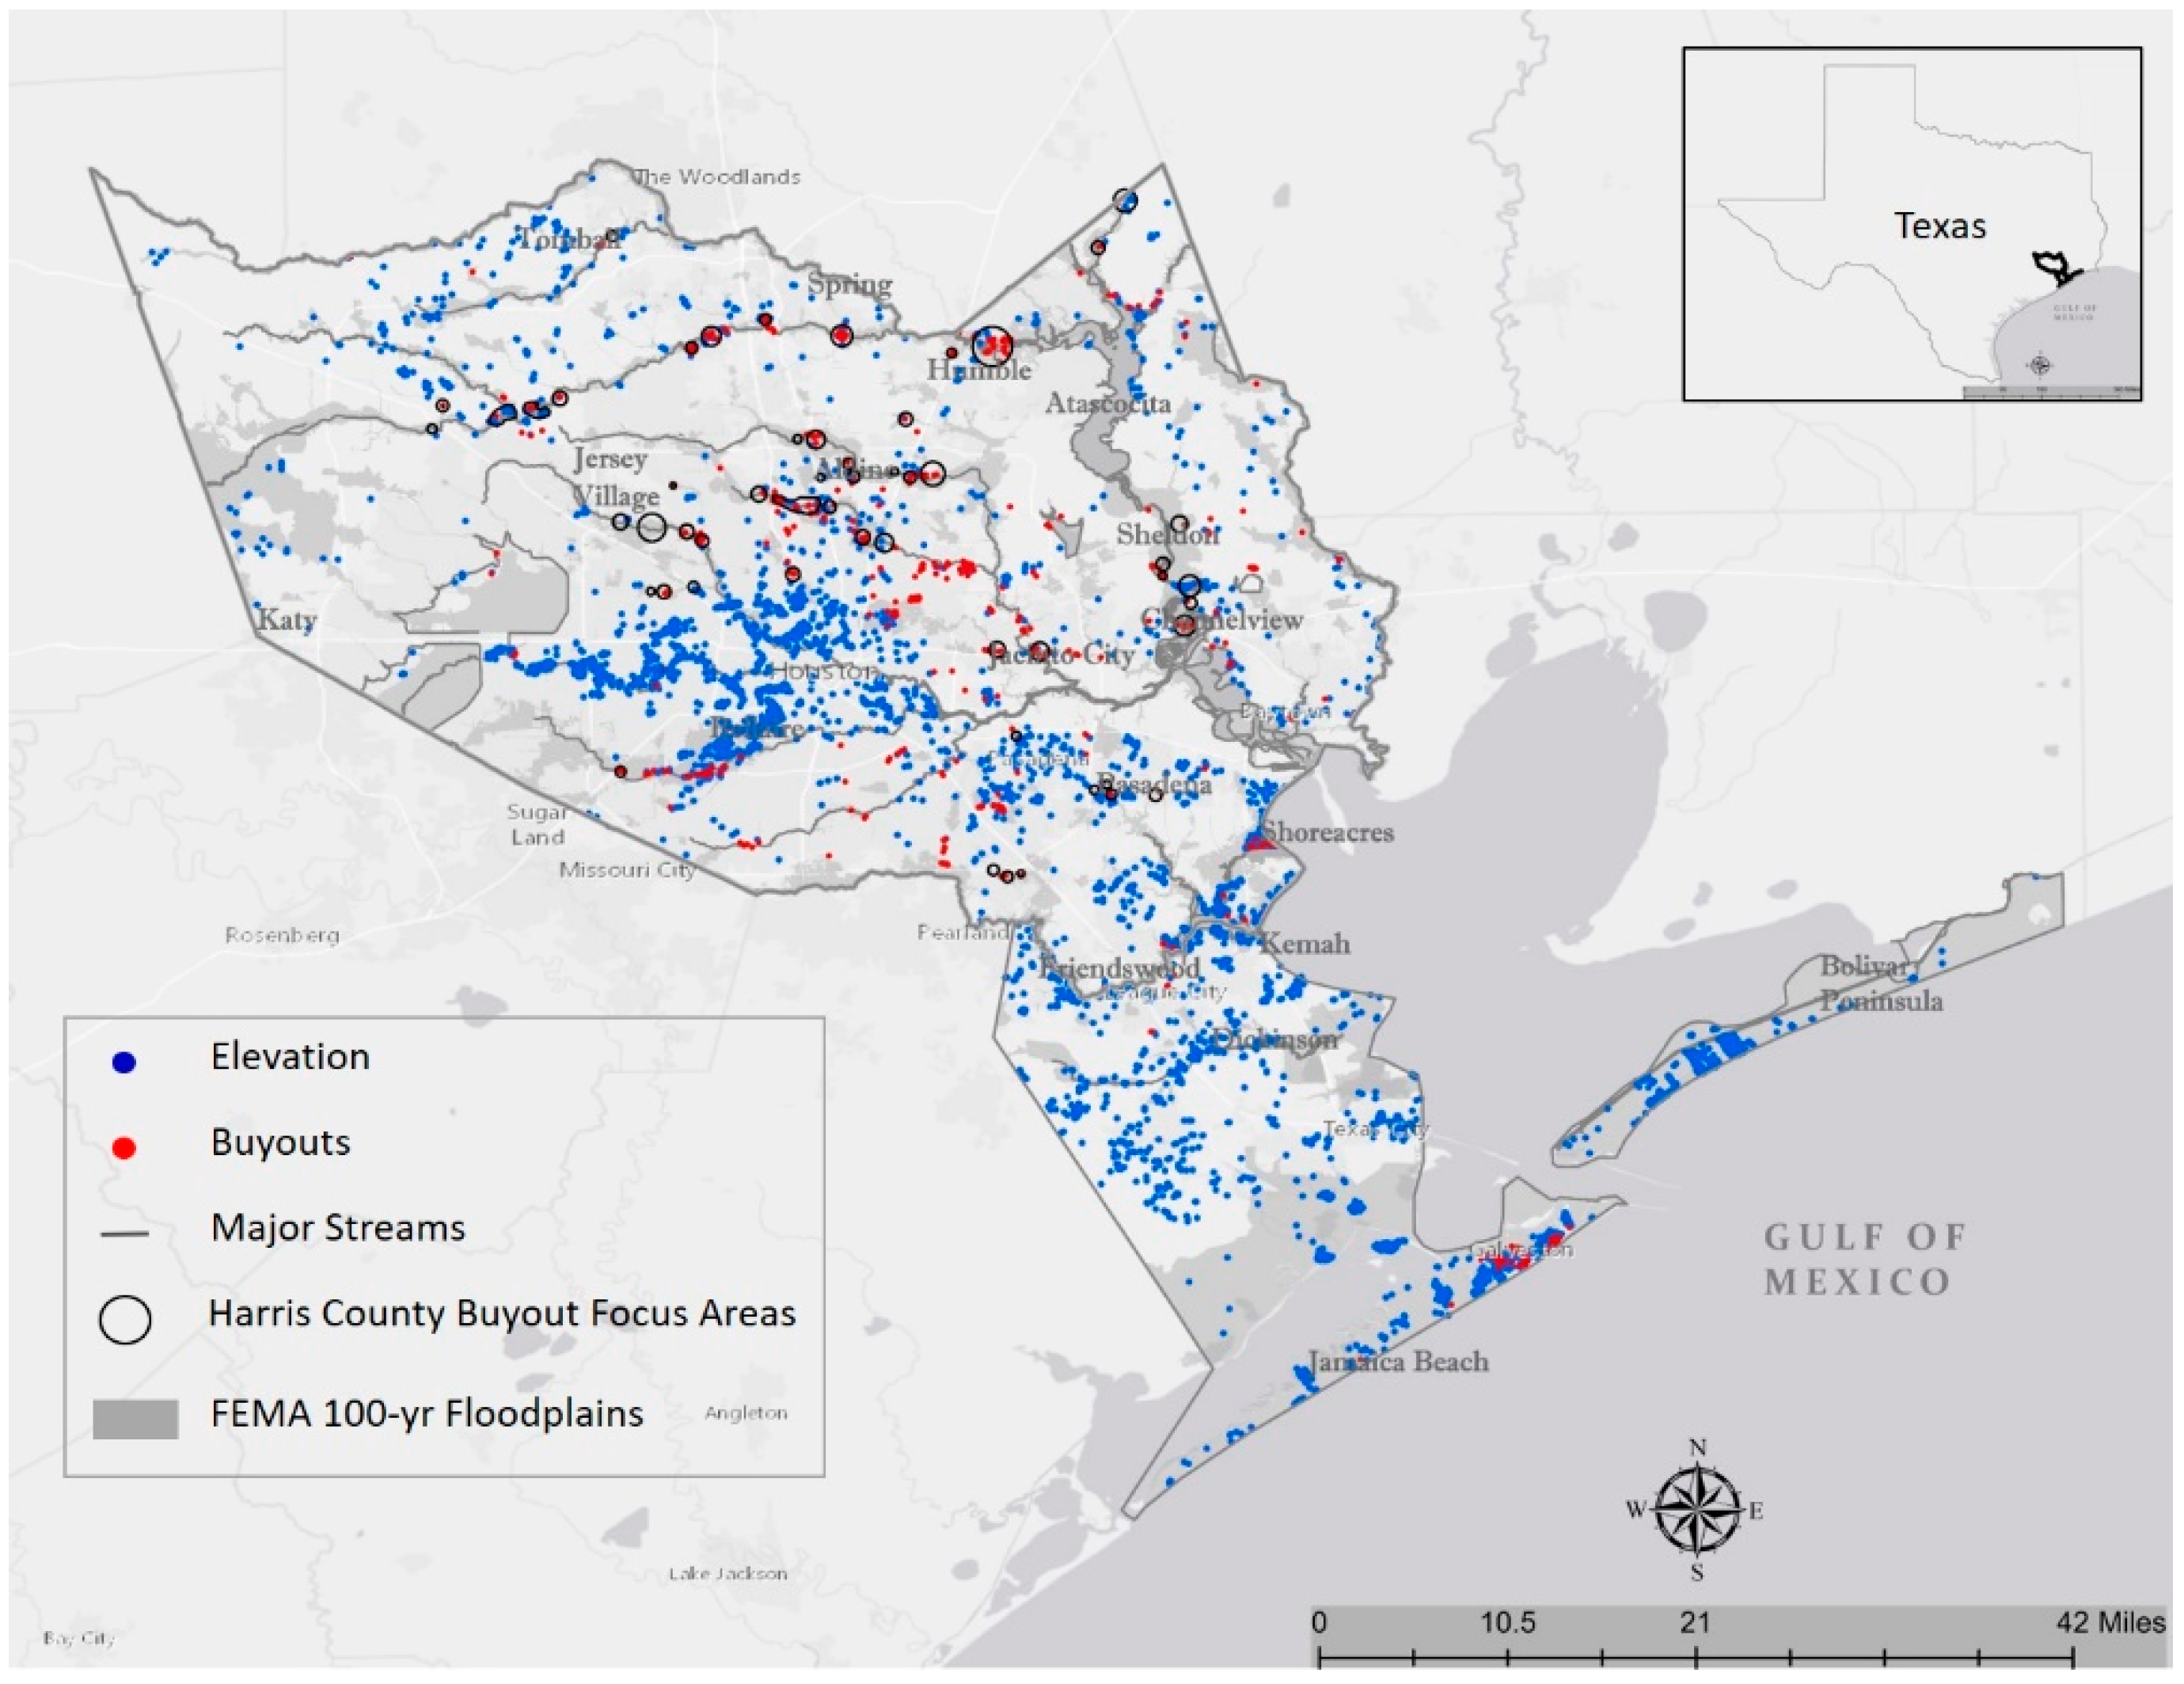
2.1. Study Area
2.2. Buyout and Elevation Analysis
2.3. Uncertainty Analysis
- Buyout structures: the number of recommended structures to be bought out given uncertainties;
- Elevation structures: the number of recommended structures to be elevated given UNCERTAINTIES;
- Buyout savings: total savings from bought-out structures given uncertainties;
- Buyout cost: total cost from bought-out structures given uncertainties;
- Buyout BCR: total benefit to cost ratio from bought-out structures given uncertainties;
- Elevation savings: total savings from elevated structures given uncertainties;
- Elevation cost: total cost from elevated structures given uncertainties;
- Elevation BCR: total benefit to cost ratio from elevated structures given uncertainties.
3. Results
3.1. Uncertainty Scenarios
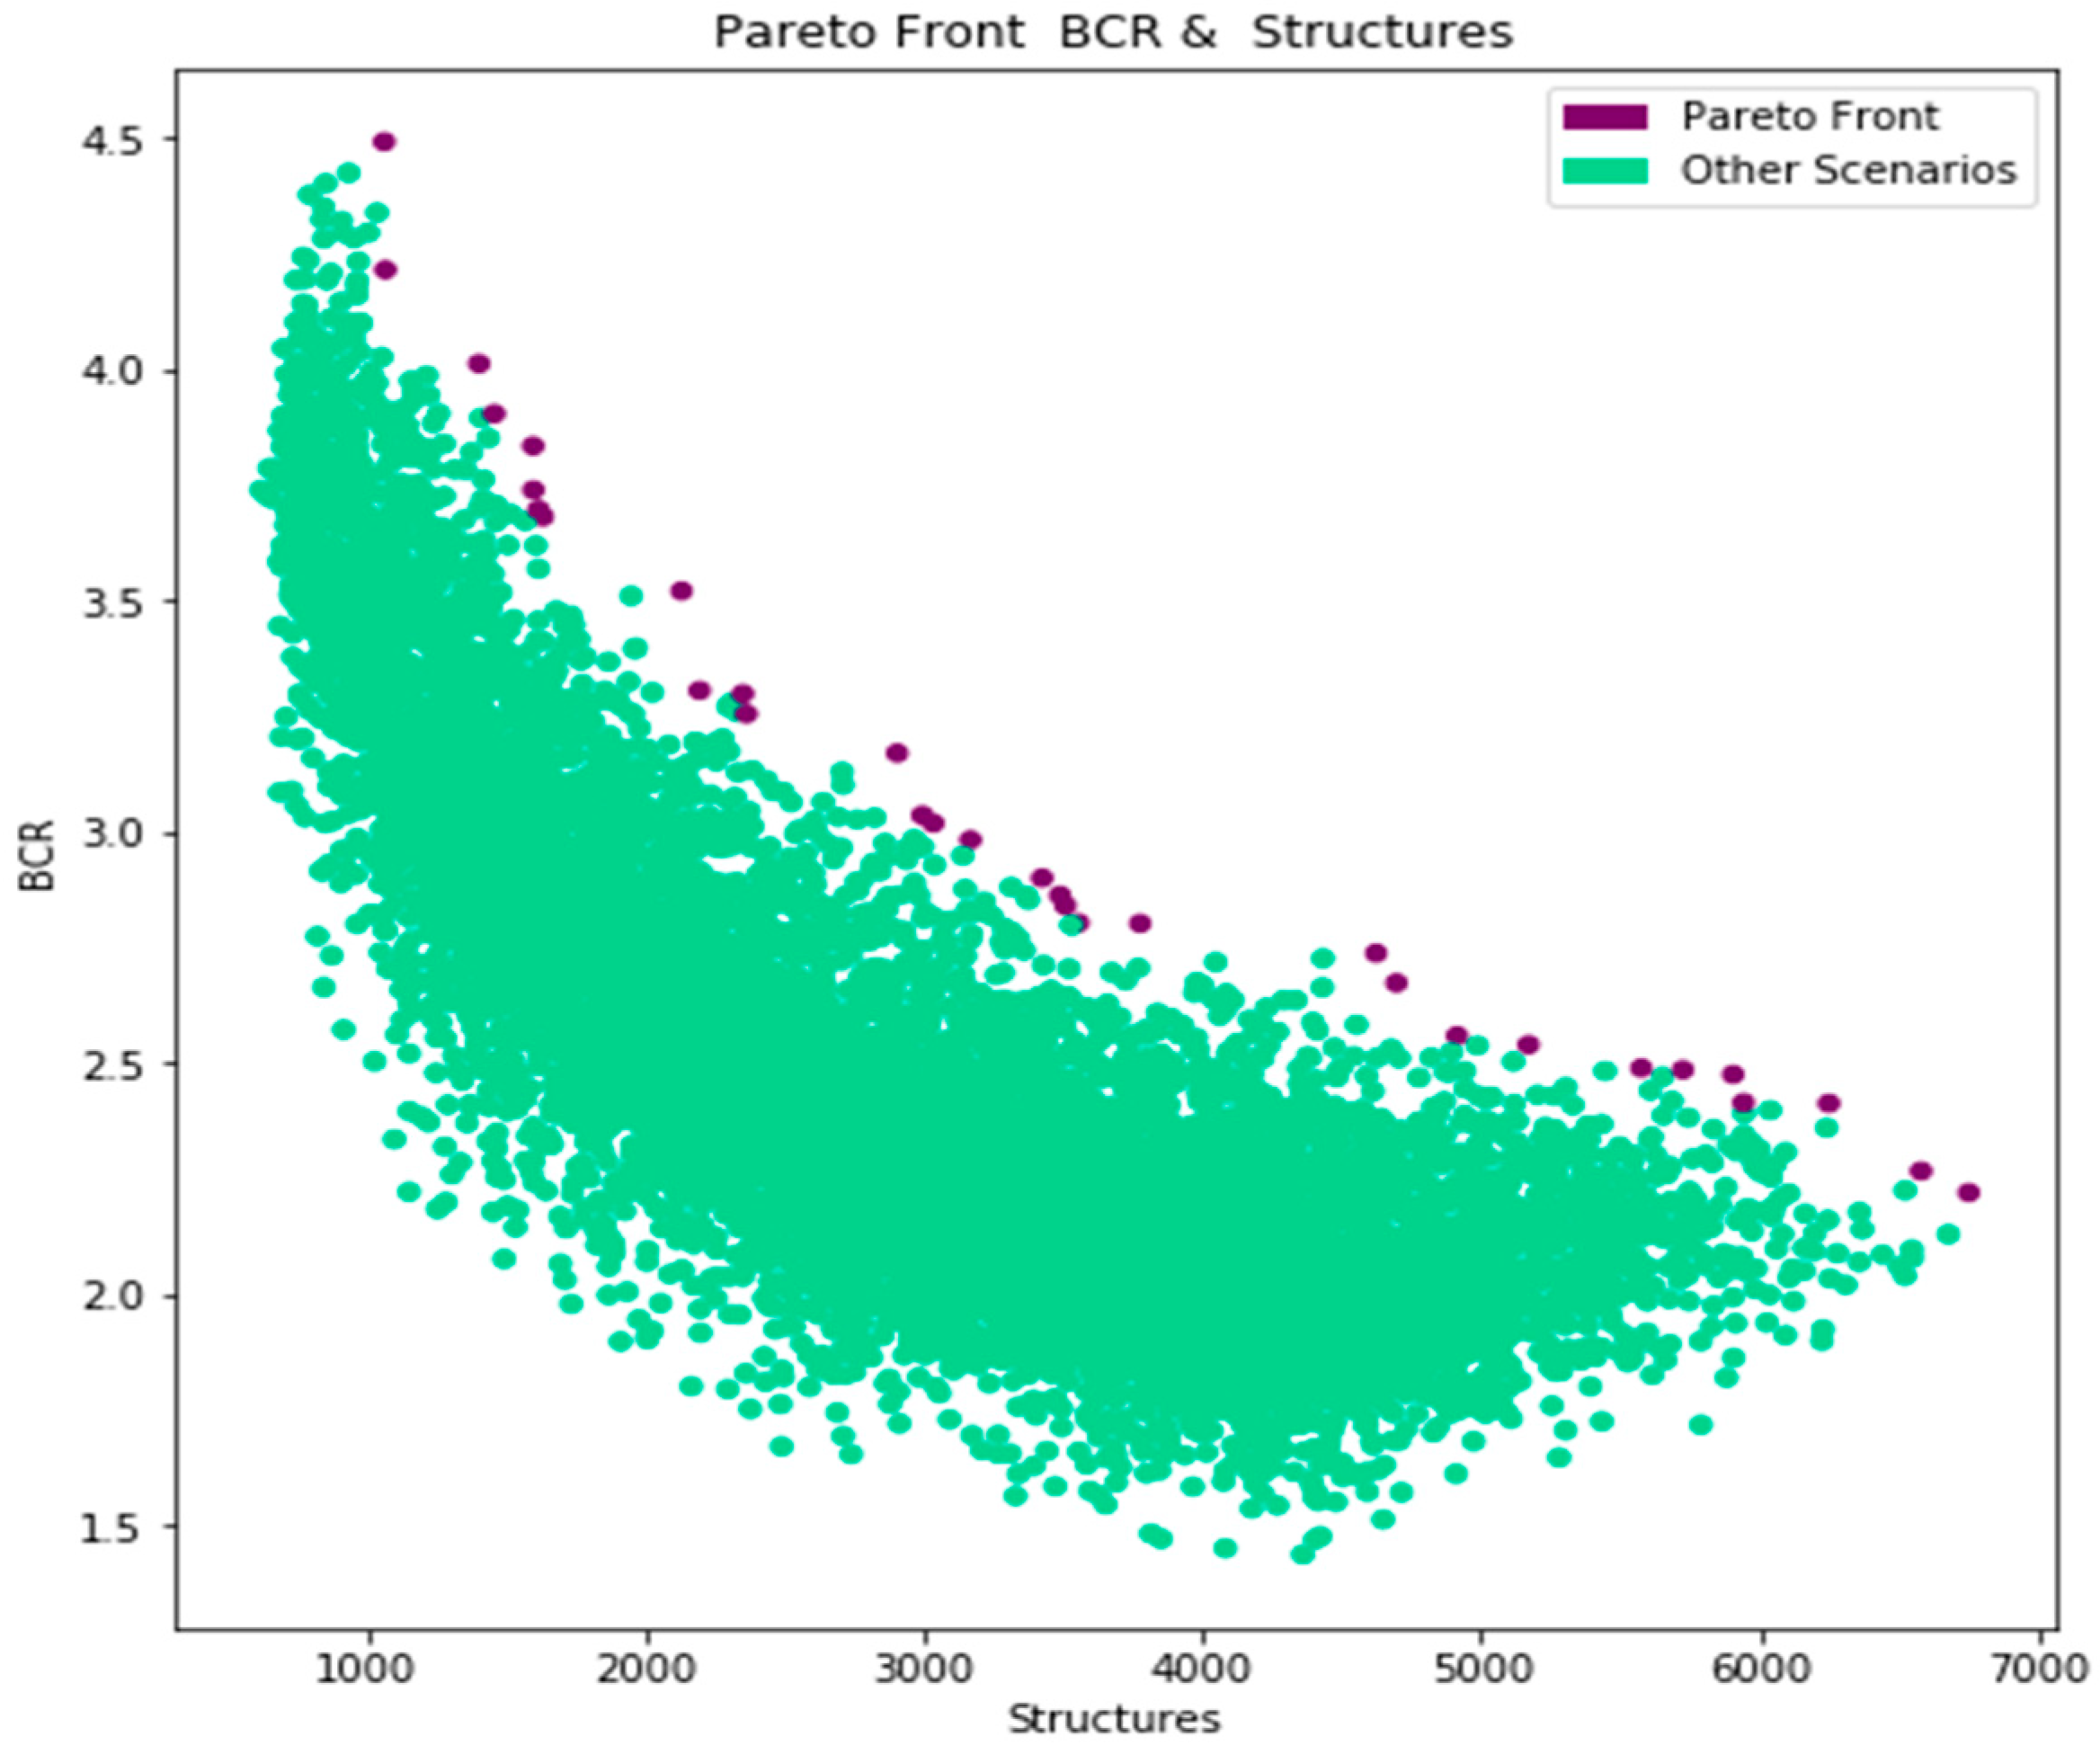
3.2. Pareto Front Analysis
3.3. Spatial Distribution of Scenarios
3.4. PRIM Results
4. Discussion
5. Conclusions
Author Contributions
Funding
Acknowledgments
Conflicts of Interest
References
- Montgomery, M.; Kunreuther, H. Pricing storm surge risks in Florida: Implications for determining flood insurance premiums and evaluating mitigation measures. Risk Anal. 2018, 38, 2275–2299. [Google Scholar] [CrossRef] [PubMed]
- Brody, S.D.; Atoba, K.O. Institutional Resilience. In Vulnerability and Resilience to Natural Hazards; Cambridge University Press: Cambridge, UK, 2018; p. 237. [Google Scholar]
- Rose, A.; Porter, K.; Dash, N.; Bouabid, J.; Huyck, C.; Whitehead, J.; Shaw, D.; Eguchi, R.; Taylor, C.; McLane, T. Benefit-cost analysis of FEMA hazard mitigation grants. Nat. Hazards Rev. 2007, 8, 97–111. [Google Scholar] [CrossRef]
- Boyd, E.; Gonzales, O.R. Community Development Block Grant Funds in Disaster Relief and Recovery; Congressional Research Service: Washington, DC, USA, 2011. [Google Scholar]
- Mach, K.J.; Kraan, C.M.; Hino, M.; Siders, A.R.; Johnston, E.M.; Field, C.B. Managed retreat through voluntary buyouts of flood-prone properties. Sci. Adv. 2019, 5, eaax8995. [Google Scholar] [CrossRef] [PubMed]
- Fraser, J.; Elmore, R.; Godschalk, D.; Rohe, W. Implementing Floodplain Land Acquisition Programs in Urban Localities; The Center for Urban & Regional Studies, University of North Carolina at Chapel Hill FEMA: Chapel Hill, NC, USA, 2003. [Google Scholar]
- Conrad, D.R.; McNitt, B.; Stout, M. Higher Ground: A Report on Voluntary Property Buyouts in the Nation’s Floodplains: A Common Ground Solution Serving People at Risk, Taxpayers and the Environment; National Wildlife Federation: Reston, VA, USA, 1998; ISBN 0945051662. [Google Scholar]
- White, E. Establishing Long-Term Cost Effectiveness of Fema Buyouts: A Loss Avoidance Study of the Acquisition/Demolition of 22 Properties in Shepherdsville, Kentucky; University of Kentucky: Lexington, KY, USA, 2011. [Google Scholar]
- Tate, E.; Strong, A.; Kraus, T.; Xiong, H. Flood recovery and property acquisition in Cedar Rapids, Iowa. Nat. Hazards 2016, 80, 2055–2079. [Google Scholar] [CrossRef]
- Zavar, E. Residential perspectives: The value of Floodplain-buyout open space. Geogr. Rev. 2015, 105, 78–95. [Google Scholar] [CrossRef]
- Federal Emergency Management Agency (FEMA). Consideration of Environmental Benefits in the Evaluation of Acquisition Projects under the Hazard Mitigation Assistance (HMA) Programs; FEMA: Washington, DC, USA, 2013. Available online: https://www.fema.gov/media-library-data/20130726-1920-25045-4319/environmental_benefits_policy_june_18_2013_mitigation_policy_fp_108_024_01.pdf (accessed on 6 March 2020).
- Stults, M.; Larsen, L. Tackling Uncertainty in US Local Climate Adaptation Planning. J. Plan. Educ. Res. 2018. [Google Scholar] [CrossRef]
- Lempert, R.J.; Popper, S.W.; Groves, D.G.; Kalra, N.; Fischbach, J.R.; Bankes, S.C.; Bryant, B.P.; Collins, M.T.; Keller, K.; Hackbarth, A.; et al. Making Good Decisions without Predictions; RAND Corporation: Santa Monica, CA, USA, 2013. [Google Scholar]
- Walker, W.E.; Haasnoot, M.; Kwakkel, J.H. Adapt or perish: A review of planning approaches for adaptation under deep uncertainty. Sustainability 2013, 5, 955–979. [Google Scholar] [CrossRef]
- Walker, W.E.; Lempert, R.J.; Kwakkel, J.H. Deep Uncertainty. In Encyclopedia of Operations Research and Management Science; Springer: New York, NY, USA, 2013; pp. 395–402. [Google Scholar]
- Lempert, R.J.; Groves, D.G.; Popper, S.W.; Bankes, S.C. A general, analytic method for generating robust strategies and narrative scenarios. Manag. Sci. 2006, 52, 514–528. [Google Scholar] [CrossRef]
- Wong, T.E.; Keller, K. Deep Uncertainty Surrounding Coastal Flood Risk Projections: A Case Study for New Orleans. Earth’s Future 2017, 5, 1015–1026. [Google Scholar] [CrossRef]
- Singh, R.; Reed, P.M.; Keller, K. Many-objective robust decision making for managing an ecosystem with a deeply uncertain threshold response. Ecol. Soc. 2015, 20. [Google Scholar] [CrossRef]
- Garner, G.; Reed, P.; Keller, K. Climate risk management requires explicit representation of societal trade-offs. Clim. Chang. 2016, 134, 713–723. [Google Scholar] [CrossRef]
- Oddo, P.C.; Lee, B.S.; Garner, G.G.; Srikrishnan, V.; Reed, P.M.; Forest, C.E.; Keller, K. Deep Uncertainties in Sea-Level Rise and Storm Surge Projections: Implications for Coastal Flood Risk Management. Risk Anal. 2020, 40, 153–168. [Google Scholar] [CrossRef] [PubMed]
- Hall, J.W.; Lempert, R.J.; Keller, K.; Hackbarth, A.; Mijere, C.; Mcinerney, D.J. Robust Climate Policies Under Uncertainty: A Comparison of Robust Decision Making and Info-Gap Methods. Risk Anal. 2012, 32, 1657–1672. [Google Scholar] [CrossRef]
- van Berchum, E.C.; Mobley, W.; Jonkman, S.N.; Timmermans, J.S.; Kwakkel, J.H.; Brody, S.D. Evaluation of flood risk reduction strategies through combinations of interventions. J. Flood Risk Manag. 2019, 12, e12506. [Google Scholar] [CrossRef]
- Friedman, J.H.; Fisher, N.I. Bump hunting in high-dimensional data. Stat. Comput. 1999, 9, 123–143. [Google Scholar] [CrossRef]
- Kwakkel, J.H. The Exploratory Modeling Workbench: An open source toolkit for exploratory modeling, scenario discovery, and (multi-objective) robust decision making. Environ. Model. Softw. 2017, 96, 239–250. [Google Scholar] [CrossRef]
- Houston Galveston Area Council (HGAC). Regional growth forecast. Available online: http://www.h-gac.com/regional-growth-forecast/documents/Current_Maps_and_Tables.pdf (accessed on 6 March 2020).
- Parisi, F.; Lund, R. Return periods of continental US hurricanes. J. Clim. 2008, 21, 403–410. [Google Scholar] [CrossRef]
- Federal Emergency Management Agency (FEMA). Hurricane Ike Impact Report; FEMA: Washington, DC, USA, 2008. [Google Scholar]
- NOAA. National Oceanic Atmospheric Association’s National Center for Environmental Information Database; NOAA: Silver Spring, MD, USA, 2017. Available online: https://www.ncdc.noaa.gov/billions/events/US/1980-2017 (accessed on 6 March 2020).
- AIR. AIR Worldwide Corporation. Modeling Fundamentals: What Is AAL? Available online: https://www.air-worldwide.com/publications/air-currents/2013/Modeling-Fundamentals--What-Is-AAL-/ (accessed on 6 March 2020).
- Office of Management and Budget (OMB). Discount rates for cost-effectiveness, lease purchase, and related analyses. In Circular A-94 Appendix C; White House Office of Management and Budget: Washington, DC, USA, 2016. Available online: https://obamawhitehouse.archives.gov/omb/circulars_a094/a94_appx-c/ (accessed on 6 March 2020).
- Atoba, K.O.; Brody, S.D.; Highfield, W.E.; Merrell, W.J. Estimating Residential Property Loss Reduction from a Proposed Coastal Barrier System in the Houston-Galveston Region. Nat. Hazards Rev. 2018, 19, 5018006. [Google Scholar] [CrossRef]
- Harris County Flood Control District (HCFC). Harris County Flood Control District Buyout Interest Areas. Available online: http://www.hcfcd.org/Hurricane-Harvey/Home-Buyout-Program/Volunteer-for-a-Home-Buyout (accessed on 21 June 2019).
- Brody, S.D.; Bernhardt, S.P.; Zahran, S.; Kang, J.E. Evaluating local flood mitigation strategies in Texas and Florida. Built Environ. 2009, 35, 492–515. [Google Scholar] [CrossRef]
- Highfield, W.E.; Brody, S.D.; Blessing, R. Measuring the impact of mitigation activities on flood loss reduction at the parcel level: The case of the clear creek watershed on the upper Texas coast. Nat. Hazards 2014, 74, 687–704. [Google Scholar] [CrossRef]
- Zhang, W.; Nicholson, C. A multi-objective optimization model for retrofit strategies to mitigate direct economic loss and population dislocation. Sustain. Resilient Infrastruct. 2016, 1, 123–136. [Google Scholar] [CrossRef]
- Highfield, W.E.; Peacock, W.G.; van Zandt, S. Mitigation Planning: Why Hazard Exposure, Structural Vulnerability, and Social Vulnerability Matter. J. Plan. Educ. Res. 2014, 34, 287–300. [Google Scholar] [CrossRef]
- The Nature Conservancy (TNC). Strategic Property Buyouts to enhance flood resilience: Creating a model for flood risk reduction, community protection and environmental gains. Available online: https://www.nature.org/content/dam/tnc/nature/en/documents/harveybuyoutsummary.pdf (accessed on 6 March 2020).
- Harris County Community Services Department, Disaster Recovery Voluntary Buyout Program Guidelines (Draft). Available online: https://csd.harriscountytx.gov/Documents/HarrisCounty_Buy_Out_Guidelines_Revised_FINAL_DRAFT_081018.pdf (accessed on 21 February 2020).


| Analysis Category | Variable | Value Ranges |
|---|---|---|
| Policies | Budget | $75–750 million USD |
| Proportion buyouts | 10–90% | |
| Uncertainties | Demolition cost | $6–9 USD per foot 2 |
| Appraised market value cost adjuster | 90–130% | |
| Elevation cost adjuster | 70–130% |
| All Scenarios | |||||
|---|---|---|---|---|---|
| Category | Variable | Mean | STD | Min | Max |
| Buyouts | Number of structures | 1326.64 | 847.15 | 79 | 4520 |
| Savings ($ million USD) | 494.8 | 244.2 | 55.8 | 1272.6 | |
| Cost ($ million USD) | 206.0 | 1.43 | 8.45 | 669.7 | |
| BCR | 2.88 | 0.835 | 1.55 | 7.73 | |
| Elevation | Number of structures | 1672.14 | 1034 | 854 | 6143 |
| Savings ($ million USD) | 428.5 | 235.4 | 45.7 | 1374.9 | |
| Cost ($ million USD) | 206.2 | 143.1 | 7.5 | 659.3 | |
| BCR | 2.45 | 0.784 | 1.11 | 8.09 | |
| Both | Number of structures | 2998.78 | 1296.99 | 622 | 6752 |
| Savings ($ million USD) | 923.3 | 330.9 | 230.5 | 1747.8 | |
| Cost ($ million USD) | 412.2 | 194.9 | 74.8 | 749.7 | |
| BCR | 2.45 | 0.515 | 1.43 | 4.49 | |
| Category | Variable | Combined BCR & Structures | Maximize BCR | Maximize Structures |
|---|---|---|---|---|
| Buyouts | Number of structures | 234 | 184 | 609 |
| Savings ($ million USD) | 131.4 | 108.5 | 282.1 | |
| Cost ($ million USD) | 30.8 | 23 | 89 | |
| BCR | 4.26 | 4.71 | 3.17 | |
| Elevation | Number of structures | 1898 | 881 | 6143 |
| Savings ($ million USD) | 574.1 | 293.2 | 1375 | |
| Cost ($ million USD) | 169.6 | 66.4 | 657 | |
| BCR | 3.83 | 4.41 | 2.09 | |
| Both | Number of structures | 2132 | 1065 | 6752 |
| Savings ($ million USD) | 705.5 | 401.7 | 1657 | |
| Cost ($ million USD) | 200.4 | 89.4 | 746 | |
| BCR | 3.52 | 4.49 | 2.22 |
| Budget ($ Million USD) | Proportion of Budget for Buyouts (%) | Demolition Cost ($ USD Per Foot 2) | Elevation Cost (%) | Market Value (%) | |
|---|---|---|---|---|---|
| Combined BCR and structures | 200.48 | 14.4 | 8.29 | 70.06 | 128.11 |
| Maximize BCR | 90.02 | 26.19 | 7.69 | 70.81 | 128.44 |
| Maximize structures | 746.52 | 11.95 | 7.55 | 72.34 | 117.55 |
© 2020 by the authors. Licensee MDPI, Basel, Switzerland. This article is an open access article distributed under the terms and conditions of the Creative Commons Attribution (CC BY) license (http://creativecommons.org/licenses/by/4.0/).
Share and Cite
Mobley, W.; Atoba, K.O.; Highfield, W.E. Uncertainty in Flood Mitigation Practices: Assessing the Economic Benefits of Property Acquisition and Elevation in Flood-Prone Communities. Sustainability 2020, 12, 2098. https://doi.org/10.3390/su12052098
Mobley W, Atoba KO, Highfield WE. Uncertainty in Flood Mitigation Practices: Assessing the Economic Benefits of Property Acquisition and Elevation in Flood-Prone Communities. Sustainability. 2020; 12(5):2098. https://doi.org/10.3390/su12052098
Chicago/Turabian StyleMobley, William, Kayode O. Atoba, and Wesley E. Highfield. 2020. "Uncertainty in Flood Mitigation Practices: Assessing the Economic Benefits of Property Acquisition and Elevation in Flood-Prone Communities" Sustainability 12, no. 5: 2098. https://doi.org/10.3390/su12052098
APA StyleMobley, W., Atoba, K. O., & Highfield, W. E. (2020). Uncertainty in Flood Mitigation Practices: Assessing the Economic Benefits of Property Acquisition and Elevation in Flood-Prone Communities. Sustainability, 12(5), 2098. https://doi.org/10.3390/su12052098