1. Introduction
A supply chain is a network of entities or activities through which goods and services are produced and distributed from suppliers to users (industries or final users). Studies often use input-output (IO) models to analyze the supply chain of industries within a subnational region or a country or across the world. IO models are suitable for an analysis of the supply chain because of their capability to scrutinize the transactions among the industries within an economy. Industries are dependent on each other by purchasing and selling intermediate goods from and to the other industries. For instance, in order to process raw fish in the seafood processing industry, the industry purchases fuel from the petroleum refining industry and services from the finance and insurance industry. Once the raw fish is processed, the processed seafood is supplied to other industries, such as the food service industry or to households for final consumption.
Examples that carried out the supply chain analysis within an IO framework are Albino et al. [
1], Yazan et al. [
2], and Liu et al. [
3]. Albino et al. [
1] used an enterprise input–output (EIO) model to inspect the flows of energy and materials among the production processes of global and local supply chains. Yazan et al. [
2] estimated the material, energy, and waste flows of the bio-refineries supply chain using an EIO model for the Porto Torres industrial district, Sardinia, Italy. In comparison, Liu et al. [
3] examined the coal supply chain and environmental impacts using process chain analysis and inter-regional IO analysis for the Jing-Jin-Ji region, China.
More recently, a number of studies based on IO or social accounting matrix (SAM) models utilized the structural path analysis (SPA) method to analyze supply chains. An SPA is a powerful tool because it can scrutinize the chain or network of paths along which the influences of a sector (an industry) are generated and transmitted to different sectors of an economy. Lantner [
4] was the first to introduce the SPA method. The author applied the method to an IO model. The first application of the method to a SAM was by Defourny and Thorbecke [
5]. Since the two pioneering studies above (Lantner [
4]; Defourny and Thorbecke [
5]) were performed, the SPA method has been used in many different contexts due to its ability to identify the critical paths. The method was used, for example, to investigate the role of different types of households in a rural economy [
6] and to assess different effects of economic growth on labor income by gender [
7].
A multitude of studies applied the SPA method to environmental and natural resource economic issues in order to pinpoint the critical paths along the supply chains through which carbon, energy, or water flows among networks of industries. Skelton et al. [
8], for instance, used an SPA within a multi-regional IO (MRIO) model to trace the flows of embodied emissions caused by a national final demand for goods and services. Llop and Ponce-Alifonso [
9] applied SPA to water usages and examined the propagation of exogenous impacts on various channels of water consumption. The study incorporated both the production sectors and the final consumption in their SPA. Zhang et al. [
10] performed the SPA method for a supply chain analysis to quantify primary energy requirements for the Chinese economy within an IO framework. In contrast, Liang et al. [
11] relied on both physical and monetary IO models to investigate the consumption-based material flows for Chinese industries, and identified critical supply chains through an SPA. A review of some of the previous SPA studies is found in Parra and Wodon [
7], Kasumba and Ruhiiga [
12], and Seung [
13].
In the previous SPA studies, including those reviewed above, the initial shock (or “origin”, the definition of which is given in
Section 2.1 below) is the final demand (consumer demand, government demand, investment, or exports) for products. In these studies, the final demand is at the end of the supply chain; there are no further forward-linked sectors or industries beyond the final demand in the supply chain. Thus, SPAs in the previous studies typically look into how much energy consumption in all the backward-linked industries along the supply chain is required by final consumption of goods and services (e.g., [
10]) or how much CO
2 is generated in the backward linked industries as a result of household consumption of goods and services (e.g., [
14]). Since final demand is at the end of the supply chain, it was not necessary to execute a forward linkage SPA in these studies.
In some cases (as in our study), however, the initial shock is given to the supply side (not the demand side). Many of the exogenous shocks to fisheries are supply side shocks. For example, fishery managers may change the total allowable catch (TAC), which is an exogenous shock to the supply of fish production. Natural disaster or climate change (such as warmer seawater) directly alters the supply of fish production by wild capture fisheries or by aquaculture. The motivation of our study is to discover important paths of the economic impacts from an unexpected shock to the supply side of an industry (e.g., TAC change, natural disaster, or climate change as in the present study) while in the previous SPA studies, the initial shock is applied to the final demand side.
Our study does not focus on extracting the structural paths for the “final product.” Rather, we are interested in how an exogenous change in an industry’s (wild capture, aquaculture, or seafood processing industry) output generates influences both in backward and forward directions, which requires both backward and forward SPAs. An exogenous reduction in raw fish production, for instance, will reduce the use of intermediate inputs (backward linkage) and decrease supply of raw fish to the industries that use the raw fish as an intermediate input (forward linkage). In our study, we use Leontief inverse and Ghosh [
15] inverse, respectively, for backward linkage and forward linkage SPAs.
There exists a myriad of studies that used IO or SAM models to compute the economic impacts or contributions of fisheries. A recent example is Kim and Seung [
16], who measured the economic contributions of wild fisheries and aquaculture within a SAM model for a province in Korea. Grealis et al. [
17] relied on an IO model to assess the economic impacts of expanding aquaculture in Ireland. Vega et al. [
18] estimated the economic impacts of seafood production growth in Ireland using a SAM model. Seung and Waters [
19] provided a review of regional economic models for fisheries and previous economic impact studies (for US fisheries) conducted using IO, SAM, and computable general equilibrium (CGE) models.
Most economic impact studies for fisheries, whether they are based on an IO or SAM model, calculate only the economic multipliers. The multipliers measure only the total impacts per unit change in fish production. Very often, only the multipliers are provided to fishery managers. With only multipliers, however, fishery managers cannot understand how and along what channels the multiplier effects are transpired, transmitted, and propagated throughout an economy. If the fishery managers have knowledge of these channels as well as the magnitudes of multipliers, they will be able to make decisions with some confidence. An SPA can serve as a valuable tool to complement the simple multiplier analysis for fishery managers’ informed decisions. Despite a large number of economic impact studies having been executed for fisheries, there are only a few applications of SPA to fisheries [
13,
20]. However, the SPAs in these two studies were conducted only for backward linkages for the seafood industries. No previous studies explored the supply chain using both backward linkage and forward linkage SPAs. The present study fills this void.
The present study performs a supply chain analysis for three seafood industries in Korea—wild fisheries, aquaculture, and seafood processing. Unlike previous studies, this study adopts both (i) input users’ perspective by exploring backward linkages of an industry based on Leontief inverse and (ii) input suppliers’ perspective by detecting its forward linkages based on Ghosh inverse. In doing so, this study utilizes an SPA method to unravel the backward linkage and forward linkage multipliers, and elucidate the paths through which the influences of an industry are generated, propagated, and transmitted throughout an economy, and to quantify the strengths of the paths.
Often fishery managers are given only the information on how much the upstream industries supply their outputs directly to a seafood industry, which is usually provided in an IO table, and/or information about the magnitudes of total impacts on other industries that a shock to the seafood industry generates, which are summarized in the Leontief inverse. With this information only, however, they cannot identify the industries that play a crucial role in transmitting the impacts of the shock. SPA clearly shows which industries contribute, and by how much, to the total impacts of the shock, thus opening the black box of Leontief inverse and Ghosh inverse. The present study carries out two different types of SPAs, backward linkage SPA and forward linkage SPA, for each of the three seafood industries in Korea—wild fisheries, aquaculture, and seafood processing.
Total fish production in Korea was at its highest level of 3.7 million tonnes in 1986. The level has since then declined continuously to a level lower than 2.5 million tonnes in 2002. Since 2002, the level has risen and fallen only slightly. Raw fish is produced by two different methods—harvest of raw fish by fishing vessels and aquaculture. In 2017, the production of fish from wild fisheries was about 0.93 million tonnes. Major species caught in wild fisheries include anchovy (22.8%), chub mackerel (11.2%), hairtail (5.9%), Spanish mackerel (4.1%), herring (3.5%), yellow croaker (2.1%), and other species (50%). These fish are caught by purse seiners, trawlers, anchovy drag nets, gill nets, and longliners. Aquaculture is an important industry that produces 2.3 million tonnes of fish, accounting for 62.2% of total fish production in 2017. Major farm-raised fish/plants include seaweeds, shellfish, and finfish, constituting 76.1%, 18.5%, and 3.7%, respectively, in quantity. In the same year, exports of fish products were worth
$2.3 billion, while the imports,
$5.3 billion. The fish production sectors (wild fisheries and aquaculture) hired 121,734 full- or part-time jobs in 2017 [
21].
This study will be useful to fishery managers in Korea because it will help them to better understand the supply chain of the seafood industries in the country, and therefore, to manage the fisheries in a more effective and sustainable manner. As an instance, when natural disaster occurs that has a direct and adverse effect on wild fisheries and/or aquaculture, the fishery managers will have to understand its subsequent cascading impacts transpiring along the supply chain. Natural disaster affects not only the upstream industries that provide inputs to seafood industries but also the downstream industries that buy from the seafood industries. Another example is climate change that alters seawater temperature. The change in seawater temperature will have impacts on seafood industries and impacts on both their backward- and forward-linked industries. In these instances, the paths along which the impacts are generated and amplified, as well as the information about the total economic impacts, will serve as valuable information to the fishery managers who are tasked with evaluating the total impacts and planning for recovery from the disruptions in the supply chain.
The remainder of this paper is structured as follows.
Section 2 presents the SPA methods and recounts briefly the data used. In
Section 3, the results are presented and discussed. The final section offers a few concluding remarks.
2. Materials and Data
A supply chain can be thought of as an IO system (e.g., [
1,
22]) because the IO system shows the “flows” of products, materials, emissions, and energy among production processes of firms. As an example, for a fishing vessel to produce (catch) raw fish, the vessel needs materials (such as a wooden box for fish storage and transportation) from a firm producing the materials. In this case, the materials flow to the fishing vessel from the manufacturer of the materials. Next, the raw fish caught in the fishing vessel flow to a seafood processing plant where the fish is processed. The nature of flows existing among different production processes is the same as the nature of the inter-industry relationship in an IO system. Therefore, the IO model is an appropriate tool that can inspect the supply chain of products.
The Leontief IO model can be represented compactly as:
where
X is a column vector of industry output;
I is an identity matrix;
A is Leontief input coefficient matrix;
Y is a vector of final demand; and (
I −
A)
−1 is the Leontief inverse. The Ghosh [
15] IO model can be represented as:
where
X′ is the transpose of
X (i.e., row vector of industry output);
V is a column vector of industry total value added;
V′ is its transpose;
B is the output coefficient matrix; and (
I −
B)
−1 is the Ghosh inverse.
The use of Ghosh supply-driven model is problematic if it is used in its ex ante predictive (or causal) interpretation as when the model is used for an economic impact analysis. However, if the Ghosh model is used to measure only the forward linkages, not to calculate the economic impacts of a specific policy on the downstream industries, as in the present study, the model offers valid ex post descriptive interpretations [
23,
24]. Dietzenbacher [
25] suggests that the Ghosh model be interpreted as a price model when it is used to describe causal interpretation of the model (for impact analysis).
2.1. Structural Path Analysis
All the previous studies conduct SPAs for only the backward linkages of an industry based on the Leontief inverse in Equation (1) above. The present study is the first that carries out SPAs for the forward linkages of industries using the Ghosh inverse in Equation (2) above. In the present study, both backward and forward linkage SPAs were applied to seafood industries in Korea. The remainder of this section delineates the backward linkage SPA method based on the Leontief demand-driven model. One can describe the forward linkage SPA method within the Ghosh supply-driven model framework, in a similar way, except that it explores the other side (input supply side) of the inter-industry connections.
The present study uses a software called SimSIP SAM [
26] to conduct the SPAs. To implement the forward-linkage SPA using the software, the transpose of the IO matrix is entered when prompted to input the data. This is done because of the following reason. Setting
,
. Then Equation (2) above becomes
. Therefore, once the transpose of IO matrix is entered, the software does the rest of the job, that is, computes B′, and implements the forward linkage SPAs. It is confirmed that the global influences for the industries obtained from the forward linkage SPAs are exactly the same as the elements (g
ij’s) in the G′ matrix.
In SPA, any endogenous account (an industry) in the IO model is a
pole. The line connecting any two poles is an
arc. The arc originating from
i (origin) and ending at
j (destination) is arc(i,j). The Leontief IO coefficient, a
ji, in the IO technical coefficient matrix A measures the intensity of the
influence of sector
i on sector
j or, equivalently, the intensity of arc(i,j). A
path is a chain of consecutive arcs. The number of arcs on a path defines the length of the path. (i→j)
p denotes the path
p going from
i to
j. An
elementary path is a path that does not go through any pole more than once. A
circuit is a path that starts from and ends at the same pole. l
ji represents the elements in the Leontief inverse, (I − A)
−1 in Equation (1) above. There are three kinds of influences that an SPA measures—
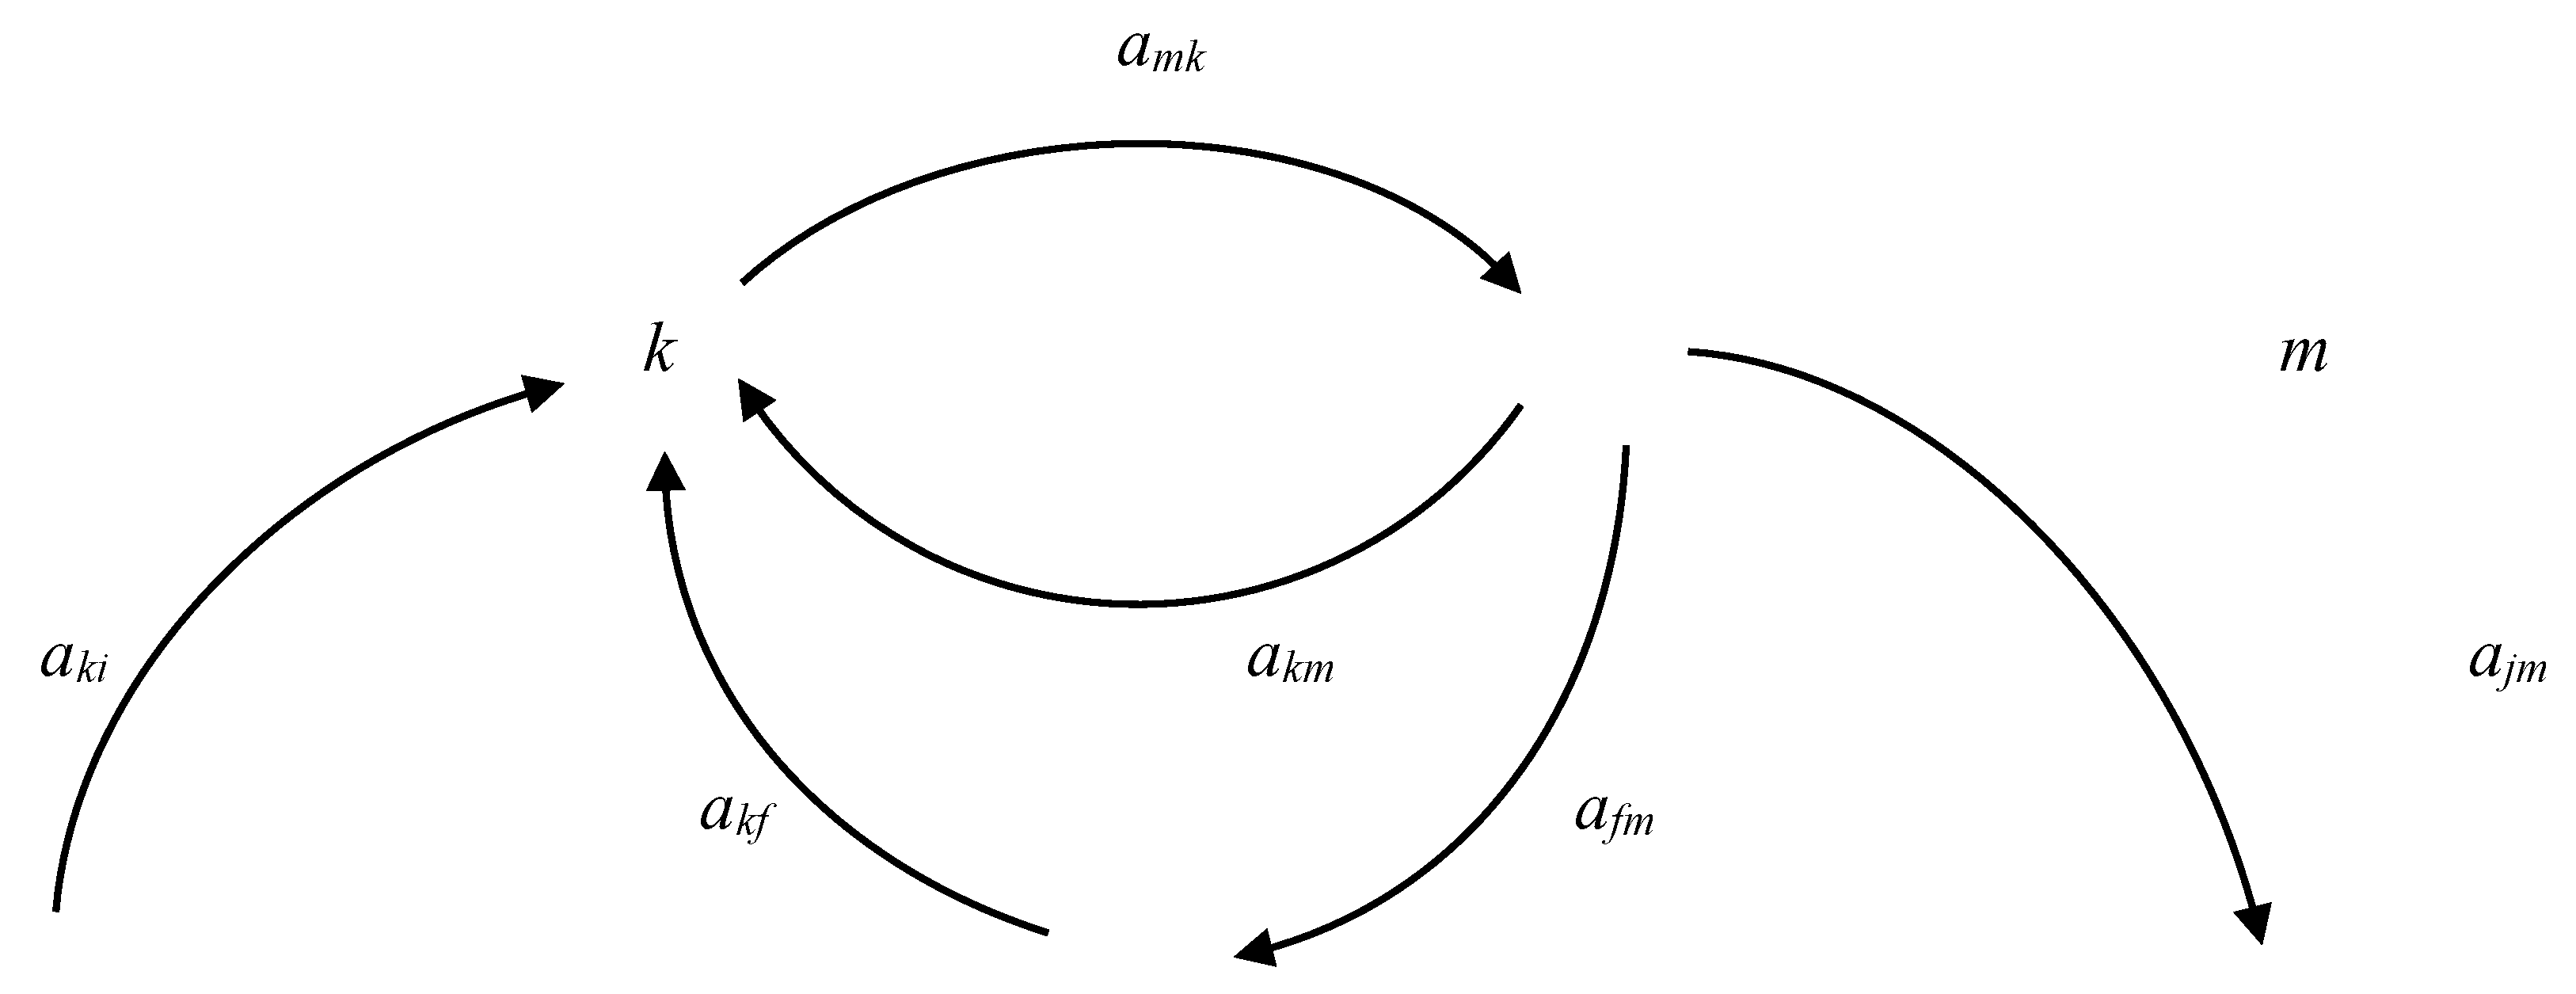
direct influence, total influence, and global influence. Figure 1 below depicts the chain of elementary paths and the adjacent circuits that link multiple poles.
The direct influence of
i (origin) on
j (destination) gauges the change in production (or income) in
j that occurs along an elementary path due to a unitary change in
i. When calculating the direct influence, it is assumed that productions in all the other accounts (industries) in the model do not change except those along the elementary path. The direct influence from
i to
j is calculated simply by multiplying the intensities of all the arcs on the elementary path. For instance, in the case of the three-arc elementary path (linking poles
i, k, m, and
j) in
Figure 1, the direct influence is obtained by:
where
k and
m are the intermediate poles located between poles
i and
j.
Along an elementary path from
i to
j, some effects may transpire through the circuits adjacent to the path. This will generate some additional, indirect effects through these circuits. Total influence is computed as the direct influence plus these indirect effects occurring through the adjacent circuits:
Here, is called path multiplier. Equation (4) states that the total influence is obtained by multiplying the direct influence by the path multiplier. The path multiplier is obtained as the ratio of two determinants, ∆p/∆, where ∆ is the determinant of the matrix (I − A) and ∆p the determinant of the matrix resulting from removing the accounts (poles) constituting path p from (I − A).
Global influence quantifies the total effects on the destination
j caused by a unitary change in the origin
i. Global influence from
i to
j is computed simply as the sum of the total influences occurring along all the elementary paths originating from
i and ending at
j, and is equal to element l
ji in the Leontief inverse, (I − A)
−1. Hence,
where
n is the number of all possible elementary paths going from
i to
j. The output multiplier that is often calculated in typical IO analyses is simply the sum of all the global influences. Thus, the output multiplier for
i (
Oi) is given by:
where
J is the total number of industries. For more details about the SPA methods, see Defourny and Thorbecke [
5], Parra and Wodon [
7], and Seung [
13].
By tracing the chain of poles through which the influences are transmitted and measuring the influences of different paths, SPA has the advantages of inspecting the
concentration,
strength, and
speed of various transmission channels or paths [
7]. Concentration is concerned with on which paths the total effects of an industry are concentrated or refers to the share of the effects that are accounted for by one or more paths. Strength gauges the extent of the contribution of a path to the global influence. The ratio of total influence to global influence (TG ratio) is often used to measure the strength. Speed refers to the time taken for the effects of an initial shock to be realized. To be precise, SPA is based on an IO model, which is typically a static model, and therefore abstracts from time. Nevertheless, an SPA can provide policymakers with some information regarding the time it will take for the economic impacts to realize completely. It is likely that the larger the number of poles a path travels through and the larger the magnitude of the path multiplier, the longer it will take for the full economic impacts to materialize [
5] because a larger number of poles and/or a larger path multiplier means a larger number of transactions occurring among the sectors.
2.2. Data
This study uses the 2011 IO table for Korea (Bank of Korea, BOK), which is extended from 2005 IO data [
28]. The transactions in the IO table used in this study are in producer prices and record only the domestic transactions. The 168-sector version in the dataset identifies separately Wild fisheries, Aquaculture, and Seafood processing. However, the number of sectors (168) is too large to make the SPA analysis manageable. Therefore, while three seafood industries are kept intact, the other 165 sectors are aggregated into 29 sectors, resulting in a total of 32 sectors (industries) in the IO table for use in this study. See
Supplementary S1 available online as
Supplementary Materials, for the list of 32 industries.
3. Results and Discussion
Theoretically, there is an infinite number of paths that can be produced from SPAs. For most of the paths, however, the contributions of the total influences on the global influence for a destination sector are extremely small. For this reason, this study generates only those elementary paths which have a maximum of five arcs (i.e., six poles) with their TG ratios larger than 2%. The entire set of the elementary paths thus obtained are presented in
Supplementary S2 available online as
Supplementary Materials.
3.1. Backward Linkage SPAs
Table 1 presents, for each of the three seafood industries (i.e., the three industries of origin), the top ten industries (destinations) determined by the size of the global influence. The industry that benefits most from Wild fisheries is Coal and petroleum mostly because fishing vessels use a large amount of fuel to harvest fish, whereas Food and beverage is the top industry for Aquaculture because of its heavy reliance on fish feeds. Seven of the top ten destination industries are identified as the industries that are crucial for both of the two raw fish production industries, although the rankings are different.
The top industry in the list for Seafood processing is, not surprisingly, Wild fisheries because the industry supplies the largest amount (in value) of input (raw fish) to the processing industry. Aquaculture ranks lower (fourth) in the list. Among the non-seafood industries, Wholesale and retail is the most crucial upstream sector for Seafood processing, reflecting the fact that the sector’s output is a key non-fish input to Seafood processing. Base year data reveals that 8.4% of Seafood processing’s total sales revenue is spent on Wholesale and retail.
Coal and petroleum ranks very high (third) in the list for Seafood processing, notwithstanding the fact that only 0.7% of total Seafood processing revenue is expended on this input. Coal and petroleum being highly ranked is mainly because the products are a critical input in the two fish producing industries, and their output (i.e., raw fish) is, in turn, used as a key input in Seafood processing. The lion share of the backward contribution of Seafood processing to Coal and petroleum is thus through the indirect effects taking place via the two intermediate sectors (two fish production industries).
The backward linkage output multiplier for Aquaculture (1.92, bottom of
Table 1) is larger than that for Wild fisheries (1.76). The output multiplier for Seafood processing is much larger (2.34). This is because the Seafood processing multiplier includes the effects on the two fish production sectors as well as the effects on non-seafood industries.
Table 2 presents some of the elementary paths obtained from the backward linkage SPA for Wild fisheries (see
Supplementary S2 for the whole set of paths). There is more than one path along which the effects of Wild fisheries spread to other industries. For instance, there are five different paths ending at Chemical products. The first path is the direct path from the origin to the destination that does not go through any intermediate poles. A major portion of the influences occurring along this path is caused by the direct use by Wild fisheries of Chemical products as an intermediate input. The influence transpiring along this path makes up 61.1% of the global influence (i.e., TG ratio = 61.1%, last column,
Table 2). The second channel is Wild fisheries → Wood and paper → Chemical products. Along this path, Wild fisheries buy input from Wood and paper, which in turn purchases input from Chemical products to produce more to meet the increased demand by the industry of origin. This path comprises 7.4% of the global influence.
In some instances, the direct path comprises the lion share of the global influence (e.g., Wild fisheries → Chemical products). However, when the destination is Mineral products, for example, the direct path (Wild fisheries → Mineral products) is responsible for only 0.6% of the global influence. The path going through an intermediate pole (Wild fisheries → Coal and petroleum → Mineral products) constitutes the largest portion (45.2%) of the global influence. One reason why the direct paths do not account for the largest portion of the global influence is in part that the paths have relatively small path multipliers, a reflection of the fact that these paths have a relatively small number of circuits that amplify the influence of the origin.
The SPA results above illustrate that the largest portion of the influences transpires not necessarily via the industries from which the industry of origin directly purchases. This finding is important for fishery managers. If they are provided with only an IO table that shows how much of a certain input a seafood industry uses, they may make the mistake of concluding that the economic impacts from a seafood industry depend only on the magnitudes of inputs that the industry directly uses. Furthermore, if they are given only Leontief inverse, which summarizes the total impacts of a seafood industry, they will be in the dark as to which intermediate industries (intermediate poles) contribute in a significant way to the transmission of a seafood industry’s influence to these other industries.
The influence of a seafood industry depends in large on the contribution of the intermediate industries located between the seafood industry and the destinations. If the products from an intermediate industry are critical input to the seafood industry, but a large portion of them is imported from foreign countries, the industry may constitute a bottleneck that prevents the seafood industry (here, Wild fisheries) from maximizing its influence along the supply chain. In this case, if policymakers execute a policy that boosts domestic production of the products, and reduce their imports, the influence of the seafood industry will increase.
In some instances, the global influence is concentrated on a single path (whether it is a direct path or not). An example is Textile and leather as a destination for which the direct path accounts for 93.7% of the global influence. The other paths with the same destination (Textile and leather), which are not shown in
Table 2, constitute altogether less than 7% of the global influence. In contrast, for some destinations, the concentration of the global influence on a single path is much lower. Printing and copying as a sector of destination is a good example where the two-arc path (Wild fisheries → Wood and paper → Printing and copying) has the largest TG ratio of only 12.8% with ten other paths making up nontrivial portions of the global influence.
Baseline data indicate that Wild fisheries use directly only a very small amount of output from Printing and copying, which explains why the one-arc, direct path (Wild fisheries → Printing and copying) has a relatively low TG ratio of 5.9%. On the other hand, many different non-seafood industries of which products or services are directly used by Wild fisheries rely heavily on the products from Printing and copying, as evidenced by the results in
Table 2, which shows that most of the paths (ten of eleven paths) are two-arc paths with only one intermediate pole.
As mentioned, SPA is not ideal for estimating time taken for the effects of a policy shock to be completely realized. Nonetheless, in reality, SPA can provide policymakers with some idea as to which elementary paths will be likely to take a longer time than other paths. It is likely that the larger the number of poles, the longer it will take for the economic impacts to fully materialize [
5].
Table 2 reveals that many of the paths have less than four poles, while a few paths have four poles. It seems reasonable to believe that the impacts along those paths with a fewer number of poles will occur rather quickly.
The time will be also likely to hinge on the size of the path multiplier. The path multipliers from the SPAs in some previous studies (e.g., [
5,
6,
13] rarely exceed two. In comparison, in the present study, nine of ten path multipliers for the paths ending at Primary metal products are larger than two with a few larger than three (
Table 2). This means that there are many circuits around these elementary paths, that the additional effects transpiring via the circuits are very large, and that a complete realization of the economic impacts occurring along these paths will take much longer time than those with smaller path multipliers. If policymakers are presented with the information on path multipliers, they will have a better understanding of which industries will feel the full effect of a policy more quickly than other industries.
Table 3 presents the SPA results for Aquaculture. As seen in
Table 3 and
Table 4, there are some similarities and differences in the SPA results for the two fish production sectors. Some paths are similar in terms of the poles through which the paths travel. For instance, when the destination is Coal and petroleum, the two fish production sectors follow the same one direct path and two two-arc paths, which pass through either Transportation or Chemical products. One of the most conspicuous differences among the paths starting from the two different raw fish production sectors is that the direct path from Aquaculture to Mineral products comprises the largest share (25.9%) of the global influence while the share of the direct path from Wild fisheries to the same destination is much smaller (0.6% of the global influence).
As in the case of Wild fisheries, the global influence of Aquaculture on Printing and copying is much less concentrated on a single path. Base year data indicates that Aquaculture, much like Wild fisheries, uses directly only a very small amount of the products from Printing and copying. Only 0.01% of total revenue from each of the two fish production industries is spent on this product (Printing and copying). Yet many different industries whose products are directly used in these two seafood industries buy products from Printing and copying (
Table 2 and
Table 3). Additionally, as the magnitudes of path multiplier for Primary metal products indicate, the effects of Aquaculture on Primary metal products, like those of Wild fisheries, are likely to take a longer time before the complete effects are realized, compared with the effects on other industries.
The top five industries on which the Seafood processing industry has the largest global influences are Wild fisheries, Wholesale and retail, Coal and petroleum, Aquaculture, and Chemical products (
Table 1). The two fish production sectors are included in the top five list for an obvious reason; raw fish is a key input in Seafood processing. The global influence of Seafood processing on a raw fish production industry is concentrated on one single, direct path connecting the origin directly to the destination (Wild fisheries or Aquaculture) (
Table 4). The total influence of the direct path for each raw fish production sector comprises almost 100% of global influence.
This study categorizes all the paths resulting from backward linkage SPA for Seafood processing (shown in
Supplementary S2), only some of which are reported in
Table 4, into two groups. The first group consists of the paths containing either Wild fisheries or Aquaculture at the second pole. For this group, the impacts occurring beyond the second pole are basically captured in the SPAs for the two raw fish production sectors (
Table 2 and
Table 3). The paths in this group represent the influences that occur due to Seafood processing’s direct use of fish inputs. The second group comprises those paths which do not have any fish production sector at the second pole. These paths represent the influences brought about because of the Seafood processing’s direct use of non-fish inputs.
Excluding the three seafood industries as sectors of origin, if they are also the final destinations, this study estimates that the first group accounts for 41.8% of the sum of all the total influences obtained from the complete set of SPA results (
Supplementary S2) with the second group responsible for 58.2%. In other words, roughly speaking, fish and non-fish inputs contribute, respectively, 41.8% and 58.2% to the total multiplier (2.34,
Table 1) of Seafood processing. Dividing further the first group of paths into two subgroups with the first subgroup containing only Wild fisheries at the second pole and the second subgroup containing only Aquaculture at the second pole, the first subgroup is found to comprise 34.2% of total Seafood processing multiplier with 7.6% accounted for by the second subgroup. Fishery managers may often need to know the relative contributions made by different segments of the economy (fish- vs. non-fish sectors and Wild fisheries vs. Aquaculture in this study) to the total effects of Seafood processing.
3.2. Forward Linkage SPAs
The forward linkage multipliers for the two fish production industries (1.83 and 1.94, respectively,
Table 5) are larger than that for Seafood processing (1.43) chiefly because the two raw fish production industries’ multipliers include their effects on the most important forward-linked industries (Seafood processing and Food service) as well as other, non-seafood industries. It is not surprising that Seafood processing is the top industry to which Wild fisheries has the strongest forward linkage with a global influence of 0.5065 (
Table 5). The next two critical forward-linked industries are Food service with global influence of 0.2704 and Food and beverage with a global influence of 0.0313, mainly due to the large magnitudes of their direct purchases of raw fish from Wild fisheries. While Wild fisheries sell the largest share of its output to Seafood processing, Aquaculture sells more of its output to Food service than to Seafood processing. Base year data reveals that Aquaculture supplies 30.1% of farm-raised fish to Seafood processing, but sells more (35.6%) to Food service. This is reflected in
Table 5, which indicates that the total forward linkage effects of Aquaculture on Food service are larger (0.4716) than those on Seafood processing (0.3562).
It is noteworthy that some non-seafood industries make the list for the top ten in the forward linkage supply chain (
Table 5) for the two fish production industries despite the fact that none of the raw fish from these two industries are directly supplied to the non-seafood industries in the base year. These non-seafood industries are Agriculture and forestry and Transport equipment. These two non-seafood industries purchase non-seafood inputs from other non-seafood industries, which buy, in turn, raw fish either directly or indirectly from the two raw fish production industries. The SPA results in
Table 6 and
Table 7 (and
Supplementary S2) show how this occurs by presenting the intermediate industries (poles) in the paths connecting the origin (Wild fisheries or Aquaculture) and the two destinations (Agriculture and forestry and Transport equipment).
Paths ending at Food and beverage and Food service (
Table 6) indicate that raw fish from Wild fisheries is either directly sold to these two industries (Wild fisheries → Food and beverage; Wild fisheries → Food service) or is supplied first to Seafood processing, which processes the raw fish and sells it to these two industries (Wild fisheries → Seafood processing → Food and beverage; Wild fisheries → Seafood processing → Food service).
All the elementary paths for Wild fisheries as an origin shown in
Supplementary S2, only some of which are reported in
Table 6, are again classified into two groups. The first group includes those paths which travel through Seafood processing, while the second group contains the paths that do not. The sum of all the total influences of the paths in the first group is 79% of the total global influences, meaning that almost 80% of the forward linkage effect of Wild fisheries occurs through Seafood processing with the remainder (20%) transpiring through the non-seafood industries.
As with Wild fisheries, Aquaculture has the strongest forward connection with Seafood processing and Food service (
Table 5). Unlike Wild fisheries, however, Aquaculture has stronger forward linkage to Food service than to Seafood processing (
Table 5). Bifurcating all the elementary paths for Aquaculture using the results in
Supplementary S2 into those that pass through Seafood processing and those that do not, this study finds out that only about 49% of all the forward linkage effects of Aquaculture transpires through Seafood processing with 51% occurring via non-seafood industries. This is compared with Wild fisheries as the origin in which total forward linkage effects occur mainly through Seafood processing (80%), as mentioned above.
As expected, Food service and Food and beverage are the top two industries on which Seafood processing has the largest global influences because these two industries are the major users, in the supply chain, of the processed seafood (
Table 5). Included also in the top ten list for Seafood processing (
Table 5) are several somewhat seemingly unlikely industries, such as Agriculture and forestry, Electric and electronic equipment, Transport equipment, Educational and health services, and Construction, although in the base year, Seafood processing sells none of its products directly to these five industries (according to the output coefficient matrix, not shown in a table). SPA results in
Table 8 show the reason. The forward linkage influences of Seafood processing on these five industries occur indirectly via intermediate poles (industries) such as Food service, Food and beverage, and Real estate and business services. When Seafood processing supplies its products to these intermediate industries, they, in turn, sell their outputs to the five industries above. If the forward linkage SPA results are not provided to the fishery managers, they will fail to understand how the influences of Seafood processing on these seemingly improbable industries occur.
Most previous SPA studies detect only one side of the inter-industry relationship, that is, the backward linkages based on Leontief inverse, and trace the supply chains solely from the perspective of input users. The present study is the first to execute a complete supply chain analysis using both backward linkage (based on Leontief inverse) and forward linkage (based on Ghosh inverse) SPAs, thus helping policymakers to understand the mechanisms through which the influences of an industry spill over to the rest of the economy in both backward and forward directions.
While, for many industries of destination, one-arc, direct paths preponderantly transmit the global influences in the backward linkage SPAs (
Table 2,
Table 3 and
Table 4), the global influences in the forward linkage SPAs are not dominated by direct paths (
Table 6,
Table 7 and
Table 8). There are many indirect paths with one or more intermediate poles in the forward linkage SPAs that dominate the global influences. Results also reveal that the path multipliers from forward linkage SPAs are generally larger than those from backward linkage SPAs. This implies that, if fishery managers in Korea implement a policy (e.g., a change in total allowable catch, TAC, for a fish species) or if there occur natural disasters that have negative impacts on fisheries in Korea, the impacts will be likely to occur faster along the backward linkage supply chain than along the forward linkage chain.
4. Conclusions
Fishery managers are concerned with the economic impacts of a change in the production of raw fish. This change arises due to, for example, (i) a change in the TAC for a certain fish species caught in Wild fisheries, (ii) a change in the final demand for farm-raised fish, or (iii) a change in the spatial distribution and/or the level of fish stock resulting from climate change. A plethora of studies assess the economic impacts from various policies or environmental shocks, calculating only multipliers showing the total economic impacts. However, these multipliers do not elucidate the chains or paths along which the impacts are engendered and spread to the rest of the economy. There exist some studies that perform SPAs for fisheries (e.g., [
13,
20]). However, these studies carry out only backward linkage SPAs.
The present study overcomes the limitations of these previous studies. An important innovation of this study is that the study performs forward linkage SPAs as well as backward linkage SPAs, thus portraying a more complete and detailed picture of the mechanisms of how the seafood industries’ influences are transfused throughout an economy. Fishery managers in Korea can exploit the information from the SPAs in this study along with multipliers when making decisions on their policies. One meaningful implication from this study is that fishery managers should not limit their attention to seafood industries and the industries directly linked to the seafood industries. SPAs in this study identify a number of seemingly unlikely non-seafood industries that play a crucial role in transmitting the influences of a seafood industry. Conventional multiplier analyses based only on Leontief inverse do not reveal these important non-seafood industries.
It seems difficult to generalize this finding to previous SPA studies of fisheries (e.g., [
13,
20]) because of the differences between the present study and these previous studies both in the structure of the seafood industries and in the structure of the models (i.e., IO vs. SAM models). The finding may be generalized to future SPA studies for other countries where the patterns of input use and output supply for the seafood industries are similar to those of the same industries in Korea.
As human demand for fish increased globally and in Korea, fish harvest from wild fisheries has increased. This led to a rapid depletion of fish resources in seawaters and a dramatic expansion of aquaculture in Korea as an alternative method of producing fish. Only a few studies compared the relative economic impacts of the two alternative methods of producing fish. For instance, Kim and Seung [
16] compared the relative contributions of the two alternative methods that use a different mix of inputs in raw fish production. Although useful, Kim and Seung [
16] have a limitation in the sense that the study did not trace the paths through which the economic impacts are transpired and transmitted.
Fishery managers in Korea may need to reduce the TAC for a wild-caught fish species due to a low level of the stock arising due to, for instance, climate change. Given increasing demand for the fish, the government may implement a policy designed to encourage an increased production of the fish from fish farming to fill the shortage. Net economic impacts from changes in the levels of productions in these two fish producing industries can be assessed using multipliers from an IO model. In this case, an additional analysis, such as SPA as in the present study, will aid fishery managers in their policy decisions.
There are three directions in which the present study can be extended. First, the production technology of the seafood industries changes over time. This means that the mix and quantities of inputs used in the industries change over time. Fishery managers in Korea may be interested in how the backward and forward linkages of the seafood industries have changed during the past several decades. A future study can carry out SPAs for the industries using different IO data sets for several different years in order to explore the temporal changes of the linkages. Second, the fish production sector in this study consists of only two highly aggregated industries (Wild fisheries and Aquaculture). If one wants to investigate the paths of the influences of a particular fish species (e.g., Mackerel or Anchovy) in Wild fisheries, the species needs to be separated from the Wild fisheries industry. In fact, fishery managers in Korea are now considering a change in Mackerel TAC. Furthermore, a recent change in seawater temperature from climate variation has altered Anchovy production in Korean seawaters. Under these circumstances, it seems necessary to separate the relevant species (Mackerel or Anchovy) from the aggregate Wild fisheries sector before conducing an SPA. Separation of a certain species from the aggregated Wild fisheries sector will entail collecting data on the expenditures made for the harvest of the species (probably via a survey). Third, it is well known that the IO model has the limitation that they cannot capture the links between production sectors and non-production sectors, such as value added and households. A social accounting matrix (SAM) model will be able to identify the linkage between industry and non-industry sectors. An SPA based on a SAM model will be able to address the distributional effects, discover the paths connecting the industry and non-industry sectors, and, therefore, provide additional insights informing policymaking.


