Article

Optimization of Traffic Detector Layout Based on Complex Network Theory

School of Management, Harbin Institute of Technology, Harbin 150001, China
*
Author to whom correspondence should be addressed.
Sustainability 2020, 12(5), 2048; https://doi.org/10.3390/su12052048
Submission received: 7 February 2020 / Revised: 29 February 2020 / Accepted: 4 March 2020 / Published: 6 March 2020
(This article belongs to the Section Sustainable Transportation)

Abstract

:
With the recent development of traffic networks, traffic detector layout has become very complicated, due to the complexity of traffic network structures and states. Thus, this paper presents an optimal method for traffic detector layout based on network centrality using complex network theory. It mainly depends on the topology of the traffic network, and does not depend on pre-conditions (e.g., OD (Origin Destination)) traffic, path traffic, prior matrix, and so on) or consider route-choosing behavior too much. Considering the travel time, OD demand, observation demand of urban managers, dynamic characteristic of the traffic network, detector failure, and so on, an optimization model for traffic detector layout is established, which is called the Traffic Network Centrality Model (TNCM). Numerical experiments are conducted, based on data from the Sioux Falls network, which demonstrate that the model has a strong practical value. TNCM is not only helpful in reducing the traffic detector layout cost, but also improves the monitoring revenue of the traffic network in complex scenarios, which offers a promising way of thinking about the optimization of traffic detector layout schemes.

Graphical Abstract

1. Introduction

With the rapid development of urban society, "urban diseases" (traffic congestion, accidents, environmental pollution, energy shortage, and so on) have become increasingly prominent, which have been considered as a global urban problem. These "urban diseases" lead to negative social influence, economic loss, and environmental damage, as well as challenging the sustainable development of urban cities. At present, many countries have taken measures against these challenges, leading to the emergence of smart cities. A smart city utilizes advanced information technologies to solve these "urban diseases" and realize the intelligent management and operation of the city. This creates a better life for people and promotes the harmonious and sustainable development of the city. As transportation plays an important role in urban social and economic systems, the sustainable development of transport provides a basis for the sustainable development of a city. Therefore, the United States, Japan, Australia, Europe, and other parts of the world have advocated for sustainable transportation. As one key component of the Intelligent Transportation System, the traffic information collecting system provides real-time traffic data to the traffic network. Traffic detectors form the basis of the traffic information collecting system and play a key role in the efficient operation of an Intelligent Transportation System. Meanwhile, the accuracy and timeliness of traffic data are closely related to the traffic detector layout scheme.
With the rapid development of intelligent transportation, the quality of traffic data has been unable to meet increasing traffic demands and, so, traffic information collection systems are facing a tremendous challenge. At present, the traffic detector is still one of the key means of acquiring traffic data; thus, investing in building more traffic detectors has been considered in many large- and medium-sized cities. However, due to the high-density traffic networks present, it has been assumed that detectors must be located at every intersection, ideally. However, the cost of such a large-scale layout is high. Therefore, there is a conflict between minimizing the traffic detector deployment cost and maximizing the amount of obtained traffic information. The layout strategy for the traffic detectors will directly influence the quantity and quality of traffic data collected by a traffic detector. On one hand, more traffic data can be obtained under a reasonable detector layout strategy and achieve better traffic management. On the other hand, due to the constant enlargement of the scale of the actual road network and the construction cost requirements for the transport infrastructure, the layout scale of the actual road network detector is restricted. Therefore, studies on the optimal layout of traffic detectors have profound implications.
More and more scholars have been paying attention to complex network theory in recent years. Complex network theory provides effective methods and measures for scholars to study the structures and networks of real-world systems and the relationships between entities. In studies related to complex networks, various quantitative indicators to analyze and compare the nodes and edges, and to evaluate their status and function, have been developed. The idea of a complex network has penetrated into many fields, among which a traffic network is also a kind of complex network. Based on complex network theory, modeling of traffic networks has been conducted, following which the characteristics and topology of the traffic network have been analyzed. A traffic detector network is the foundation of a traffic network and, so, the optimization of the traffic detector layout is key in traffic network planning.
In the light of the above, an optimization model—TNCM (Traffic Network Centrality Model)—based on complex network theory for traffic detector layout is presented in this paper. The network centrality can objectively reflect the topological characteristics and complexity of the traffic network. TNCM can find a suitable detector layout scheme to monitor the traffic status of the traffic network under fewer pre-conditions. Moreover, it is proved that TNCM can be applied to small, medium, and large networks. To the best of our knowledge, few scholars have used the centrality theory of complex network to solve the problem of traffic detector optimization layout before. A new method is proposed in this paper, which is expected to help traffic planners and managers in decision-making, as well as promote the harmonious and sustainable development of cities.
The rest of the paper is structured as follows. Section 2 describes the literature related to traffic detector layout and the centrality theory of complex networks. Section 3 introduces the research methodology and presents the model formulation. Section 4 analyzes the layout results under different scenarios, such as static networks, dynamic networks, and detector failure. Section 5 further discusses our key findings and, thus, proposes the implications of our research. Section 6 concludes the study and presents our research limitations and directions for future research.

2. Literature Review

2.1. Optimization of Traffic Detector Layout

Scholars have undertaken numerous studies on the optimal layout of traffic detectors and have made many achievements. These studies can be classified into statistical analysis, integer planning, dynamic programming, graph theory, artificial intelligence, simulation analysis, transportation planning, and so on, according to different technological research route used [1]. Hu et al. [2] established a model based on linear algebra under a stable traffic network, in order to find a minimal set of detector positions and, then, to estimate the traffic flow in the network. Based on mixed integer linear programming, Danczyk et al. [3] developed a method for the optimization of traffic detector layout. A bi-level programming method was proposed to estimate the real-time OD (Origin Destination) matrix by Gómez et al. [4], based on fuzzy logic theory. Li et al. [5] simplified the traffic network optimization problem into a multi-section optimization problem by sectioning and proposed a minimum investment model, considering the characteristics of traffic information spatial distribution, the location uniformity of link, and the total cost. Based on graph theory and matrix theory, Zhang et al. [6] presented a traffic detector layout method to estimate the traffic flow in each road section. Bartin et al. [7] proposed a method based on road monitoring technology, which accurately estimates the travel time. Zheng et al. [8] developed a method under an abnormal scenario, using fuzzy clustering analysis, regression analysis, and similar methods. Zhang et al. [9] studied the optimal layout spacing of highway traffic detectors based on a deviation threshold traffic event detection algorithm, and analyzed the trend of traffic parameters by VISSIM simulation software under the condition of whether or not an event occurred. A multi-objective model was presented by Wang et al. [10], based on the flow correlation between road sections, in which diverse influencing factors were comprehensively considered.
According to the different research purposes, the existing studies can be classified into OD estimation, travel time estimation, event detection, and traffic flow estimation. Yim et al. [11] evaluated different detector location selection methods aimed at estimated OD. According to the theory of maximum possible relative error, Yang et al. [12] proposed four rules for traffic detector location optimization using OD estimation, including an OD coverage rule, a maximum flow rule, a maximum interception flow rule, and a road independent rule. A two-stage model was presented for the purpose of OD estimation by Bianco et al. [13]. Chootinan et al. [14] developed a bi-objective location optimization model to estimate OD, and solved it using a distance-based genetic algorithm. Ehlert et al. [15] studied two kinds of extended models: One considered existing traffic detectors, while the other considered prior information of OD flow. Fei et al. [16] presented a model to maximize the efficiency of data collection and OD demand in a traffic network under the condition of minimizing the uncertainty of the OD demand matrix. Bertini et al. [17] focused on highway travel time estimation for display on roadside variable message signs and described a concept developed from first principles of traffic flow, in order to establish optimal sensor density. Mínguez et al. [18] proposed an optimal vehicle license plate recognition detector layout model based on given prior OD demands. In 2010, Zhou et al. [19] established an optimal distribution model for single-point and point-to-point detectors to estimate the OD matrix based on information theory; and Xing and Zhou et al. [20] considered various sources of error in estimation and prediction. Ban et al. [21] discretized the two dimensions of time and space and proposed a dynamic programming model aiming at highway travel time estimation. Zhang et al. [22] took the minimum travel time estimation error as the optimization objective and studied the optimization of a highway traffic detector layout. Castillo et al. [23] calculated the OD matrix and road flow through traffic data obtained from observation points and solved seven kinds of observation point problems in a traffic network. A new placement configuration for departure detectors was proposed and named the mid-intersection detector by Gholami [24], in which departure detectors can be activated by more than one movement at different times.
In addition, due to the complexity and uncertainty of traffic situations [25], the uncertainty of a traffic detector layout should be considered. A multi-objective detector deployment model based on the minimization of demand uncertainty was proposed by Fei et al. [26], which considered the information acquisition and coverage of OD pairs. Li and Ouyang analyzed the reliability of optimal deployment of a traffic sensor network in 2010 in [27], presented a method to simultaneously estimate the travel time and the OD matrix in 2011 in [28], and established a reliable optimal deployment model for traffic detectors based on mixed integer programming in 2012 in [29], in which an effective measure (including flow coverage, vehicle mile coverage, square error reduction, and so on) and alternative schemes under traffic detector failure were proposed. Zhu et al. [30] established a new two-stage random model, considering uncertain detector failure factors.
To address the problem of traffic detector optimal layout, scholars have carried out a series of studies in terms of the research object, research content, research purpose, research technical route, research angle, application scenario, and so on. The existing studies can be classified into highway and urban roads, according to the research context. Furthermore, they can be classified as considering detector number, detector location, detector density, data accuracy, and so one, according to the research object; or classified into OD estimation, travel time estimation, event detection, and traffic flow estimation, according to different research purpose. Finally, they can also be classified as using mathematical methods, computer methods, transportation planning methods, and so on, according to the research technology route used. Although the principles and methods in the literature radically vary, the common aim is to find the best traffic detector layout, in order to maximize the revenue and minimize the cost. From a literature review on the optimization of traffic detector layout, pre-conditions or assumptions have been essential for some studies; however, it is hard to collect enough data for analysis in a complex traffic network. The models presented in some studies are highly complex; however, this is more of theoretical significance than of practical significance in actual engineering. It is undeniable that the above research has made a variety of breakthroughs; however, most studies have only focused on one aspect related to traffic detector layout (e.g., traffic parameters or OD). Furthermore, there is little information about observation of the real-time state of a traffic network from a global perspective. Traffic networks may be complex, either statically or dynamically, but the existing research has focused mainly on static traffic network scenarios. For that reason, based on the complex network theory, the TNCM model is proposed in this paper, with the aim of observing a traffic network with applicability to multiple scenarios.

2.2. Network Centrality

Network centrality has been widely used in various fields (e.g., urban planning, urban geography, economic geography, and so on) in developed countries (e.g., the United States and U.K.), in applications such as urban crime, network monitoring design, community planning, residential area planning, urban spatial structure analysis, urban land use density, among others. As network centrality reflects the importance of the location of a node or link in the network, the results are helpful to determine the key points in a network. Network centrality plays an important role in complex network topology analysis. Linton et al. [31] introduced the concept and measurement standard of network centrality, which is the key to complex networks. Chang et al. [32] indicated that the centrality analysis of traffic networks is of great significance in transport planning and transportation construction.
There are four kinds of network centrality: point centrality, eigenvector centrality, betweenness centrality, and closeness centrality. Point centrality is defined as the number of other nodes linked to a node. Eigenvector centrality means that the eigenvector centrality of a node is proportional to the sum of the relative index values of all nodes connected to it when all nodes have relative index values. Betweenness centrality includes point betweenness centrality and the edge betweenness centrality: point betweenness centrality is the proportion of the number of paths passing through a node in the shortest path of all node pairs in the network compared to the total number of shortest paths, while edge betweenness centrality is the proportion of the number of paths passing through an edge in the shortest path of all nodes in the network compared to the total number of shortest paths. Closeness centrality refers to the average distance of the shortest path from a node to all other nodes.
The above four network centralities have different emphases. Point centrality focuses on the measurement of the local importance of nodes, which is simple and of low computational complexity. Considering the quality and quantity of each node, eigenvector centrality can evaluate the relative importance of a node more objectively, which is also simple and of low computational complexity. As an important global geometric quantity, betweenness centrality can reflect the control of a node or link to the network flow in terms of congestion, and the influence of the corresponding node or edge in the whole network, which is relatively complex and of high computational complexity. Closeness centrality can evaluate the degree to which a node disseminating information is independent of other nodes. The closer the node is to other nodes, the more independent it is in disseminating information. As a non-core node should pass through other nodes to spread information, it is easily subject to other nodes. Therefore, a node is the center of network if it has minimal distance to other nodes.
Considering the above analysis of network centrality, point centrality and eigenvector centrality can only analyze the local importance of nodes. This paper analyzes the network from an overall perspective and, thus, modifies the betweenness centrality to provide an optimal selection of links.

3. Materials and Methods

This paper focuses on traffic networks and proposes a centrality model to optimize the layout of traffic detectors in different scenarios. The purpose of this is to generate a traffic detector layout covering as many important links as possible. Traffic flow is not the only factor that influences a link’s importance: many other factors, such as network topology, manager preference weight, road network status, and so on, can also play a role. In addition, the detector failure factor also needs to be considered. So, the problem can be described as: under the given constraints, which links should be installed with traffic detectors to monitor the traffic network better and obtain more valuable traffic information, as measured by the covered path’s importance. According to the centrality model, the first step is to analyze the network and determine link centrality and path centrality, followed by solving the optimization model using a genetic algorithm.

3.1. Description of the Traffic Network

A traffic network is composed of several links (roads) and nodes (intersections). In this paper, it is considered as a weighted directed graph. In general, a typical traffic network can be expressed as G ( V ,   E ) , where:
V represents the set of all nodes, V = { v 1 , v 2 , , v n } , and N = | V | is the number of nodes;
E represents the set of all links, E = { e 1 , e 2 , , e m } , and M = | E | is the number of links;
W represents the set of OD pairs, W = { w 1 , w 2 , , w z } , and Z = | W | is the number of OD pairs; and
R represents the set of efficient paths between all OD pairs, R = { r 1 , r 2 , , r h } , and   H = | R | is the number of OD pairs. The efficient paths defined here are all simple paths; that is, each node in a path’s node sequence appears only once.

3.2. Centrality of Static Network

This section will discuss the key concepts of links and paths for describing the static network used in TNCM.

3.2.1. Link Centrality of an Unweighted Network

Link centrality, based on betweenness centrality, is the numerical representation of how important a link is in a network.
Definition 1.
Link centrality in an unweighted network, c B ( a ) .
The link centrality of a link is the proportion of the shortest paths that pass through the link, compared to all shortest paths in the network:
c B ( a ) = i , j V σ ( i , j | a ) σ ( i , j ) ,
where σ ( i , j ) is the number of shortest paths between i and j , and σ ( i , j | a ) is the number of shortest paths between i and j that pass through link a .
The route choice of a user travelling is closely related to their travel time; thus, the link centrality of a link is positively related to its traffic flow. In particular, if the number of efficient paths between an OD pair is limited to 1 and the travel strategy is based on the shortest travel time, then the link centrality is the proportion of traffic flow in the total traffic flow.
According to the definition of link centrality, the higher the link centrality of a link, the greater its connectivity and influence in the traffic network. The probability of selecting this link is also higher when a user travels and is more significant to observe. Under the same path or traffic coverage, covering important links and important paths is better.
Take the Fishbone network as an example (as shown as Figure 1), in which each section has equal travel time. There are 66 shortest paths in total, and the link centrality of link 14 and link 16 are the largest, with a value of 0.273 and passed by 18 shortest paths. The link centrality of links 9, 10, 17, and 18 rank second, with a value of 0.197 and passed by 13 shortest paths. Links 14 and 16 are, thus, the most important links of the network, with the largest traffic observation revenue.

3.2.2. Link Centrality of Weighted Network

The link centrality of an unweighted network quantifies the importance of the link from the perspective of the network topology. However, in an actual traffic network, a link’s weight is also affected by many other factors, such as OD demand, design planning, and decision-maker’s preferences. Take the OD demand as an example, which indicates travel demand between origin and destination, represented as traffic flow. When the OD demand is known, the travel flow of users in each OD pair may be different and, consequently, the link’s importance changes. A link with high flow should have a higher link centrality. Therefore, the weight of a link is introduced to fix the link centrality in a weighted network in which the link centrality is determined by network topology, traffic flow, and other factors.
Definition 2.
Link centrality in a weighted network, c B W ( a ) .
{ c B w ( a ) = ρ ( a ) · c B ( a ) ρ ( a ) = w ( a ) · | A | b A w ( b ) ,
where ρ ( a ) is the gain coefficient of the link centrality of link a in the weighted network. In particular, ρ ( a ) is equal to 1 if all link weights are equal. In this case, the link centrality of the weighted network is equivalent to that of the unweighted network; that is, c B w ( a ) is equal to c B ( a ) .
The weight of a link can be specified manually or calculated using the traffic flow. Taking the Fishbone network as an example, the travel time and capacity of each link are equal, and the specific parameters are shown in Table 1.
Based on the OD demand, a traffic network that prefers to use the "upper half" is constructed. As the network has a symmetrical structure, the importance of the upper half is higher than that of the lower half. In the results of traffic assignment, although the flow of link 14 is 1,0536 as that of link 6, the centrality of link 14 is higher than that of link 6, as it handles more traffic demand.
Taking the traffic flow as the link weight, we can calculate the link centrality. The results are shown in Figure 2. The numbers in brackets after the link ID are the link centralities in the unweighted network and the weighted network, respectively. It can be seen that the link centrality in the upper half generally increases, while the link centrality in the lower half decreases or increases only slightly.
The link centrality of a weighted network evaluates the importance of a link by considering various factors comprehensively, which maximizes the influence of the link when the network changes and has good adaptability to change.

3.2.3. Path Centrality

In the monitoring of a traffic network, priority should be given to links with a large link centrality, in order to cover the most important links. However, there may be a strong correlation between links. If only link centrality is the priority strategy, resource waste will occur.
A special observation network is shown in Figure 3. The number on the link represents the link centrality, where nodes 1, 2, 3, 4, and 5 are the origin and nodes 9 and 10 are the destination.
If the number of traffic detectors is 3, then the layout solution with the road centrality as the priority strategy is (6,7), (7,8), and (8,10). Obviously, (6,7) and (7,8) are duplicate arrangements.
Therefore, it is necessary to consider the path, instead of the link, to reduce the strong correlation between links and maximize the overall observation revenue. Path centrality is used to represent the importance of a path and the detector is deployed to cover more important paths, eliminating the impact of link correlation.
Definition 3.
Path centrality, c B W ( r ) .
The path centrality represents the importance of a path, which is calculated by the weighted average of the centrality of all links on the path. Among them, the weight of each link is the link centrality, which can reduce the influence attenuation of important links in the path:
c B W ( r ) = a r c B W ( a )   · c B W ( a ) b r c B W ( b ) .
In Figure 3, there are eight shortest paths between nodes 1, 2, 3, and 4 and nodes 9 and 10, where c B W ( r ) is 0.673. There are two paths from node 5 to nodes 9 and 10, where c B W ( r ) is 0.1. In order to cover more important paths, links (6,7), (5,9), and (5,10) are selected for the detector layout, in order to cover more travel routes. Obviously, this is an optimal solution under the current conditions.

3.3. Dynamic Network Centrality

From the above analysis, it is clear that the two key factors of link centrality are the link weight and link travel time, which are both fixed values in a static network. However, in a real traffic network, changes in conditions, such as traffic jams, accidents, traffic control, road maintenance, and special weather conditions, are inevitable.
A typical dynamic network change is shown in Figure 4. The weight and the travel time of a link change with time. At the time t = 2 , traffic along the link (2,4) is heavy and the travel time increases from T to 5T; while the traffic flow demand along link (3,4) decreases, the weight drops to 0.5, and the traffic time decreases to 0.9T, as the road is smooth. At the time t = n , the congestion along link (2,4) is relieved, the travel time is reduced to 2T, and the traffic time and weight of link (3,4) are restored to that at t = 1 .
For such networks, a static representation will lead to the loss of a lot of valuable information. Therefore, it is necessary to consider the influence of network changes on centrality.
Definition 4.
Network sequence diagram.
A dynamic traffic network is sampled, according to the time, in order to obtain the corresponding static traffic network at different times. The static network at each sampling time is called a snapshot network. For example, the snapshot obtained at the first time is G 1 , the snapshot obtained at the second time is G 2 , and so on. A series of snapshots, such as G 1 , G 2 , , G T 1 , G T , are obtained. The snapshot sequence G 1 ,   G 2 , , G T 1 , G T is used to represent the dynamic network from time 1 to time T , where G t = ( V t , E t ) is the snapshot at the time t ( t = 1 , 2 , , T 1 , T ) . Call G t s = { G 1 ,   G 2 , , G T 1 , G T } the network sequence diagram of the traffic network.
Then, w t ( e ) is a non-negative function defined on a link e, which represents the weight of a link e at time t , and t t ( e ) is a non-negative function defined on a link e , which represents the travel time of link e at time t .
The link centrality of link a under the network sequence diagram G t s is a fitting result of the link centrality of link a at all times. Here, the weighted average method is adopted, which is defined as follows:
c B W ( a ) ¯ = i = 1 T θ ( t ) · c B W t ( a ) j = 1 T θ a ( j ) ,
where c B W t ( a ) represents the centrality of link a in G t and θ a ( i ) represents the sampling weight of link a at time i . The greater the sampling weight, the greater the observation value and observation preference of the link at this time.
Using c B W ( a ) ¯ to describe the centrality of link a in G t s will produce a large error if the network changes a lot, as the sample distribution is too scattered and we are unable to obtain a good fitting result. In this paper, the centrality distance of the traffic network is used to describe the change.
Definition 5.
Network centrality distance.
d ( G i , G j ) = a G ( c B W i ( a ) c B W j ( a ) ) 2 .
The function d ( G i , G j ) is a function defined on G t s . The traffic network at any time is regarded as a multi-dimensional vector composed of all link centralities, and the network centrality distance between traffic networks is the standard Euclidean distance between these vectors.

3.4. Detector Failure Scenario

In an actual traffic network, a detector may break down and affect the acquisition of traffic information. Therefore, the impact of detector failure should be taken into account when obtaining a detector layout.
There may be many failure states in a detector. For the sake of simplification, this paper assumes that there are only two states in the detector: 0 for normal state and 1 for failure state. The failure probability of each detector is independent and distributed in [0, 1]. It is assumed that the failure probability of each detector is a fixed value p . For a layout solution using n detectors, there are 2 n failure scenarios in ξ :
ξ = { ξ 1 , ξ 2 , , ξ 2 n } .
Any failure scenario ξ k , ξ k ξ is an n-dimensional vector, where the value of each dimension is the state of the corresponding deployed detector, 0 or 1. Let m be the number of detectors in failure state in scenario ξ k ; then, the probability of occurrence of ξ k is p m ( 1 p ) 1 m .
The relationship between the solution l , the failure scenario ξ k , and the traffic information state vector s can be described as follows:
s a ( l a ,   ξ k a ) = l a ( 1 ξ k a ) ,
where l a represents whether there is a traffic detector at link a , l a = 1 indicates that link a is covered by the detector, and l a = 0 indicates the opposite;   ξ k a represents the failure state of the detector at road a when ξ k occurs, ξ k a = 1 indicates that the detector installed at road a is in failure state, ξ k a = 0 indicates that the detector installed at road a work normally, and ξ k a does not exist for roads with no detector; and s a represents whether real-time traffic information can be obtained at link a : if s a = 1 , traffic information at link a can be obtained, while s a = 0 indicates the opposite.

3.5. Traffic Network Centrality Model (TNCM)

Based on the above discussion and considering the dynamic characteristics of a traffic network and detector failure scenario, this paper proposes an optimal traffic detector layout model based on network centrality, which is called TNCM (Traffic Network Centrality Model). The relevant definitions are as follows:
f : Path centrality vector, where f r represents the path centrality of path r .
y : Path cover vector, where y r = 1 means path r is covered by a detector, while y r = 0 means that path r is not covered.
l * : Related to budget constraints and represents the number of detectors.
g : Specifies the layout of the link vector; g a = 1 means that link a must have a detector, while g a = 0 means that link a does not have such a constraint; and the number of specified links must not exceed the budget constraints.
The objective function and constraints of TNCM are as follows:
m a x     E ( r R y r f r ) ,
  s . t . l a { 0 ,   1 } ,   a A ,
l a = 1   w h e n   g a = 1 ,   a A ,
  a A l a =   l * .
Equation (8) is the objective function of the model, indicating the maximum expected value of path centrality covered. For a layout scheme using n detectors, there are 2 n failure scenarios in ξ . The total expected value of path centrality covered is the sum of expected values under all failure scenarios.
Constraint (9) indicates that the number of detectors installed on any road meets the 0–1 variable constraint, constraint (10) indicates that detectors must be deployed at the specified links, and constraint (11) indicates that the number of detectors must be equal to the budget constraints.
The TNCM is solved by a genetic algorithm, which directly operates the structural object without limitations in terms of derivation and function continuity, and has inherent implicit parallelism and better global optimization ability. The probabilistic optimization method can automatically obtain and guide the optimized search space without definite rules, as well as adjusting the search direction adaptively.
The detailed steps followed in this study using TNCM are shown as Figure 5. There are two main stages, listed as follows:
  • Stage 1: Traffic Network analysis. There are two scenarios for TNCM: static and dynamic. For the dynamic scenario, samples should be taken according to the requirements (P1-1) to construct a dynamic network diagram. Each sequence item is a static network. In particular, a static scenario is equivalent to a dynamic scenario where the number of items in the sequence is 1. When calculating the link centrality for a static network, the UE (Users Equilibrium) model (P1-3-1) performs the traffic assignment to generate the gain coefficient of each link, if the OD matrix is given. Finally, based on the observation weights, P1-4 fits a static network with link centrality to represent the dynamic network diagram. This static network is the key output of stage 1.
  • Stage 2: Optimization problem. This stage deals with a single-target optimization problem (P2-1) with inputs, such as a static network with link centrality, and constraints, including specified links with a detector installed, detector number limit, and detector failure probabilities. By solving this problem with the genetic algorithm (P2-2), the optimal layout solution is obtained.
In this paper, the OD matrix is optional. If the OD matrix is given, the classic user equilibrium model is used to obtain the link flow, which is used as the input for calculating link weight and validating model results. Otherwise, a default OD matrix is used. In this case, there is an OD demand between each node and the weight of each link is set equal to 1.

4. Data and Results

In this paper, the traffic network of Sioux Falls, South Dakota, USA is used for a case study, where the data were obtained from [33]. The network consists of 24 nodes and 76 links. Link travel times and capacities are known.

4.1. Analysis of Traffic Network

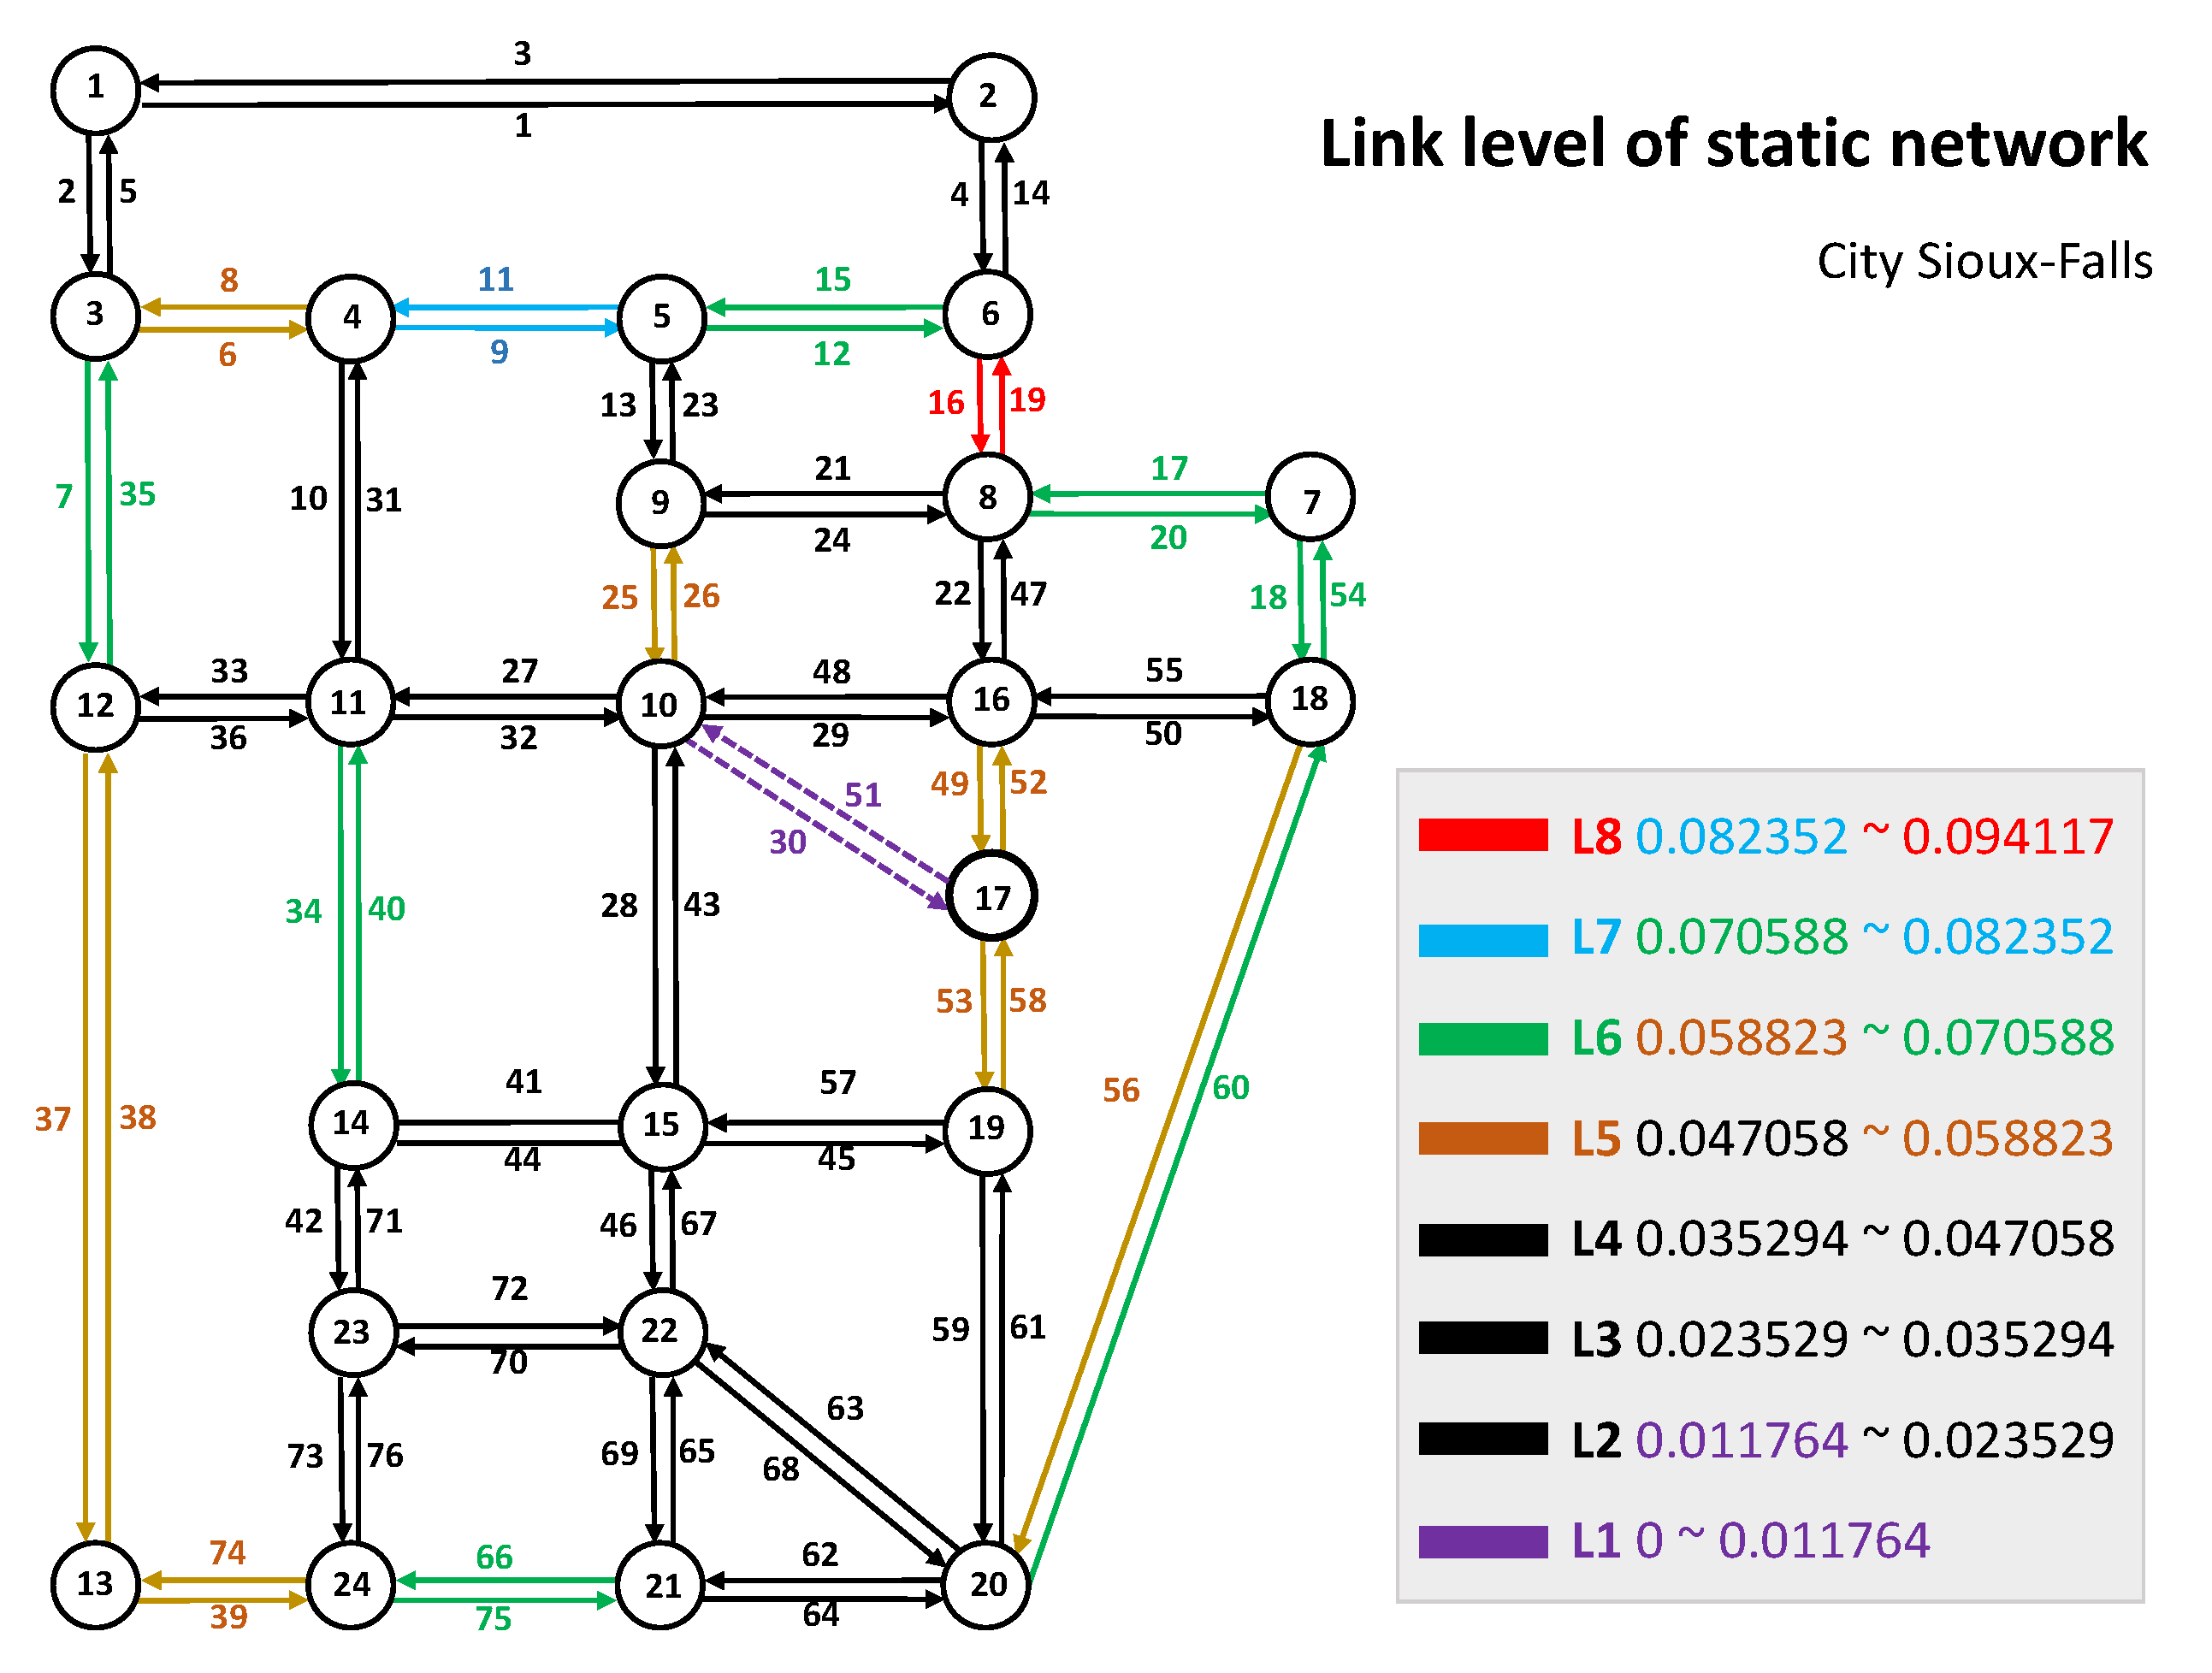
Assuming that the link weights were equal to 1, links 16 and 19 had the highest link centrality ( c B W ( 16 ) = c B W ( 19 ) = 0.094118 ) and link 30 had the lowest link centrality ( c B W ( 30 ) = 0.008403 ). The key links in the traffic network can be judged by the importance of the links. Taking the link centrality as the evaluating standard, the links are divided into 8 grades, L1–L8, as shown in Figure 6.
It can be seen that links 16 and 19 were the most important links, while links 30 and 51 were the least important links. The higher the level of a link, the more important the link’s traffic information. Monitoring paths that pass through important links will get the maximum observation benefit.

4.2. Case Study

The following content will analyze a static network case, a dynamic network case, and a detector failure case, respectively.

4.2.1. Case Study of Static Network

In the static network case, it was assumed that there was an OD demand between each node, the weight of each link was equal to 1, the paths chosen by users between OD pairs were the shortest three paths, and that the detector failure probability was p = 0 .
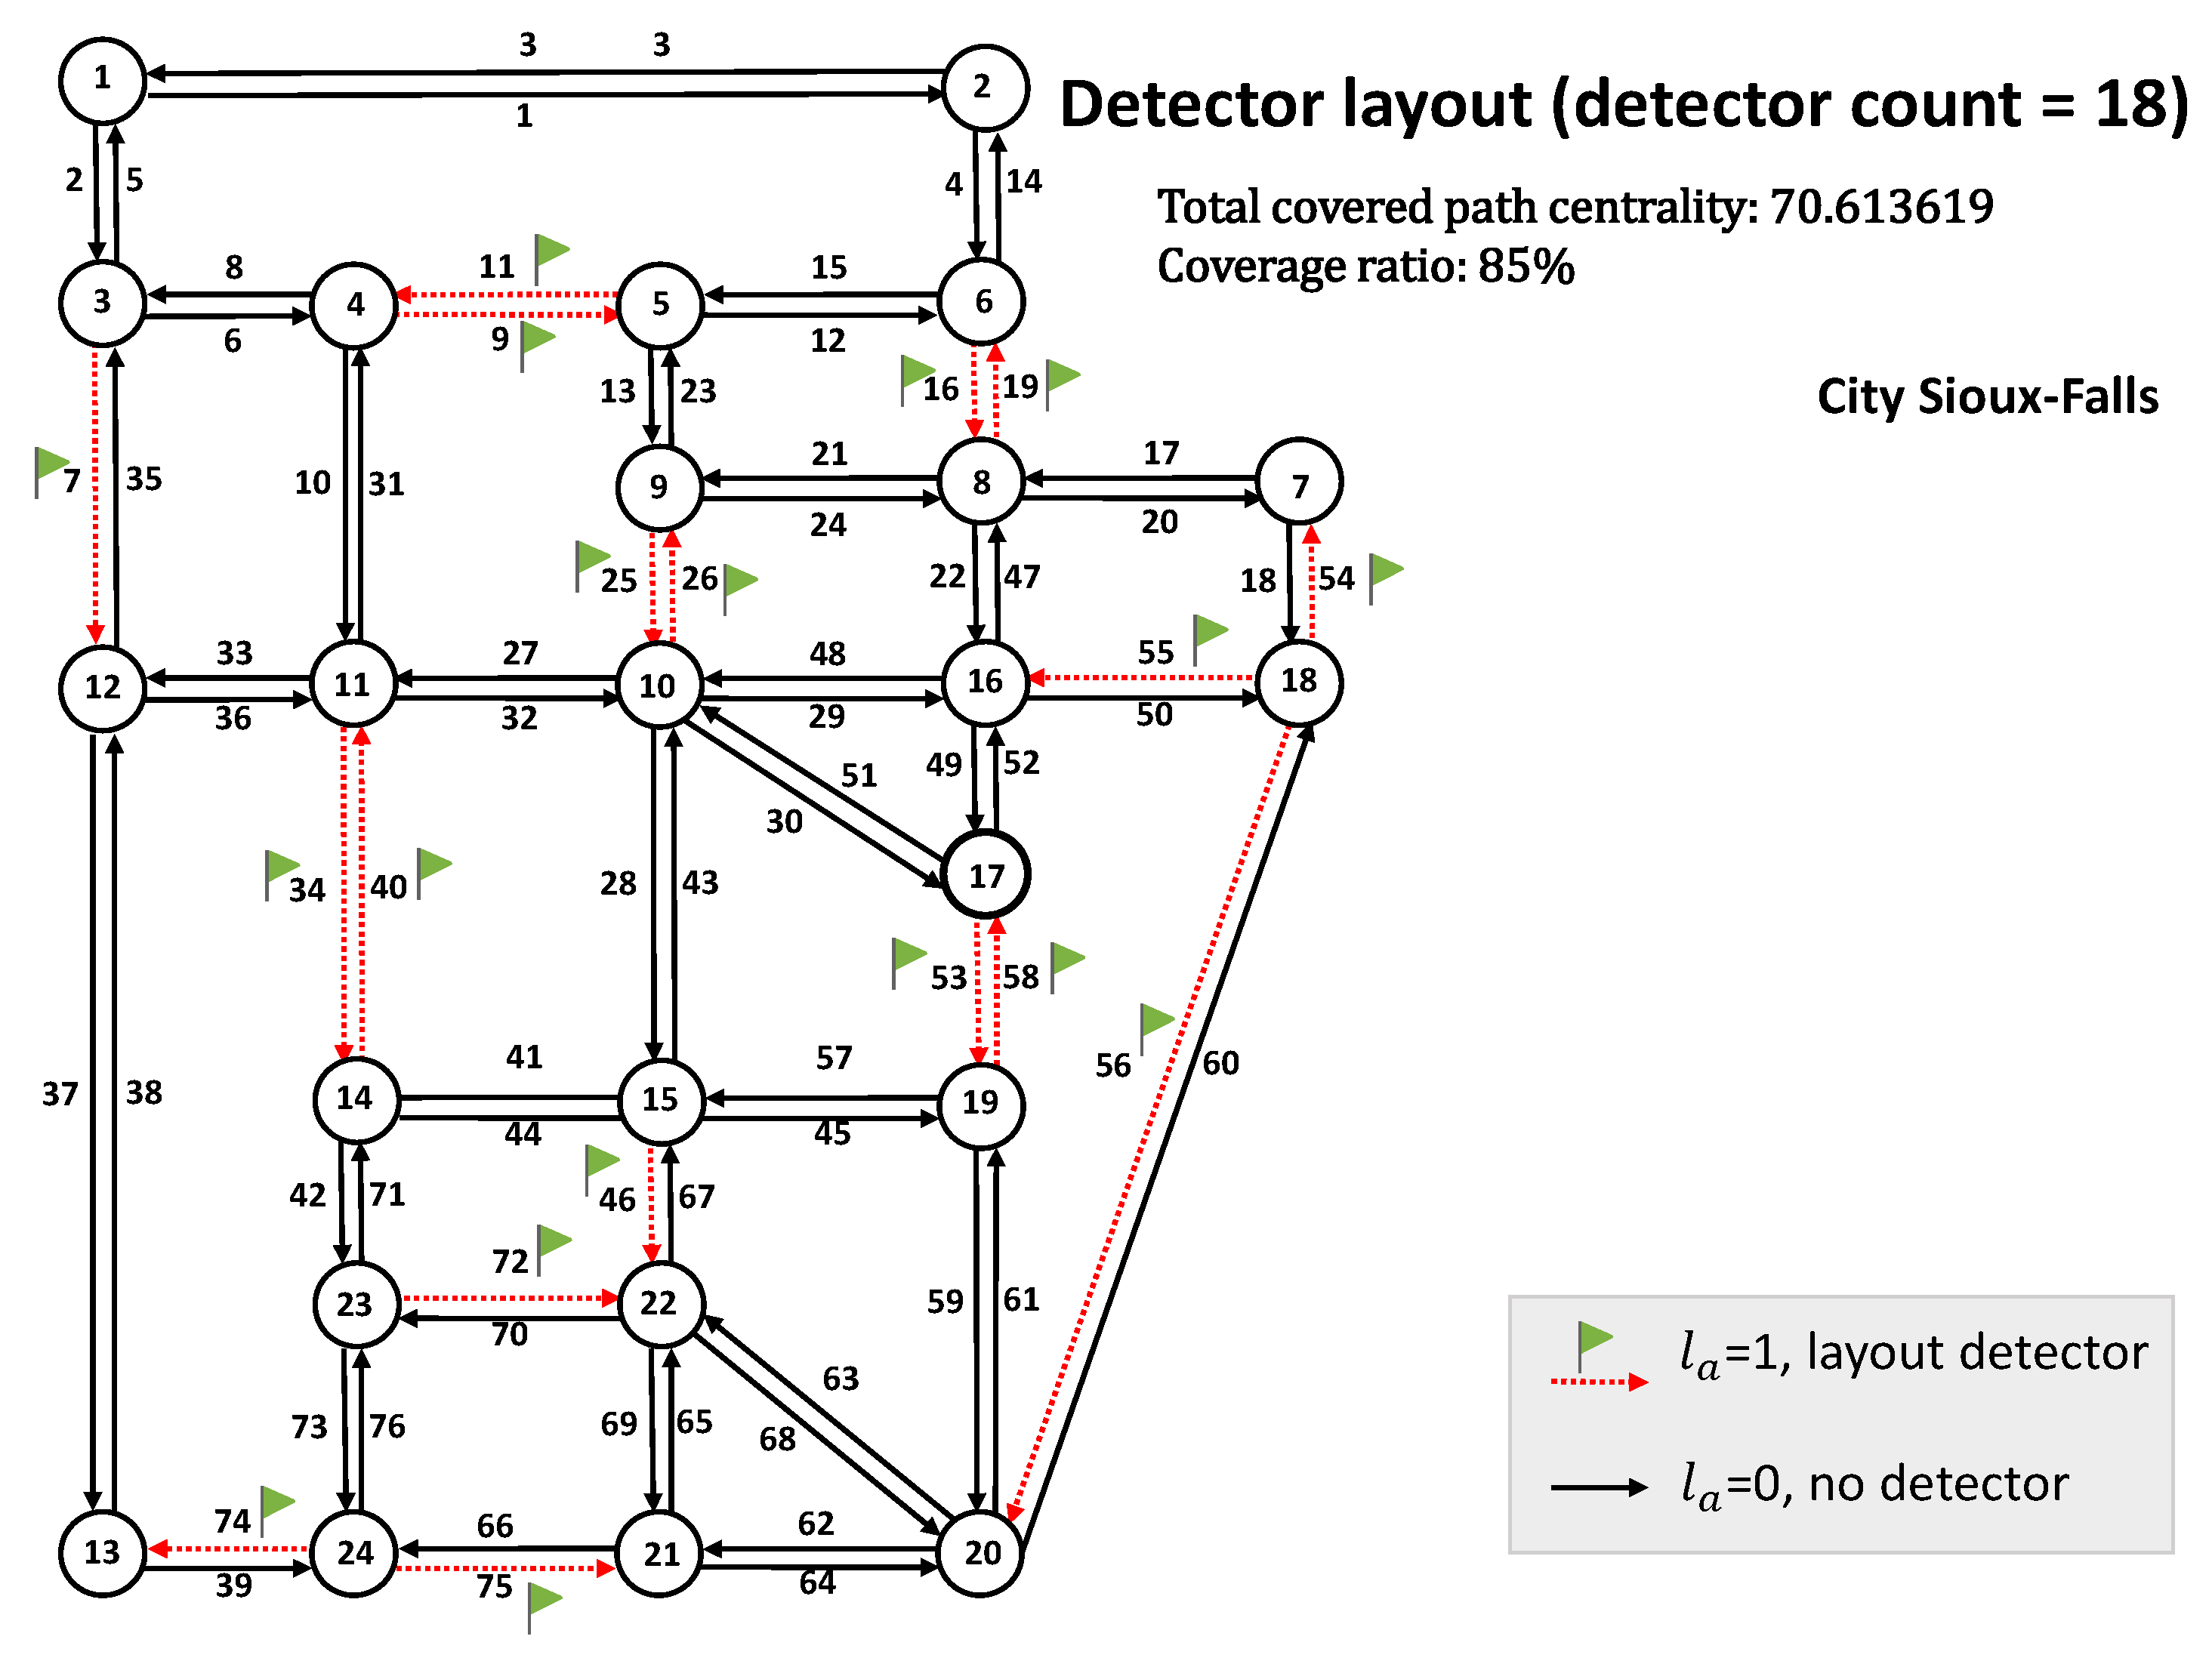
Let the number of detectors be 18, then the detector layout solution is as shown in Figure 7. The path centrality of the optimal solution was 70.613619 and the coverage rate was 85%. The links installed with detectors tended to be links with high link centrality.
To compare the layout schemes with different detector number constraints, different numbers of detectors were evaluated {8, 9, 10, 11, 12, 13, 14, 15, 16, 17, 18, 19, 20, 21, 22, 23, 24}. The layout solutions are shown in Table 2.
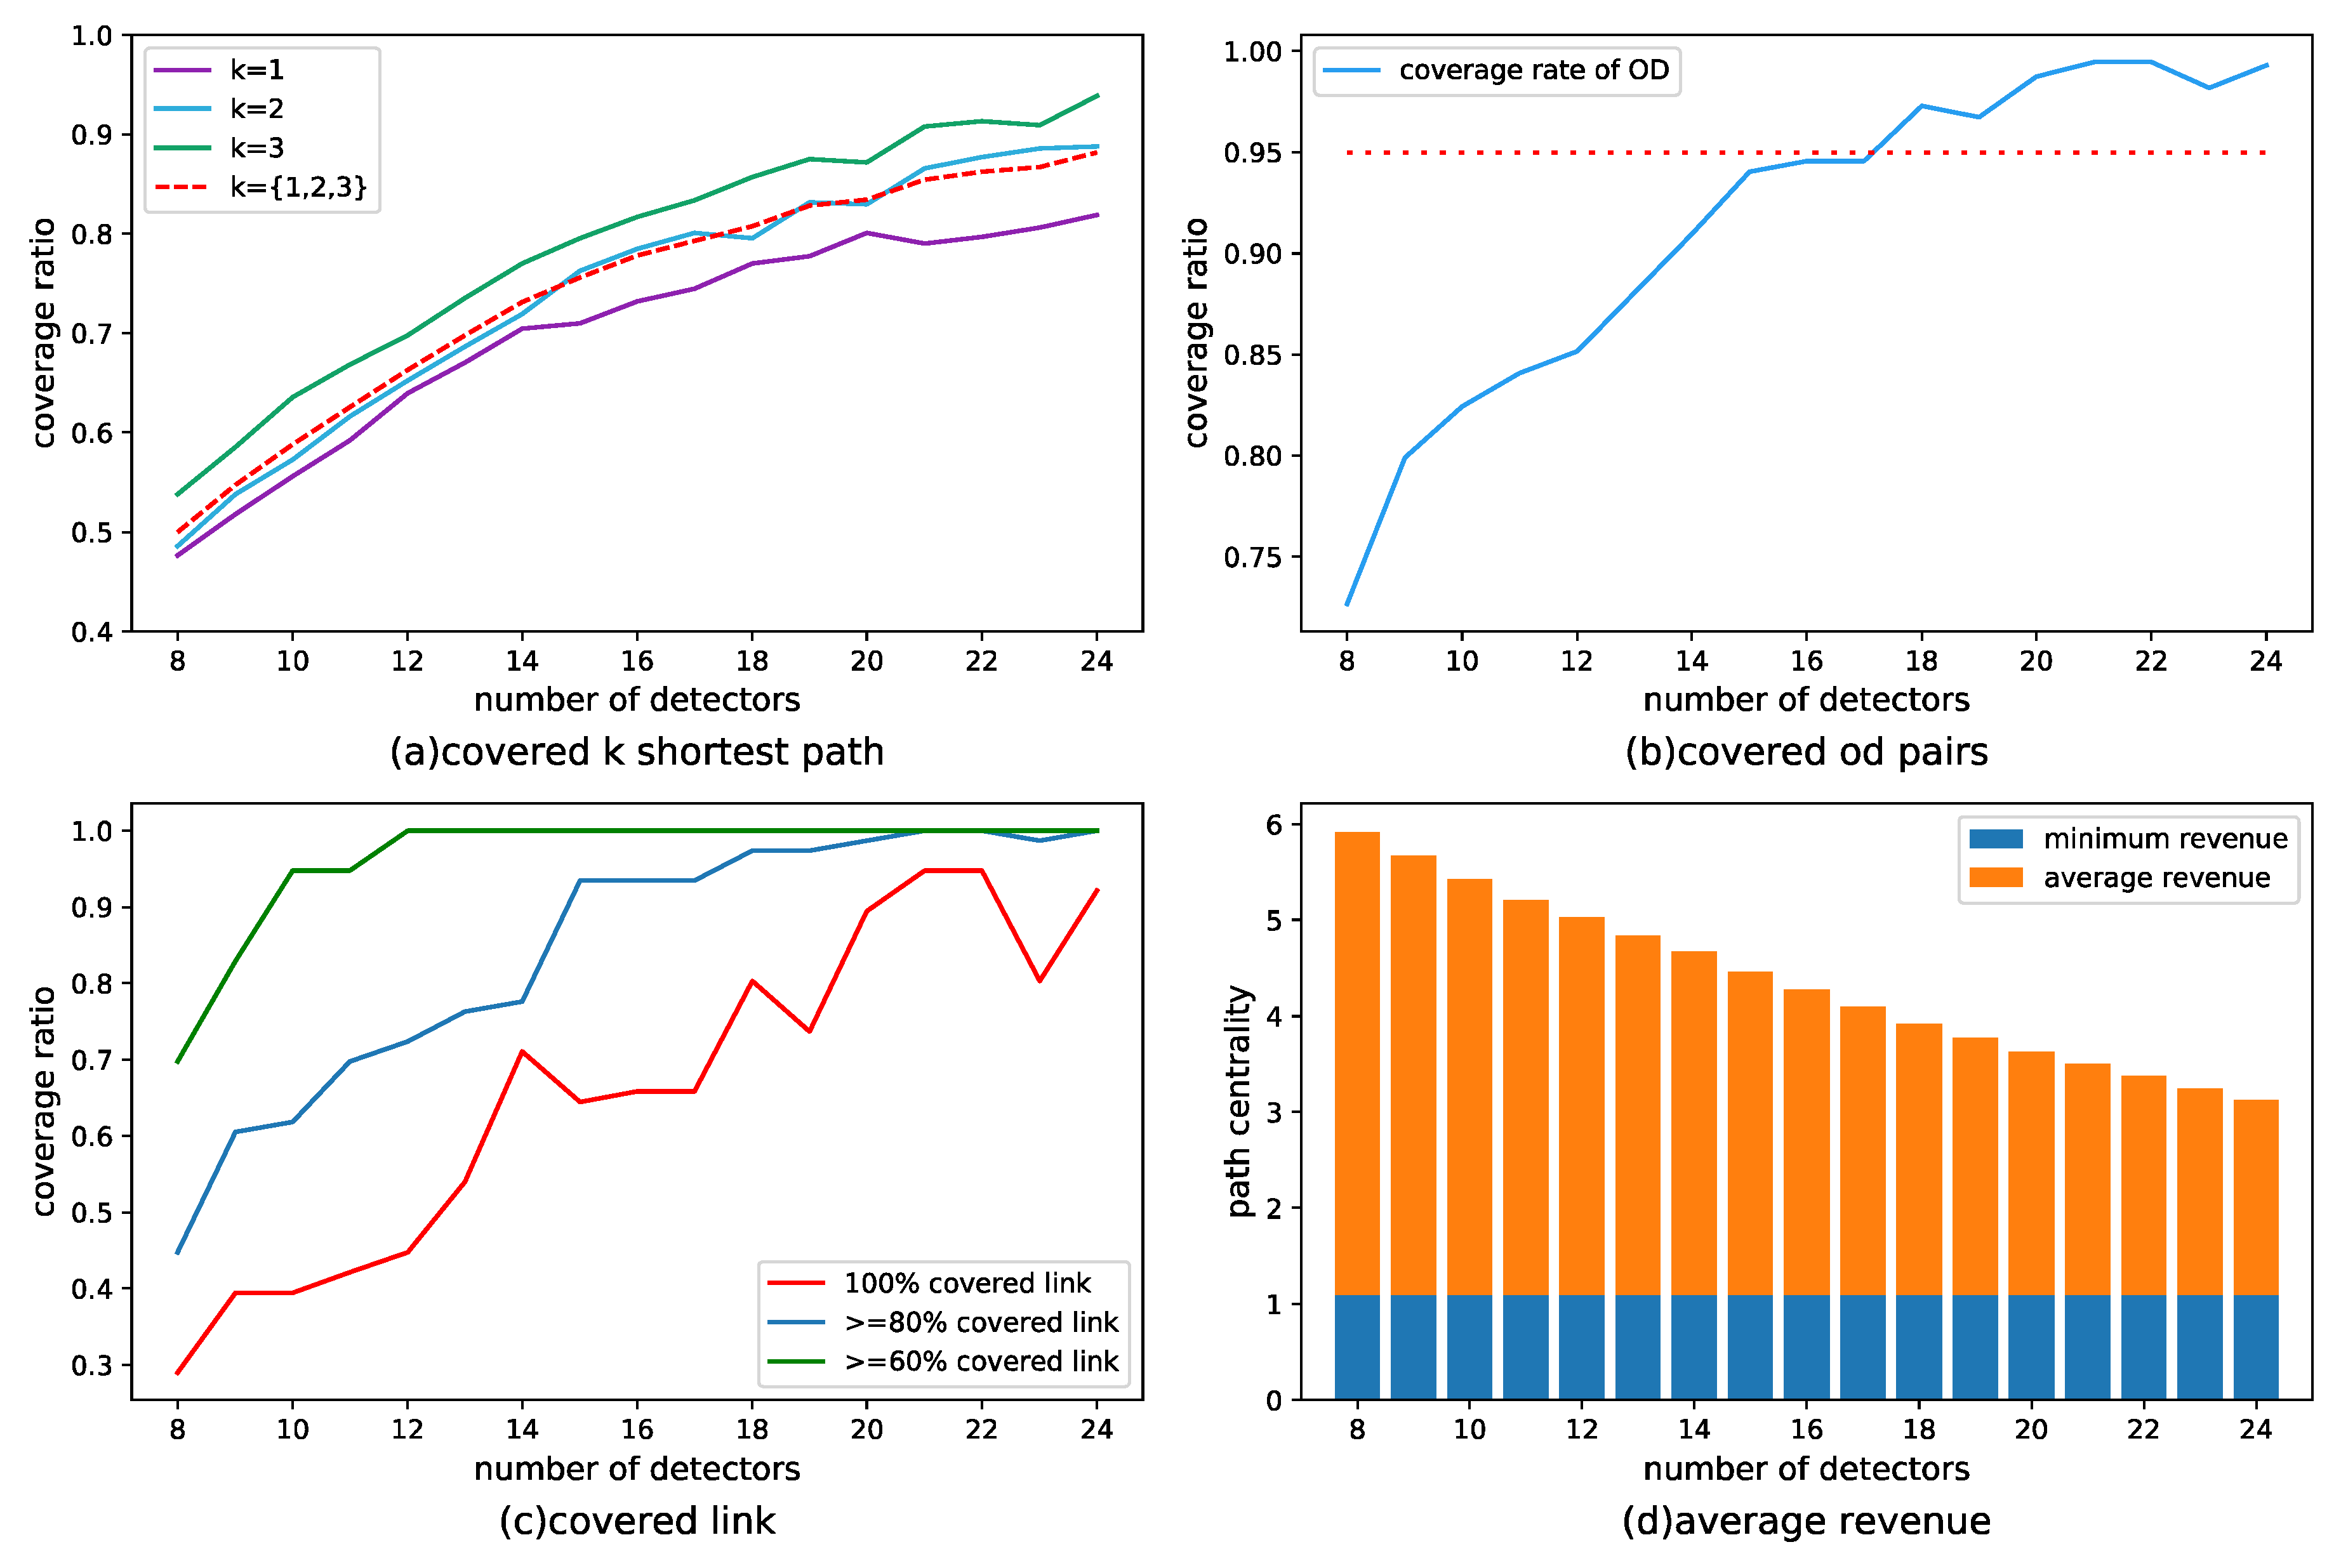
As the number of detectors increased, the covered path centrality increased. The analysis of layout solutions under the limitation of different detector count is shown in Figure 8 and described as follows.
  • (a) The shortest k path coverage: with an increase in the number of detectors, coverage of the efficient paths between OD—that is, the shortest k paths—increased gradually. The coverage rate with k = 3 was the highest and that with k = 1 was the lowest. In the traffic network, the path centrality of the shortest path was the largest, as well as the coverage difficulty.
  • (b) OD pair coverage: when the number of detectors increased between 8 and 15, the OD pair coverage increased rapidly, after which the growth flattened. When the number was 18 or more, the coverage rate was larger than 95%. For a static network with OD demand in all nodes, this coverage rate is effective in monitoring the traffic network.
  • (c) Link coverage: A link is called a complete coverage link if all efficient paths passing through it are covered. The results show that, when the number of detectors was 20 or more, the proportion of complete coverage links in all links reached about 90%. When the number of detectors was 12 or more, the proportion of 60% coverage links was maintained at 100%. From another point of view, the layout solution can effectively observe the traffic network.
  • (d) Average revenue: As the number of detectors increased, the average revenue obtained by a single detector gradually decreased, but was still larger than the minimum revenue of the whole network.
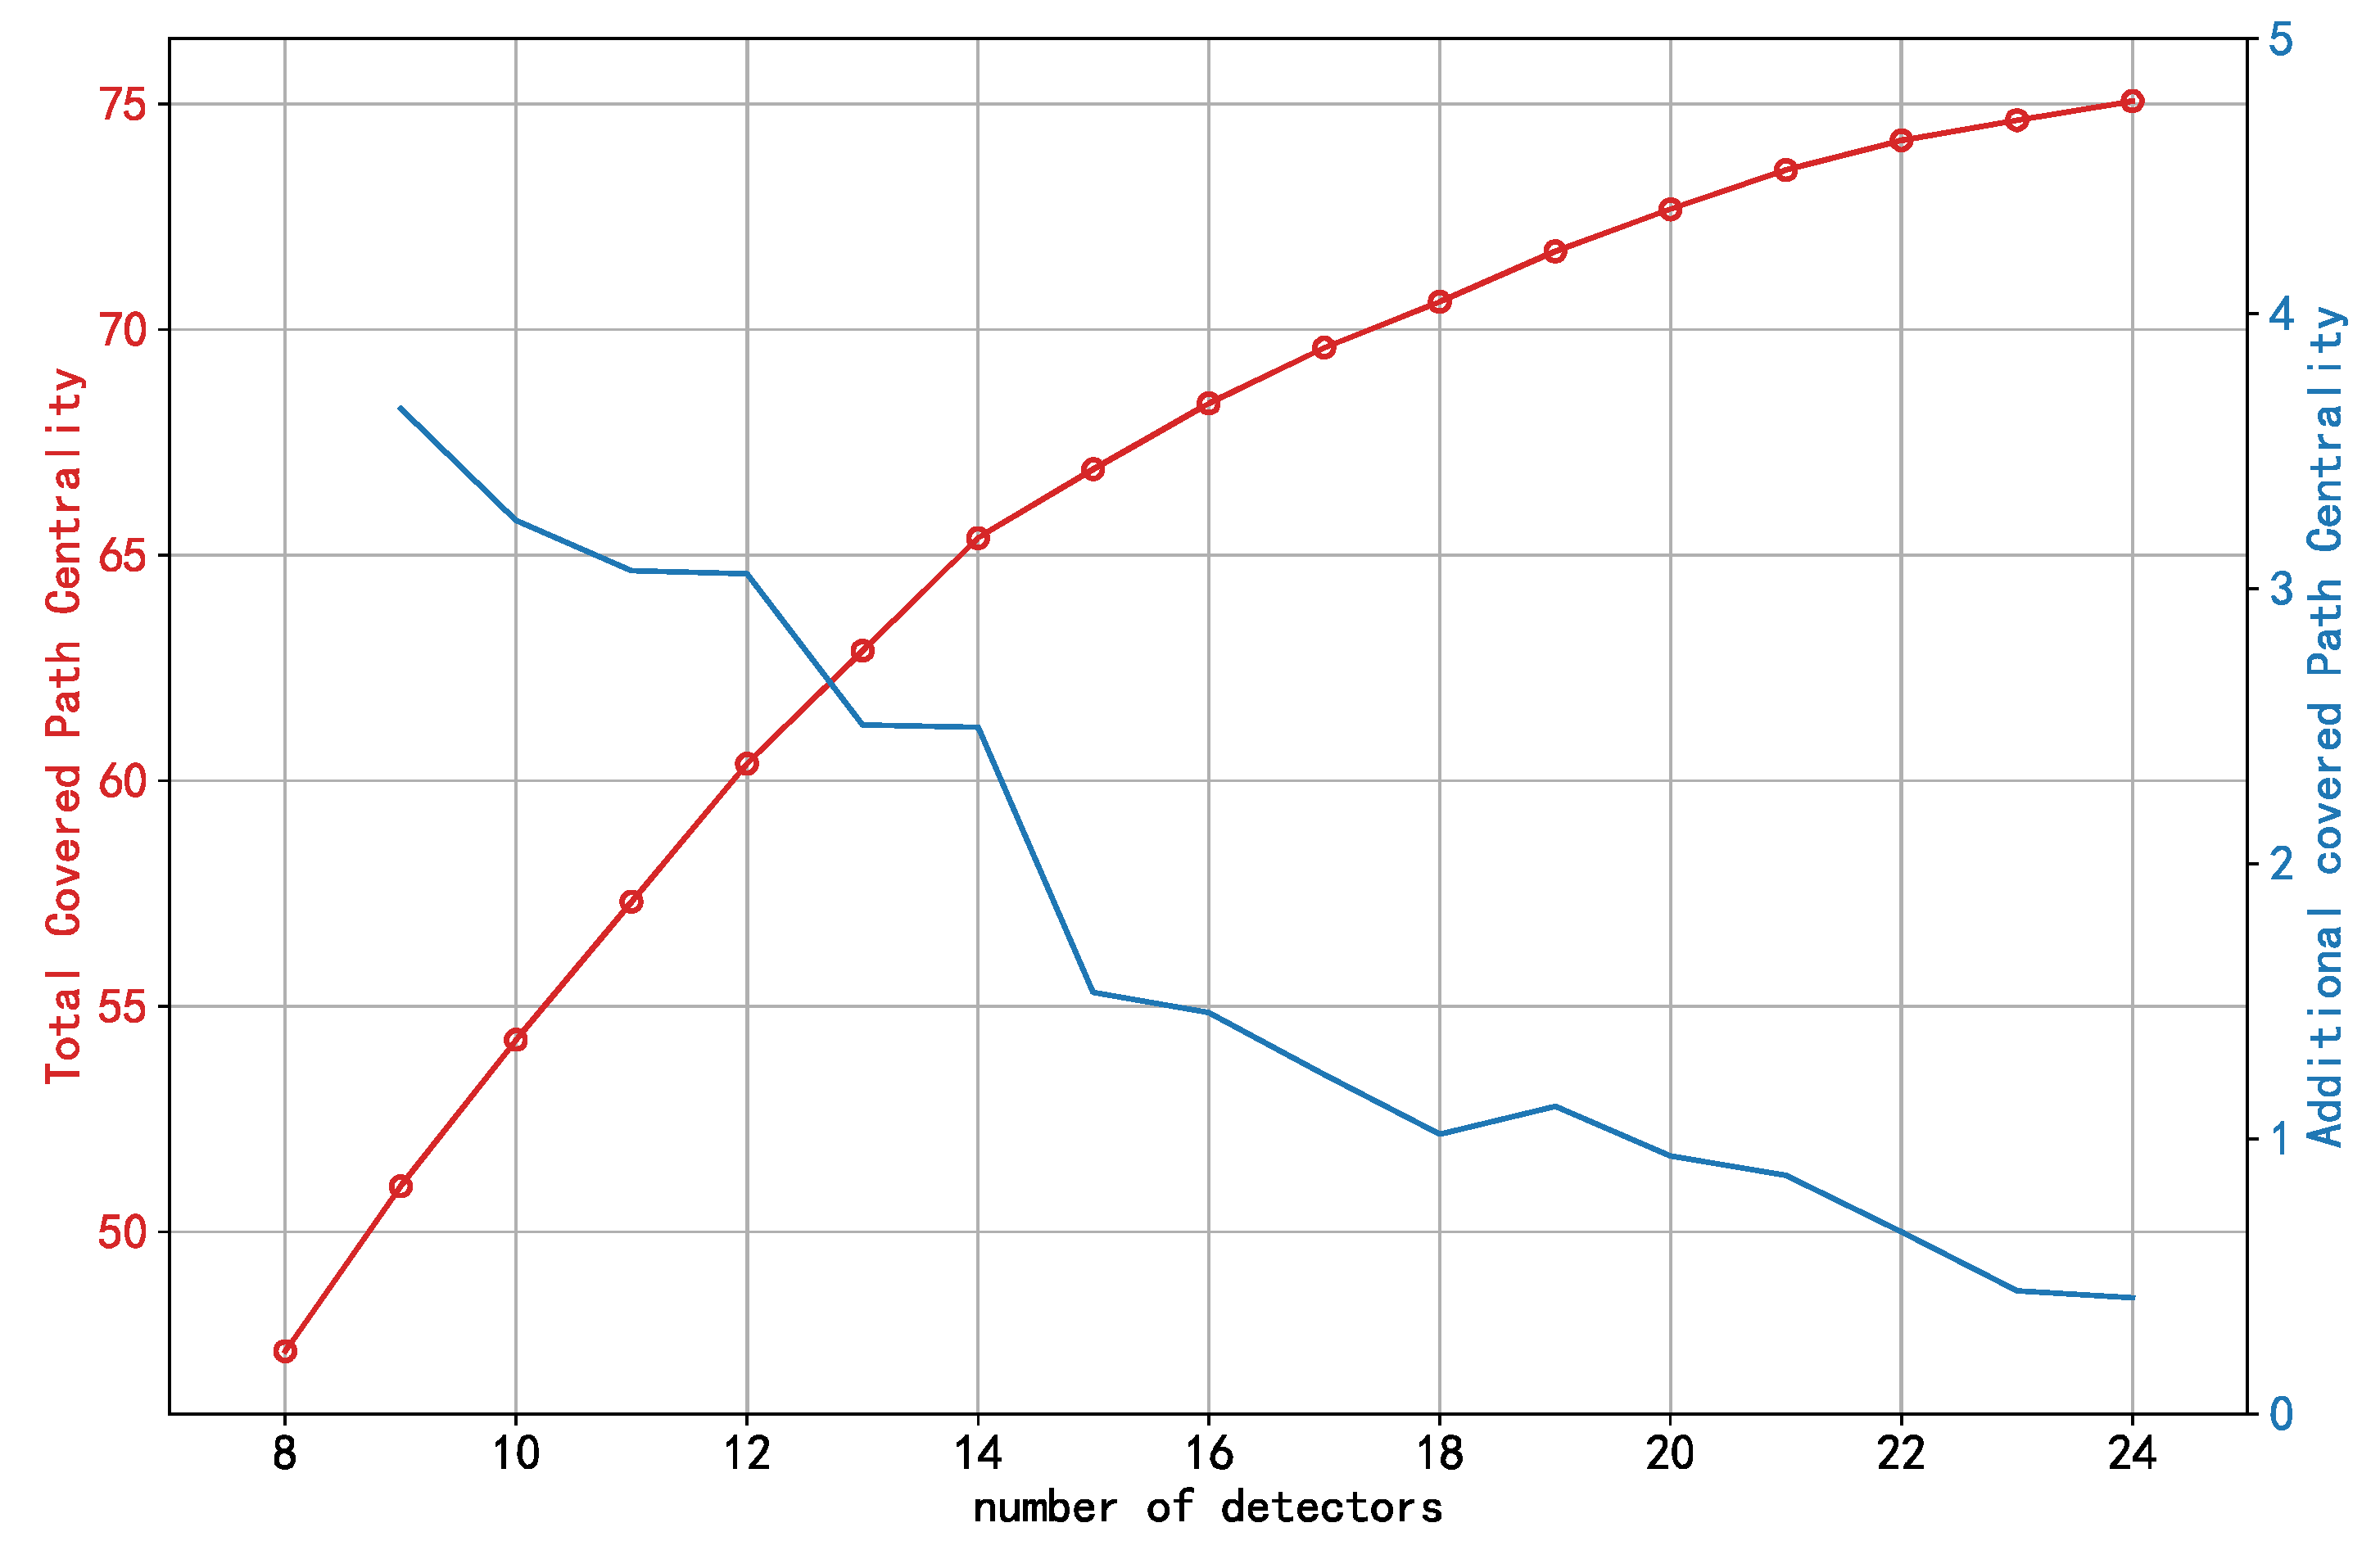
As shown in Figure 9, when the number of detectors increased to 22, the revenue obtained by adding detectors became small, and the detector layout reached a stable state.
Figure 10 shows the link-level distribution of links with detectors installed under the restriction of the different numbers of detectors. When the number of detectors was small (e.g., 8 or 12), all L8 links were selected. When the number of detectors was large (e.g., 16 or 24), there was a certain probability that L8 and L7 links were not selected, instead being replaced by several links with a lower level. This shows that, when the number of detectors is large, correlation is more likely to exist between the selected links. TNCM tries to minimize the impact of correlation and increase the observation revenue of the whole network.
The selection probability of each link-level in all cases is shown in Table 3, which shows that the links where detectors were installed were more inclined to be links with high link centrality.

4.2.2. Case Study of Dynamic Network

The case discussed in this section is the dynamic sequential network corresponding to the static network of the previous section. The traffic network was sampled over a day and simulated at different times, which were divided into 12 time periods: {0, 2, 4, 6, 8, 10, 12, 14, 16, 18, 20, 22}; that is, G t s = { G 0 , G 2 , G 4 , G 6 , G 8 , G 10 , G 12 , G 14 , G 16 , G 18 , G 20 , G 22 } , where the time 0 represents the sampling results between times 0 and 2, and so on.
The differences in sampling at different times were reflected in the aspects of travel time, OD traffic volume, decision-maker preference weight, and observation weight, which are explained as follows:
  • When T = 4, links 39, 71, and 76 needed to be observed, so the decision-maker preference weight of the link was increased.
  • When T = {6, 8}, the traffic was in the morning peak period, and the traffic demand at links 2, 4, 10, 13, 16, 35, 38, 40, 43, 58, 52, and 60 increased. Due to different degrees of congestion, the average travel time of these links increased.
  • When T = {10, 12, 14, 16, 20, 22}, the traffic conditions were relatively stable and the traffic demand of all sections fell back to an unsaturated state (i.e., without obvious congestion); thus, the links were passed smoothly.
  • When T = 18, the traffic was in the evening peak period, and the traffic demand in links 5, 14, 31, 23, 19, 7, 37, 34, 28, 49, and 56 increased. Due to different degrees of congestion, the average travel time of these links increased.
  • The observation weights of the dynamic network at different times are shown in Table 4. The morning peak and evening peak are the key observation periods and, so, the observation weights of these two periods were larger.
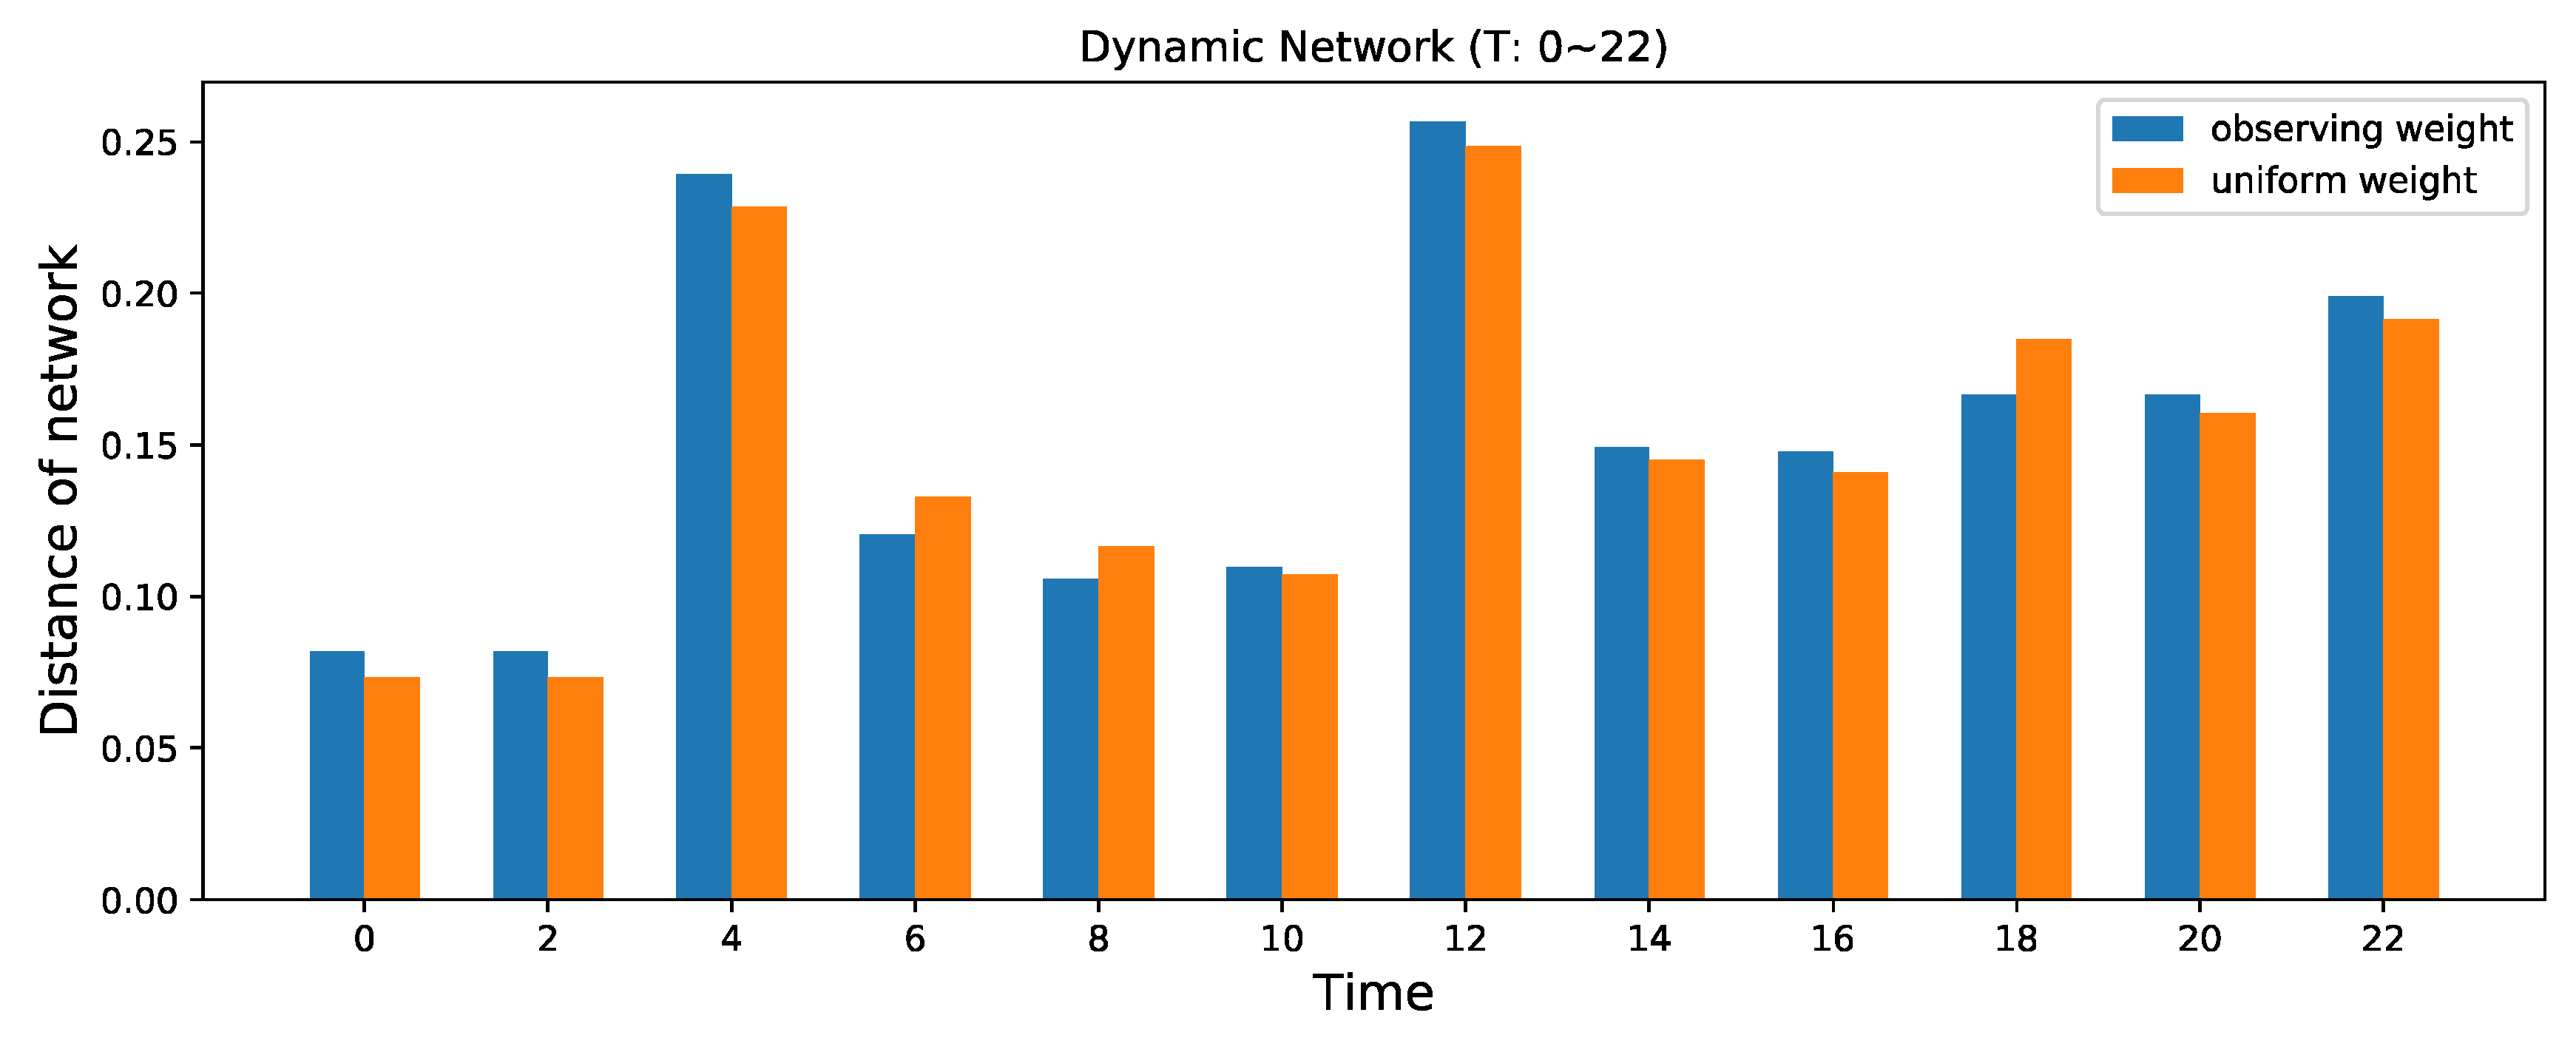
According to the parameters given above, the network sequence diagram G t s with uniform weight and observation weight was constructed. The distance between the networks in G t s at different times and the fitted network are shown in Figure 11.
It can be seen from the comparison that, compared to G t s with uniform weight, the distance between G t s with observation weight at times {6,8,18} and the fitted network was significantly reduced, as the observation network increased the observation weight at those times.
With the number of detectors limited to 10, the detector layout solution of the dynamic network is shown in Table 5.
Figure 12 shows the level and layout results of the dynamic network. Compared with Figure 5 and Figure 6 (of the static network), the levels and layout solution of the dynamic network were changed greatly.
Comparing the dynamic network solution’s performance on G t with the optimal solution of G t , the benefit loss of covered path centrality is shown in Figure 13.
Time 6 showed the smallest decline (0.18%) and time 20 showed the greatest decline (5.76%). Overall, the layout of the dynamic network achieved good performance for all time periods. Therefore, it is effective to use a network sequence diagram to deal with the detector layout problem of a dynamic network.

4.2.3. Case Study of Detector Failure

The detector layouts for the static and dynamic network cases were found under the assumption that the detector failure probability was 0. In fact, the whole observation network revenue is affected by detector breakdown during operations. As the detector layout for the dynamic network will eventually be transformed into the layout of its fitting static network, this section will analyze the impact of detector failure on the observation network revenue and layout solution in a static network.
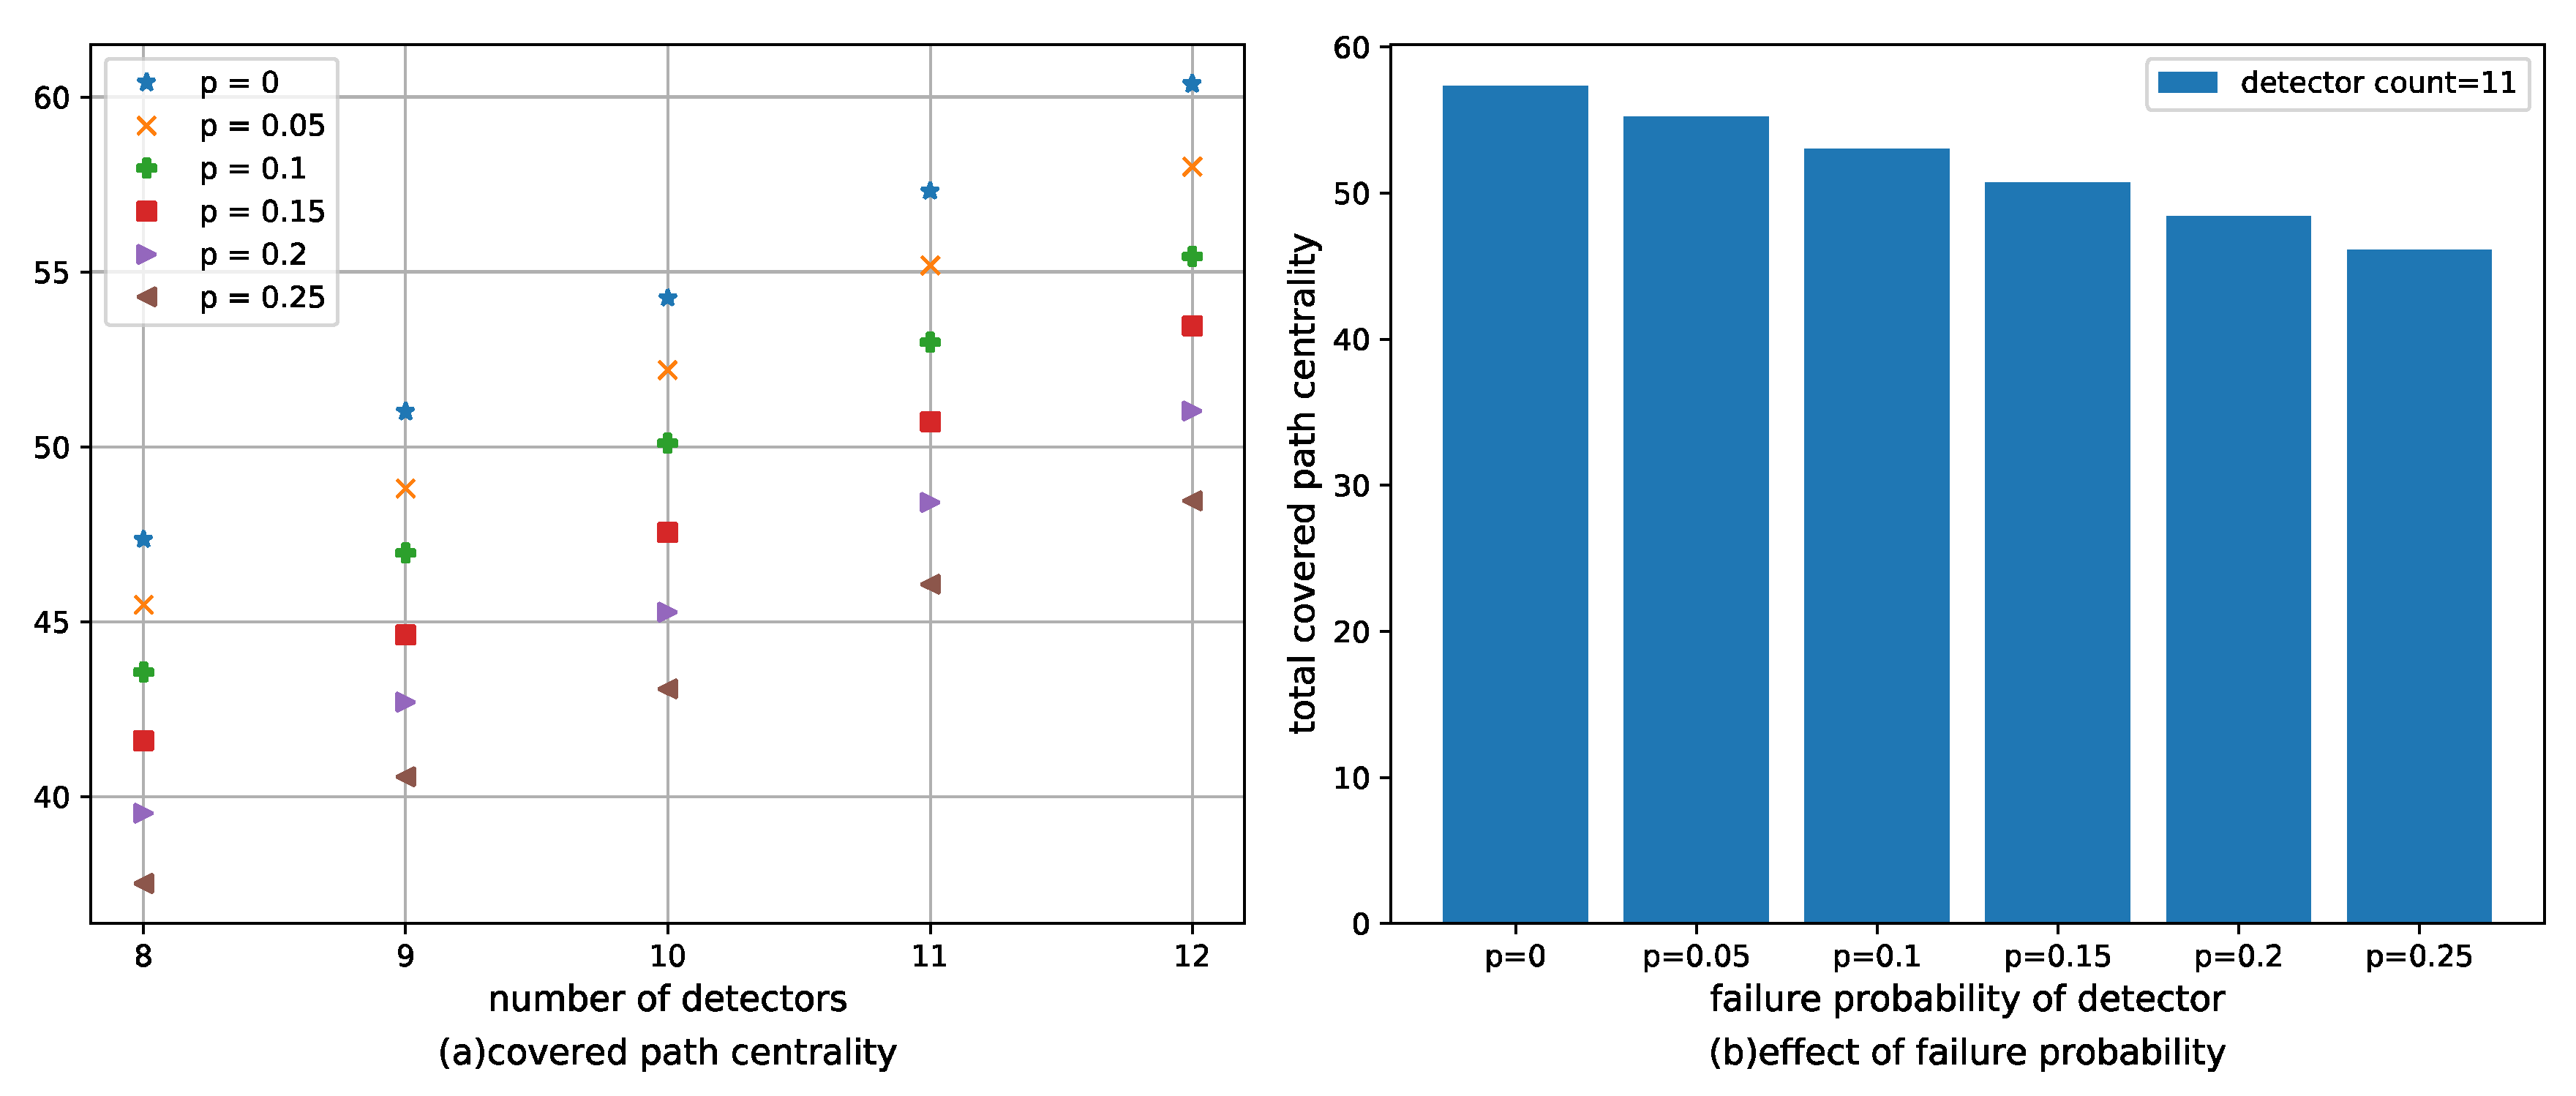
As Figure 14 shows, for any number of detectors, the higher the probability of detector failure, the lower the path centrality covered; that is, the lower the revenue of the observation network.
Let the number of detectors be limited to 11. The layout solution of detectors in two scenarios of failure probability ( p = 0 and p = 0.25 ) are shown in Table 6. There were differences in the optimal solution, and only eight of the same links were selected. Therefore, the detector failure probability affects the selected links, as well as the revenue of the observation network.

5. Discussion

With the continuous development of traffic networks, traffic information is of great significance for both long-term planning and short-term prediction. The effective acquisition of traffic information forms the basis of traffic management and control. Due to the complexity and changeability of a traffic network, the traffic demands and road conditions are in a state of dynamic change. Consequently, monitoring also has a biased demand, which causes traffic detector layout design to become a very complex problem. Traditional methods, such as traffic flow estimation, travel time estimation, and so on, have achieved good results; however, they cannot represent the real-time state of a traffic network from a global perspective.
Therefore, TNCM was proposed in this paper, which is based on the traffic network topology and considers the travel time between links, OD traffic demand, observation demand of urban managers, dynamic characteristics of traffic network, detector failure, and other factors. With the path centrality covered by the detectors as the optimization goal, it is expected to monitor the more important links in the network and solve the complex layout problem of traffic detectors. The research results of this paper as follows:
  • Based on complex network theory, traffic networks are abstracted as directed weighted networks. Link centrality is introduced to describe the importance of links, and path centrality is introduced to describe the importance of an effective path in traffic flow and to effectively reduce the impact of correlation between links. The link centrality in the weighted network comprehensively considers the factors of network topology, preference weight, traffic flow, and other factors, describing the traffic network more comprehensively.
  • The network sequence diagram is used to describe the dynamic changes in a traffic network. Considering the network over a period of time truly reflects the traffic status at each sampled moment. According to the observation weight, the dynamic network is fitted to a static network, and the detector layout is based on the fitted network. The centrality distance can effectively indicate the difference between networks at different times. Adjusting the observation weight can dynamically adjust the similarity between the traffic networks at different times and the fitted network.
  • In a static network, when the OD demand is known, the user equilibrium model is used to allocate traffic flow for links and paths. In this paper, the gain coefficient ρ is used to represent the influences of traffic flow, manager’s preference, traffic state, and other factors on link centrality. In addition, detector failure is considered, in order to optimize the layout solution and minimize the influence of failure on the detector layout.
We used the network of Sioux Falls as an example to analyze the traffic detector layout solution under three different scenarios—static network, dynamic network, and detector failure—following which the TNCM was solved by a genetic algorithm. Compared with the correlation method [33], more practical constraints are incorporated. Compared with the two-stage traffic detector stochastic placement model [30], TNCM does not rely on OD. Without prior knowledge, the model can cover the common constraints in the static network (e.g., cost constraints, specified links, detector failure, and so on) and effectively process the dynamic scenario.
In the case of a static network, under the condition that the number of different detectors is limited, the layout solution of TNCM has better performance in path coverage, OD coverage, link coverage, and link revenue, which demonstrates the effectiveness of the solution. The link-level distribution of selected links indicates that the more important links are, the more likely they are to be selected for detector installation. After a certain number of detectors is reached, the model may select some sub-important links, instead of the more important links, to eliminate the correlation between links.
In the case of a dynamic network, a network sequence diagram was constructed for 12 time periods of a day, according to the real traffic conditions. The observation preference at different times is reflected in the observation weight parameter. The network sequence diagram effectively describes the real traffic changes. It was seen, by comparison of the final layout solution and the optimal solution at each time, that the revenue loss caused by a dynamic change was relatively small and that the maximum loss was not more than 5.8%, which indicates a reasonable layout solution.

6. Conclusions

Based on complex network theory, TNCM was proposed in this paper, which utilizes the idea of network centrality. It was proved that TNCM is effective and operable in the case of the Sioux Falls network and, so, it is not only suitable for small and medium networks, but also large networks. Therefore, TNCM can be widely used for practical applications. It is mainly dependent on the traffic network topology and is independent of pre-conditions such as OD traffic, prior matrix, and so on. It was demonstrated that TNCM can be effectively applied to actual road networks, considering cost, road section, detector failure, and so on, while paying less attention to route choice behavior. It provides an effective solution for the traffic detector layout under the demand for complex traffic network monitoring, which contributes to finding the minimum amount of detectors to achieve a given coverage of path centrality, thus reducing traffic detector layout cost.
The aim of this paper was to monitor a traffic network effectively by considering the traffic detector layout. An innovative method was put forward, which offers a new idea for the optimization of traffic detector layout. It not only provides a valuable reference for practical engineering, but also provides a scientific decision-making basis for traffic managers. Furthermore, it provides practical guidance for the construction of intelligent transportation and smart cities. Furthermore, it promotes the sustainable development of cities. Based on the TNCM, a traffic detector layout solution for a typical road network, composed of one expressway and several major roads in Hefei of China’s Anhui Province, is provided for relevant departments.
This study also exhibits several limitations: (1) considering detector failure, collecting multiple detectors in a single link can raise the monitoring availability of the link. However, in TNCM, each link can only have one detector at a time, which may prevent us from finding the optimal solution; and (2) there are other valuable layout objectives, such as the most covered links of interest, the minimum detector layout amount, and so on, while the single objective considered by TNCM is the path centrality with the maximum coverage, which limits the available scenarios. Future research may be conducted in a few directions, considering these deficiencies: multiple detectors could be installed in the same link, and the single-objective optimization model may be extended to a multi-objective optimization model to increase the number of available scenarios. Furthermore, the gain factor describes the influence of different factors on the link centrality; therefore, how to introduce multiple factors into TNCM reasonably should be investigated.

Author Contributions

Conceptualization, S.A. and L.M.; Data curation, L.M.; Formal analysis, L.M. and J.W.; Funding acquisition, S.A.; Methodology, L.M. and S.A.; Software, L.M.; Supervision, S.A.; Writing—original draft, L.M.; Writing—review & editing, S.A. and J.W. All authors have read and agreed to the published version of the manuscript.

Funding

This research was funded by Chinese National Natural Science Fund (No. 51478151 and No. 71390522).

Acknowledgments

The authors would like to thank the Chinese National Natural Science Fund.

Conflicts of Interest

The authors declare no conflict of interest.

References

  1. Liu, Y.; Zhu, N. A multi-objective detector location optimization approach. In Proceedings of the 14th COTA International Conference of Transportation Professionals, Changsha, China, 4–7 July 2014. [Google Scholar]
  2. Hu, S.R.; Peeta, S.; Chu, C.H. Identification of vehicle sensor locations for link-based network traffic applications. Transp. Res. Part B 2009, 43, 873–894. [Google Scholar] [CrossRef]
  3. Danczyk, A.; Liu, H.X. A mixed-integer linear program for optimizing sensor locations along freeway corridors. Transp. Res. Part B 2011, 45, 208–217. [Google Scholar] [CrossRef]
  4. Gómez, P. Evaluation of trade-offs between two data sources for the accurate estimation of origin–destination matrices. Transp. B Transp. Dyn. 2015, 3, 222–245. [Google Scholar] [CrossRef]
  5. Li, H.; Qin, L.; Chang, X. Sensor layout strategy and sensitivity analysis for macroscopic traffic flow parameter acquisition. IET Intell. Transp. Syst. 2017, 11, 212–221. [Google Scholar] [CrossRef]
  6. Zhang, M.Y.; Cao, J.; Niu, J.Q. A new method of traffic detector layout based on graph theory and matrix theory. J. Highw. Transp. Res. Dev. 2012, 29, 130–134. (In Chinese) [Google Scholar]
  7. Bartin, B.; Ozbay, K. A clustering based methodology for determining the optimal roadway configuration of detectors for travel time estimation. In Proceedings of the 2007 IEEE Intelligent Vehicles Symposium, Istanbul, Turkey, 13–15 June 2007. [Google Scholar]
  8. Zheng, C.J.; Li, Y.; Wang, T. Optimization method of urban road traffic detector layout under abnormal state. J. China highw. 2011, 24, 100–106. (In Chinese) [Google Scholar]
  9. Zhang, M.M.; Yang, Y.; Wang, S.G. Research on expressway traffic detector layout scheme based on event detection benefit. J. Highw. 2013, 8, 219–224. (In Chinese) [Google Scholar]
  10. Wang, D.H.; Xu, C.; Qi, H.S.; Jin, S. Optimization of detector layout based on road flow correlation. J. South China Uni. Technol. (Nat. Sci. Ed.) 2011, 39, 107–113. (In Chinese) [Google Scholar]
  11. Yim, P.K.N.; Lam, W.H.K. Evaluation of count location selection methods for estimation of OD matrices. J. Transp. Eng. 1998, 124, 376–383. [Google Scholar] [CrossRef]
  12. Yang, H.; Zhou, J. Optimal traffic counting locations for origin-destination matrix estimation. Transp. Res. Part B 1998, 32, 109–126. [Google Scholar] [CrossRef]
  13. Bianco, L.; Confessore, G.; Reverberi, P. A network based model for traffic sensor location with implications on O/D matrix estimates. Transp. Sci. 2001, 35, 50–60. [Google Scholar] [CrossRef]
  14. Chootinan, P.; Chen, A.; Yang, H. A bi-objective traffic counting location for origin-destination trip table estimation. Transportmetrica 2005, 1, 65–80. [Google Scholar] [CrossRef]
  15. Ehlert, A.; Bell, M.G.H.; Grosso, S. The optimisation of traffic count locations in road networks. Transp. Res. Part B 2006, 40, 460–479. [Google Scholar] [CrossRef]
  16. Fei, X.; Mahmassani, H.S.; Eisenman, S.M. Sensor coverage and location for real-time traffic prediction in large-scale networks. Transp. Res. Rec. 2007, 2039, 1–15. [Google Scholar] [CrossRef] [Green Version]
  17. Bertini, R.; Lovell, D. Impacts of Sensor Spacing on Accurate Freeway Travel Time Estimation for Traveler Information. J. Intell. Transp. Syst. 2009, 13, 97–110. [Google Scholar] [CrossRef]
  18. Mínguez, R.; Sánchez-Cambronero, S.; Castillo, E.; Jiménez, P. Optimal traffic plate scanning location for OD trip matrix and route estimation in road networks. Transp. Res. Part B 2010, 44, 282–298. [Google Scholar] [CrossRef]
  19. Zhou, X.S.; List, G.F. An Information-Theoretic Sensor Location Model for Traffic Origin-Destination Demands Estimation Applications. Transp. Sci. 2010, 44, 254–273. [Google Scholar] [CrossRef]
  20. Xing, T.; Zhou, X.; Taylor, J. Designing heterogeneous sensor networks for estimating and predicting path travel time dynamics: An information-theoretic modeling approach. Transp. Res. Part B Methodlog. 2013, 57, 66–90. [Google Scholar] [CrossRef]
  21. Ban, X.; Herring, R.; Margulici, J.D.; Bayen, A.M. Optimal sensor placement for freeway travel time estimation. Transp. Traffic Theory 2009, 55, 697–722. [Google Scholar]
  22. Zhang, J.S.; Jin, M.J. Optimal sensor density for freeway travel time estimation with multi-class traffic flow. In Proceedings of the 2nd International Conference on Transportation Information and Safety, Wuhan, China, 28–30 June 2013. [Google Scholar]
  23. Castillo, E.; Conejo, A.J.; Menendez, J.M.; Jimenez, P. The observability problem in traffic network models. Comput.-Aided Civ, Infrastruct. Eng. 2008, 23, 208–222. [Google Scholar] [CrossRef]
  24. Gholami, A.; Tian, Z.; Andalibian, R. Innovative detector layout for automated traffic turning volume counting. J. Adv. Transp. 2016, 50, 1958–1971. [Google Scholar] [CrossRef]
  25. Xie, G.T.; Zhang, X.Y.; Gao, H.B.; Qian, L.J.; Wang, J.Q.; Umit, O. Situational Assessments Based on Uncertainty-Risk Awareness in Complex Traffic Scenarios. Sustainability 2017, 9, 1582. [Google Scholar] [CrossRef] [Green Version]
  26. Fei, X.; Mahmassani, H.S. Structural analysis of near-optimal sensor locations for a stochastic large-scale network. Transp. Res. Part C 2011, 19, 440–453. [Google Scholar] [CrossRef]
  27. Li, X.P.; Ouyang, Y.F. A continuum approximation approach to reliable facility location design under correlated probabilistic disruptions. Transp. Res. Part B Methodol. 2010, 44, 535–548. [Google Scholar] [CrossRef]
  28. Li, X.P.; Ouyang, Y.F. Reliable sensor deployment for network traffic surveillance. Transp. Res. Part B Methodol. 2011, 45, 218–231. [Google Scholar] [CrossRef]
  29. Li, X.P.; Ouyang, Y.F. Reliable Traffic Sensor Deployment Under Probabilistic Disruptions and Generalized Surveillance Effectiveness Measures. Oper. Res. 2012, 60, 1183–1198. [Google Scholar] [CrossRef]
  30. Zhu, N.; Ma, S.F.; Jia, N. Research on Layout Optimization of traffic detector considering failure factors. J. Syst. Eng. Theory Pract. 2014, 34, 997–1002. (In Chinese) [Google Scholar]
  31. Freeman, L.C. Centrality in social networks conceptual clarification. Soc. Netw. 2012, 1, 215–239. [Google Scholar]
  32. Chang, S.C.; Zhang, Q.Y.; Wang, W.T. Analysis of centralities of links. J. Academ. Mil. Transp. 2011, 13, 4–7. (In Chinese) [Google Scholar]
  33. Yang, H.; Xu, W.; He, B.S.; Meng, Q. Road pricing for congestion control with unknown demand and cost functions. Transp. Res. Part C 2010, 18, 157–175. [Google Scholar] [CrossRef]
Figure 1. Link centrality of Fishbone network (unweighted).
Sustainability 12 02048 g001
Figure 2. Link centrality of Fishbone network (weighted).
Sustainability 12 02048 g002
Figure 3. A special example of an observation network.
Sustainability 12 02048 g003
Figure 4. A simple example of dynamic network.
Sustainability 12 02048 g004
Figure 5. Data Flow Diagram of TNCM (Traffic Network Centrality Model).
Sustainability 12 02048 g005
Figure 6. Link level of static network.
Sustainability 12 02048 g006
Figure 7. Detector layout solution for static network (detector count = 18).
Sustainability 12 02048 g007
Figure 8. Analysis of detector layout solutions for static network: (a) Coverage ratio of k shortest paths, with k in {1, 2, 3}; (b) Covered OD pairs with different numbers of detectors; (c) Coverage ratio of links with different coverage proportion; and (d) Average revenue of detectors, compared to minimum revenue.
Sustainability 12 02048 g008
Figure 9. Total covered path centrality with different number of detectors.
Sustainability 12 02048 g009
Figure 10. Distribution of selected links: (a) case where detector count is 8; (b) case where detector count is 12; (c) case where detector count is 16; (d) case where detector count is 20; (e) case where detector count is 24; and (f) overview of all cases.
Sustainability 12 02048 g010
Figure 11. Distance of network in different weight case.
Sustainability 12 02048 g011
Figure 12. Link level and detector layout solution for dynamic network.
Sustainability 12 02048 g012
Figure 13. Decrease of total covered path centrality.
Sustainability 12 02048 g013
Figure 14. Analysis of detector layout in failure scenario: (a) Covered path centrality with different number of detectors in multi scenarios, where p is in {0, 0.05, 0.1, 0.15, 0.2, 0.25}; and (b) Total covered path centrality in different failure probability scenarios, where the detector count is 11.
Sustainability 12 02048 g014
Table 1. Basic parameters of network topology and traffic demand.
Link travel time: 10
Link capacity: 7800
O: [3,5]
D: [9,10]
OD demand: (3,9,7500), (3,10,7300), (5,9,1000), (5,10,1200)
Table 2. Detector layout solution with different number limit.
Number of DetectorsSelected LinksCovered Path Centrality
89,11,16,19,34,53,56,7547.351126
99,11,16,19,34,40,53,56,7551.004284
109,11,16,19,34,40,53,58,60,7454.251402
119,11,16,19,34,39,40,53,56,58,6057.317377
129,11,16,19,34,39,40,53,56,58,60,7460.372557
139,11,16,19,25,34,39,40,53,56,58,60,7462.877637
149,11,16,19,25,26,34,39,40,53,56,58,60,7465.37485
158,9,16,19,25,26,33,34,53,56,58,60,74,75,7666.905466
168,9,16,19,25,26,32,33,34,53,56,58,60,74,75,7668.365451
178,9,16,19,25,26,32,33,34,53,54,55,56,58,74,75,7669.597724
187,9,11,16,19,25,26,34,40,46,53,54,55,56,58,72,74,7570.61362
196,11,16,19,25,26,27,36,39,40,46,53,54,55,56,58,72,74,7571.731315
207,9,11,16,19,25,26,33,34,38,40,46,53,54,55,56,58,66,72, 7572.668434
215,6,11,12,19,20,22,25,26,27,36,39,40,46,53,56,58,60,66, 67,7373.534726
226,9,11,16,17,24,25,26,27,35,36,39,40,46,47,53,56,58,60, 66,67,7374.195816
232,8,9,15,19,20,21,22,25,26,32,33,34,35,39,52,53,56,60, 66,67,70,7574.643593
246,7,11,14,16,17,24,25,26,27,29,36,40,41,46,52,53,55,56, 64,67,72,74,7575.065995
Table 3. Selection probability (detector count = all cases).
LevelL8L7L6L5L4L3L2L1
Selected Ratio88.23%79.41%28.59%44.34%10.08%7.16%0.84%0
Total221313142372
Table 4. Observation weight for dynamic network (comparing to uniform weight).
TimeUniform WeightObservation Weight
01/120.03
21/120.03
41/120.04
61/120.14
81/120.14
101/120.07
121/120.07
141/120.08
161/120.08
181/120.18
201/120.08
221/120.06
Table 5. Detector layout solution for dynamic network (sensor count = 10).
Number of DetectorsSelected LinksLayout RevenueCoverage Ratio
1011, 16, 19, 25, 38, 40, 53, 56, 60, 7561.87530366.58%
Table 6. Detector layout solution with different failure probability.
Failure ProbabilityDetector Layout SolutionTotal Covered Path Centrality
p = 09,11,16,19,34,39,40,53,56,58,6057.317377
p = 0.259,11,16,18,19,25,34,40,58,60,7446.070461