Review

Aquaculture Production and Its Environmental Sustainability in Thailand: Challenges and Potential Solutions

1
Department of Animal Sciences and Aquatic Ecology, Faculty of Bioscience Engineering, Ghent University, 9000 Ghent, Belgium
2
Department of Biological and Environmental Sciences, Faculty of Science, Thaksin University, 93110 Patthalung, Thailand
3
Department of Food Technology, Safety and Health, Ghent University, 9000 Ghent, Belgium
4
Laboratory of Aquaculture and Artemia Reference Center, Faculty of Bioscience Engineering, Ghent University, 9000 Ghent, Belgium
*
Author to whom correspondence should be addressed.
Sustainability 2020, 12(5), 2010; https://doi.org/10.3390/su12052010
Submission received: 26 January 2020 / Revised: 25 February 2020 / Accepted: 28 February 2020 / Published: 5 March 2020
(This article belongs to the Section Sustainable Agriculture)

Abstract

:
Though aquaculture plays an important role in providing foods and healthy diets, there are concerns regarding the environmental sustainability of prevailing practices. This study examines the trends and changes in fisheries originating from aquaculture production in Thailand and provides insights into such production’s environmental impacts and sustainability. Together with an extensive literature review, we investigated a time series of Thai aquaculture production data from 1995 to 2015. Overall, Thai aquaculture production has significantly increased during the last few decades and significantly contributed to socio-economic development. Estimates of total aquaculture production in Thailand have gradually grown from around 0.6 to 0.9 million tons over the last twenty years. Farmed shrimp is the main animal aquatic product, accounting for an estimated 40% of total yields of aquaculture production, closely followed by fish (38%) and mollusk (22%). Estimates over the past decades indicate that around 199470 ha of land is used for aquaculture farming. Out of the total area, 61% is used for freshwater farms, and 39% is used for coastal farms. However, this industry has contributed to environmental degradation, such as habitat destruction, water pollution, and ecological effects. Effective management strategies are urgently needed to minimize the environmental impacts of aquaculture and to ensure it maximally contributes to planetary health. Innovative and practical solutions that rely on diverse technology inputs and smart market-based management approaches that are designed for environmentally friendly aquaculture farming can be the basis for viable long-term solutions for the future.

1. Introduction

As stated in the Sustainable Development Goals (SDGs), there is a global concern about erasing malnutrition, improving poverty alleviation, and achieving food security and planetary health. In particular, SDGs 1 and 8 are related to poverty and economic growth, respectively, and SDGs 2, 3, and 12 are about zero hunger, good health, and responsible consumption and production, respectively [1]. The importance of fisheries as a source of food and nutrition cannot be overstated, especially in the face of population growth and increasing demand for animal protein [2,3]. Several studies have indicated that fish is an excellent source of animal proteins, micronutrients, and vitamins [4,5,6,7].
Globally, fisheries production peaked at about 171 million tons in 2016, of which aquaculture production represented 80 million tons (47%) and capture production represented 91 million tons (53%) [8]. During the recent decades, a large number of the world’s fish stocks have been depleted, and, therefore, global fisheries are no longer capable of producing their maximum sustainable yield [9]. Aquaculture has contributed to the impressive growth in the seafood supply for human consumption [10]. Thailand’s aquacultural sector has rapidly developed during the last few decades and has been accompanied with tangible socio-economic development. The country was ranked among the top twenty-five countries in terms of fisheries production in 2018 [8]. Recent statistics that were collected by the Department of Fisheries (DoF) [11] estimate that Thailand’s aquaculture production in 2016 exceeded more than 0.9 million tons, of which 0.5 million tons (57%) were from coastal aquaculture and 0.4 million tons (43%) were from freshwater aquaculture.
The growing production of freshwater and marine aquaculture has tremendous potential to help sustainably feed the growing human population [12]. However, several studies have pointed towards the harmful effects of aquaculture production and, in particular, its environmental and ecological impacts. For example, the rapid growth in shrimp farming is a key driver of mangrove forest degradation and reduction of natural habitats and biodiversity [13,14,15,16,17,18]. Additionally, aquaculture production may lead to a decrease in biodiversity and nutrition diversity, as it usually focuses on a few selected species [3,19,20,21].
This study examines the trends and changes in fisheries originating from aquaculture production in Thailand and provides insights into such production’s environmental impacts and sustainability. First, we describe aquaculture production in Thailand, including the volume and value of aquaculture production and the diversity of farmed species. Second, we review the contribution of the development of aquaculture production to environmental degradation in Thailand. Finally, the possible measures that are needed to reach a sustainable future for Thai aquaculture production are presented. Our analysis focuses on Thailand’s aquaculture production data by using a time series of DoF statistics from 1995 to 2015.

2. Data Collection and Methods

Data on aquaculture production were obtained from the fisheries statistical yearbooks that have been published by the DoF while using a time series from 1995 to 2015. Aquaculture is the culture of aquatic organisms, which includes fish, mollusk, and crustaceans. The aquaculture production yield is reported as weights of fresh products in Table 1.
We used the methodology of Nesbitt, et al. [22] as a reference to identify the common name, scientific name, genus, and family of fishes and shellfishes. All species that were mentioned in the database of the DoF were identified based on a guidebook of marine fishes in Thailand, the global fish database Fishbase (http://www.fishbase.org), the International Union for Conservation of Nature and Natural Resources (IUCN) Red List of Threatened Species (http://www.iucnredlist.org/about), and Species 2000 and the Integrated Taxonomic Information System (ITIS) Catalogue of Life, (www.catalogueoflife.org/col). Details of these databases can be found in Table A1 in Appendix A.
The total yield of each species and group were calculated based on their annual yields. Then, we calculated the relative abundance of the species that were produced in Thai aquaculture from 1995 to 2015 as the percentage of their weight. We focused on major species that are important in aquaculture; see Figure 1. The maps in Figure 2 that display land changes were created by Quantum Geographic Information System (QGIS) version 3.2.2.
Peer-reviewed studies on aquaculture in Thailand, written in both Thai and English, were used as reference and discussion points. This study also used several official reports, such as the master plan on Thailand’s aquaculture development [23] and the National Economic and Social Development Plan [24].

3. Trends in Aquaculture Supply in Thailand

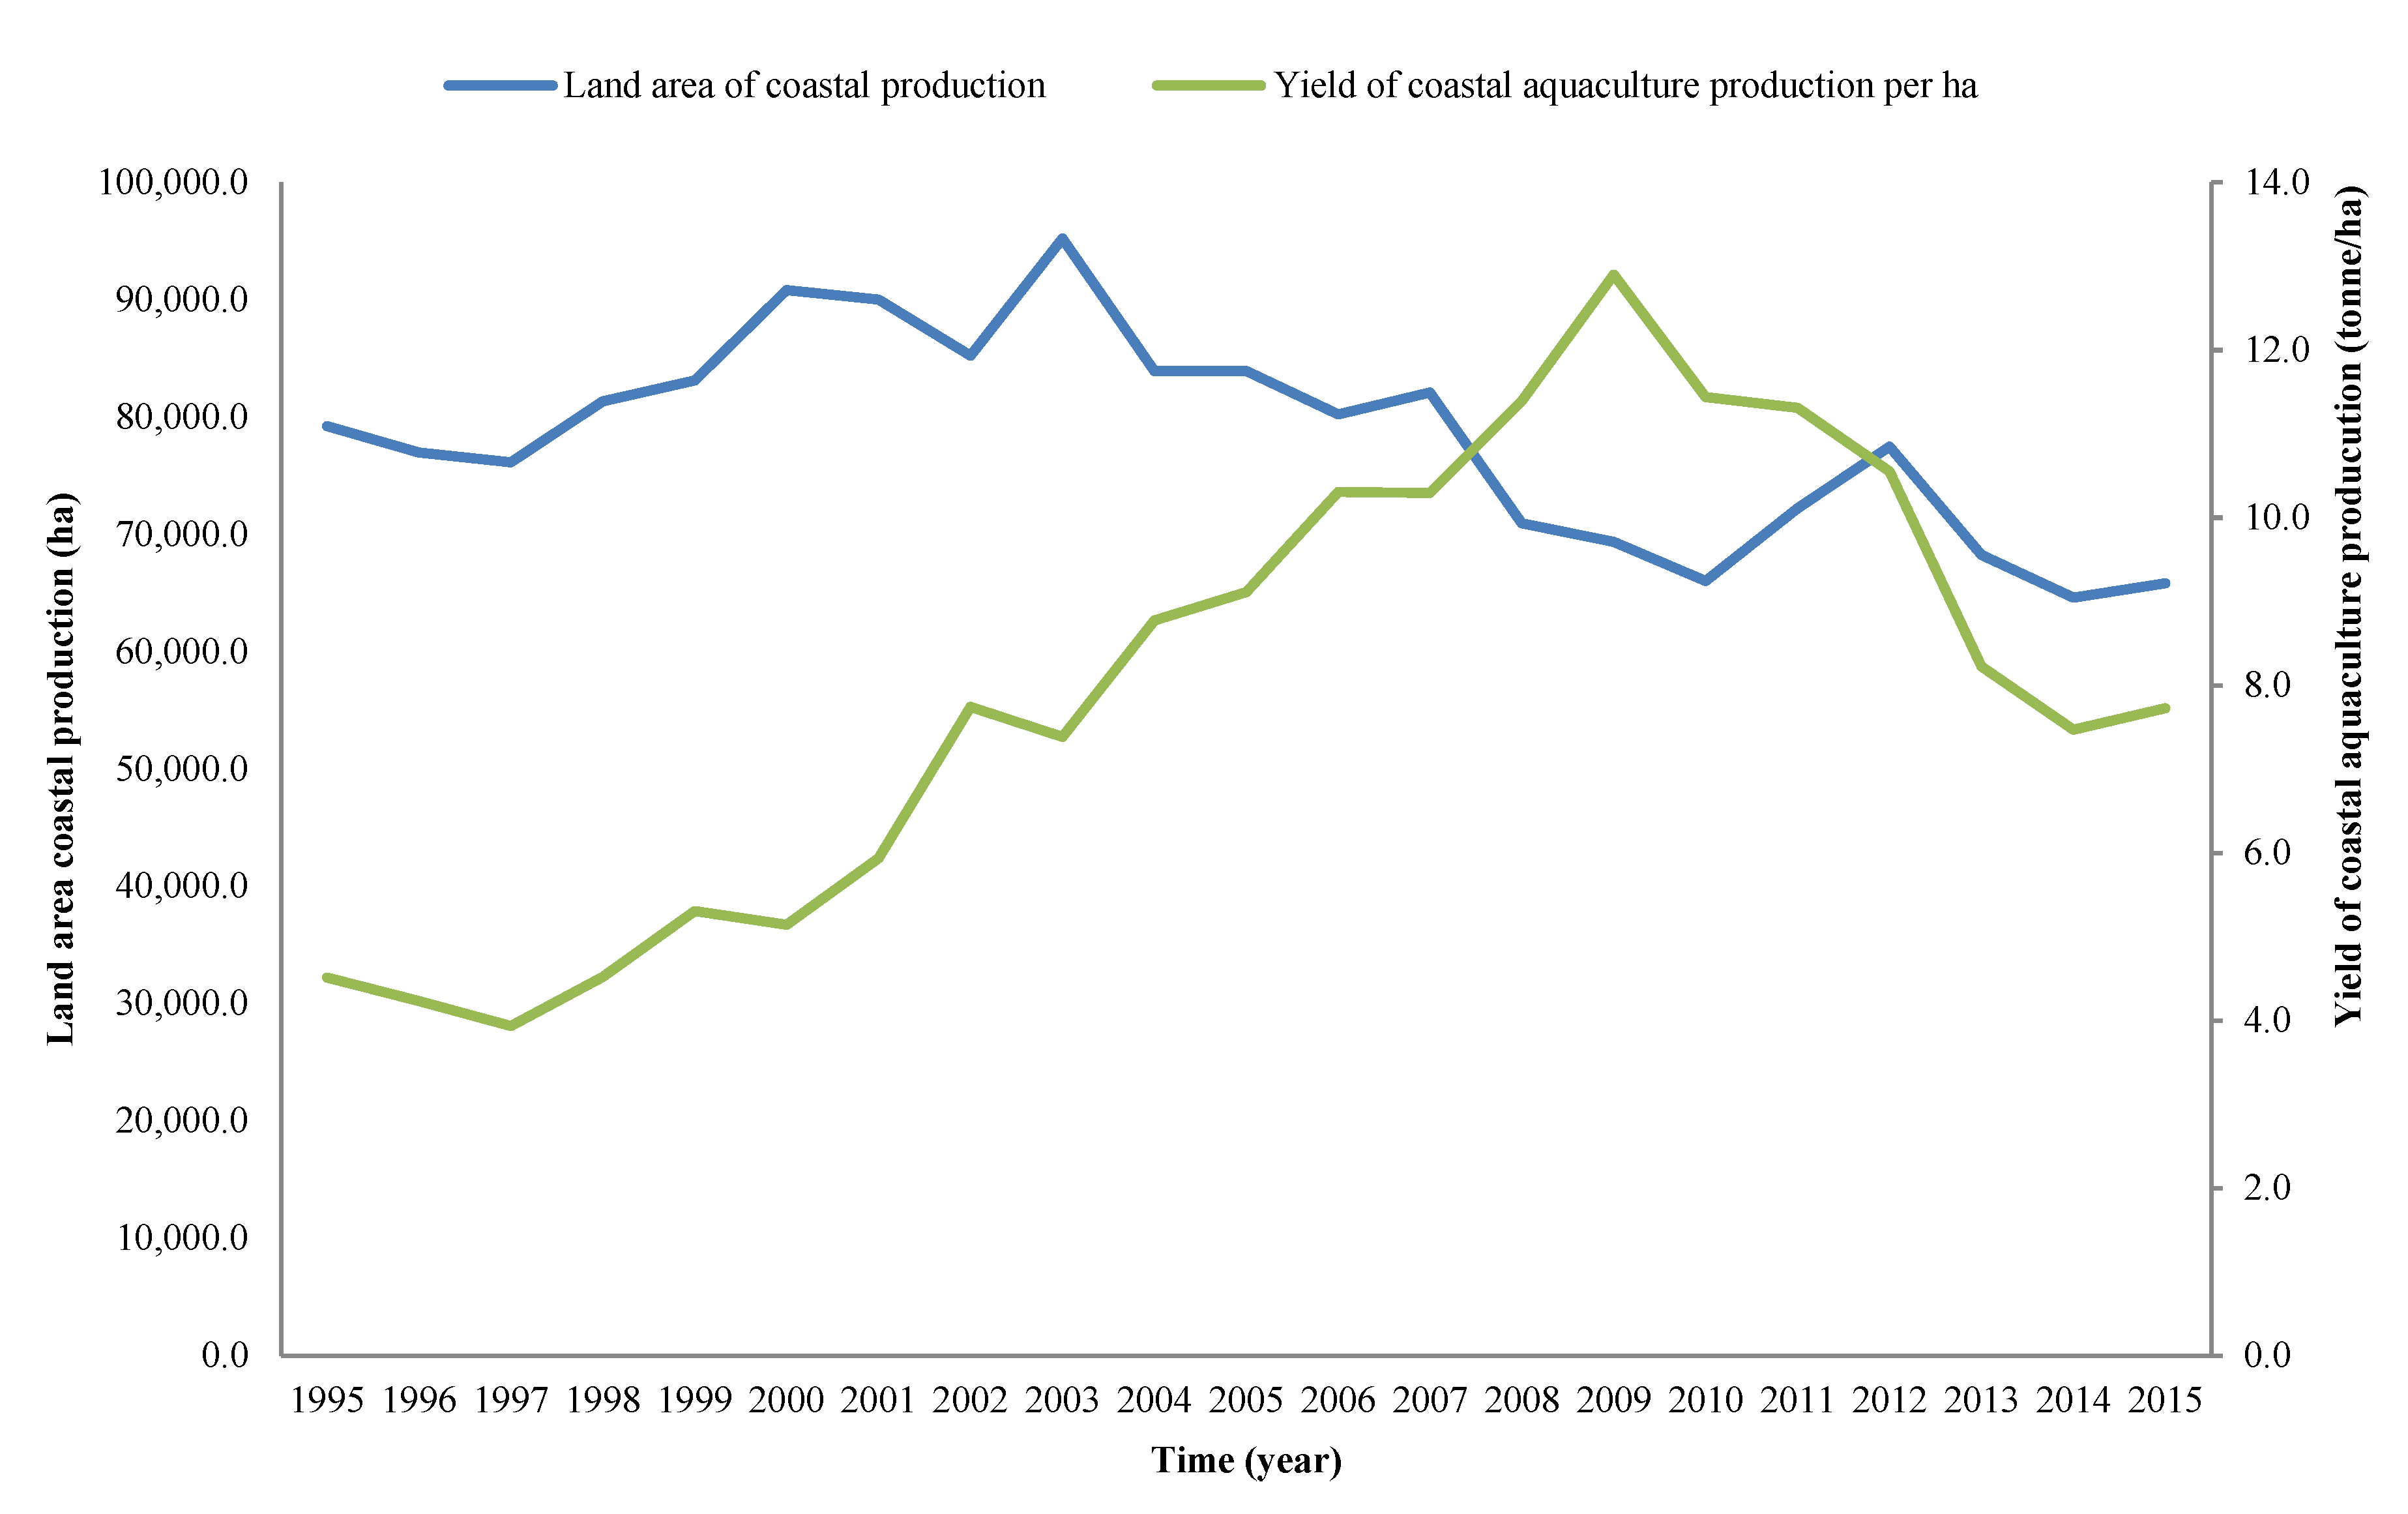
3.1. Yield of Aquaculture Production

Aquaculture production in Thailand is broadly divided into two categories: (1) inland freshwater aquaculture and (2) coastal or marine aquaculture [25]. Table 1 illustrates Thailand’s aquaculture production between 1995 and 2015. Over the last twenty years, on average, the annual aquaculture production was about one million tons per year (range of 500000–1400000 tons). Aquaculture production yield increased from around 553600 tons in 1995 to 928500 tons in 2015 [26,27,28,29,30,31,32,33,34,35,36,37,38,39,40,41,42,43,44,45,46]. About 62% (617900 tons) of the annual production yield was from coastal aquaculture, while the other 38% (384600 tons) was from freshwater aquaculture.
Based on the available database of the DoF, the three main aquaculture products were shrimp, fish, and mollusk. Farmed shrimp was the main source of aquaculture production, contributing to around 40% (398500 tons per year) of the average yield of aquaculture production in Thailand (range 229700–632200 tons). The larger majority of 95% (380000 tons per year) was from coastal aquaculture, and 5% (18,400 tons per year) was from freshwater aquaculture. About 38% (377100 tons per year, range 523000–193200 tons) of the average yield of aquaculture production was fish (96% from freshwater aquaculture and 4% from coastal aquaculture). Nearly 22% (223500 tons per year, range 66400–382900 tons) were mollusks.
The mean annual value of aquaculture production was estimated at US$2200 million (1 million tons), of which 78% (0.6 million tons) came from coastal aquaculture and the remaining 22% (0.4 million tons) came from freshwater aquaculture [26,27,28,29,30,31,32,33,34,35,36,37,38,39,40,41,42,43,44,45,46]. The prices of some species slightly increased over the period. For instance, the price of Nile tilapia steadily increased from 20 baht/kg in 1995 to 54 baht/kg in 2015. Likewise, the prices of walking catfish and common silver perch rose by 92% (from 26 to 50) and 88% (from 24 to 45), respectively.

3.2. Diversity of Species Produced

At least 18 aquatic families were being farmed based on the DoF database (Appendix A; Table A1). The Penaeidae family, specifically whiteleg shrimp (Penaeus vannamei) and giant tiger prawn (Penaeus monodon), was the largest contributor (38%) to the national aquaculture production, followed by the Mytilidae family (green mussel, Perna viridis, and horse mussel, Musculus senhousia) at 15% and the Cichlidae family (Nile tilapia, Oreochromis niloticus, and java tilapia, Oreochromis mossambicus) at 15%.
The relative abundance of the produced species is illustrated in Figure 1. Only the annual yields of the top five species are shown, as these account for about 77% of the total production. Relatively, giant tiger prawns were the most abundant species from 1995 to 2001, followed by green mussels from 2002 to 2004. Since then, whiteleg shrimps have been the most abundant species.
In freshwater aquaculture production, fish yield was by far the most significant contributor (94%), followed by giant freshwater prawn and others (6%). Out of all the freshwater produced species, the Nile tilapia (Oreochromis niloticus) was the largest contributor (38%), followed by the walking catfish (Clarias spp.) (27%), the common silver carp (Barbonymus gonionotus) (11%), and others (23%). In coastal aquaculture production, shrimp yields were always the largest contributor (62%), while mollusks and fish accounted for 36% and 2%, respectively. Major cultured species were the whiteleg shrimp (Penaeus vannamei) and giant tiger prawn (Penaeus monodon). National shrimp culture production was estimated at 260000 tons in 1995 and reached more than 290000 tons in 2015 [26,27,28,29,30,31,32,33,34,35,36,37,38,39,40,41,42,43,44,45,46]. Thailand’s coastal aquaculture faced a significant decline in the production of farmed shrimp from about 600000 tons in 2012 to 325000 tons in 2013 due to disease outbreaks [47]. In several countries, shrimp farming has been promoted to provide economic benefits [13]. The total land area of shrimp farms in Thailand was estimated to expand beyond 74900 ha in 1995 and to peak at 82000 ha in 2003. Then, the 2004–2015 period witnessed a steady decline in shrimp culture. The DoF [46] estimated that the land area of shrimp farms in 2015 shrunk to around 48000 ha. Likewise, shrimp production (specifically the giant tiger shrimp, Penaeus monodon) followed a similar trend to the shrimp farmland area. Yields rose from 255900 to 260000 tons from 1995 to 2002, followed by a dramatic decline from 194900 tons in 2003 to 12000 tons in 2015. The decline of giant tiger shrimp yield was, however, mostly due to infectious diseases (e.g., monodon baculovirus, yellow-head virus and white-spot syndrome virus) [48,49].
Farmed mollusk production increased from 3500 to 6000 farms between 1995 and 2015 [26,27,28,29,30,31,32,33,34,35,36,37,38,39,40,41,42,43,44,45,46]. The dominant species cultivated included the green mussel (Perna viridis), the blood cockle (Anadara spp.), and oysters (Saccostrea cucullata, Crassostrea belcheri, and Crassostrea iredalei) [50]. Over 16000 ha of land along the coasts on the Gulf of Thailand and the Andaman Sea were used to support shellfish culture in 2015 [51]. Mollusks are generally farmed along coastlines where wild or hatchery-reared seeds are grown on the seabed bottom or in suspended nets, ropes, wood, or other structures [15]. In 2015, approximately 20% (39600 tons) of total cultured shellfish harvest by weight, worth about US$5.8 million, was gathered from deep-water pound nets and shallow-water pound nets in the coastal waters of Thailand [51].

4. The Effects of Aquaculture on the Environment

4.1. Land Cover Change

Based on official reports of the DoF, from 1995 to 2015, there was an annual average of 430200 aquaculture farms, with 90% being freshwater farms and 10% being coastal farms. An estimated 199470 ha of land was used for aquaculture farming. Out of the total area, 61% was used for freshwater farms and 39% was used for coastal farms.
Over the twenty-year period (1995–2015), the number of freshwater aquaculture farms dramatically increased from around 131000 farms to more than 540000 farms [26,27,28,29,30,31,32,33,34,35,36,37,38,39,40,41,42,43,44,45,46]. In 1995, freshwater aquaculture production covered an area of approximately 58000 ha, and it increased to around 128000 ha in 2015. Meanwhile, coastal aquaculture production gradually rose from 32770 farms to 37790 farms between 1995 and 2015. The annual average number of coastal aquaculture farms was about 40884 farms. In total, around 27285 farms (67%) of the annual average of coastal aquaculture farms were potentially for shrimp farming, more than 8200 farms (20%) were for fish farming, and roughly 5300 farms (13%) were for bivalves. Though, on average, shrimp farms made up the majority of coastal farms, their numbers have steadily decreased from 26145 farms to 21082 farms over twenty years. On the other hand, the number of fish and shellfish farms have risen from 3082 to 10696 farms and 3541 to 6015 farms, respectively. Figure 2 illustrates the changes in the area that were used for coastal aquaculture production in 25 Thai provinces during 1995–2015. The Surat Thani province was the most important area that was used for coastal aquaculture farms and accounted for about 11% of the total land that was used for coastal aquaculture production. The available data for each province are shown in Appendix A; Table A2.
Figure 3 shows the average yield per hectare of all species present in Thailand’s coastal aquaculture and the land area used for production. From 1995 to 2015, the yield ranged from 4 to 13 tons/ha, with an average of 8.0 ± 3.0 tons/ha. The land area of coastal aquaculture production surged and then followed a downward trend. It is estimated that the total land area of coastal aquaculture production in Thailand grew to around 79200 ha in 1995 and reached a peak of around 95000 ha in 2003, the highest number over the last two decades [26,27,28,29,30,31,32,33,34,35,36,37,38,39,40,41,42,43,44,45,46]. After that, there was an abrupt decrease of 12% between 2003 and 2004 as a result of disease outbreaks in shrimp [48,52] and the 2004 tsunami [53]. After that, the land area steadily decreased from 2004 to 2015. The DoF [46] suggested that land area of coastal production in 2015 shrunk to around 65800 ha.

4.2. Degradation of Mangrove Forest

Apparently, the increase of shrimp culture production has degraded and deforested coastal areas, including mangrove forests [13,54,55]. Several studies have suggested that the mangrove area has a significant role to play in the provision of human food, nursery habitats for marine animals, coastal protection, flood control, sediment trapping, and water treatment [13,15].
Thailand’s mangrove area dramatically decreased between 1961 and 1996, from 367000 ha to 167582 ha (Table 2). After a period of short increase, Thailand’s mangrove forest area again steadily decreased from 252765 ha in 2000 to 245534 ha in 2014 [56,57]. It is estimated that Thailand lost about 122,300 ha of mangroves over a half-century from 1961 to 2014 (33% of the area in 1961) [56,57]. Menasveta [55] indicated that approximately 65000 ha of mangroves were converted to shrimp ponds from 1961 to 1996, making this the main cause of mangrove deforestation in Thailand. However, since the late 1990s, concerns have been raised about the sustainability of these intensive practices. Consequently, Thailand has formulated and modified its policies and plans to restore and rehabilitate mangrove forests across the country [16,54]. For example, the Fisheries Act prohibits pond construction in public mangrove areas [58] because shrimp farms are not opened in mangrove areas [59]. As a result of increasing awareness in the country, the annual rate of mangrove area lost has gradually decreased in recent years.

4.3. Impact of Exotic Species

Against a backdrop of stagnating aquaculture production, Thailand’s shrimp production switched from farming tiger shrimp to whiteleg shrimp. This species is originally native to the eastern Pacific coast from Sonora, Mexico in the north, through Central and South America as far south as Tumbes in Peru [60]. This species was introduced to the Thai aquaculture in 2000 [61] as a disease-resistant species [52]. As a result, whiteleg shrimp production has rapidly burgeoned from around 132000 tons to more than 281000 tons from 2003 to 2015 [26,27,28,29,30,31,32,33,34,35,36,37,38,39,40,41,42,43,44,45,46].
Exotic species are a threat to global biodiversity [62,63]. Exotic species commonly contribute to the decline and extinction of native species, but some others can contribute economic or social benefits to recipient communities [63,64,65]. According to the DoF database, many exotic species in Thailand (e.g., Penaeus vannamei, Oreochromis niloticus, and Barbonymus gonionotus) are major species in aquaculture. There are about 40 exotic species recorded in Thai aquaculture farms [61], with seven species (Clarias gariepinus, Hypostomus spp., Pterygoplichthys sp., Arapaima gigas, Serrasalmus spp., Pomacea gigas and Pomacea canaliculate) considered as invasive. Meanwhile, two species (Trachinotus blochii and Artemia spp.) have a beneficial effect on aquaculture production. Several exotic species are a major threat to marine or freshwater ecosystems, e.g., the Amazon apple snail (Pomacea canaliculata) [66]. This species was initially introduced from South America to Southeast Asia in the 1980s as a local food resource and as a potential gourmet export item [65]. It rapidly escaped or was released in agricultural areas, lakes, watercourses, and wetlands. It became a serious pest in rice paddies in many Southeast Asian countries, including Thailand [65,67], and is part of the 100 of the world’s worst invasive species [67]. In recent years, international agreements such as the Sustainable Development Goals (SDG 15) and the Convention on Biological Diversity (Aichi Biodiversity Target 9) have prioritized the control and/or eradication of alien species and the minimization of their impact on land and water ecosystems.

4.4. Water Pollution

Eutrophication, a process that is caused by the excessive input of nutrients (e.g., phosphorus and nitrogen), is widely recognized as a severe threat to the environment [15,68]. It negatively affects water quality and eventually leads to ecological damage [68]. The intensification of aquaculture production is a major source of eutrophication [15,52], mainly due to the release of untreated wastewater and sewage sludge from fish and shrimp farms [69,70]. The water quality of overstocked and/or overfed fish farms is commonly poor as a result of the decomposition of waste feed and fish feces, and its discharge can have negative effects on surrounding water sources [69]. Effluents from such farms unload a massive amount of nutrients into coastal and estuarine waters, often stimulating the rapid growth of primary producers in water ecosystems, such as algae and plankton [68]. Cheevaporn and Menasveta [71] documented that the blue-green algae (Trichodesmium erythraem and Noctilluca sp.) bloomed in the Gulf of Thailand due to the disposal of untreated sewage. Luo, et al. [72] indicated that the continuous accumulation of certain compounds, e.g., nitrogen, can lead to acidification and cause adverse effects on aquatic plants and animals, with significant biotic damage.
The problems of effluent discharge from aquaculture farms have been widely discussed [15]. During recent decades, authors have examined techniques for environmentally friendly aquaculture to reduce the inputs of nitrogen and phosphorus from point-source effluents to water bodies [73,74,75]. Biofloc technology has been gaining popularity as an efficient alternative water management system [73,75,76]. It combines the removal of nutrients from water with the production of microbial biomass, which can be used by the culture species in situ as feed supplements [77]. Furthermore, the concept and practice of integrated multi-trophic aquaculture constitutes one way of reducing water pollution problems that are caused by aquaculture activity [78]. Multi-trophic aquaculture is based on the concept that waste from one species, such as uneaten feed, feces, and metabolic excretion, is useful for the growth of other species, thus forming a natural self-cleansing mechanism [79]. Many countries, e.g., the Philippines, Malaysia, Vietnam, China, and Thailand, have incorporated this practice by culturing fish species in combination with seaweed to increase economic benefits and reduce negative environmental impacts from aquaculture activities [80].

5. Prospects for Sustainable Aquaculture in Thailand

In the face of population growth, increasing demand for animal protein, and the limitation of expanding wild fishery harvests, aquaculture production presents an opportunity to increase seafood production [81,82]. Thai aquaculture production has rapidly developed during the last few decades and has been responsible for most of the yield increase of fish supply. The promotion of aquaculture production has become one of the key strategies in Thailand and is considered key to provide food security as well as developing national economic activities (Office of the National Economic and Social Development (NESDB, 2019). According to the current five-year National Economic and Social Development Plan (2017–2021), the Government of Thailand announced its policy that encourages the country’s aquaculture production. The DoF is the main implementing agency in the fisheries and aquaculture sector under the administrative control of the Ministry of Agriculture and Cooperatives. However, this industry has come under scrutiny with concerns regarding environmental degradation [76]. Governmental agencies have made several attempts to improve and promote a sustainable farming industry through the reformation of Thai aquaculture, e.g., the Agricultural Standards Act B.E. 2551 (2008), the Thai Agricultural Standard on Good Aquaculture Practices for marine shrimp (TAS 7401-2014), and the shrimp Code of Conduct. Governmental agencies are supporting the development of new aquaculture technologies and tools and have been disseminating them to farmers to support sustainable aquaculture practices [22].
Increasingly, attention is being given to shrimp farming in Thailand due to suitable geographical conditions and recent technologies that have boosted its productivity [23]. As a result, the total land area for shrimp aquaculture has rapidly expanded in the last few decades. Gentry, et al. [82] and Sorgeloos [83] argued that coastal areas in many countries that are suitable for marine aquaculture could meet foreseeable seafood demands, specifically mollusk production. Though farming seafood in the ocean can have potential for the future growth of aquaculture production, environmentally sensitive or high biodiversity areas, such as coral reefs, should be protected from farming industries [82]. The development of ports and harbours for accessing seafood markets and farming infrastructures need to take into account the growth of future mariculture [82].
Though aquaculture production systems could contribute to provide food and nutrition for people, as well as to develop the national economy, an unsustainable expansion of the industry poses a significant threat to ocean resources, coastal resources, and the global environment. A growing issue is the massive amount of wild fish, particularly trash fish, that are needed to feed in the farmed fish and shellfish industries [84,85]. Several studies have investigated alternative sources of protein (e.g., algae meal, wheat gluten, corn gluten, and insects) to replace and reduce the use of fishmeal and fish oil in aquafeed production [86,87].
Furthermore, although water quality and quantity are of paramount importance for aquaculture production, it appears that proper water resource management for sustainable aquaculture has remained a major challenge in Thailand [23]. To tackle this issue, low- and high-tech farming practices that are designed for eco-friendly aquaculture, such as the integration of cultures from different trophic levels, the integration of rice-fish farming, and the integration of production systems with livestock and agriculture, can be proper solutions [78,79,88]. Equally important are innovative technologies such as microbial management of farming systems that can offer a balanced solution between environmental remediation, economic benefits, and social acceptability [73,75,76]. In some cases, extensive (low-tech) aquaculture can be the most sustainable option, where reduced food production can be compensated for by other ecosystem services of aquaculture ponds [89]. Interestingly, the new practice of intensive shrimp farming in Thailand is a good example of a sustainable aquaculture practice. This practice implements a zero-water-exchange system by recirculating wastewater from shrimp ponds into ponds that are stocked with tilapia or Caulerpa seaweed. These so-called “shrimp toilets” aid in waste removal and significantly improve the sustainability of shrimp farming [90]. It is interesting to see that these solutions do not need necessarily require high-technology, and they are often economically profitable as well. Thus, future policies and research must focus on developing easy-to-adopt sustainable aquaculture practices and disseminating such information and technology to farmers.
Finally, natural disasters, such as tsunamis, flooding, and animal disease outbreaks can have destructive effects on aquaculture production [13]. For example, in the past few years, Thailand’s shrimp aquaculture production has been disrupted by disease outbreaks, such as the early mortality syndrome/acute hepatopancreatic necrosis disease (EMS/AHPND) [47]. As Thailand is still facing the risk of aquatic animal diseases in aquaculture, the Government of Thailand has invested in research at universities and quasi-public institutions such as the Thai National Center for Genetic Engineering and Biotechnology (BIOTEC) to address this problem [59].

6. Conclusions

In this paper, we reviewed the evolution of aquaculture production in Thailand under a perspective of environmental sustainability. We drew several important conclusions. Firstly, Thailand’s aquaculture production has rapidly developed during the last few decades and has been responsible for an increase in seafood supply. However, despite its substantial economic growth, this rapid development has led to numerous environmental problems, e.g., the loss of ecologically sensitive land as a result of land use for aquaculture production, the introduction of exotic species for production purposes leading to damages of ecosystem compositions, and eutrophication due to the discharges of aquaculture farms. Hence, the development and implementation of effective management approaches are urgently needed. From this perspective, several novel approaches to facilitate responsible aquaculture practices have been proposed, and these involve both traditional and advanced technology, e.g., the integration of aquaculture production systems with livestock and agriculture, the development of alternative sources of protein to replace and reduce the use of fishmeal in aquaculture feed, water quality treatment, and the microbial management of farming systems. These practices can be the basis for viable long-term solutions for sustainable aquaculture production and environmental practices in the future.

Author Contributions

Conceptualization, T.S., and P.G.; The structure of the manuscript and analysis, T.S., L.H., C.L., N.S., P.S., and P.G.; Writing—original draft, T.S.; Writing—review and editing, T.S., L.H., C.L., N.S., P.S., and P.G. All authors have read and agreed to the published version of the manuscript.

Funding

Thaksin University supported this work through a Ph.D. scholarship.

Acknowledgments

Special thanks are extended to anonymous reviewers and numerous colleagues for an informal review of our manuscript. We thank Srisuwan Kuankachorn, Roschong Boonyarittichaikij, Chananchida Sang-aram, and Wisarut Junprung for their helpful comments and suggestions. We also thank Thailand’s Department of Fisheries for providing the fisheries database.

Conflicts of Interest

The authors declare no conflict of interest. The sponsor had no role in the design of the study; in the collection, analyses, or interpretation of data; in the writing of the manuscript, and in the decision to publish the results.

Appendix A

Table A1. Taxonomic composition and group of species produced in aquaculture production in Thailand from 1995 to 2015.
TaxonYields of Aquaculture Production (Tons)Average Taxonomic Composition of Aquaculture Production (Tons)Percentage of Taxonomic Composition of Aquaculture Production
19952000200520102015
Fish
Mytilidae55,39588,759270,677123,879115,543149,521 ± 83,17914.9
Perna viridis51,18488,759270,677123,879115,543149,062 ± 837814.9
Musculus senhousia4211----878 ± 1971<0.1
Cichlidae76,05782,391203,896204,726205,974147,807 ± 61,86414.7
Oreochromis niloticus76,05482,363203,737204,680205,896147,729 ± 61,85214.7
Oreochromis mossambicus328159467877 ± 62<0.1
Clariidae44,12076,000142,205140,763114,179104,625 ± 34,81610.4
Clarias spp.44,12076,000142,205140,763114,179104,625 ± 34,81610.4
Arcidae14,40345,65756,85340,97958,99154,892 ± 20,8135.5
Anadara spp.14,40345,65756,85340,97958,99154,892 ± 20,8135.5
Cyprinidae33,59954,48270,36146,49033,46149,783 ± 13,1555.0
Cyprinus spp.355655395036241712854341 ± 23940.4
Barbonymus gonionotus27,43246,27660,64342,04930,49842,442 ± 11,4414.2
Chinese major carps mixed species653438285354200363 ± 226<0.1
Labeo rohita148011723196116911011848 ± 11080.2
Cirrhinus mrigala47810521201501377790 ± 3430.1
Osphronemidae17,32123,23341,37738,95718,62129,125 ± 9,2312.9
Trichopodus pectoralis16,71421,57735,86734,41914,95626,142 ± 8,0532.6
Trichopodus spp.2591695854112 ± 143<0.1
Osphronemus goramy34814875452453336612827 ± 15910.3
Pangasiidae730813,23127,25227,45519,79019,488 ± 73871.9
Pangasianodon hypophthalmus730813,22626,44627,02719,79019,157 ± 71731.9
Pangasius larnaudii-580642819,060730 ± 33<0.1
Ostreidae23,03713,55619,10610,75719,87119,121 ± 5,8851.9
Saccostrea cucullata23,03713,55619,10610,75719,87119,121 ± 58851.9
Latidae3882775214,21917,41517,25011,936 ± 49391.2
Lates calcarifer3882775214,21917,41517,25011,936 ± 49391.2
Channidae6430452712,507463936416330 ± 24530.6
Channa striata5791444712,300434030755968 ± 24840.6
Channa micropeltes63980207299566362 ± 295<0.1
Serranidae67413322582279022582139 ± 9060.2
Epinephelus spp.67413322582279022582139 ± 9060.2
Anabantidae9494702965486223871 ± 7730.1
Anabas testudineus9494702965486223871 ± 7730.1
Eleotridae675981147870 ± 46<0.1
Oxyeleotris marmorata675981147870 ± 46<0.1
Synbranchidae13865--44 ± 115<0.1
Monopterus albus13865--44 ± 115<0.1
Notopteridae495281412 ± 19<0.1
Notopterus spp.495281412 ± 19<0.1
Mugilidae--28--2 ± 6<0.1
Mullet group--28--2 ± 6<0.1
Fish mixed group275454585568594533784944 ± 15080.5
Shrimp
Penaeidae258,398309,206401,150559,427294,703379,601 ± 134,88337.9
Penaeus merguiensis181335625083182371391 ± 13280.1
Penaeus monodon255,890304,98826,055510512,098119,625 ± 120,97111.9
Litopenaeus vannamei--374,487553,899281,918258,143 ± 239,84625.7
Metapenaeus spp.695656100105450442 ± 421<0.1
Palaemonidae7792991728,74022,35016,23618,467 ± 97231.8
Macrobrachium rosenbergii7792991728,74022,35016,23618,467 ± 97231.8
Shrimp mixed group114265610021737480 ± 473<0.1
Carb
Carb mixed group45915--22 ± 36<0.1
Other aquatic animals18514004419467343003261 ± 15590.3
Total aquaculture production553,608738,0841,304,2111,252,063928,5381,002,540 ± 309,395100
Source: Adapted from the DoF [26,27,28,29,30,31,32,33,34,35,36,37,38,39,40,41,42,43,44,45,46]. All species that are mentioned on the list of landings of Thailand’s marine fisheries were identified by using a guide to marine fishes in Thailand, the international online fish database (http://www.fishbase.org), and the IUCN red list of threatened species (http://www.iucnredlist.org/about).
Table A2. The amount of area used for coastal aquaculture production in 25 Thai provinces from 1995 to 2015. Source: Based on the DoF [26,27,28,29,30,31,32,33,34,35,36,37,38,39,40,41,42,43,44,45,46].
ProvinceYear (ha)Average
19952000200520102015
Trat262115863472223815482075 ± 608
Chanthaburi16253138026175636158247995 ± 2989
Rayong13866631269157510881244 ± 349
Chin Buri1553177863517305401265 ± 615
hachengsao285090968659410136126295 ± 2526
Prahin Buri3621248192318889851351 ± 659
Samut Prakan587984997327511277737193 ± 1494
Bangkok28112970295787537572626 ± 868
Samut Sakhon627359982979483367745140 ± 1357
Samut Songkhram438758783948453955775358 ± 836
Phetchaburi180921021286272447282563 ± 1450
Prachuap Khiri Khan100419671644234810491977 ± 975
Chumphon22481296294617929441870 ± 530
Surat Thani8378481412887789064968749 ± 2650
Nakhon Si Thanmmarat10734113178233384824937215 ± 3342
Songkhla297522814265184112202483 ± 989
Phatthalung249566109719090361 ± 282
Pattani8928191571920244864 ± 426
Narathiwat132082542736 ± 18
Ranong9596661204929656871 ± 257
Phangnga12951158160411737291339 ± 389
Phuket340248316266129288 ± 79
Krabi1141969104013516031152 ± 288
Trang12081877149215147721345 ± 366
Satun160212811872148013501572 ± 299

References

  1. United Nations. Transforming our World: The 2030 Agenda for Sustainable Development; United Nations: New York, NY, USA, 2015. [Google Scholar]
  2. FAO. The State of World Fisheries and Aquaculture 2016; Food and Agriculture Organization of the United Nations: Rome, Italy, 2016. [Google Scholar]
  3. Thilsted, S.H.; Thorne-Lyman, A.; Webb, P.; Bogard, J.R.; Subasinghe, R.; Phillips, M.J.; Allison, E.H. Sustaining healthy diets: The role of capture fisheries and aquaculture for improving nutrition in the post-2015 era. Food Policy 2016, 61, 126–131. [Google Scholar] [CrossRef] [Green Version]
  4. Allison, E.H. Aquaculture, Fisheries, Poverty and Food Security; The Worldfish Center: Penang, Malaysia, 2011. [Google Scholar]
  5. Beveridge, M.C.; Thilsted, S.; Phillips, M.; Metian, M.; Troell, M.; Hall, S. Meeting the food and nutrition needs of the poor: The role of fish and the opportunities and challenges emerging from the rise of aquaculture. J. Fish Biol. 2013, 83, 1067–1084. [Google Scholar] [CrossRef] [Green Version]
  6. Tacon, A.G.; Metian, M. Fish matters: Importance of aquatic foods in human nutrition and global food supply. Rev. Fish. Sci. 2013, 21, 22–38. [Google Scholar] [CrossRef]
  7. Rittenschober, D.; Stadlmayr, B.; Nowak, V.; Du, J.; Charrondiere, U.R. Report on the development of the FAO/INFOODS user database for fish and shellfish (uFiSh)–Challenges and possible solutions. Food Chem. 2016, 193, 112–120. [Google Scholar] [CrossRef] [PubMed]
  8. FAO. The State of World Fisheries and Aquaculture 2018—Meeting the Sustainable Development Goals; Food and Agriculture Organization of the United Nations: Rome, Italy, 2018. [Google Scholar]
  9. Agnew, D.J.; Pearce, J.; Pramod, G.; Peatman, T.; Watson, R.; Beddington, J.R.; Pitcher, T.J. Estimating the worldwide extent of illegal fishing. PLoS ONE 2009, 4, e4570. [Google Scholar] [CrossRef] [PubMed] [Green Version]
  10. Cressey, D. Farmed Fish Drive Sea Change in Global Consumption. Available online: https://www.nature.com/news/farmed-fish-drive-sea-change-in-global-consumption-1.20223 (accessed on 30 January 2019).
  11. DoF. Fisheries Statistics of Thailand 2016; Department of Fisheries: Bangkok, Thailand, 2018. [Google Scholar]
  12. Froehlich., H.E.; Gentry, R.R.; Halpern, B.S. Global change in marine aquaculture production potential under climate change. Nat. Ecol. Evol. 2018, 2, 1745–1750. [Google Scholar] [CrossRef]
  13. FAO. The World’s Mangroves 1980–2005; Food and Agriculture Organization of the United Nations: Rome, Italy, 2007. [Google Scholar]
  14. Giri, C.; Long, J.; Abbas, S.; Murali, R.M.; Qamer, F.M.; Pengra, B.; Thau, D. Distribution and dynamics of mangrove forests of South Asia. J. Environ. Manag. 2015, 148, 101–111. [Google Scholar] [CrossRef]
  15. Naylor, R.L.; Goldburg, R.J.; Primavera, J.H.; Kautsky, N.; Beveridge, M.C.; Clay, J.; Folke, C.; Lubchenco, J.; Mooney, H.; Troell, M. Effect of aquaculture on world fish supplies. Nature 2000, 405, 1017. [Google Scholar] [CrossRef] [Green Version]
  16. Thompson, B.S. The political ecology of mangrove forest restoration in Thailand: Institutional arrangements and power dynamics. Land Use Policy 2018, 78, 503–514. [Google Scholar] [CrossRef]
  17. Naylor, R.L.; Goldburg, R.J.; Mooney, H.; Beveridge, M.; Clay, J.; Folke, C.; Kautsky, N.; Lubchenco, J.; Primavera, J.; Williams, M. Nature’s subsidies to shrimp and salmon farming. Science 1998, 282, 883–884. [Google Scholar] [CrossRef]
  18. Sampantamit, T.; Ho, L.; Van Echelpoel, W.; Lachat, C.; Goethals, P. Links and Trade-Offs between Fisheries and Environmental Protection in Relation to the Sustainable Development Goals in Thailand. Water 2020, 12, 399. [Google Scholar] [CrossRef] [Green Version]
  19. Lutaladio, N. Horticulture, biodiversity and nutrition. J. Food Comp. Anal. 2010, 23, 481–663. [Google Scholar] [CrossRef]
  20. Golden, C.D.; Allison, E.H.; Cheung, W.W.; Dey, M.M.; Halpern, B.S.; McCauley, D.J.; Smith, M.; Vaitla, B.; Zeller, D.; Myers, S.S. Nutrition: Fall in fish catch threatens human health. Nature 2016, 534, 317–320. [Google Scholar] [CrossRef] [PubMed]
  21. Lachat, C.; Raneri, J.E.; Smith, K.W.; Kolsteren, P.; Van Damme, P.; Verzelen, K.; Penafiel, D.; Vanhove, W.; Kennedy, G.; Hunter, D. Dietary species richness as a measure of food biodiversity and nutritional quality of diets. Proc. Natl. Acad. Sci. USA 2018, 115, 127–132. [Google Scholar] [CrossRef] [Green Version]
  22. Nesbitt, M.; McBurney, R.P.; Broin, M.; Beentje, H.J. Linking biodiversity, food and nutrition: The importance of plant identification and nomenclature. J. Food Compos. Anal. 2010, 23, 486–498. [Google Scholar] [CrossRef]
  23. DoF. The Master Plan. on Thailand’s Aquaculture Development (2017–2021); Department of Fisheries: Bangkok, Thailand, 2019. [Google Scholar]
  24. Office of the National Economic and social Development Council. The National Economic and Social Development Plan. Available online: https://www.nesdb.go.th/main.php?filename=develop_issue (accessed on 1 December 2019).
  25. Dey, M.M.; Sheriff, N.; Bjørndal, T. Aquaculture Development in Asia: Current Status, Economics and Future Outlook; Institute for Research in Economics and Business Administration: Bergen, Norway, 2006. [Google Scholar]
  26. DoF. Fisheries Statistics of Thailand 1995; Department of Fisheries: Bangkok, Thailand, 1998. [Google Scholar]
  27. DoF. Fisheries Statistics of Thailand 1996; Department of Fisheries: Bangkok, Thailand, 1999. [Google Scholar]
  28. DoF. Fisheries Statistics of Thailand 1997; Department of Fisheries: Bangkok, Thailand, 2000. [Google Scholar]
  29. DoF. Fisheries Statistics of Thailand 1998; Department of Fisheries: Bangkok, Thailand, 2001. [Google Scholar]
  30. DoF. Fisheries Statistics of Thailand 1999; Department of Fisheries: Bangkok, Thailand, 2002. [Google Scholar]
  31. DoF. Fisheries Statistics of Thailand 2000; Department of Fisheries: Bangkok, Thailand, 2003. [Google Scholar]
  32. DoF. Fisheries Statistics of Thailand 2001; Department of Fisheries: Bangkok, Thailand, 2004. [Google Scholar]
  33. DoF. Fisheries Statistics of Thailand 2002; Department of Fisheries: Bangkok, Thailand, 2004. [Google Scholar]
  34. DoF. Fisheries Statistics of Thailand 2003; Department of Fisheries: Bangkok, Thailand, 2005. [Google Scholar]
  35. DoF. Fisheries Statistics of Thailand 2004; Department of Fisheries: Bangkok, Thailand, 2006. [Google Scholar]
  36. DoF. Fisheries Statistics of Thailand 2005; Department of Fisheries: Bangkok, Thailand, 2007. [Google Scholar]
  37. DoF. Fisheries Statistics of Thailand 2006; Department of Fisheries: Bangkok, Thailand, 2008. [Google Scholar]
  38. DoF. Fisheries Statistics of Thailand 2007; Department of Fisheries: Bangkok, Thailand, 2009. [Google Scholar]
  39. DoF. Fisheries Statistics of Thailand 2008; Department of Fisheries: Bangkok, Thailand, 2010. [Google Scholar]
  40. DoF. Fisheries Statistics of Thailand 2009; Department of Fisheries: Bangkok, Thailand, 2011. [Google Scholar]
  41. DoF. Fisheries Statistics of Thailand 2010; Department of Fisheries: Bangkok, Thailand, 2012. [Google Scholar]
  42. DoF. Fisheries Statistics of Thailand 2011; Department of Fisheries: Bangkok, Thailand, 2013. [Google Scholar]
  43. DoF. Fisheries Statistics of Thailand 2012; Department of Fisheries: Bangkok, Thailand, 2014. [Google Scholar]
  44. DoF. Fisheries Statistics of Thailand 2013; Department of Fisheries: Bangkok, Thailand, 2015. [Google Scholar]
  45. DoF. Fisheries Statistics of Thailand 2014; Department of Fisheries: Bangkok, Thailand, 2016. [Google Scholar]
  46. DoF. Fisheries Statistics of Thailand 2015; Department of Fisheries: Bangkok, Thailand, 2017. [Google Scholar]
  47. Boonyawiwat, V.; Patanasatienkul, T.; Kasornchandra, J.; Poolkhet, C.; Yaemkasem, S.; Hammell, L.; Davidson, J. Impact of farm management on expression of early mortality syndrome/acute hepatopancrea ticnecrosis disease (EMS/AHPND) on penaeid shrimp farms in Thailand. J. Fish Dis. 2017, 40, 649–659. [Google Scholar] [CrossRef]
  48. FAO. The State of World Fisheries and Aquaculture 1998; Food and Agriculture Organization of the United Nations: Rome, Italy, 1999. [Google Scholar]
  49. Flegel, T. Detection of major penaeid shrimp viruses in Asia, a historical perspective with emphasis on Thailand. Aquaculture 2006, 258, 1–33. [Google Scholar] [CrossRef]
  50. Chalermwat, K.; Szuster, B.; Flaherty, M. Shellfish aquaculture in Thailand. Aquac. Econ. Manag. 2003, 7, 249–261. [Google Scholar] [CrossRef]
  51. DoF. Statistics of Marine Shellfish Culture Survey 2015; Department of Fisheries: Bangkok, Thailand, 2017. [Google Scholar]
  52. Diana, J.S. Aquaculture production and biodiversity conservation. BioScience 2009, 59, 27–38. [Google Scholar] [CrossRef]
  53. Tanyaros, S.; Crookall, D. The 2004 Indian Ocean Tsunami: Impact on and Rehabilitation of Fisheries and Aquaculture in Thailand. Available online: https://www.intechopen.com/books/the-tsunami-threat-research-and-technology/the-2004-indian-ocean-tsunami-impact-on-and-rehabilitation-of-fisheries-and-aquaculture-in-thailand (accessed on 3 March 2020).
  54. DMCR. Mangrove Area in the Past. Available online: https://km.dmcr.go.th/en/c_11/d_690 (accessed on 16 July 2018).
  55. Menasveta, P. Mangrove destruction and shrimp culture systems. Fisheries 1997, 50, 143–151. [Google Scholar]
  56. DMCR. Status of Mangroves. Available online: https://km.dmcr.go.th/th/c_11/d_8201 (accessed on 26 July 2018).
  57. Mhaudjan, J. Situation of Mangrove Invasion in Thailand; Mangrove Conservation Office: Bangkok, Thailand, 2012. [Google Scholar]
  58. Hishamunda, N.; Bueno, P.B.; Ridler, N.; Yap, W.G. Analysis of Aquaculture Development in Southeast Asia; Food and Agriculture Organization of the United Nations: Rome, Italy, 2009. [Google Scholar]
  59. Lebel, L.; Garden, P.; Luers, A.; Manuel-Navarrete, D.; Giap, D.H. Knowledge and innovation relationships in the shrimp industry in Thailand and Mexico. Proc. Natl. Acad. Sci. USA 2016, 113, 4585–4590. [Google Scholar] [CrossRef] [PubMed] [Green Version]
  60. FAO. Cultured Aquatic Species Information Programme: Penaeus Vannamei (Boone, 1931). Available online: http://www.fao.org/fishery/culturedspecies/Penaeus_vannamei/en (accessed on 14 October 2019).
  61. Termvidchakorn, A.; Vidthayanon, C.; Getpetch, Y.-E.; Sorrak, P.; Paradonpanichakul, P. Alien Aquatic Species in Thailand; Inland Fisheries Resources Research and Development Institute, Department of Fisheries: Bangkok, Thailand, 2003. [Google Scholar]
  62. Anton, A.; Geraldi, N.R.; Lovelock, C.E.; Apostolaki, E.T.; Bennett, S.; Cebrian, J.; Krause-Jensen, D.; Marbà, N.; Martinetto, P.; Pandolfi, J.M. Global ecological impacts of marine exotic species. Nat. Ecol. Evol. 2019, 3, 787–800. [Google Scholar] [CrossRef] [PubMed]
  63. Brown, P.; Roy, D.; Harrower, C.; Dean, H.; Rorke, S.; Roy, H. Spread of a model invasive alien species, the harlequin ladybird Harmonia axyridis in Britain and Ireland. Sci. Data 2018, 5, 180239. [Google Scholar] [CrossRef] [PubMed] [Green Version]
  64. Doherty, T.S.; Glen, A.S.; Nimmo, D.G.; Ritchie, E.G.; Dickman, C.R. Invasive predators and global biodiversity loss. Proc. Natl. Acad. Sci. USA 2016, 113, 11261–11265. [Google Scholar] [CrossRef] [PubMed] [Green Version]
  65. Vidthayanon, C. International Mechanisms for the Control. and Responsible Use of Alien Species in Aquatic Ecosystems: Report of an Ad Hoc Expert Consultation, 27–30 August 2003, Xishuangbanna, People’s Republic of China; FAO: Rome, Italy, 2005. [Google Scholar]
  66. ISSG. Global Invasive Species Database. Available online: http://issg.org/database/species/search.asp?st=sss&sn=&rn=Thailand&ri=19411&hci=-1&ei=-1&fr=1&sts=&lang=EN (accessed on 24 September 2019).
  67. ISSG. 100 of the World’s Worst Invasive Alien Species. Available online: http://issg.org/database/species/search.asp?st=100ss&fr=1&str=&lang=EN (accessed on 24 September 2019).
  68. Nakano, S.-I.; Yahara, T.; Nakashizuka, T. Aquatic Biodiversity Conservation and Ecosystem Services; Springer: Singapore, 2016. [Google Scholar]
  69. Ahmed, N.; Thompson, S. The blue dimensions of aquaculture: A global synthesis. Sci. Total Environ. 2018, 652, 851–861. [Google Scholar] [CrossRef]
  70. Science for Environment Policy. Sustainable Aquaculture. Available online: http://ec.europa.eu/science-environment-policy (accessed on 22 October 2019).
  71. Cheevaporn, V.; Menasveta, P. Water pollution and habitat degradation in the Gulf of Thailand. Mar. Pollut. Bull. 2003, 47, 43–51. [Google Scholar] [CrossRef]
  72. Luo, Z.; Hu, S.; Chen, D. The trends of aquacultural nitrogen budget and its environmental implications in China. Sci. Rep. 2018, 8, 10877. [Google Scholar] [CrossRef]
  73. Azim, M.E.; Little, D.C. The biofloc technology (BFT) in indoor tanks: Water quality, biofloc composition, and growth and welfare of Nile tilapia (Oreochromis niloticus). Aquaculture 2008, 283, 29–35. [Google Scholar] [CrossRef]
  74. Boyd, C.E. Water Quality: An Introduction; Springer: Basel, Switzerland, 2015. [Google Scholar]
  75. Dauda, A.B. Biofloc technology: A review on the microbial interactions, operational parameters and implications to disease and health management of cultured aquatic animals. Rev. Aquac. 2019, 1–18. [Google Scholar] [CrossRef]
  76. Emerenciano, M.; Gaxiola, G.; Cuzon, G. Biofloc Technology (BFT): A Review for Aquaculture Application and Animal Food Industry. Available online: https://www.intechopen.com/books/biomass-now-cultivation-and-utilization/biofloc-technology-bft-a-review-for-aquaculture-application-and-animal-food-industry (accessed on 25 October 2019).
  77. De Schryver, P.; Crab, R.; Defoirdt, T.; Boon, N.; Verstraete, W. The basics of bio-flocs technology: The added value for aquaculture. Aquaculture 2008, 277, 125–137. [Google Scholar] [CrossRef]
  78. FAO. National Fishery Sector Overview Thailand. Available online: Ftp://ftp.fao.org/Fi/DOCUMENT/fcp/en/FI_CP_TH.pdf (accessed on 10 October 2016).
  79. Chopin, T.; Buschmann, A.H.; Halling, C.; Troell, M.; Kautsky, N.; Neori, A.; Kraemer, G.P.; Zertuche-González, J.A.; Yarish, C.; Neefus, C. Integrating seaweeds into marine aquaculture systems: A key toward sustainability. J. Phycol. 2001, 37, 975–986. [Google Scholar] [CrossRef]
  80. Soto, D. Integrated Mariculture: A Global Review; Food and Agriculture Organization of the United Nations: Rome, Italy, 2009. [Google Scholar]
  81. Cressey, D. Aquaculture: Future fish. Nature 2009, 458, 398–400. [Google Scholar] [CrossRef] [PubMed] [Green Version]
  82. Gentry, R.R.; Froehlich, H.E.; Grimm, D.; Kareiva, P.; Parke, M.; Rust, M.; Gaines, S.D.; Halpern, B.S. Mapping the global potential for marine aquaculture. Nat. Ecol. Evol. 2017, 1, 1317. [Google Scholar] [CrossRef] [PubMed]
  83. Sorgeloos, P. Aquaculture: The Blue Biotechnology of the Future. World Aquac. 2013, 44, 16–25. [Google Scholar]
  84. Boonyubol, M.; Pramokchutima, S. Trawl Fisheries in the Gulf of Thailand; 9711022133; International Center for Living Aquatic Resources Management: Manila, Philippines, 1984. [Google Scholar]
  85. FAO. Review of the State of World Marine Fishery Resources; Food and Agriculture Organization of the United Nations: Rome, Italy, 2011. [Google Scholar]
  86. Beal, C.M.; Gerber, L.N.; Thongrod, S.; Phromkunthong, W.; Kiron, V.; Granados, J.; Archibald, I.; Greene, C.H.; Huntley, M.E. Marine microalgae commercial production improves sustainability of global fisheries and aquaculture. Sci. Rep. 2018, 8, 15064. [Google Scholar] [CrossRef] [PubMed] [Green Version]
  87. Krogdahl, Å.; Penn, M.; Thorsen, J.; Refstie, S.; Bakke, A.M. Important antinutrients in plant feedstuffs for aquaculture: An update on recent findings regarding responses in salmonids. Aquac. Res. 2010, 41, 333–344. [Google Scholar] [CrossRef]
  88. FAO. Report of the Special Session on Advancing Integrated Agriculture Aquaculture through Agroecology. Available online: http://www.fao.org/agroecology/database/detail/en/c/1255333/ (accessed on 21 February 2020).
  89. Landuyt, D.; Lemmens, P.; D’hondt, R.; Broekx, S.; Liekens, I.; Bie, T.D.; Declerck, S.A.J.; Meester, L.D.; Goethals, P.L.M. An ecosystem service approach to support integrated pond management: A case study using Bayesian belief networks-Highlighting opportunities and risks. J. Envir. Manag. 2014, 145, 79–87. [Google Scholar] [CrossRef]
  90. FAO. FAO Aquaculture Newsletter; Food and Agriculture Organization of the United Nations: Rome, Italy, 2020. [Google Scholar]
Figure 1. The relative abundance of aquatic species that were produced in Thailand from 1995 to 2015. Bar charts show the relative abundance of five major species (i.e., giant tiger prawn, Nile tilapia, green mussel, walking catfish, and whiteleg shrimp) compared to the total weight of all different species present in Thailand’s aquaculture production. Based on the DoF [26,27,28,29,30,31,32,33,34,35,36,37,38,39,40,41,42,43,44,45,46].
Sustainability 12 02010 g001
Figure 2. Changes in land used for coastal aquaculture production in 25 Thai provinces from 1995 to 2015. Based on the DoF [26,27,28,29,30,31,32,33,34,35,36,37,38,39,40,41,42,43,44,45,46].
Sustainability 12 02010 g002
Figure 3. Total yield per hectare (green) of all species present in coastal aquaculture and the land area used for coastal production (blue). Based on the DoF [26,27,28,29,30,31,32,33,34,35,36,37,38,39,40,41,42,43,44,45,46].
Sustainability 12 02010 g003
Table 1. The annual yield of aquaculture production and percentage contribution of inland and coastal production in Thailand from 1995 to 2015.
YearCoastal Aquaculture (Tons)Inland Aquaculture (Tons)Total Aquaculture Production (Tons)% of Coastal Aquaculture% of Inland Aquaculture
FishShrimpsMollusksOthersTotalFishShrimpsOthersTotal
19955132259,54092,83545357,552188,0797792185196,056553,6086535
19966235239,50080,183132326,050222,5115586557228,654554,7045941
19975652227,56066,408115299,735197,1702159848200,177499,9126040
19988794252,731106,12819367,672220,70347641456226,923594,5956238
19997377275,542158,2389441,166242,76684941352252,612693,7786436
20009229309,862147,9729467,072259,69599171400271,012738,0846337
20019588280,007244,9495534,549262,81613,3113569279,696814,2456634
200212,251264,923382,91810660,102275,13015,3933978294,501954,6036931
200314,599330,725357,94410703,278328,98428,1513990361,1251,064,4036634
200417,202360,289358,75822736,271486,38232,5834744523,7091,259,9805842
200516,836401,250346,63615764,737506,31528,7404419539,4741,304,2115941
200618,346494,401314,116-826,863498,37825,3533683527,4141,354,2776139
200715,523523,226306,57111845,331489,08632,1483861525,0951,370,4266238
200816,004506,602285,73923808,368485,06033,1894214522,4631,330,8316139
200917,851575,098301,78941894,779490,09326,7855002521,8801,416,6596337
201020,205559,644175,615-755,464469,57622,3504673496,5991,252,0636040
201119,126611,194186,730-817,050358,82321,0804450384,3531,201,4036832
201222,330609,552185,861-817,743431,11418,7024438454,2541,271,9976436
201319,256325,395216,835-561,486413,53618,1684061435,765997,2515644
201419,162279,907183,569-482,638394,91516,9063303415,124897,7625446
201519,548294,740194,405-508,693399,30916,2364300419,845928,5385545
Source: DoF [26,27,28,29,30,31,32,33,34,35,36,37,38,39,40,41,42,43,44,45,46].
Table 2. Estimated total mangrove forest area in Thailand between 1961 and 2014.
YearEstimated Total Mangrove Forest Area (ha)Mangrove Area Changes
ha%
1961367,900
1975312,700−55,200−15
1979287,308−25,392−8
1986196,436−90,872−32
1989180,559−15,877−8
1991173,821−6,738−4
1993168,683−5,138−3
1996167,582−1,100−1
2000252,76585,18351
2004233,308−19,457−8
2009244,01010,7025
2014245,5341,5241
Source: Adapted from Menasveta [55] and DMCR [56].

