Article

The Sustainable Effect of Operational Performance on Financial Benefits: Evidence from Chinese Quality Awards Winners

1
Department of Industrial Engineering, Tsinghua University, Beijing 100084, China
2
School of Economics and Management, Beijing Institute of Petrochemical Technology, Beijing 102617, China
3
School of Economics and Management, Beijing Information Science and Technology University, Beijing 100192, China
*
Authors to whom correspondence should be addressed.
Sustainability 2020, 12(5), 1966; https://doi.org/10.3390/su12051966
Submission received: 9 February 2020 / Revised: 28 February 2020 / Accepted: 2 March 2020 / Published: 4 March 2020
(This article belongs to the Special Issue Sustainable Performance Management)

Abstract

:
Quality management practices have become increasingly important as firms seek to obtain quality certifications to dominate markets. To date, adequate research evaluating the effects of quality management is lacking. In this work, we used Chinese quality awards to evaluate a firm’s quality level. A PSM-DiD (propensity score matching and difference-in-difference) model describing the relationship between quality award effects and financial benefits in terms of return on assets was developed. We further used a hierarchical regression to examine the influence of operational performance on financial benefits. The results show that quality awards cannot assure their winners a higher return on asset. Indicators of operating performance, such as less lead time and higher inventory turnover, can significantly enhance firms’ profitability. The moderating effects of operational performance suggest that firms may focus on how to translate quality management practices into business improvement. This study also contributes to the operation management literature by describing how firms need outstanding financial performance for sustainable development and continuous improvement.

1. Introduction

Quality management certificates, which demonstrate how firms outperform their counterparts in quality management, are considered to represent the outstanding performance of quality management practices. ISO standards are among the most pervasive quality management certificates. For example, ISO 9001 identifies customers’ needs and enables the quality policy to be achieved [1]. One widely adopted ISO standard is ISO 14001, which specifies particular environment goals and improves environment performance [2]. Furthermore, governments and social organizations have established various quality awards to identify firms that implemented an effective quality management system [3]. The most famous quality award is the Malcolm Baldrige National Quality Award (MBNQA), which is based on the criteria of total quality management (TQM).
While the importance of quality management certificates has been emphasized by firms and countries, the benefits of quality management certificates still remain unclear. Although some researchers have confirmed the positive effects of quality management certificates on financial indicators, such as ROA (return of asset) and Tobin’s Q [4], other scholars do not agree with this view [5]. Specifically, quality management practices are not sufficient to solve all problems that firms may encounter [6]. Therefore, while some firms, such as Toyota and Motorola, have won reputation for Just-in-Time (JIT) and Six Sigma, respectively, their products still suffer from serious quality-related problems [7].
In addition, operational performance is considered to play an important role in quality management practices. Operational performance is defined as the strategic dimensions of competing firms and consists of operational level indicators, such as flexibility and delivery [8]. The results of quality management systems are also shown in operational levels. However, few studies have explored the effects of operational performance on financial benefits. In addition, researchers may merely consider one dimension of operational performance, such as efficiency [9] or inventory [10]. These studies failed to provide a complete description of the influence of operational performance on financial benefits.
This study aims to fill the above research gaps by answering the following two questions: (1) How do quality management practices affect firms’ financial benefits? (2) What is the relationship between operational performance and financial benefits?
We use quality award winners as the research samples and examine whether these firms can obtain a higher return on assets than their counterparts. The results show that the awarded firms could not achieve significant improvement and that the effects of the awards are not obvious. In addition, we explore the impact of operational performance on the return on assets. The findings demonstrate that less lead time and a higher inventory turnover can enhance the financial benefits. Additionally, decreasing the operating costs and tracking sales more closely can improve the return on assets. Besides this, we also find that shorter lead time and larger inventory turnover can positively moderate the impact of quality awards on the ROA.
This study contributes to previous research along three directions. First, this study is among the first to use a PSM-DiD (propensity score matching and difference-in-difference) model to examine the effects of quality management certifications. The influence of endogeneity is significantly decreased by the addition of control variables. Second, we use a hierarchical regression to show the impact of operational dimensions and their moderation effects. This research perspective has been rarely adopted in previous studies. Third, Chinese quality awards have been established since 2001, but limited empirical research has explored the impact of these awards. Our study may provide additional evidence regarding the link between quality management and performance.
Section 2 reviews previous works and outlines the related hypotheses. In Section 3, the method is presented, and in Section 4, our findings are described. Section 5 provides a discussion and the implications of our study. The conclusions are presented in Section 6.

2. Theory and Hypothesis

In the 1960s, Dr. Deming introduced the concept of quality management to Japan. Facing great competition from Japan, US firms began to pay more attention to quality management practices like total quality management (TQM) [3]. TQM is defined as an integrated approach to achieve and sustain high quality output [11]. Specifically, TQM works from the business management level to grass-root workers and from raw material supply to customer feedback [12]. Previous studies considered TQM a set of quality management elements and constructed the relationships among these elements [5,13,14,15]. For example, Parvadavardini et al. [16] created the following three critical quality management practices in TQM: strategic quality planning, supplier quality, and process monitoring and control. These authors showed that all these elements can contribute to the improvement of quality performance (e.g., enhancing productivity and reducing the defect rate). Recently, some social factors, such as innovation [7] and personality [17], have been shown to be associated with traditional TQM elements. Based on TQM, the Malcolm Baldrige National Quality Award (MBNQA) criteria were established to evaluate firms’ quality management levels.
Prior studies that discussed the performance of quality management practices (e.g., TQM or quality certification) were inconclusive. One stream of the studies considered that quality management practices can improve the sales or profit [4,5,7], while some research showed that quality management practices may bring large costs [18] and the effects will not last for a long time [19]. We provide two explanations for these contradictory results. First, the majority research has adopted path analysis or the structural equation model [5,6,7,11,16] to capture the effects of quality management practices by the sign of coefficients. However, although these models can build the connection between quality management practices and financial performance successfully, their data source, like survey or questionnaire, may suffer from incredibility, as companies are willing to give more positive results [20]. Thus, the significance of quality management maybe overstated. To fix this problem, we use second data from public financial data and a novel research approach—the PSM-DID—model to explore the effects of quality awards on firms’ ROA. Previous studies may have used the event-study method to match the awarded firms with non-awarded firms [3,4,18]. Nonetheless, our method can provide a more accurate way to match samples by giving samples a propensity score. Second, a large amount of literature took samples from developed countries as research context, such as the US [3], Japan [7], and Spain [11]. Yet, the effects of quality management practices may not fit in other countries’ situations, as Baird et al. [21] pointed out: the national culture and business conditions of developing nations are different from above developed countries. As China has obtained the most ISO 9001 in the world in recent years [11], it is crucial to examine whether an excellent performance model can boost Chinese companies to achieve their business goals. Our study provides more evidence regarding the impact of quality management practices on financial performance.
Operational performance has been defined as the strategic dimensions in which companies choose to compete [8]. Better operational performance can increase customer satisfaction by delivering high-quality products and service in a short time. Following prior studies, we adopt delivery, flexibility, cost, and inventory to measure firm’s operational performance [8,22,23]. Delivery refers to a performance measure that the ability to deliver products to customers [8]. Flexibility is “a measure of a firm’s ability to respond to market demands by switching from one product to another through coordinated policies and actions” [24]. The operational cost, which is always associated with operational efficiency, emphasizes cost savings and increasing profits [8]. Effective inventory management can help firms decrease stocks and related inventory cost. Thus, products can be transported to customers in a short time, resulting in more benefits [25].
Previous studies had two shortcomings considering these four operational dimensions (delivery, flexibility, cost, and inventory). First, the measurement of these dimensions was proposed in a set of question items [26]. Although the effects of operational performance on financial performance can be found in these studies, we consider that measurable variables are more suitable rather than subjective feelings in the questionnaire. In this study, we use proxy variables to measure the operational dimensions (e.g., inventory turnover for operational inventory), and future research and industrial firms can easily replicate our method and find more interesting results. Second, a large amount of literature has focused on quality management and operational performance. However, few studies have paid attention to the moderation role of operational performance on the impact of quality management on financial performance. Facing the failure of quality-awarded firms such as Nokia, Motorola, and Kodak, we conjecture that there may be some barriers between the implementation of quality management practices and business performance. Thus, we add the interaction term between operational dimensions and quality certifications to explore whether better operational performance can accelerate the effectiveness of quality management practices.
The sustainable effects on quality management like green supply chain management [27] or social sustainability production [28] have been emphasized in previous literature. In particular, these studies used the environmental dimensions like green purchasing, green information, and eco-design to measure the firm’s sustainability performance. In this study, we use firms’ financial performance to explore whether quality awards can help firms’ sustainable progress and development. This motivation comes from several business examples in recent years. For example, Motorola won several MBNQA in the 1990s and 2000s. However, Motorola’s mobile business encountered failure in market share during the pace of smartphone evolution and was acquired by Google in 2010. We consider that firms should have outstanding financial performance to maintain their market position and sustainable growth can be achieved later. Therefore, although quality management practices were proposed in the 1960s and numerous firms have been awarded with high-quality reputation, it is still worth verifying the relationship between quality management and financial performance to show whether these award winners can have an excellent capability in continuous development.
Besides this, longstanding and profitable firms can also cultivate their loyal customers, thus these people can save time and money. For instance, HTC, a famous Taiwan electronic company, had a large amount of market share in the 2010s. In subsequent years, its mobile phone business was defeated by Apple, Samsung, and Huawei et al. Traditional HTC users had to abandon their HTC products and try to use other firms’ mobile phones. Thus, people can avoid the adaptive process of new products if a firm can provide endurable and sustainable service. As awarded firms may have more influence on the market, it is important to know whether these firms have better financial performance. From the perspective of sustainable development, more profitable firms can save their customers’ resources.

2.1. Quality Management Practices and Financial Performance

Quality is defined as the degree to which a set of inherent characteristics fulfils needs and expectations [29]. Therefore, the adoption of quality management systems may entail multidimensional practices for a firm. In reality, the obscure indicators and inadequate communication within quality elements could impede the implementation of quality management systems. Moreover, the cost to obtain and maintain quality certificates is substantial. For example, Cândido et al. [18] mentioned the following phenomenon, “certification withdrawal”, where nearly 60,000 firms deliberately lost ISO 9001 certificates to save resources and budget. In addition, researchers have demonstrated the deteriorating effects of quality management practices on firms: certified firms may lose their advantages in process management [19] and customer satisfaction [30] in five years.
Additionally, after successfully implementing quality management practices, some firms have been shown to experience benefits and make progress in operating factors. Specifically, quality management can positively affect firms’ supply chain efficiency, intellectual capital, and process improvement. For instance, ISO 9000 can influence time-based efficiency, which is measured by material and cash flow efficiency [31]. Both account receivable days and operating cycles have been shown to be shortened to 3.68 days and 5.28 days, respectively. In addition, the internalization of ISO 9000 requires competitive employee training, a corrective and improvement mechanism, and reliable documents for knowledge and information [32]. These intellectual capitals contribute to improvement in reducing the operating costs and satisfying delivery requirements. In summary, quality management practices provide firms with strong capabilities at all operating levels, thus allowing comprehensive benefits to be obtained.
In addition, quality management practices can result in quality awards and certifications, which help firms build an outstanding image for their customers. Quality management systems, such as ISO 9000, can serve as a signal showing that firms have supreme quality and distinguish certified firms from their competitors. Furthermore, firms may be under strong external pressure to use quality management systems as managerial methods [33]. For example, some Chinese firms with export business are required to have quality management certificates, such as ISO 9000 [31]. Hence, quality management practices can not only improve the production process and people’s relationships, but also could increase reputation and qualification in the market.
Besides this, the adoption of quality management practices can increase the financial indicators. One of the most widely used indicators is the return on assets (ROA), which measures how firms use their assets to create profits. Among the firms that adopted Six Sigma, 52.10% outperformed their counterparts in the measure of ROA [34]. This percentage increased to 54.69% and 56.30% among firms with OHSAS 18001 [35] and ISO 14001 [36] certificates, respectively. Additionally, other operating income-based measures and sales cost-based measures [3,4] provided strong evidence supporting the positive effects of quality management on firms’ financial performance.
Based on the above arguments that quality management practices can positively affect a firm’s financial performance, we propose the following hypothesis:
H1. 
Having quality management certifications can improve firms’ financial performance.

2.2. Effects of Operational Performance and Financial Performance

2.2.1. Flexibility and Financial Performance

As TQM emphasizes customer-focused product design and service to enhance customer satisfaction [13], response to the dynamic requirement of customer is key to a firm’s success. For example, Nissan produces four different type of vehicles (pickup tracks, sedans, minivans, SUVs) in a single plant in Canton, Mississippi, and its production lines can be quickly adjusted to one special type of vehicle without shutting down [37]. The flexible production capability could be one explanation for the popularity of Japanese automobile companies in U.S. On the contrary, facing complex and uncertain demands, it is difficult for some firms to predict future sales; thus, these firms may allocate limited resources to single product, resulting in the loss of customers and failure in competition [38]. Nowadays, operational flexibility has emerged as an important basis along with quality, price, and other factors to dominate a market [37]. Operational flexibility refers to the extent to which firms can change the product category with a limited penalty in time, effort, and cost [39]. Although there are different types of operational flexibility, such as supply chain flexibility [40] or strategic flexibility [41], we focus on exploring Cachon and Olivares’s production flexibility because it highlights that a manufacturing company can produce smaller batches and switch production more easily between models. Consequently, this company can track sales more closely by providing customers with needed service and products.
Previous studies have shown the benefits of flexible production. Cachon and Olivares [42] demonstrated that greater production flexibility is associated with fewer days of supplies and reduced lead time. Another advantage of production flexibility was reported by Moreno and Terwiesch [43], who found that mixed flexibility can reduce the size of discounts in the automobile industry, and more profits can be obtained. Since production flexibility allows a firm to quickly alter the levels of production and frequently develop new products and, thus, save unnecessary cost and satisfy customers’ needs, we propose the following argument:
H2. 
Having more flexible production lines can improve firms’ financial performance.

2.2.2. Efficiency and Financial Performance

Firms are required to produce at a cost lower than their competitors by means of cost reductions along human resources, raw materials, and logistics. For example, with an advanced configuration system and an elaborate modular architecture, BMW can produce and deliver its customized cars in only twelve days at a competitive cost position [9]. Cost was an important dimension in prior operation management studies [8,24,44] and is used to measure operational efficiency [9,45]. Operational efficiency refers to a firm’s ability for cost and time saving, while cost-based efficiency consists of quality costs, engineering costs, and manufacturing costs, and time-based efficiency is associated with the speed to deliver products [9]. Along with [3,4,36], we pay attention to cost-based efficiency and measure the efficiency of costs to sales in the value creation process.
Since cost-based efficiency gains can translate to reduced costs of producing and manufacturing goods by removing excess material [36], financial benefits are expected to be the main motivation for firms to fulfil their business goals. Stock returns, Tobin’s q, and ROA are all positively associated with cost-based efficiency practices, such as bottleneck removal, quick changeover techniques, and lot size reduction [46]. These findings are supported by Jacobs et al. [47], who showed that more productive firms can experience less cost and more profits, and better performance in a lower bankruptcy risk and larger market value. In addition to the manufacturing industry mentioned above, the transportation industry was another research area in the previous literature [48,49]. For instance, fleet utilization and the fuel efficiency rate were used as cost-based efficiency measures and replace the roles of costs and waste in the manufacturing industry [48]. As reducing unnecessary costs aims to provide goods and services with minimum waste and maximum utilization of resources, we propose the following hypothesis:
H3. 
Having less costs in manufacturing can improve firms’ financial performance.

2.2.3. Delivery and Financial Performance

As noted in the discussion related to H2, a stream of research indicates that delivering products to customers is the ultimate value that generates revenue for firms [25]. For example, a famous Chinese mobile phone company, Xiaomi, is widely criticized for its products’ long time for delivery (always takes several months). In addition to responding to market demands and adapting to customized requirements [24], operational delivery requires firms to deliver orders in a specified time or faster than their competitors [8]. Indicators, such as the lead time [44,50,51,52], on-time delivery rate [25,44,51] and after service [51], are widely used to measure operational delivery. For instance, the lead time is defined as the time that elapses between the receipt of a customer’s order and the delivery of the goods [52]. A higher on-time delivery rate shows that fewer delays occur in both receiving the customer’s order and delivering the completed orders to the customers [44]. In this study, we use lead time to measure firms’ delivery ability and adopt Rumyantsev and Netessine’s proxy definition of lead time: the average number of days of account payable outstanding. By using this variable, we can overcome the shortcoming of the unpublicized information of lead time [10].
The less lead time and quicker delivery speed have positive effects in reducing customer complaints and improving customer relations; thus, the sales volume and profitability are enhanced [53]. Yeung’s [53] financial indicators (sales volume and profitability) were adopted in the work conducted by Ou et al. [54], who showed that decreasing the delivering costs and serving costs can create a larger market share and strengthen the reliability of products for customers. Additionally, the lead time and on-time delivery rate are beneficial to the return on investment and profit margin on sales [55]. As demonstrated by the above literature, we propose that a positive relationship exists between less lead time and financial performance:
H4. 
Having less lead time in delivery can improve firms’ financial performance.

2.2.4. Inventory and Financial Performance

The quick delivery of products and implementation of some quality management philosophy, such as lean production, can result in a higher inventory turnover and low inventory levels [25]. According to a Standard & Poor’s survey, merchandise inventories are a firm’s most important asset and account for 57% of total assets in a number of US public-listed retailers [56]. As firms with higher inventories may experience 4.5% decline in stock return [57], they are concerned with the optimal ways and policies to manage inventories given the dynamic environment [10]. Some inventory indicators have been proposed to measure the inventory ability. For example, inventory turnover shows how many times a year the average inventory of firms’ changeovers is sold [50], and higher inventory turnover indicates that the ability of a firm to translate inventory to revenue is remarkable. Additionally, piling up goods could lead to higher holding cost and damage cost, and these costs have been emphasized in various inventory models, such as the Economic Order Quantity policy model. In our paper, inventory turnover is measured by how inventory can generate the sales volumes.
As inventory costs may result in disadvantages in efficiency and delivery, financial performance is inevitably damaged, and previous studies focused on the impact of inventory on profits [25,57,58]. For instance, inventory turnover, collaboration with production efficiency, and accuracy of delivery can increase sales and profit [25]. Shou et al. [24] also found a moderate positive relationship in inventory turnover between production flexibility and return on sales. Green et al. [27] showed that decreasing inventory levels can help firms win more market share and sales volumes. Thus, we make the following arguments.
H5. 
Having higher inventory turnover can improve firms’ financial performance.

3. Methodology

3.1. Data Collection

Firms from manufacturing industries were used in our research. Our data interval was limited to between 2010 and 2018, and we used keywords, including “national quality awards” and “government quality awards”, to systematically search public documents, such as company websites, media reports, and government notifications. Individual firms may have won quality awards in separate years or a firm may win different types of quality awards. To eliminate the accumulated effect of quality awards, we focused on firms that won quality awards only once. After compiling data from Wind (a financial database in China), 62 listed manufacturing firms that had a complete data set over a nine-year period were used for the data analysis. Table 1 shows the details of our sample. Panel A of Table 1 presents the number of Chinese quality awards winners in our study by year, and the most frequently occurring winning years were 2011 and 2013. Table 1 Panel B presents the most frequently occurring SIC (Standard Industrial Classification) codes within the sample firms. The sample contained 11 unique two-digits SIC codes and the majority of firms represent manufacturing industries (SIC code from 26 to 39).

3.2. Propensity Score Matching

The performance of quality-awarded firms and non-quality-awarded firms was compared to show whether quality awards had a positive effect. In this paper, we defined quality-awarded firms as the treatment group and non-quality-awarded firms as the control group. However, selection bias may have occurred in our samples. For example, firms that have more total assets and more employees may have more chances to be awarded. As the selection of our observations was not random, the common support assumption may be violated when making causal inferences. To reduce the influence of the firms’ traits on the effects on financial performance, propensity score matching (PSM) was adopted to reduce selection bias to 0 after obtaining appropriate samples [59]. PSM has been widely used to match observations in the control group with those in the treatment group. For each observation, a propensity score was calculated and used according to matching rules, such as nearest neighborhood matching or Mahalanobis matching. Each quality-awarded firm was matched to a firm that did not receive any quality-related award during the 2010-2018 period. Only untreated firms that were matched to particular treated firms were retained for the estimation of the impact of quality awards on firms’ financial performance.
A logit model was used to estimate the probability that a particular firm was assigned to the treatment group with a set of covariate variables. These covariate variables were firm-related features capturing the firms’ baseline properties. Following the research reported by Zhu and Lin [60], the logit model was as follows:
P X   =   PR award it   =   1 | X   =   F size it - 1 , age it - 1 , ROA it - 1 , liquidity it - 1 , leverage it - 1 , assetturnover it - 1 , employee it - 1
where F is the cumulative distribution, and award it represents a dummy variable that equals 1 if firm i won a quality award in year t . A few firm characteristic variables were considered regressors that affected the probability of winning an award. Since the effect of quality awards may not appear immediately after the firms become certified, the previous literature suggests that the covariate variables should be lagged for one or two periods [60,61,62]. In this study, all variables were lagged for one period. The predicting variables included firm size (measured by the logarithm of the total assets), firm age, ROA (return of assets), liquidity ratio, leverage (measured by the ratio of debt to assets), and asset turnover (measured by the ratio of sales to the total assets).
The probability that a firm won a quality award was defined as the propensity score. We could use all firms’ propensity scores to match awarded firms and non-awarded firms in two different matching methods. For nearest neighborhood matching, each awarded firm was matched with only one non-awarded firm. This non-awarded firm had the nearest propensity score to its awarded firm. For Mahalanobis matching, the awarded firm was matched with a non-awarded firm that had the nearest Mahalanobis distance. After the above matching methods, each awarded firm was successfully matched with a non-awarded firm, and thus the selection bias was reduced. Using these matched samples, we could adopt the difference-in-difference approach to explore the effects of quality award on financial performance.

3.3. Difference-in-Difference Approach

The DID (difference-in-difference) approach could be used to show the impact of quality awards on firms’ financial performance. Following Wan et al. [63], the following panel regression model was estimated:
R it   =   β 0 + β 1 award ft + β 2 firmsize ft + β 3 liquidity   ratio ft + β 4 leverage ft + β 5 assetturnover ft + β 6 employee ft + β 7 age ft + year t + firm f + ε ft
where R i t indicates the ROA of firm i in year t , a w a r d f t measures the effect of quality awards on the ROA. Hence, a w a r d f t equalled 1 only if a firm received the award in year t and years after t . Thus, the coefficient β 1 of a w a r d f t was the interaction term between treatment and time, and demonstrating the effect of quality awards on ROA. In addition, variables that may confound the award effect were included in our model. Firm size (FS), which was measured by the logarithm of the total assets, was controlled because large firms might have more sufficient resources to win quality awards. The liquidity ratio (LR) measured the speed of liquidating firms’ money in operation management as some outstanding firms could have adequate reserves to address potential risks [12]. The firms’ leverage was controlled because firms with more leverage are less likely to engage in new management practices [13]. Additionally, debt rules may decrease firms’ motivation to adopt new initiatives. In this paper, we used the ratio of debt to assets (DA) to measure firms’ leverage. Asset turnovers (AT) enable firms to understand the speed of assets from input to output, demonstrating the utilization of assets. It has been suggested that firms benefit in efficiency by a higher fixed asset turnover ratio [36]. Firms’ labor intensity was also controlled by using the number of employees [34,35]. Age was measured by the number of years since a firm was founded. Firm age could be a significant factor helping firms win a quality award, since old firms may obtain a reputation and make a good impression on referees and customers [60].
The DiD method emphasizes the effects of a special policy (quality award in this study) and it can effectively detect these effects by introducing the interaction term between time and policy. The interaction term a w a r d f t is the core of the DiD approach and if the coefficient of a w a r d f t is positive and significant, we can conjecture that the quality awards have positive impact on ROA.

3.4. Hierarchical Regression Analysis

Our hypotheses focus on the relationship between operational performance and financial performance. Because our panel dataset consisted of 532 firm-year observations, a panel regression was suitable for our main analysis. An LSDV (Least Square Dummy Variable) model was adopted to test whether we should use a pooled panel regression or fixed/random effect panel regression. The coefficient of the dummy variable for numerous firms was significant, suggesting that a pooled regression model was not acceptable for our research. Therefore, the analysis was conducted by using a panel regression model, since a fixed effect panel regression model can reduce the influence of the endogeneity problem and capture the time-in-variant unobserved firm characteristics. A fixed effect regression model was used in this section. To detect the impact of each dimension of operational performance, we adopted hierarchical regression analysis, which included the indicators and their interaction terms with quality awards. This method could verify whether ROA can be affected by these dimensions and whether they can moderate the relationship between quality awards and ROA.
The indicators of the above operational dimensions were considered in this study: lead time (LT), cost efficiency (CE), inventory turnover (IT), and production flexibility (PF). The average number of days of accounts payable was used to estimate the lead time. The average number of days of accounts payable was measured as the ratio of accounts payable to the cost of goods sales. This variable illustrated the speed from investment to outputs. A higher value in this index indicated that firms need more time to deliver required products. In addition, following the prior literature concerning operational efficiency [4,36], manufacturing cost efficiency, which was calculated by the ratio of the costs of goods to the total sales, was adopted in our paper. A higher ratio value indicated that firms may increase their sales but at the expense of considerable expenses. Regarding inventory management, inventory turnover was calculated by the ratio of the average cost of goods to inventory [31,58,64]. Inventory turnover elucidated the capability of transforming inventory into cash. Production flexibility could not be directly measured, and survey data are widely used in numerous studies [40]. Following the formula proposed by Cachon and Olivares [42], production flexibility was measured as follows:
OF it   =   | I it - I it - 1 | S it
where I i t and S i t are the inventory and sales of firm i in year t , respectively. A higher O F i t value suggests that production and sales had a larger mismatch. The more quickly a firm can switch its production line, the more closely it can track the market preference.
In addition to the control variables proposed in the DiD section (e.g., asset turnover), other financial variables were included in the regression model. We divided the firms’ cost (input) into financial cost (FC), management cost (MC), and sales cost (SC). In addition, the profits and work-in-construction (WIC) were believed to be enhanced after the quality certification or award [3,34]. The cost- and income-related variables investigated how firms balance their expenses and benefits. Finally, the influence of R&D (Research & Development) on firms’ ROA was considered. Prior researchers have revealed the positive effect of innovation on financial performance [65]. A variable named R&D estimated by R&D expenditure was used.

4. Results

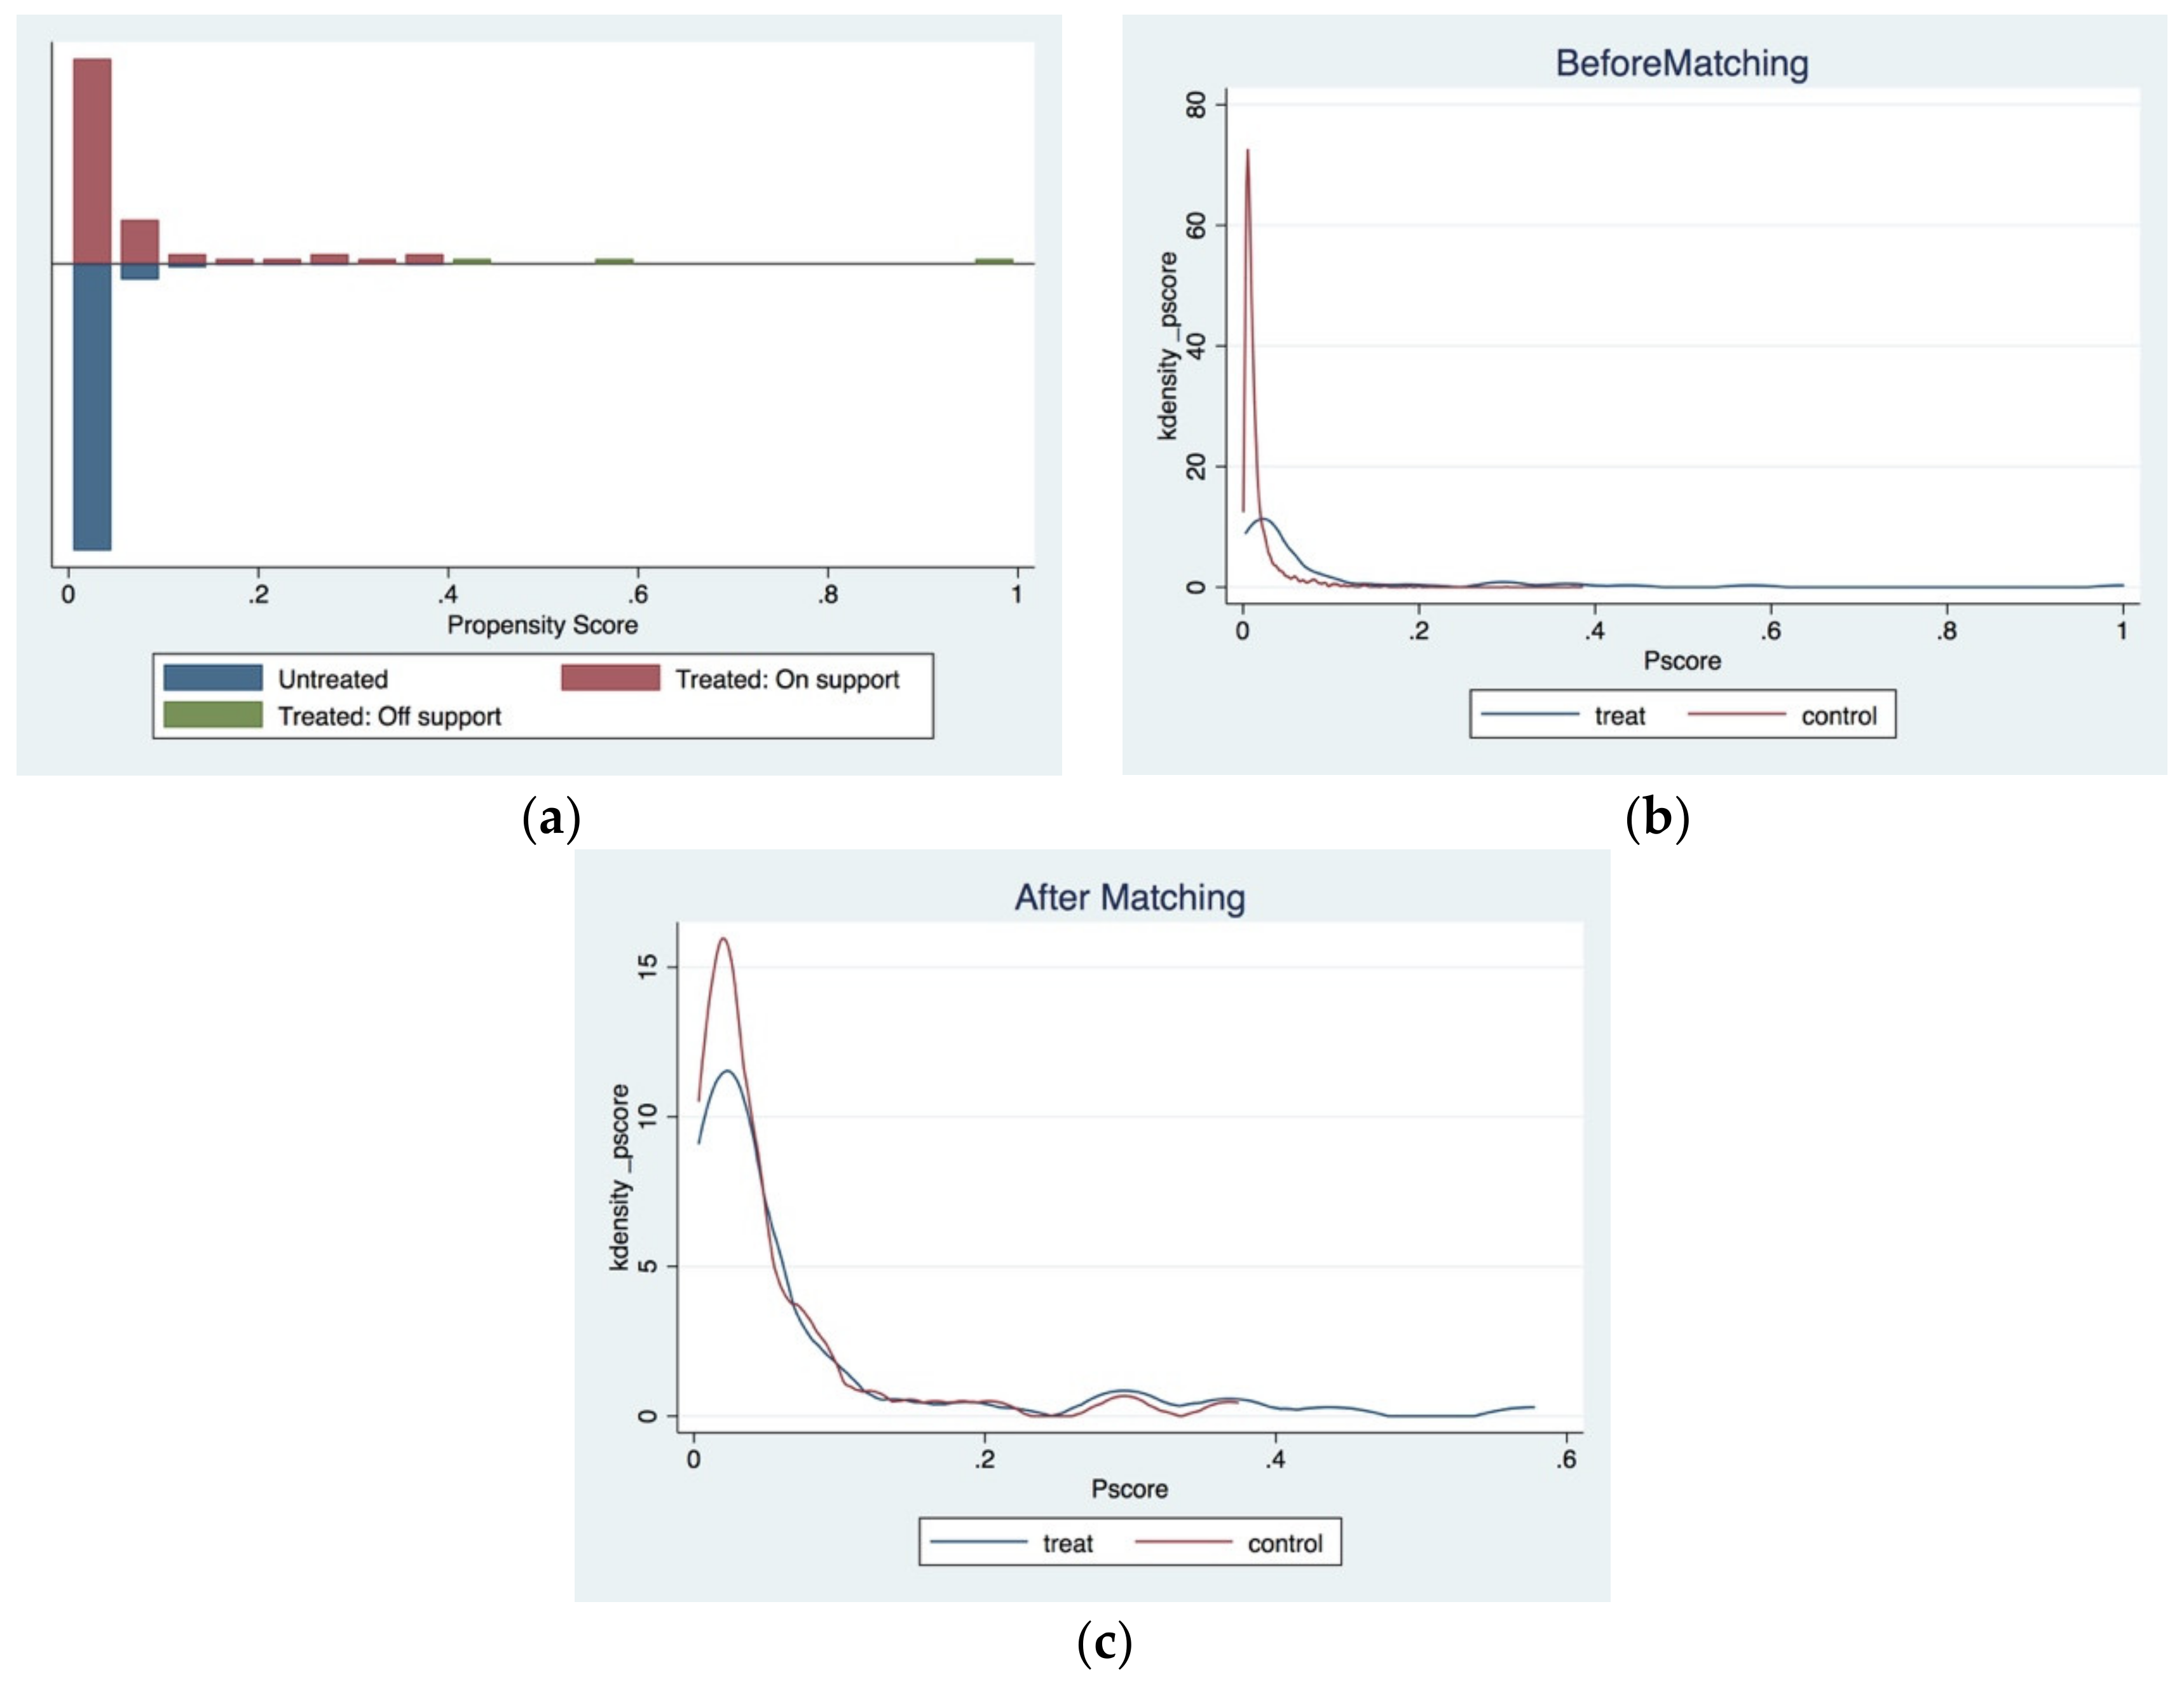
4.1. Propensity Score and Data Balance

The estimations from the logit model, which was used to calculate the propensity scores, are presented in Table 2. The probability of being in the treatment group was significantly associated with a variety of variables. Interestingly, a larger total asset could not ensure that a firm has more probability of being certified (p > 0.1). This finding indicates that firms with a larger size may be less likely to implement quality management practices. Large firms may not be motivated to participate in some awards, as they have already built their images. Firms with a higher ROA had a high likelihood to win quality awards. Additionally, a higher liquidity ratio and debt-to-asset ratio were beneficial for firms in becoming certified. Firms that had more employees and longer years were predicted to have a greater chance to win quality awards.
Based on the results of the propensity score matching, a counterfactual group was created. The groups of awarded and non-awarded firms were formed using the following two different matching algorithms: nearest neighborhood matching and Mahalanobis matching. After adopting these two matching methods, the sample size was reduced from 3476 to 120 (nearest neighborhood matching) and 126 (Mahalanobis matching). The quality of the matching results was evaluated in two ways. First, as Table 3 displays, the data balance tests demonstrated that the treatment group and control group did not significantly differ in the variable means.
Second, we tested whether the common support condition was satisfied. The common support condition required the treatment firms and control firms to have a similar propensity score scope. In Figure 1, Panel (a), the histogram shows that both the treatment firms and control firms had nearly the same distribution. Panel (b) shows that the control firms had a much lower propensity score (heavily skewed towards zero) before matching. Although the treated firms may have larger propensity scores, the propensity score distribution had reasonably good common support after matching in Panel (c).

4.2. D-in-D Estimate after Matching

In the prior steps, the awarded firms were matched with non-awarded firms, since the means of their variables did not exhibit significant differences. However, the prior steps did not rule out the possibility that the treatment group may have had better performance than the control group before the treatment. The awarded firms could have less production waste, a reasonable production plan, or effective advertisements, which can endow firms with a dominating financial advantage. In this case, financial improvement cannot be attributed to quality management practices. The treated firms and controlled firms may not be at the same level when the certificates are given.
To solve this problem, the treated firms should have a common trend with the controlled firms before the DiD (difference-in-difference) regression. We built a year dummy, which was an interaction term between award and year. Table 4 presents the Difference-in-Difference regression results (ROA was the dependent variable) based on nearest neighborhood matching and Mahalanobis matching. To verify the common trend condition, we considered interaction terms, such as b e f o r e 1 and c u r r e n t . The third and sixth columns in Table 4 report the results under this condition. All coefficients of these two matching methods demonstrated that the awarded firms and non-awarded firms had no significant differences before the treatment. The D-in-D model was appropriate for the following analysis.
In the OLS (Ordinary Least Square) regression, quality awards decreased the return on assets by −0.007 (p < 0.1). However, this coefficient was biased, since OLS ignores the effect of time-invariant unobservable factors. As shown in the fourth and seventh columns in Table 4, the coefficients of award were insignificant by both matching strategies. Furthermore, the following control variables were more crucial: liquidity ratio (p < 0.01 for Mahalanobis matching), debt-to-asset ratio (p < 0.01), and asset turnover (p < 0.01). Interestingly, the firm scale in terms of a larger firm size and a higher number of employees could not explicitly increase the ROA.
These results suggest that quality certificates and awards may not have the expected influence on the improvement in firms’ financial performance. In some cases, these awards may have a negative effect on the ROA (Table 4, column 5). The beneficial effects of quality management systems on immediate returns were not obvious in other studies [5]. Therefore, our findings contradict the former assumption that quality management practices can enhance firms’ profitability. H1 was not supported. However, lowering the liquidity ratio and debt-to-asset ratio could allow firms to make greater progress.

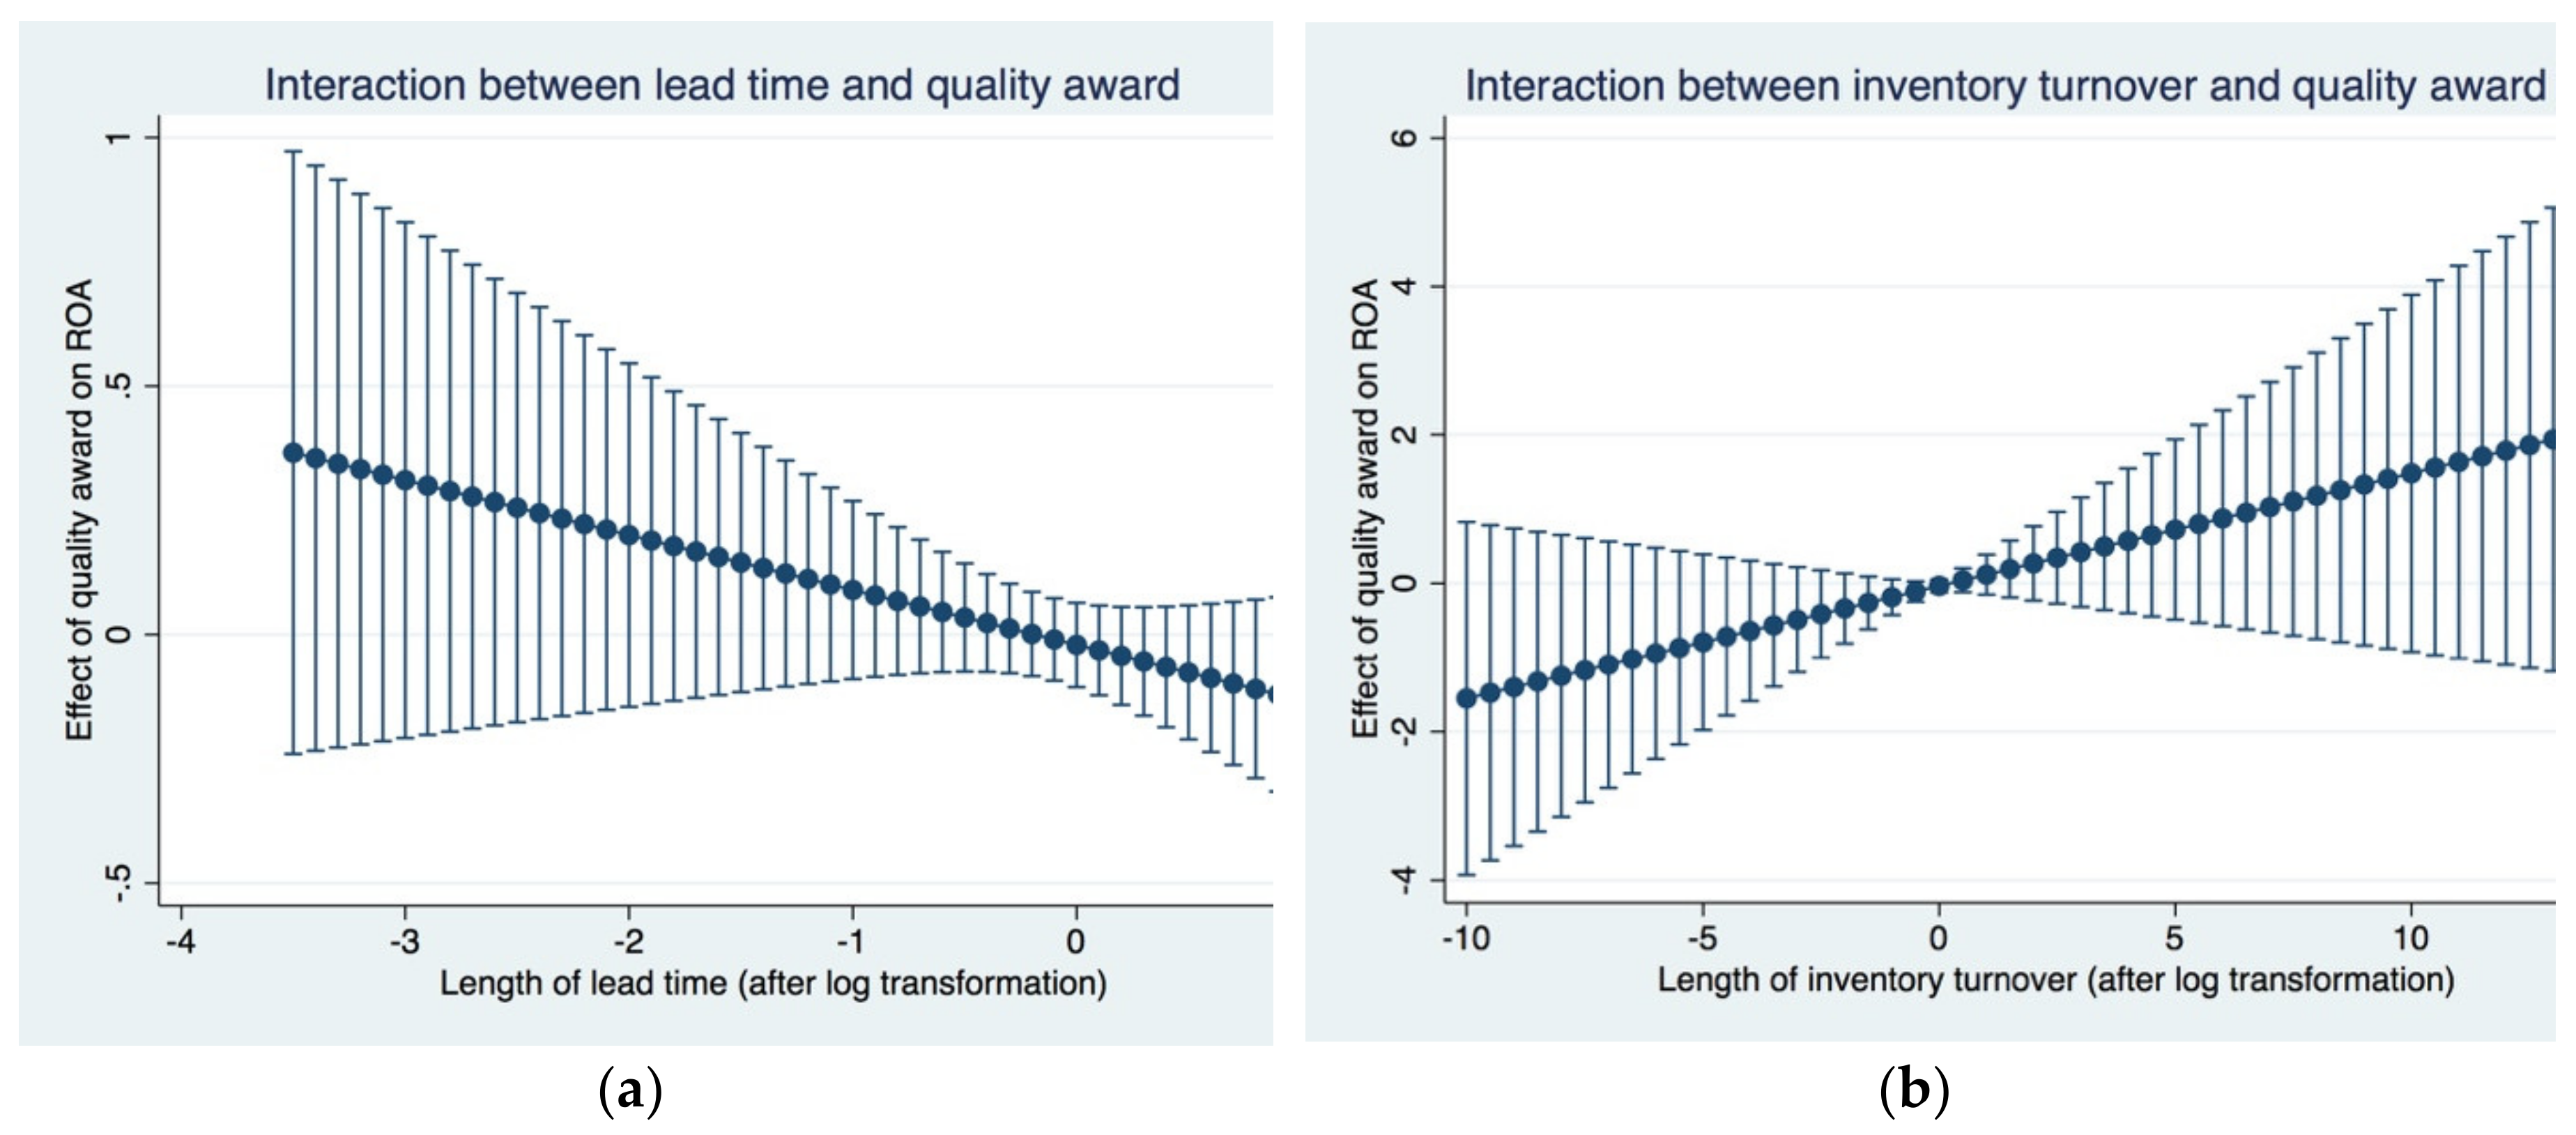
4.3. Analysis of the Effect of Operational Performance

A hierarchical regression analysis was applied to test H2–H5. These hypotheses stated that firms with outstanding operational performance would experience supreme financial performance. Because of some relatively high correlations among the variables, we conducted a variation inflation factor (VIF) analysis. The results showed that all VIFs were less than 4.23, suggesting that multicollinearity should not be a concern in our regression analysis. Additionally, we centralized all variables to reduce the effect of multicollinearity.
The Hausman test was performed to determine whether we should use fixed-effects or random-effects panel regression models. The Hausman test showed highly significant statistics (χ2 = 89.85, p-value < 0.001), rejecting the hypothesis that a random-effects model was appropriate for our analysis. Thus, a fixed-effects panel hierarchical regression was adopted in the following analysis. We also performed OLS as a robustness check, and the results were similar to our fixed effect regression results.
Table 5 reports the results of the fixed-effect regression analysis. All F-statistics of the models were significant (p < 0.01). Model 1 was a base model that included only the control variables. Model 2 added award (same in Table 4) as an independent variable. The coefficient value for quality award was −0.0239 in the model. We also found a consistently negative coefficient of quality award across all the models in the table. Thus, these findings show that H1 was not supported.
Model 3 revealed the significant effect of production flexibility on financial performance. The coefficient was negative (−0.0150) and significant at the 0.1 level. Thus, H2 was supported. We also added the interaction term between production flexibility (Model 4) and quality award and no significant effect of this interaction term was found. Model 5 indicated that cost efficiency can significantly affect firms’ financial performance (coefficient = −0.8924, p < 0.05). The results suggest that firms with less cost in production and sales can achieve larger benefits. Hence, H3 was supported. Similarly, we found no moderate effect of cost efficiency on the impact of quality award on financial performance (Model 6).
Model 7 added the lead time as an independent variable. The coefficient value of lead time was significantly negative in the model (coefficient = −0.2269, p < 0.01), suggesting that the speed of delivery can contribute to financial success. Thus, H4 was supported. Our findings highlight that a lower lead time can provide firms with a larger ROA. Model 8 showed a significantly negative coefficient for the interaction between quality award and lead time (coefficient = −0.1724, p < 0.1). The results suggest that decreasing lead time can minimize negative effects of quality award upon ROA.
In H5, our hypothesis stated that higher inventory turnover can contribute to improvements in financial performance. Inventory turnover appeared to be positive related to ROA (coefficient = 0.2570, p < 0.01). Our results show that firms can obtain more benefits by moving their goods effectively. Hence, H5 was supported. We also found a significantly positive coefficient for the interaction term between quality award and inventory turnover (coefficient = 0.1517, p < 0.1). To illustrate the interaction effects, we also drew interaction effects graphs, in Figure 2. In Figure 2, Panel (a), we can see the negative slope line, which suggests that decreasing the lead time can positively enhance the effects of quality award on ROA. On the contrary, the positive slope line found in Figure 2, Panel (b) shows that larger inventory turnover can minimize the negative effects of quality awards on ROA.

5. Discussion and Implications

5.1. Discussion

This research aimed to examine whether firms’ financial performance can be enhanced by quality management certifications and operational performance. We found that indicators of flexibility, efficiency, delivery, and inventory can significantly improve financial performance in terms of ROA. However, our findings regarding the relationship between quality management certifications and financial performance were not consistent with those found by other researchers [3,4]. Firms experienced no improvement in ROA after winning quality awards. The results showed that operational performance had more positive impacts on firms’ profitability.
Inconsistent with H1, which stated that firms with excellent quality management practices experienced superior financial performance, our findings indicated that quality awards had no positive impact on profitability in terms of ROA. Furthermore, quality awards can even have negative effects (Column 4 and 7, Table 4). These findings contradict the prior literature suggesting that quality management practices and certifications significantly improved business performance [4,5,16]. We provide three possible explanations for these counterintuitive results. First, as noted by Zhang and Xia [3], quality has become a routinized customer expectation and a necessary condition for success. This view is supported by booming ISO certificates worldwide [66]. The vast and pervasive implementation of quality management practices may result in performance benefits, but at a decreasing rate [3]. As shown by Karapetrovic et al. [30], although customer satisfaction and financial results were improved after the adoption of ISO 9000, this positive effect diminished quickly over time.
Second, companies may implement quality management practices at only a superficial level [11]. Managers pursue certifications as much as possible but ignore the effectiveness of core practices in quality management. For example, many Chinese manufacturing firms are under high institutional pressure to adopt various quality management standards but may obtain only the symbolic value of certifications with a utilitarian color [31]. Toyota, which proposed JIT and earned many quality awards, experienced massive global recalls of more than 10 million vehicles due to defects in braking and heating systems [7].
Third, the side effects of quality management practices should not be ignored. One disadvantage of quality management is that companies may suffer high costs from winning quality certifications. For example, the ISO 9001 standards require detailed documentation of production processes, and maintaining this certification costs substantial resources. Nearly 60,000 firms purposely lose ISO 9001 certifications each year to save the registration and implementation costs [18]. From this perspective, firms may not obtain the expected financial benefits if their revenue cannot offset the influence of the cost of quality certification.
One of the main goals of this research was to predict whether production flexibility had a positive impact on firms’ profit (H2). It appears that less sales mismatch may result in better profit returns. Our results are supported by Cachon and Olivares [42], who found that flexible production could yield a lower optimal level of safety stock, thus saving inventory cost. The positive impact of flexibility on inventory was also shown by Rho et al. [67], who demonstrated that firms with a wider product range and greater lot size flexibility had higher inventory turnover.
The results of H3 indicate that a lower manufacturing cost can lead to significant improvement in ROA. Our results corroborate the results reported by Maiga et al. [68], who showed that cost reductions can be associated with greater development of economic scales, thus increasing profits and capturing more value-added products. The findings in our research are also consistent with Modi and Mishra [46] and Jayaram and Xu [45], who demonstrated that lower inventory level costs and less waste in production contributed to improvement in customer satisfaction, stock return, and profits.
The findings of H4 suggest that firms with less lead time (i.e., ratio of accounts payable to the cost of goods sales) experience a higher ROA. The coefficients of lead time were negative −0.2269 (Table 5, Model 7). These results suggest that customer responsiveness generates better market share and financial performance by shorter order-to-delivery time and faster customer response time [26]. These findings are also aligned with Droge et al. [69], who showed that time-to-product and responsiveness benefit ROA and ROS by minimizing the delivery speed and providing customer service.
The results of H5 highlight that operational inventory leads to a significant increase in financial performance in terms of ROA. The results show that inventory turnover increased the ROA. Our findings confirm Gaur et al. [58], who showed that annual inventory turnover, which was enhanced by information technology and logistics management, could create higher sales. In addition to inventory turnover, Chen et al. [57] used work-in-process inventory and finished goods inventory to represent firms’ inventory level. These authors demonstrated that higher inventory could decrease Tobin’s q, thus decreasing the stock returns.
Scholars have called for more research to offer a deeper and broader discussion on the impact of quality management practices on financial performance [21]. First, we adopted the PSM-DID model to explore the effect of Chinese quality awards on firms’ ROA. To the best of our knowledge, it is among the first attempts to use this methodology in the quality management realm. In particular, PSM-DID can eliminate the endogenous problems in casual inference and show the quantitative effect of quality certifications on financial performance. Second, we provide new evidence regarding the effects of operational performance on financial performance. Less lead time, higher inventory turnover, more flexible production and less manufacturing costs can positively increase firms’ ROA. Third, the moderation role of lead time and inventory turnover on the impacts of quality awards were found in our study. These findings have not been observed in previous studies. In future studies, researchers may focus on how policies (e.g., TQM) can be effectively implemented through operational performance to create more business benefits. Fourth, our study showed that firms should consider the importance of financial performance when pursing quality management certifications. Traditional quality notions such as quality assurance or product reliability are not sufficient to bring business benefits. These findings contribute to firms’ sustainable development.

5.2. Implications

This study offers some theoretical implications. The findings of our paper enrich the quality management literature by providing evidence suggesting that quality management awards cannot fully assure that their winners had a better ROA. Although many studies have assessed the effects of quality management practices on firm performance, including profits and sales improvement [34], the effects of quality awards and how ROA is influenced by operational performance are still not fully understood. In addition, we set the research context as China, which was the second-largest economy in 2018. Cases from such developing countries could verify whether findings from developed countries are consistent worldwide.
Additionally, the positive effects of quality management systems were not shown to be significant in our study. However, we did not aim to undermine the importance of quality management. In contrast, the process of the implementation of quality management should be more highly emphasized for practitioners. For example, a study by Sadikoglu and Olcay [70] showed that lacking proper employment training or commitment from top management could significantly hinder new idea generation and innovation performance. Quality management practices should be not only established but also implemented effectively. This argument is supported by Chatzoglou et al. [71], who found that quality management practices can act as a catalyst but are not a panacea that automatically helps companies achieve high performance.
In addition, our study overcame the traditional research limitation of combining operational performance dimensions, such as delivery or flexibility, into one construct [25,45,52]. Instead, we divided operational performance into four operational dimensions. The coefficients in each regression model provided a single effect of each operational dimension on ROA. Our research method gave another measurement to examine the impact of operational performance on financial performance.
Regarding the managerial implication, operational performance was shown to have positive impacts on firms’ financial performance. From this view, we suggest that managers should consider how to translate the practices of quality management into superior operational performance. This idea has also been demonstrated by Cristina and Gramani [72]. These authors used a two-stage Data Envelopment Analysis model to divide operational and financial performance, which had always been mixed in previous studies, into two separated parts. Specifically, operational efficiency played a mediating role between aircraft resources and flight income. Another example was derived from Liu et al. [73], who found that efficiencies from human resource management to skilled labor significantly varied across several industries. Rules and standards from quality handbooks appear to not solve all practical problems at operational levels.

5.3. Limitations

One drawback in our research was that we only used one proxy variable to measure operational performance (e.g., inventory turnover to measure operational inventory). In a cross-sectional study, authors could propose several questions to examine the effect of a construct. For example, Patel et al. [38] measured manufacturing flexibility by using seven flexibility-related items. The measurement of indicators could be biased due to the incomplete selection of variables, thus making the results inaccurate. Practical product data were not available since we only had financial data from a third-party database. Such complications in selecting variables to represent operational performance have been experienced in previous studies using a similar approach [10,31,42,58]. For example, two operating variables, i.e., inventory days and account receivable days, were sufficient to measure operational efficiency [31]. It appeared that the proxy variables in our study could fully describe the four operational dimensions, as we adopted the same measures from the prior literature.
Another problem is that we only used 62 quality awarded firms in our study. In contrast, the numbers of awarded firms in Boulter et al. [4] and Zhang and Xia [3] were 133 and 501, respectively. There were two reasons for the relatively fewer samples in our study. First, the Chinese Quality Award was established in 2001, and only five to six firms are awarded each year. The history of the Chinese Quality Award is not as long as that of the Baldrige Quality Award or European Foundation for Quality Management Award. Second, public-listed firms awarded with national-level or province-level awards were selected in our research. We considered that high level quality awards can demonstrate that their winners are more capable of implementing quality management practices. Furthermore, Lin and Su [74] focused on only 13 firms to explore the effects of the Taiwan Quality Award on firms’ stock performance. We conjecture that the sample size was not a serious problem in our study.

6. Conclusions

We examined the effects of quality management practices on firms’ financial performance. The results showed that quality awards could not assure that their winners had superior performance in ROA. The four operating dimensions of operational performance, i.e., flexibility, delivery, cost, and inventory, were positively associated with financial performance in terms of ROA. Our results suggest that firms should pay attention to the financial performance as well as quality management practices for better sustainable progress. These findings could be important for firms in the e-commerce, transportation, and logistics industries. We suggest that managers should emphasize more operational levels rather than simply acquire external certifications. Future works may re-examine our findings by exploiting data from other countries or using quality management certifications, such as ISO 9001, as research samples.

Author Contributions

Conceptualization, H.L., S.W., C.Z. and Y.L.; Formal analysis, S.W.; Methodology, H.L. and C.Z.; Software, H.L.; Supervision, C.Z.; Validation, H.L.; Writing—original draft, H.L.; Writing—review and editing, S.W., C.Z. and Y.L. All authors have read the paper and agreed to publish this version of manuscript.

Funding

This research received no external funding

Conflicts of Interest

The authors declare no conflict of interest.

References

  1. Esgarrancho, S.; Cândido, C. Firm preparation for iso 9001 certification–the case of the hotel industry in portugal. Total Qual Manag Bus. 2017, 31, 1–20. [Google Scholar] [CrossRef]
  2. Waxin, M.-F.; Knuteson, S.; Bartholomew, A. Outcomes and Key Factors of Success for ISO 14001 Certification: Evidence from an Emerging Arab Gulf Country. Sustainability 2019, 12, 258. [Google Scholar] [CrossRef] [Green Version]
  3. Zhang, G.P.; Xia, Y. Does Quality Still Pay? A Reexamination of the Relationship Between Effective Quality Management and Firm Performance. Prod. Oper. Manag. 2012, 22, 120–136. [Google Scholar] [CrossRef]
  4. Boulter, L.; Bendell, T.; Dahlgaard, J. Total quality beyond North America. Int. J. Oper. Prod. Manag. 2013, 33, 197–215. [Google Scholar] [CrossRef]
  5. Sabella, A.; Kashou, R.; Omran, O. Quality management practices and their relationship to organizational performance. Int. J. Oper. Prod. Manag. 2014, 34, 1487–1505. [Google Scholar] [CrossRef]
  6. Akgün, A.E.; Ince, H.; Imamoglu, S.Z.; Keskin, H.; Kocoglu, I. The mediator role of learning capability and business innovativeness between total quality management and financial performance. Int. J. Prod. Res. 2013, 52, 888–901. [Google Scholar]
  7. Zeng, J.; Phan, C.A.; Matsui, Y. The impact of hard and soft quality management on quality and innovation performance: An empirical study. Int. J. Prod. Econ. 2015, 162, 216–226. [Google Scholar] [CrossRef]
  8. Chavez, R.; Yu, W.; Gimenez, C.; Fynes, B.; Wiengarten, F. Customer integration and operational performance: The mediating role of information quality. Decis. Support Syst. 2015, 80, 83–95. [Google Scholar] [CrossRef]
  9. Kortmann, S.; Gelhard, C.; Zimmermann, C.; Piller, F.T. Linking strategic flexibility and operational efficiency: The mediating role of ambidextrous operational capabilities. J. Oper. Manag. 2014, 32, 475–490. [Google Scholar] [CrossRef]
  10. Rumyantsev, S.; Netessine, S. What Can Be Learned from Classical Inventory Models? A Cross-Industry Exploratory Investigation. Manuf. Serv. Oper. Manag. 2007, 9, 409–429. [Google Scholar] [CrossRef] [Green Version]
  11. Martinezcosta, M.; Choi, T.Y.; Martinez, J.A.; Martinezlorente, A.R. Iso 9000/1994, iso 9001/2000 and tqm: The performance debate revisited. J. Oper. Manage. 2009, 27, 495–511. [Google Scholar] [CrossRef] [Green Version]
  12. Chung, Y.-C.; Tien, S.-W.; Hsieh, C.-H.; Tsai, C.-H. A study of the business value of Total Quality Management. Total. Qual. Manag. Bus. Excel. 2008, 19, 367–379. [Google Scholar] [CrossRef]
  13. Duh, R.-R.; Hsu, A.W.-H.; Huang, P.-W. Determinants and performance effect of TQM practices: An integrated model approach. Total. Qual. Manag. Bus. Excel. 2012, 23, 689–701. [Google Scholar] [CrossRef]
  14. García-Alcaraz, J.L.; Flor-Montalvo, F.; Avelar-Sosa, L.; Sánchez-Ramírez, C.; Jimenez-Macias, E. Human Resource Abilities and Skills in TQM for Sustainable Enterprises. Sustainability 2019, 11, 6488. [Google Scholar] [CrossRef] [Green Version]
  15. Oliveira, G.S.; Corrêa, J.; Balestrassi, P.; Martins, R.; Turrioni, J.B. Investigation of TQM implementation: empirical study in Brazilian ISO 9001-registered SMEs. Total. Qual. Manag. Bus. Excel. 2017, 30, 641–659. [Google Scholar] [CrossRef]
  16. Parvadavardini, S.; Vivek, N.; Devadasan, S. Impact of quality management practices on quality performance and financial performance: evidence from Indian manufacturing companies. Total. Qual. Manag. Bus. Excel. 2015, 27, 507–530. [Google Scholar] [CrossRef]
  17. Iqbal, A.; Asrar-Ul-Haq, M. Establishing relationship between TQM practices and employee performance: The mediating role of change readiness. Int. J. Prod. Econ. 2018, 203, 62–68. [Google Scholar] [CrossRef]
  18. Candido, C.; Coelho, L.; Peixinho, R. Why firms lose their ISO 9001 certification: Evidence from Portugal. Total. Qual. Manag. Bus. Excel. 2019, 1–20. [Google Scholar] [CrossRef]
  19. Gray, J.; Anand, G.; Roth, A.V. The Influence of ISO 9000 Certification on Process Compliance. Prod. Oper. Manag. 2014, 24, 369–382. [Google Scholar] [CrossRef]
  20. Kober, R.; Subraamanniam, T.; Watson, J. The impact of total quality management adoption on small and medium enterprises’ financial performance. Account. Finance 2011, 52, 421–438. [Google Scholar] [CrossRef]
  21. Baird, K.; Hu, K.J.; Reeve, R. The relationships between organizational culture, total quality management practices and operational performance. Int. J. Oper. Prod. Manag. 2011, 31, 789–814. [Google Scholar] [CrossRef]
  22. Lau, A.K.W.; Lee, S.H.; Jung, S. The Role of the Institutional Environment in the Relationship between CSR and Operational Performance: An Empirical Study in Korean Manufacturing Industries. Sustainability 2018, 10, 834. [Google Scholar] [CrossRef] [Green Version]
  23. Santos, H.; Lannelongue, G.; Gonzalez-Benito, J. Integrating Green Practices into Operational Performance: Evidence from Brazilian Manufacturers. Sustainability 2019, 11, 2956. [Google Scholar] [CrossRef] [Green Version]
  24. Shou, Y.; Hu, W.; Kang, M.; Li, Y.; Park, Y.W. Risk management and firm performance: the moderating role of supplier integration. Ind. Manag. Data Syst. 2018, 118, 1327–1344. [Google Scholar] [CrossRef]
  25. Prajogo, D.; Toy, J.; Bhattacharya, A.; Oke, A.; Cheng, E. The relationships between information management, process management and operational performance: Internal and external contexts. Int. J. Prod. Econ. 2018, 199, 95–103. [Google Scholar] [CrossRef]
  26. Al-Shboul, M.A.R.; Barber, K.D.; Garza-Reyes, J.A.; Kumar, V.; Abdi, M.R.; Steenhuis, H.-J. The effect of supply chain management practices on supply chain and manufacturing firms’ performance. J. Manuf. Technol. Manag. 2017, 28, 577–609. [Google Scholar] [CrossRef]
  27. Green, K.W.; Zelbst, P.J.; Meacham, J.; Bhadauria, V.S.; Jr, K.W.G. Green supply chain management practices: impact on performance. Supply Chain Manag. Int. J. 2012, 17, 290–305. [Google Scholar] [CrossRef]
  28. Croom, S.; Vidal, N.; Spetic, W.; Marshall, D.; McCarthy, L. Impact of social sustainability orientation and supply chain practices on operational performance. Int. J. Oper. Prod. Manag. 2018, 38, 2344–2366. [Google Scholar] [CrossRef] [Green Version]
  29. O’Neill, P.; Sohal, A.; Teng, C.W. Quality management approaches and their impact on firms׳ financial performance–An Australian study. Int. J. Prod. Econ. 2016, 171, 381–393. [Google Scholar] [CrossRef]
  30. Karapetrovic, S.; Casadesus, M.; Heras-Saizarbitoria, I. What happened to the ISO 9000 lustre? An eight-year study. Total. Qual. Manag. Bus. Excel. 2010, 21, 245–267. [Google Scholar] [CrossRef]
  31. Lo, C.K.Y.; Yeung, A.C.L.; Cheng, E. ISO 9000 and supply chain efficiency: Empirical evidence on inventory and account receivable days. Int. J. Prod. Econ. 2009, 118, 367–374. [Google Scholar] [CrossRef]
  32. Ataseven, C.; Prajogo, D.; Nair, A. ISO 9000 Internalization and Organizational Commitment—Implications for Process Improvement and Operational Performance. IEEE Trans. Eng. Manag. 2013, 61, 5–17. [Google Scholar] [CrossRef]
  33. Cai, S.; Jun, M. A qualitative study of the internalization of ISO 9000 standards: The linkages among firms’ motivations, internalization processes, and performance. Int. J. Prod. Econ. 2018, 196, 248–260. [Google Scholar] [CrossRef]
  34. Swink, M.; Jacobs, B.W. Six Sigma adoption: Operating performance impacts and contextual drivers of success. J. Oper. Manag. 2012, 30, 437–453. [Google Scholar] [CrossRef]
  35. Lo, C.K.Y.; Pagell, M.; Fan, D.; Wiengarten, F.; Yeung, A.C.L. OHSAS 18001 certification and operating performance: The role of complexity and coupling⋆. J. Oper. Manag. 2014, 32, 268–280. [Google Scholar] [CrossRef]
  36. Treacy, R.; Humphreys, P.; McIvor, R.; Lo, C.K.Y. ISO14001 certification and operating performance: A practice-based view. Int. J. Prod. Econ. 2019, 208, 319–328. [Google Scholar] [CrossRef]
  37. Goyal, M.; Netessine, S.; Randall, T. Deployment of Manufacturing Flexibility: An Empirical Analysis of the North American Automotive Industry. SSRN Electron. J. 2012. [Google Scholar] [CrossRef]
  38. Patel, P.C. Role of manufacturing flexibility in managing duality of formalization and environmental uncertainty in emerging firms. J. Oper. Manag. 2010, 29, 143–162. [Google Scholar] [CrossRef]
  39. Patel, P.C.; Terjesen, S.; Li, D. Enhancing effects of manufacturing flexibility through operational absorptive capacity and operational ambidexterity. J. Oper. Manag. 2011, 30, 201–220. [Google Scholar] [CrossRef]
  40. Jin, Y.; Vonderembse, M.; Ragu-Nathan, T.; Smith, J.T. Exploring relationships among IT-enabled sharing capability, supply chain flexibility, and competitive performance. Int. J. Prod. Econ. 2014, 153, 24–34. [Google Scholar] [CrossRef]
  41. Nadkarni, S.; Narayanan, V.K. Strategic schemas, strategic flexibility, and firm performance: The moderating role of industry clockspeed. Strateg. Manag. J. 2007, 28, 243–270. [Google Scholar] [CrossRef]
  42. Cachon, G.P.; Olivares, M. Drivers of Finished-Goods Inventory in the U.S. Automobile Industry. Manag. Sci. 2010, 56, 202–216. [Google Scholar] [CrossRef] [Green Version]
  43. Moreno, A.; Terwiesch, C. Pricing and production flexibility: An empirical analysis of the us automotive industry. Manuf. Serv. Oper. Manag. 2015, 17, 428–444. [Google Scholar] [CrossRef] [Green Version]
  44. Kenyon, G.; Meixell, M.; Westfall, P. Production outsourcing and operational performance: An empirical study using secondary data. Int. J. Prod. Econ. 2016, 171, 336–349. [Google Scholar] [CrossRef]
  45. Jayaram, J.; Xu, K. Determinants of quality and efficiency performance in service operations. Int. J. Oper. Prod. Manag. 2016, 36, 265–285. [Google Scholar] [CrossRef]
  46. Modi, S.B.; Mishra, S. What drives financial performance-resource efficiency or resource slack? J. Oper. Manag. 2011, 29, 254–273. [Google Scholar] [CrossRef]
  47. Jacobs, B.W.; Kraude, R.; Narayanan, S. Operational productivity, corporate social performance, financial performance, and risk in manufacturing firms. Prod. Oper. Manag. 2016, 25, 2065–2085. [Google Scholar] [CrossRef]
  48. Alan, Y.; Lapré, M. Investigating Operational Predictors of Future Financial Distress in the US Airline Industry. Prod. Oper. Manag. 2018, 27, 734–755. [Google Scholar] [CrossRef]
  49. Tang, T.; You, J.; Sun, H.; Zhang, H. Transportation Efficiency Evaluation Considering the Environmental Impact for China’s Freight Sector: A Parallel Data Envelopment Analysis. Sustainability 2019, 11, 5108. [Google Scholar] [CrossRef] [Green Version]
  50. Lyu, G.; Chen, L.; Huo, B. Logistics resources, capabilities and operational performance: A contingency and configuration approach. Ind. Manage. Data Syst. 2019, 119, 230–250. [Google Scholar] [CrossRef]
  51. Fan, H.; Li, G.; Sun, H.; Cheng, E. An information processing perspective on supply chain risk management: Antecedents, mechanism, and consequences. Int. J. Prod. Econ. 2017, 185, 63–75. [Google Scholar] [CrossRef]
  52. Flynn, B.; Huo, B.; Zhao, X. The impact of supply chain integration on performance: A contingency and configuration approach. J. Oper. Manag. 2009, 28, 58–71. [Google Scholar] [CrossRef]
  53. Yeung, A.C. Strategic supply management, quality initiatives, and organizational performance. Journal of Operations Management 2008, 26, 490–502. [Google Scholar] [CrossRef]
  54. Ou, C.S.; Liu, F.-C.; Hung, Y.C.; Yen, D.C. A structural model of supply chain management on firm performance. Int. J. Oper. Prod. Manag. 2010, 30, 526–545. [Google Scholar] [CrossRef]
  55. Gorane, S.; Kant, R. Supply chain practices and organizational performance. Int. J. Logist. Manag. 2017, 28, 75–101. [Google Scholar] [CrossRef]
  56. Gaur, V.; Kesavan, S. The effects of firm size and sales growth rate on inventory turnover performance in the US retail sector. In Retail Supply Chain Management; Springer: Berlin, Germany, 2008. [Google Scholar]
  57. Chen, H.; Frank, M.Z.; Wu, O.Q. What actually happened to the inventories of american companies between 1981 and 2000? Manag. Sci. 2005, 51, 1015–1031. [Google Scholar] [CrossRef] [Green Version]
  58. Gaur, V.; Fisher, M.L.; Raman, A. An Econometric Analysis of Inventory Turnover Performance in Retail Services. Manag. Sci. 2005, 51, 181–194. [Google Scholar] [CrossRef] [Green Version]
  59. Zhou, X.; Cui, Y. Green bonds, corporate performance, and corporate social responsibility. Sustainability 2019, 11, 6881. [Google Scholar] [CrossRef] [Green Version]
  60. Zhu, X.; Lin, Y. Does lean manufacturing improve firm value. J Manuf. Technol. Manag 2017, 28, 422–437. [Google Scholar] [CrossRef]
  61. Lui, A.K.; Lo, C.K.Y.; Ngai, E.W. Does mandated RFID affect firm risk? The moderating role of top management team heterogeneity. Int. J. Prod. Econ. 2019, 210, 84–96. [Google Scholar] [CrossRef]
  62. Liu, B.J. Do bigger and older firms learn more from exporting? — evidence from china ☆. China Econ. Rev. 2017, 45, 89–102. [Google Scholar] [CrossRef]
  63. Wan, Y.; Ha, H.-K.; Yoshida, Y.; Zhang, A. Airlines’ reaction to high-speed rail entries: Empirical study of the Northeast Asian market. Transp. Res. Part A: Policy Pr. 2016, 94, 532–557. [Google Scholar] [CrossRef]
  64. Siougle, E.; Dimelis, S.; Economidou, C. Does ISO 9000 certification matter for firm performance? A group analysis of Greek listed companies. Int. J. Prod. Econ. 2019, 209, 2–11. [Google Scholar] [CrossRef]
  65. Simeth, M.; Cincera, M. Corporate science, innovation, and firm value. Manag. Sci. 2016, 62, 1970–1981. [Google Scholar] [CrossRef]
  66. Blind, K.; Mangelsdorf, A.; Pohlisch, J. The effects of cooperation in accreditation on international trade: Empirical evidence on ISO 9000 certifications. Int. J. Prod. Econ. 2018, 198, 50–59. [Google Scholar] [CrossRef]
  67. Rho, B.-H.; Park, K.; Yu, Y.-M. An international comparison of the effect of manufacturing strategy-implementation gap on business performance. Int. J. Prod. Econ. 2001, 70, 89–97. [Google Scholar] [CrossRef]
  68. Maiga, A.S.; Nilsson, A.; Ax, C. Relationships between internal and external information systems integration, cost and quality performance, and firm profitability. Int. J. Prod. Econ. 2015, 169, 422–434. [Google Scholar] [CrossRef] [Green Version]
  69. Dröge, C.; Jayaram, J.; Vickery, S.K. The effects of internal versus external integration practices on time-based performance and overall firm performance. J. Oper. Manag. 2004, 22, 557–573. [Google Scholar] [CrossRef]
  70. Sadikoglu, E.; Olcay, H. The Effects of Total Quality Management Practices on Performance and the Reasons of and the Barriers to TQM Practices in Turkey. Adv. Decis. Sci. 2014, 2014, 1–17. [Google Scholar] [CrossRef]
  71. Chatzoglou, P.; Chatzoudes, D.; Kipraios, N. The impact of ISO 9000 certification on firms’ financial performance. Int. J. Oper. Prod. Manag. 2015, 35, 145–174. [Google Scholar] [CrossRef]
  72. Gramani, M.C. Efficiency decomposition approach: A cross-country airline analysis. Expert Syst. Appl. 2012, 39, 5815–5819. [Google Scholar] [CrossRef]
  73. Scopus. In Proceedings of the 6th International Conference on Industrial Engineering and Applications, Tokyo, Japan, 29 April 2019.
  74. Lin, C.-S.; Su, C.-T. The Taiwan national quality award and market value of the firms: An empirical study. Int. J. Prod. Econ. 2013, 144, 57–67. [Google Scholar] [CrossRef]
Figure 1. Density of the estimated propensity score by quality award (one-on-one nearest neighborhood matching): (a) the propensity score of samples; (b) the propensity score of samples before matching; (c) the propensity score of samples after matching.
Sustainability 12 01966 g001
Figure 2. (a): Interaction between lead time and quality awards (b): interaction between inventory turnover and quality awards.
Sustainability 12 01966 g002
Table 1. Sample description for 62 firms with Chinese quality awards.
Panel A: Frequency of Chinese Quality Awards Winning Yead
YearFrequencyYearFrequency
20111120156
20129201610
20131120177
20148
Panel B: Industry Distribution of Chinese Quality Awards Winners
Two-digit SIC codeIndustryFrequency
13Food and kindred products7
26Chemicals and allied products4
27Medicine products7
29Rubber and plastics products3
30Non-metal mineral products4
33Metal mineral products4
34Equipment products11
36Automobile products6
37Transportation equipment2
38Electronic equipment8
39Telecommunication products6
Table 2. Predicting winning a quality award.
DV: Winning Award This Year (Dummy) Logit Coefficient
Firm Size0.208 (0.202)
Liquidity Ratio0.568 *** (0.125)
Return to Asset0.037 ** (0.017)
Employees0.001 *** (0.001)
Age0.096 ** (0.044)
Debt-to-asset ratio0.021 * (0.011)
Year dummyYes
Intercept−12.969 (4.237)
Pseudo R squared0.1412
Number of observations3476
LR chi-squared88.96 **
Log likelihood−270.608 ***
Notes: Brackets contain robust standard errors. Additional 8-year dummies (2010–2016) were omitted to save space. * p < 0.1; ** p < 0.05; *** p < 0.01.
Table 3. Test for data balance in the post-matching samples.
Variables Method 1 (One-to-One nearest Neighborhood Matching) Method 2 (Mahalanobis Matching)
Means of Variablest-TestMeans of Variablest-Test
TreatmentControltp > tTreatmentControltp > t
Firm SizeU22.46421.7495.950.00022.46421.7495.950.000
M22.42122.474−0.280.77822.46422.3750.530.594
Liquidity RatioU2.1291.8522.060.0402.1291.8522.060.040
M1.9962.148−0.560.5752.1281.9150.700.486
Return to AssetU8.8596.6642.310.0218.8596.6642.310.021
M8.56510.494−1.020.3098.8597.4531.700.092
EmployeesU7304.93213.910.920.0007304.93213.910.920.000
M6142.56132.80.010.9907304.95854.81.160.248
AgeU15.60314.0542.330.02015.60314.0542.330.020
M15.15014.3831.000.31915.60314.8570.270.784
Debt-to-asset ratioU45.91943.1821.270.20345.91943.1821.270.203
M46.56942.8641.150.25245.91948.227−0.760.450
Notes: U means the treatment group and control group before matching methods; M means the treatment group and control group after matching methods.
Table 4. Difference-in-Difference regression results after matching.
VariablesOLSPSM-DIDOLSPSM-DID
DV = ROA (Return of Asset) (nearest neighborhood) DV = Return of Asset (Return of Asset) (nearest neighborhood) DV = Return of Asset (Return of Asset) (Mahalanobis) DV = Return of Asset (Return of Asset) (Mahalanobis)
Award−0.0060 (0.0043) 0.0126 (0.0108) −0.0070 (0.0033) * −0.0020 (0.0058)
Post −0.1416 (0.0843) −0.0601 (0.0233)
Before1 −0.0147 (0.0150) 0.0045 (0.0091)
Current −0.0064 (0.0119) 0.0101 (0.0095)
After1 0.0035 (0.0154) 0.0068 (0.0097)
After2 −0.0081 (0.0085) −0.0083 (0.0083)
Firm Size0.0163 (0.0036) *** 0.0263 (0.0192) 0.0263 (0.0190) 0.0018 (0.0029) −0.0018 (0.0093) −0.0026 (0.0096)
Liquidity Ratio−0.0057 (0.0025) **−0.0071 (0.0033) * −0.0071 (0.0032) ** −0.0006 (0.0002) ***−0.0008 (0.0003) ***−0.0008 (0.0003) ***
Debt-to-asset ratio−0.0023 (0.0002) ***−0.0025 (0.0006) ***−0.0024 (0.0005) ***−0.0019 (0.0001) ***−0.0024 (0.005) ***−0.0024 (0.0005) ***
Asset turnover0.0067 (0.0008) ***0.0084 (0.0031) ***0.0084 (0.0031) ***0.0027 (0.0005) ***0.0037 (0.0009) ***0.0038 (0.0009) ***
Employees0.0035 (0.00335) 0.0004 (0.0129) 0.0002 (0.0130) 0.0158 (0.0029) ***0.0021 (0.0109) 0.0025 (0.0109)
Age−0.0008 (0.0005) 0.0123 (0.0106) −0.0051 (0.0027) *−0.0001 (0.0004) 0.0076 (0.0029) 0.0073 (0.0025) **
Year dummyNoYesYesNoYesYes
Intercept−0.2505 (0.05552) ***−0.6048 (0.3414) −0.3650 (0.3218) −0.0480 (0.0475) 0.0635 (0.1770) 0.0839 (0.1813)
F−statistics46.405.596.0054.043.754.55
R square0.30830.24080.23900.33350.26000.2547
# of observations714714714743743743
Notes: Brackets contain cluster robust standard errors. Year dummies (2011–2018) were omitted to save space. b e f o r e i equalled 1 if a firm was in the treatment group and i year before the award certification; a f t e r i equalled 1 if a firm was in the treatment group and i year after the award certification; c u r r e n t equalled 1 if a firm was in the treatment group and in the award certification year; p o s t equalled 1 if a firm was in the treatment group and the year after certification. *p < 0.1; ** p < 0.05; *** p < 0.01.
Table 5. Results of the firm fixed-effect hierarchical regression analysis.
VariableModel 1Model 2Model 3Model 4Model 5Model 6Model 7Model 8Model 9 Model 10
Research & Development0.0047
(0.0184)
0.0044
(0.0184)
0.0020
(0.0183)
0.0020
(0.0186)
−0.0037
(0.0191)
−0.0054
(0.0182)
−0.0007
(0.0190)
−0.0043
(0.0187)
0.0098
(0.0213)
0.0086
(0.0208)
Asset Turnover0.0228
(0.0143)
0.0226
(0.0143)
0.0216
(0.0143)
0.0209
(0.0144)
0.0220
(0.0135)
0.0205
(0.0131)
0.0106
(0.0122)
0.0114
(0.0116)
0.0183
(0.0143)
0.0201
(0.0145)
Employees−0.2528
(0.0824) ***
−0.2504
(0.0829) ***
−0.2464
(0.0816) ***
−0.2337
(0.0828) ***
−0.2337
(0.0828) ***
−0.2391
(0.0872) **
−0.2250
(0.0769) ***
−0.2312
(0.0774) ***
−0.2103
(0.0782) ***
−0.2048
(0.0752) ***
Age−0.0388
(0.0136) ***
−0.0381
(0.0135) ***
−0.0406
(0.0135) ***
−0.0431
(0.0134) ***
−0.0361
(0.0136) ***
−0.0367
(0.0133) ***
−0.0444
(0.0120) ***
−0.0421
(0.0127) ***
−0.0385
(0.0126) ***
−0.0372
(0.0130) ***
Profit0.9748
(0.0257) ***
0.9741
(0.0259) ***
0.9758
(0.0260) ***
0.9767
(0.0256) ***
0.9479
(0.0252) ***
0.9568
(0.0230) ***
0.9625
(0.0252) ***
0.9616
(0.0253) ***
0.9711
(0.0242) ***
0.9698
(0.0244) ***
Work–in - Construction−0.0417
(0.0142) ***
−0.0420
(0.0143) ***
−0.0414
(0.0142) ***
−0.0412
(0.0143) **
−0.0426
(0.0144) **
−0.0431
(0.0142) **
−0.0260
(0.0140) **
−0.0258
(0.0135) *
−0.0398
(0.0145) ***
−0.0395
(0.0144) ***
Financial Cost−0.0197
(0.0142)
−0.0196
(0.0142)
−0.0195
(0.0142)
−0.0197
(0.0145)
−0.0155
(0.01437)
−0.0155
(0.0148)
−0.0307
(0.0139) **
−0.0304
(0.0137) **
−0.0272
(0.0159) **
−0.0267
(0.0158) **
Sales Cost−0.4422
(0.0678) ***
−0.4417
(0.0682) ***
−0.4478
(0.0675) ***
−0.4476
(0.0677) ***
−0.4444
(0.0681) ***
−0.4459
(0.0672) ***
−0.4742
(0.0637) ***
−0.4644
(0.0664) ***
−0.5274
(0.0639) ***
−0.5272
(0.0638) ***
Management Cost−0.1330
(0.0631) **
−0.1331
(0.0633) **
−0.1306
(0.0621) **
−0.1291
(0.0627) **
−0.1301
(0.0629) **
−0.1297
(0.0612) **
−0.1017
(0.0565) *
−0.01038
(0.0554) *
−0.1152
(0.0590) **
−0.1161
(0.0582) **
Liquidity Ratio−0.0335
(0.0268)
−0.0335
(0.0269)
−0.0314
(0.0258)
−0.0312
(0.0256)
−0.0315
(0.0260)
−0.0311
(0.0259)
−0.0619
(0.0246) **
−0.0597
(0.0261) **
−0.0176
(0.0221)
−0.0171
(0.0226)
Debt-to-asset ratio−0.0032
(0.0026)
−0.0033
(0.0026)
−0.0033
(0.0025)
−0.0033
(0.0025)
−0.0018
(0.0026)
−0.0021
(0.0025)
−0.0025
(0.0025)
−0.0028
(0.0025)
−0.0024
(0.0023)
−0.0027
(0.0022)
Award−0.0239
(0.0453)
−0.0254
(0.0446)
−0.0248
(0.0444)
−0.0312
(0.0439)
−0.0227
(0.0450)
−0.0181
(0.0423)
−0.0207
(0.0432)
−0.0356
(0.0453)
−0.0348
(0.0453)
Production Flexibility (H2) −0.0150
(0.0080) *
−0.0250
(0.0111) **
Production Flexibility × Award 0.0201
(0.0171)
Cost Efficiency (H3) −0.8924
(0.3775) **
−1.1538
(0.3942) ***
Cost Efficiency × Award 1.1967
(0.9261)
Lead Time (H4) −0.2269
(0.0601) ***
−0.1724
(0.0539) ***
Lead Time × Award −0.1105
(0.0901) *
Inventory Turnover (H5) 0.2570
(0.0708) ***
0.2065
(0.0780) ***
Inventory Turnover × Award 0.1517
(0.1219) *
Intercept0.0089
(0.0376)
0.0122
(0.0378)
−3.5057
(0.0381)
−3.5107
(0.0376)
−3.513
(0.0397)
−3.5163
(0.0376)
−0.0145
(0.0334)
−0.0076
(0.0355)
−0.0011
(0.0338)
0.0046
(0.0352)
R-square (within) 0.93300.93310.93360.93380.93480.93590.93910.93960.93770.9381
# of observations532532532532532532532532532532
Notes: Brackets contain cluster robust standard errors. Year dummies (2011–2018) were omitted to save space. * p < 0.1; ** p < 0.05; *** p < 0.01.

