Industrial Decarbonization by a New Energy-Baseline Methodology. Case Study


Abstract
1. Introduction
2. Materials and Methods
3. Analysis and Results
4. Conclusions
Author Contributions
Funding
Acknowledgments
Conflicts of Interest
Appendix A

| Production (kg) | Energy (kWh) | Standard Production P(Equiv.) | |||
|---|---|---|---|---|---|
| 41.53 | 43.08 | 1.04 | 15.90 | 3.10 | 2.0 |
| 54.74 | 54.74 | 1.00 | 22.72 | 2.70 | 2.0 |
| 61.62 | 61.62 | 1.00 | 26.76 | 2.56 | 2.0 |
| 59.02 | 111.00 | 1.88 | 47.44 | 2.61 | 2.0 |
| 95.14 | 103.70 | 1.09 | 51.69 | 2.18 | 2.0 |
| 73.45 | 121.19 | 1.65 | 55.92 | 2.39 | 2.0 |
| 76.58 | 127.25 | 1.66 | 59.51 | 2.35 | 2.0 |
| 58.00 | 154.27 | 2.66 | 65.50 | 2.63 | 2.0 |
| 58.91 | 156.70 | 2.66 | 66.92 | 2.62 | 2.0 |
| 122.35 | 133.36 | 1.09 | 70.75 | 2.02 | 2.0 |
| 63.37 | 176.54 | 2.79 | 77.44 | 2.53 | 2.0 |
| 111.70 | 158.02 | 1.41 | 82.07 | 2.07 | 2.0 |
| 111.70 | 158.02 | 1.41 | 82.07 | 2.07 | 2.0 |
| 83.83 | 187.77 | 2.24 | 90.28 | 2.27 | 2.0 |
| 83.83 | 187.77 | 2.24 | 90.28 | 2.27 | 2.0 |
| 173.88 | 173.88 | 1.00 | 98.83 | 1.85 | 2.0 |
| 137.39 | 224.80 | 1.64 | 122.27 | 1.96 | 2.0 |
| 137.39 | 224.80 | 1.64 | 122.27 | 1.96 | 2.0 |
| 187.06 | 224.47 | 1.20 | 129.12 | 1.83 | 2.0 |
| 227.23 | 227.23 | 1.00 | 134.51 | 1.76 | 2.0 |
| 138.25 | 248.85 | 1.80 | 135.52 | 1.95 | 2.0 |
| 116.23 | 268.25 | 2.31 | 140.64 | 2.05 | 2.0 |
| 116.23 | 268.25 | 2.31 | 140.64 | 2.05 | 2.0 |
| 186.04 | 248.30 | 1.33 | 142.71 | 1.83 | 2.0 |
| 186.04 | 248.30 | 1.33 | 142.71 | 1.83 | 2.0 |
| 152.81 | 259.75 | 1.70 | 144.26 | 1.91 | 2.0 |
| 152.81 | 259.75 | 1.70 | 144.26 | 1.91 | 2.0 |
| 133.44 | 285.82 | 2.14 | 154.52 | 1.97 | 2.0 |
| 133.44 | 285.82 | 2.14 | 154.52 | 1.97 | 2.0 |
| 261.32 | 261.32 | 1.00 | 157.46 | 1.72 | 2.0 |
| 146.12 | 294.02 | 2.01 | 161.90 | 1.93 | 2.0 |
| 146.12 | 294.02 | 2.01 | 161.90 | 1.93 | 2.0 |
| 146.12 | 294.02 | 2.01 | 161.90 | 1.93 | 2.0 |
| 157.83 | 293.20 | 1.86 | 163.82 | 1.89 | 2.0 |
| 149.89 | 302.62 | 2.02 | 167.46 | 1.92 | 2.0 |
| 140.16 | 307.14 | 2.19 | 167.73 | 1.95 | 2.0 |
| 140.16 | 307.14 | 2.19 | 167.73 | 1.95 | 2.0 |
| 182.19 | 317.72 | 1.74 | 181.99 | 1.84 | 2.0 |
| 182.19 | 317.72 | 1.74 | 181.99 | 1.84 | 2.0 |
| 309.19 | 306.58 | 0.99 | 188.22 | 1.68 | 2.0 |
| 309.19 | 306.58 | 0.99 | 188.22 | 1.68 | 2.0 |
| 309.19 | 306.58 | 0.99 | 188.22 | 1.68 | 2.0 |
| 322.76 | 307.13 | 0.95 | 189.38 | 1.67 | 2.0 |
| 322.76 | 307.13 | 0.95 | 189.38 | 1.67 | 2.0 |
| 322.76 | 307.13 | 0.95 | 189.38 | 1.67 | 2.0 |
| 182.36 | 339.58 | 1.86 | 194.54 | 1.83 | 2.0 |
| 182.36 | 339.58 | 1.86 | 194.54 | 1.83 | 2.0 |
| 275.75 | 330.95 | 1.20 | 200.67 | 1.71 | 2.0 |
| 329.57 | 326.51 | 0.99 | 201.74 | 1.67 | 2.0 |
| 164.98 | 366.84 | 2.22 | 206.62 | 1.87 | 2.0 |
| 171.86 | 367.10 | 2.14 | 208.24 | 1.86 | 2.0 |
| 171.86 | 367.10 | 2.14 | 208.24 | 1.86 | 2.0 |
| 336.64 | 336.64 | 1.00 | 208.43 | 1.66 | 2.0 |
| 166.70 | 370.83 | 2.22 | 209.24 | 1.87 | 2.0 |
| 193.69 | 387.38 | 2.00 | 224.06 | 1.81 | 2.0 |
| 340.73 | 402.23 | 1.18 | 249.32 | 1.66 | 2.0 |
| 236.42 | 426.43 | 1.80 | 253.76 | 1.75 | 2.0 |
| 216.58 | 444.60 | 2.05 | 261.44 | 1.78 | 2.0 |
| 217.28 | 451.91 | 2.08 | 265.86 | 1.77 | 2.0 |
| 276.78 | 444.95 | 1.61 | 269.91 | 1.71 | 2.0 |
| 285.66 | 456.20 | 1.60 | 277.72 | 1.70 | 2.0 |
| 318.44 | 451.16 | 1.42 | 277.81 | 1.68 | 2.0 |
| 300.56 | 456.50 | 1.52 | 279.43 | 1.69 | 2.0 |
| 272.26 | 472.15 | 1.73 | 285.87 | 1.71 | 2.0 |
| 243.74 | 485.44 | 1.99 | 290.01 | 1.74 | 2.0 |
| 401.57 | 493.00 | 1.23 | 310.01 | 1.63 | 2.0 |
| 323.67 | 503.44 | 1.56 | 310.51 | 1.67 | 2.0 |
| 245.21 | 519.51 | 2.12 | 310.60 | 1.74 | 2.0 |
| 274.29 | 514.28 | 1.87 | 311.65 | 1.71 | 2.0 |
| 258.58 | 521.90 | 2.02 | 314.08 | 1.72 | 2.0 |
| 397.21 | 507.82 | 1.28 | 319.05 | 1.63 | 2.0 |
| 256.83 | 530.62 | 2.07 | 319.06 | 1.73 | 2.0 |
| 452.91 | 505.78 | 1.12 | 321.01 | 1.61 | 2.0 |
| 294.08 | 529.72 | 1.80 | 323.50 | 1.69 | 2.0 |
| 372.83 | 525.60 | 1.41 | 328.46 | 1.64 | 2.0 |
| 3190.22 | 496.79 | 0.16 | 336.27 | 1.48 | 2.0 |
| 516.77 | 526.34 | 1.02 | 337.08 | 1.59 | 2.0 |
| 322.94 | 553.67 | 1.71 | 341.41 | 1.67 | 2.0 |
| 276.42 | 564.63 | 2.04 | 342.46 | 1.71 | 2.0 |
| 487.00 | 542.94 | 1.11 | 346.35 | 1.60 | 2.0 |
| 292.20 | 583.43 | 2.00 | 356.05 | 1.69 | 2.0 |
| 314.34 | 590.91 | 1.88 | 363.39 | 1.68 | 2.0 |
| 350.83 | 587.10 | 1.67 | 364.90 | 1.66 | 2.0 |
| 360.60 | 592.00 | 1.64 | 368.86 | 1.65 | 2.0 |
| 392.54 | 591.90 | 1.51 | 371.51 | 1.64 | 2.0 |
| 324.03 | 604.79 | 1.87 | 373.06 | 1.67 | 2.0 |
| 296.30 | 611.88 | 2.07 | 373.98 | 1.69 | 2.0 |
| 434.19 | 603.82 | 1.39 | 382.03 | 1.62 | 2.0 |
| 1020.65 | 601.90 | 0.59 | 398.10 | 1.53 | 2.0 |
| 424.55 | 637.48 | 1.50 | 402.63 | 1.62 | 2.0 |
| 357.51 | 649.86 | 1.82 | 404.60 | 1.65 | 2.0 |
| 471.51 | 638.48 | 1.35 | 406.39 | 1.61 | 2.0 |
| 517.06 | 637.68 | 1.23 | 408.40 | 1.59 | 2.0 |
| 340.82 | 664.77 | 1.95 | 412.06 | 1.66 | 2.0 |
| 337.21 | 668.91 | 1.98 | 414.21 | 1.66 | 2.0 |
| 508.06 | 664.79 | 1.31 | 425.28 | 1.60 | 2.0 |
| 399.10 | 684.78 | 1.72 | 430.39 | 1.63 | 2.0 |
| 522.44 | 675.41 | 1.29 | 432.85 | 1.59 | 2.0 |
| 353.41 | 703.97 | 1.99 | 437.83 | 1.65 | 2.0 |
| 417.22 | 694.78 | 1.67 | 438.23 | 1.63 | 2.0 |
| 380.14 | 708.45 | 1.86 | 443.46 | 1.64 | 2.0 |
| 361.79 | 720.54 | 1.99 | 449.09 | 1.65 | 2.0 |
| 462.83 | 707.09 | 1.53 | 449.47 | 1.61 | 2.0 |
| 439.16 | 713.65 | 1.63 | 451.90 | 1.62 | 2.0 |
| 387.12 | 731.11 | 1.89 | 458.35 | 1.64 | 2.0 |
| 377.72 | 736.73 | 1.95 | 460.92 | 1.64 | 2.0 |
| 399.23 | 747.33 | 1.87 | 469.72 | 1.63 | 2.0 |
| 433.26 | 766.56 | 1.77 | 484.92 | 1.62 | 2.0 |
| 243.33 | 815.72 | 3.35 | 487.21 | 1.74 | 2.0 |
| 426.45 | 777.84 | 1.82 | 491.46 | 1.62 | 2.0 |
| 401.02 | 784.61 | 1.96 | 493.33 | 1.63 | 2.0 |
| 435.73 | 793.20 | 1.82 | 501.98 | 1.62 | 2.0 |
| 664.02 | 788.90 | 1.19 | 512.54 | 1.56 | 2.0 |
| 418.31 | 813.11 | 1.94 | 512.97 | 1.62 | 2.0 |
| 757.42 | 793.88 | 1.05 | 519.02 | 1.55 | 2.0 |
| 320.36 | 852.14 | 2.66 | 525.04 | 1.67 | 2.0 |
| 513.05 | 829.68 | 1.62 | 531.10 | 1.59 | 2.0 |
| 464.92 | 836.86 | 1.80 | 532.13 | 1.61 | 2.0 |
| 523.59 | 839.35 | 1.60 | 537.99 | 1.59 | 2.0 |
| 527.00 | 859.04 | 1.63 | 550.84 | 1.59 | 2.0 |
| 542.66 | 865.12 | 1.59 | 555.75 | 1.59 | 2.0 |
| 784.45 | 881.14 | 1.12 | 576.96 | 1.55 | 2.0 |
| 951.44 | 874.56 | 0.92 | 577.04 | 1.53 | 2.0 |
| 553.87 | 1198.00 | 2.16 | 770.55 | 1.58 | 2.0 |
| 582.36 | 1197.25 | 2.06 | 772.34 | 1.58 | 2.0 |
| 918.00 | 1468.80 | 1.60 | 967.84 | 1.54 | 2.0 |
References
- EU EPBD 2018/844/EU. Available online: https://eur-lex.europa.eu/legal-content/EN/TXT/PDF/?uri=CELEX:32018L0844&from=IT (accessed on 5 October 2019).
- EU EPBD 2010/31/EU. Available online: https://eur-lex.europa.eu/legal-content/ES/TXT/?uri=celex%3A32010L0031 (accessed on 5 October 2019).
- EU EPBD 2012/27/EU. Available online: https://eur-lex.europa.eu/legal-content/EN/TXT/?qid=1399375464230&uri=CELEX:32012L0027 (accessed on 5 October 2019).
- International Energy Agency (IEA). Tracking Industry. Available online: https://www.iea.org/reports/tracking-industry-2019 (accessed on 5 October 2019).
- International Energy Agency (IEA). Energy Efficiency 2018—Analysis and Outlooks to 2040; International Energy Agency: Paris, France, 2017; pp. 1–143. [Google Scholar]
- ISO. ISO Survey 2017. Available online: https://www.iso.org/the-iso-survey.html (accessed on 8 October 2019).
- Chakraborty, D. Environmental Management Accounting (EMA) and Environmental Reporting in a Resource Constrained World: Challenges for CMAs. Manag. Account. 2017, 52, 36–42. [Google Scholar]
- Dzene, I.; Polikarpova, I.; Zogla, L.; Rosa, M. Application of ISO 50001 for Implementation of Sustainable Energy Action Plans. Energy Procedia 2015, 72, 111–118. [Google Scholar] [CrossRef]
- Deloitte LATCO Análisis Económico y de Industrias Latinoamérica La hora de las reformas estructurales. Available online: https://www2.deloitte.com/content/dam/Deloitte/cr/Documents/finance/Deloitte-Analisis-Economico-y-de-Industrias-Latinoamerica.pdf (accessed on 10 October 2019).
- Wang, H.; Chen, W. Modelling deep decarbonization of industrial energy consumption under 2-degree target: Comparing China, India and Western Europe. Appl. Energy 2019, 238, 1563–1572. [Google Scholar] [CrossRef]
- Barrett, J.; Cooper, T.; Hammond, G.P.; Pidgeon, N. Industrial energy, materials and products: UK decarbonisation challenges and opportunities. Appl. Therm. Eng. 2018, 136, 643–656. [Google Scholar] [CrossRef]
- Arce, G. Plan de Acción Indicativo de Eficiencia Energética 2017–2022; Ministerio de Minas y Energía, República de Colombia: Bogota, Colombia, 2017. [Google Scholar]
- Ley de 1715. Available online: http://www.secretariasenado.gov.co/senado/basedoc/ley_1715_2014.htm (accessed on 10 October 2019).
- International Organization for Standards (ISO). ISO 50001: International Standard, Energy Management Systems—Requirements with Guidance for Use; International Organization for Standards: Geneva, Switzerland, 2011. [Google Scholar]
- Rey-Hernández, J.M.; Velasco-Gómez, E.; San José-Alonso, J.F.; Tejero-González, A.; González-González, S.L.; Rey-Martínez, F.J. Monitoring Data Study of the Performance of Renewable Energy Systems in a Near Zero Energy Building in Spain: A Case Study. Energies 2018, 11, 2979. [Google Scholar] [CrossRef]
- Castrillon, R.; González, A.; Ciro, E. Mejoramiento de la eficiencia energética en la industria del cemento por proceso húmedo a través de la implementación del sistema de gestión integral de la energía. Dyna 2013, 80, 115–123. [Google Scholar]
- International Energy Agency (IEA). Indicadores de Eficiencia Energética: Bases Esenciales para el Establecimiento de Políticas; International Energy Agency: Paris, France, 2015; p. 182. [Google Scholar]
- Rey-Hernández, J.M.; Velasco-Gómez, E.; San José-Alonso, J.F.; Tejero-González, A.; Rey-Martínez, F.J. Energy analysis at a near zero energy building. A case-study in Spain. Energies 2018, 11, 857. [Google Scholar] [CrossRef]
- McKane, A.; Therkelsen, P.; Scodel, A.; Rao, P.; Aghajanzadeh, A.; Hirzel, S.; Zhang, R.; Prem, R.; Fossa, A.; Lazarevska, A.M.; et al. Predicting the quantifiable impacts of ISO 50001 on climate change mitigation. Energy Policy 2017, 107, 278–288. [Google Scholar] [CrossRef]
- Kassai, M. Experimental investigation of carbon dioxide cross-contamination in sorption energy recovery wheel in ventilation system. Build. Serv. Eng. Res. Technol. 2018, 39, 463–474. [Google Scholar] [CrossRef]
- Kassai, M.; Simonson, C.J. Experimental Effectiveness Investigation of Liquid-to-air Membrane Energy Exchangers under Low Heat Capacity Rates Conditions. Exp. Heat Transf. 2016, 29, 445–455. [Google Scholar] [CrossRef]
- Kanneganti, H.; Gopalakrishnan, B.; Crowe, E.; Al-Shebeeb, O.; Yelamanchi, T.; Nimbarte, A.; Currie, K.; Abolhassani, A. Specification of energy assessment methodologies to satisfy ISO 50001 energy management standard. Sustain. Energy Technol. Assess. 2017, 23, 121–135. [Google Scholar] [CrossRef]
- Pelser, W.A.; Vosloo, J.C.; Mathews, M.J. Results and prospects of applying an ISO 50001 based reporting system on a cement plant. J. Clean. Prod. 2018, 198, 642–653. [Google Scholar] [CrossRef]
- Bonacina, F.; Corsini, A.; De Propris, L.; Marchegiani, A.; Mori, F. Industrial Energy Management Systems in Italy: State of the art and perspective. Energy Procedia 2015, 82, 562–569. [Google Scholar] [CrossRef][Green Version]
- Jovanović, B.; Filipović, J.; Bakić, V. Energy management system implementation in Serbian manufacturing—Plan-Do-Check-Act cycle approach. J. Clean. Prod. 2017, 162, 1144–1156. [Google Scholar] [CrossRef]
- Benedetti, M.; Cesarotti, V.; Introna, V. From energy targets setting to energy-aware operations control and back: An advanced methodology for energy efficient manufacturing. J. Clean. Prod. 2017, 167, 1518–1533. [Google Scholar] [CrossRef]
- International Organization for Standards (ISO). ISO 50006: Energy Management Systems—Measuring Energy Performance Using Energy Baselines (EnB) and Energy Performance Indicators (EnPI)—General Principles and Guidance; International Organization for Standards: Geneva, Switzerland, 2016. [Google Scholar]
- Department of Energy (DOE). Steps to Develop a Baseline: A Guide to Developing an Energy Use and Energy. Available online: https://www1.eere.energy.gov/manufacturing/resources/pdfs/leaderbaselinestepsguideline.pdf (accessed on 5 October 2019).
- Castrillón, R.; Gonzalez, A. Metodología Para la Planificación Energética a Partir de la Norma ISO 50001; Universidad Autónoma de Occidente: Cali, Colombia, 2018; ISBN 978-958-8994-59-8. [Google Scholar]
- Castrillón, R.; Quispe, E.C.; Gonzalez, A.; Urhan, M.; Fandiño, D. Metodología Para la Implementación del Sistema de Gestión Integral de la Energía. Fundamentos y Casos Prácticos; Universidad Autónoma de Occidente: Cali, Colombia, 2015; ISBN 9789588713540. [Google Scholar]
- The Northwest Energy Efficiency Alliance (NEEEA). Energy Baseline Methodologies for Industrial Facilities, 1st ed.; The Northwest Energy Efficiency Alliance: Portland, OR, USA, 2011. [Google Scholar]
- Gómez-Calvet, R.; Conesa, D.; Gómez-Calvet, A.R.; Tortosa-Ausina, E. Energy efficiency in the European Union: What can be learned from the joint application of directional distance functions and slacks-based measures? Appl. Energy 2014, 132, 137–154. [Google Scholar] [CrossRef]
- Morvay, Z.K.; Gvozdenac, D.D. Applied Industrial Energy and Environmental Management; John Wiley & Son: Hoboken, NJ, USA, 2009; ISBN 9780470697429. [Google Scholar]
- Bogetoft, P.; Otto, L. Benchmarking with DEA, SFA, and R; Springer: Berlin, Germany, 2011; ISBN 978-1-4419-7961-2. [Google Scholar]
- Sakamoto, T.; Takase, K.; Matsuhashi, R.; Managi, S. Baseline of the projection under a structural change in energy demand. Energy Policy 2016, 98, 274–289. [Google Scholar] [CrossRef]
- Marina Domingo, A.M.; Rey-Hernández, J.M.; San José Alonso, J.F.; Crespo, R.M.; Rey Martínez, F.J. Energy efficiency analysis carried out by installing district heating on a university campus. A case study in Spain. Energies 2018, 11, 2826. [Google Scholar] [CrossRef]
- Jentsch, M.F.; Bahaj, A.S.; James, P.A.B. Climate change future proofing of buildings-Generation and assessment of building simulation weather files. Energy Build. 2008, 40, 2148–2168. [Google Scholar] [CrossRef]
- Sagastume Gutiérrez, A.; Cabello Eras, J.J.; Sousa Santos, V.; Hernández Herrera, H.; Hens, L.; Vandecasteele, C. Electricity management in the production of lead-acid batteries: The industrial case of a production plant in Colombia. J. Clean. Prod. 2018, 198, 1443–1458. [Google Scholar] [CrossRef]
- Prias, O.; Campos, J.; Rojas, D.; Palencia, A. Implementación de un Sistestema de Gestión de la Energía. Guía con Base en ISO50001. 2013. Available online: http://reciee.com/pdf/2013%20-%20Implementaci%C3%B3n%20SGIE,%20Gu%C3%ADa%20con%20Base%20ISO%2050001%20(1).pdf (accessed on 15 October 2019).
- Allaire, J.J.; Team, R.C. RStudio IDE for R. Available online: https://rstudio.com/ (accessed on 19 December 2019).
- Vargas Isaza, C.A. Consumo de Energía en la Industria del Plástico: Revisión de Estudios Realizados; Instituto Tecnológico Metropolitano: Medellín, Colombia, 2015; Volume 1. [Google Scholar]


| Energy Baseline Type | Uses |
|---|---|
| Energy Value Measurement |
|
| Measured Value ratio |
|
| Statistical Model Linear Regression Model Non-linear regression model Multivariable model |
|
| Engineering or Simulation Model |
|
| Injection Mold | Energy Baseline | Correlation Coefficient Ʀ2 | Target Line | |
|---|---|---|---|---|
| Unstandardized Energy Consumption Equation | E = 0.8525P + 302.04 | 0.478 | - | |
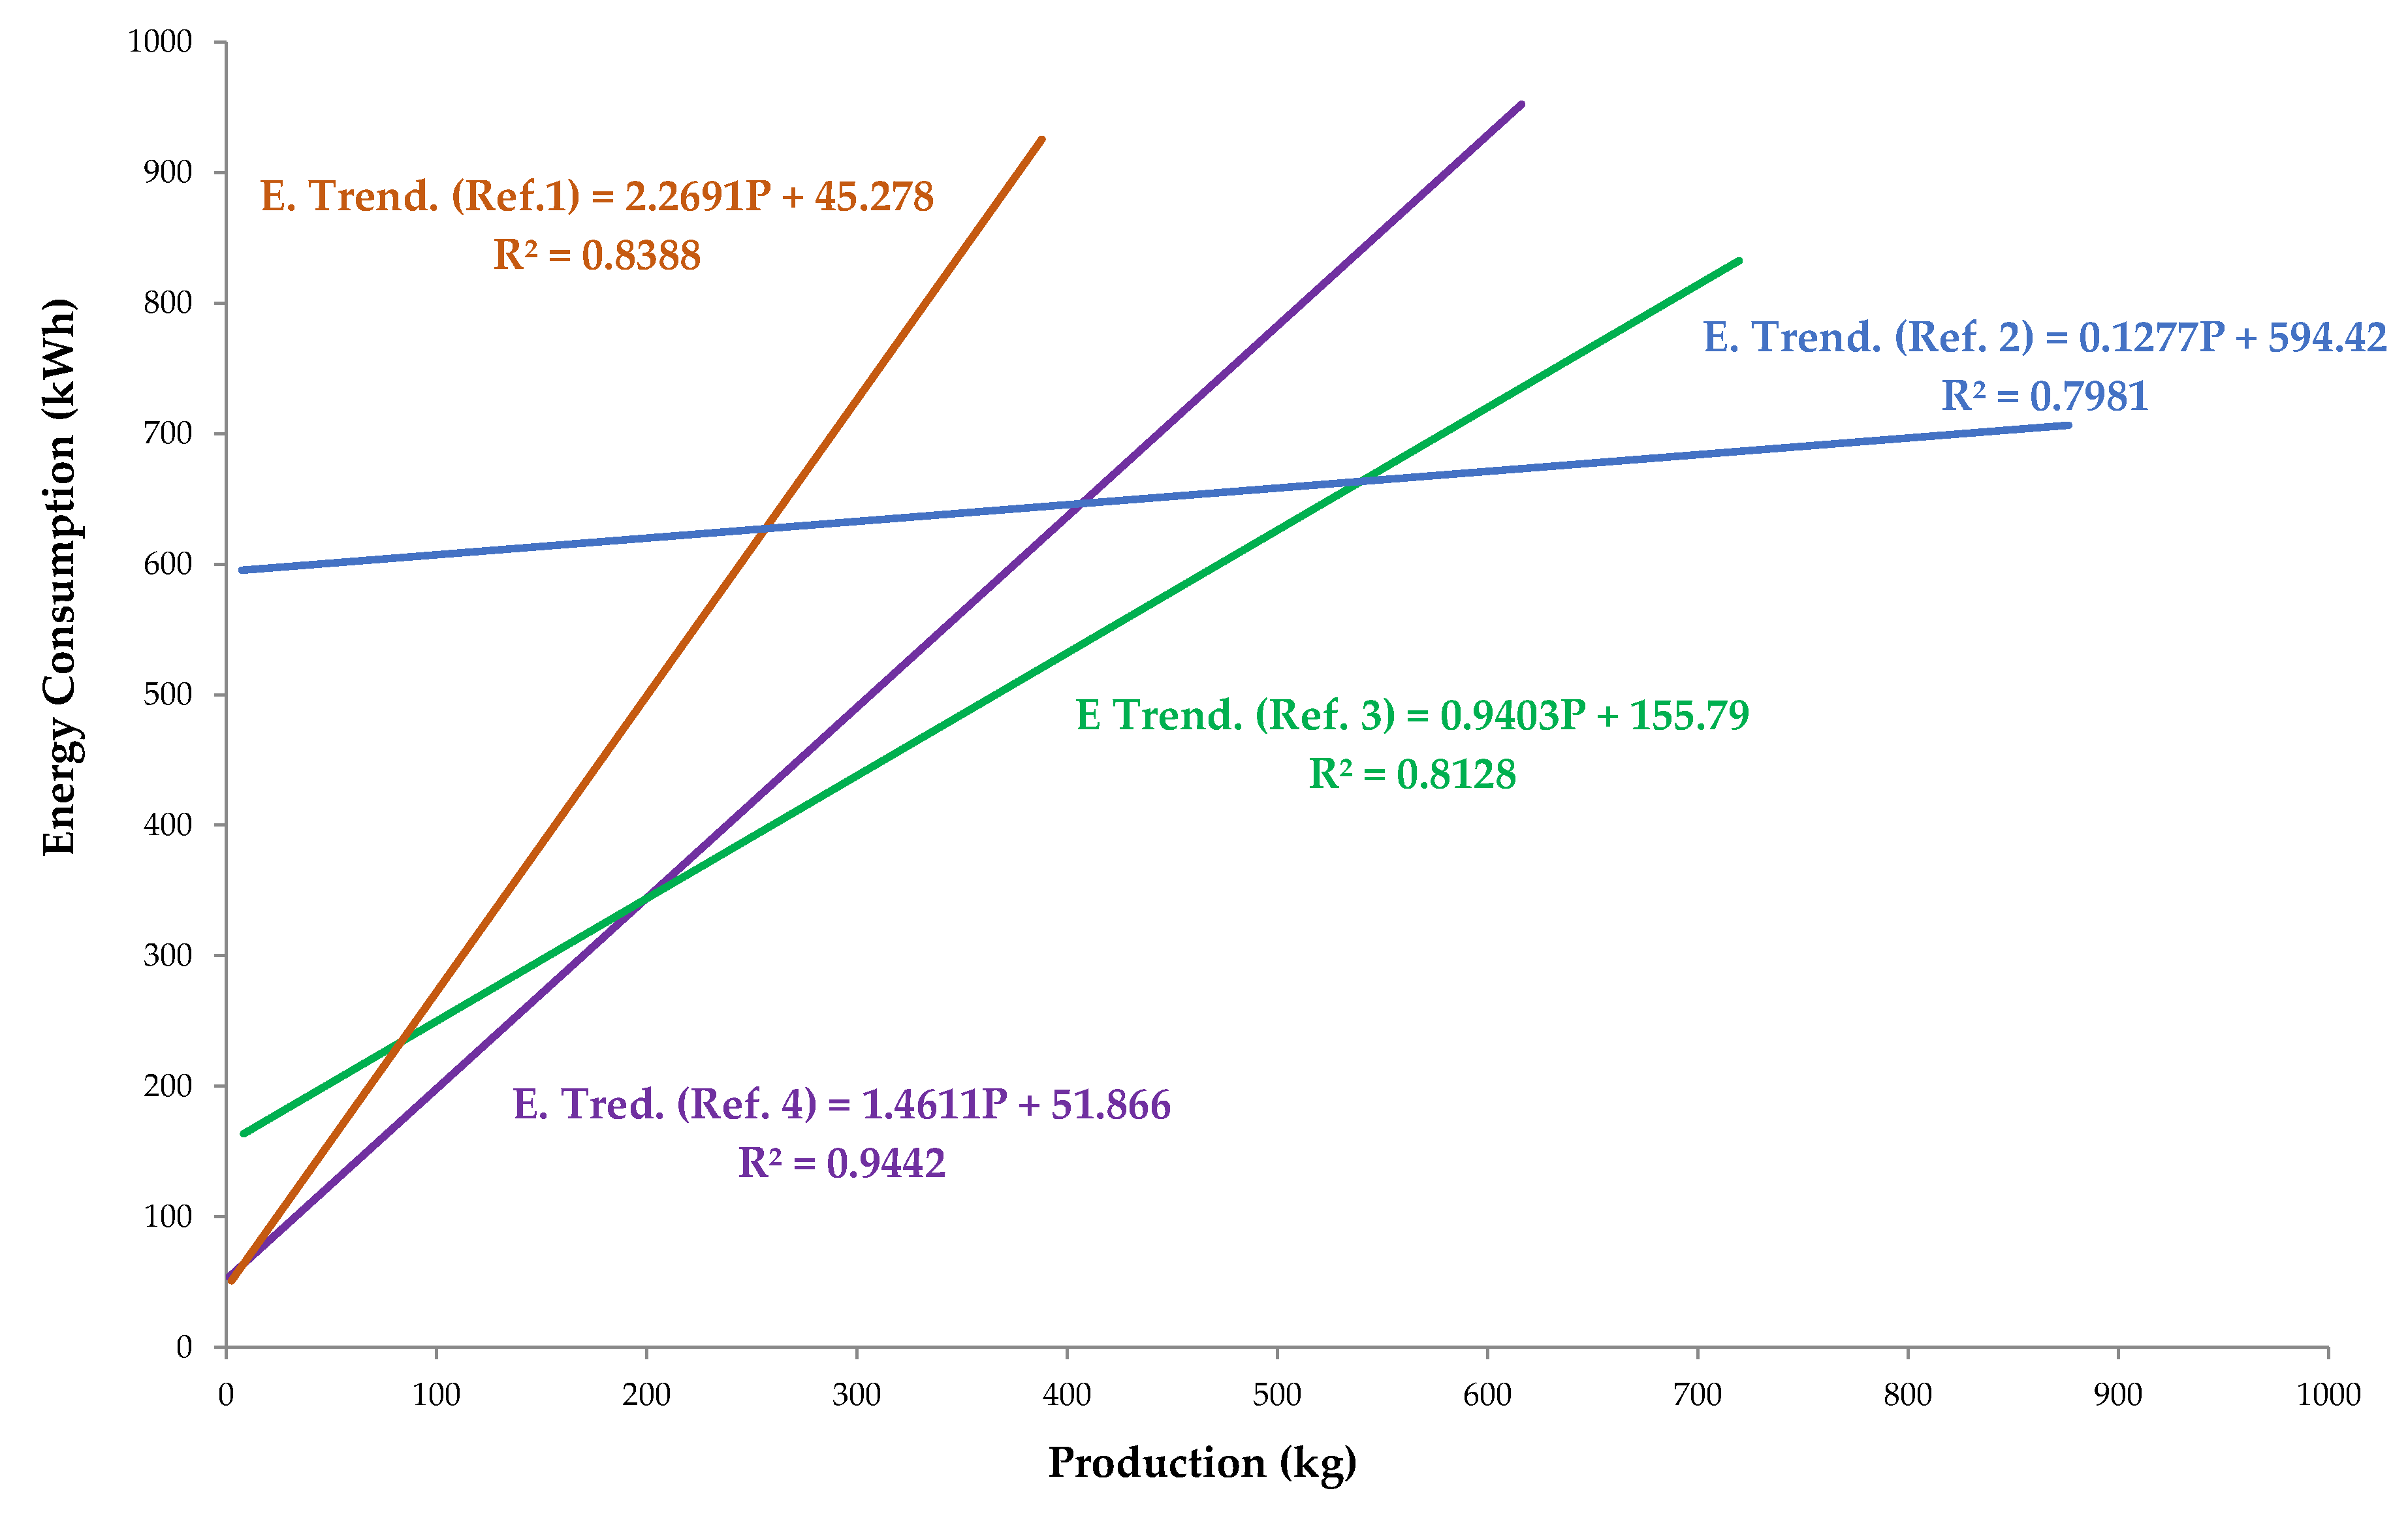
| H246 | E = 2.2691P + 45.278 | 0.8388 | 2.2691P + 12.166 | |
| H110 | E = 0.1277P + 594.42 | 0.7981 | 0.1277P + 581.89 | |
| H429 | E = 0.9403P + 155.79 | 0.8128 | 0.9403P + 93.822 | |
| H332 | E = 1.4611P + 51.866 | 0.9442 | 1.4611P + 22.51 | |
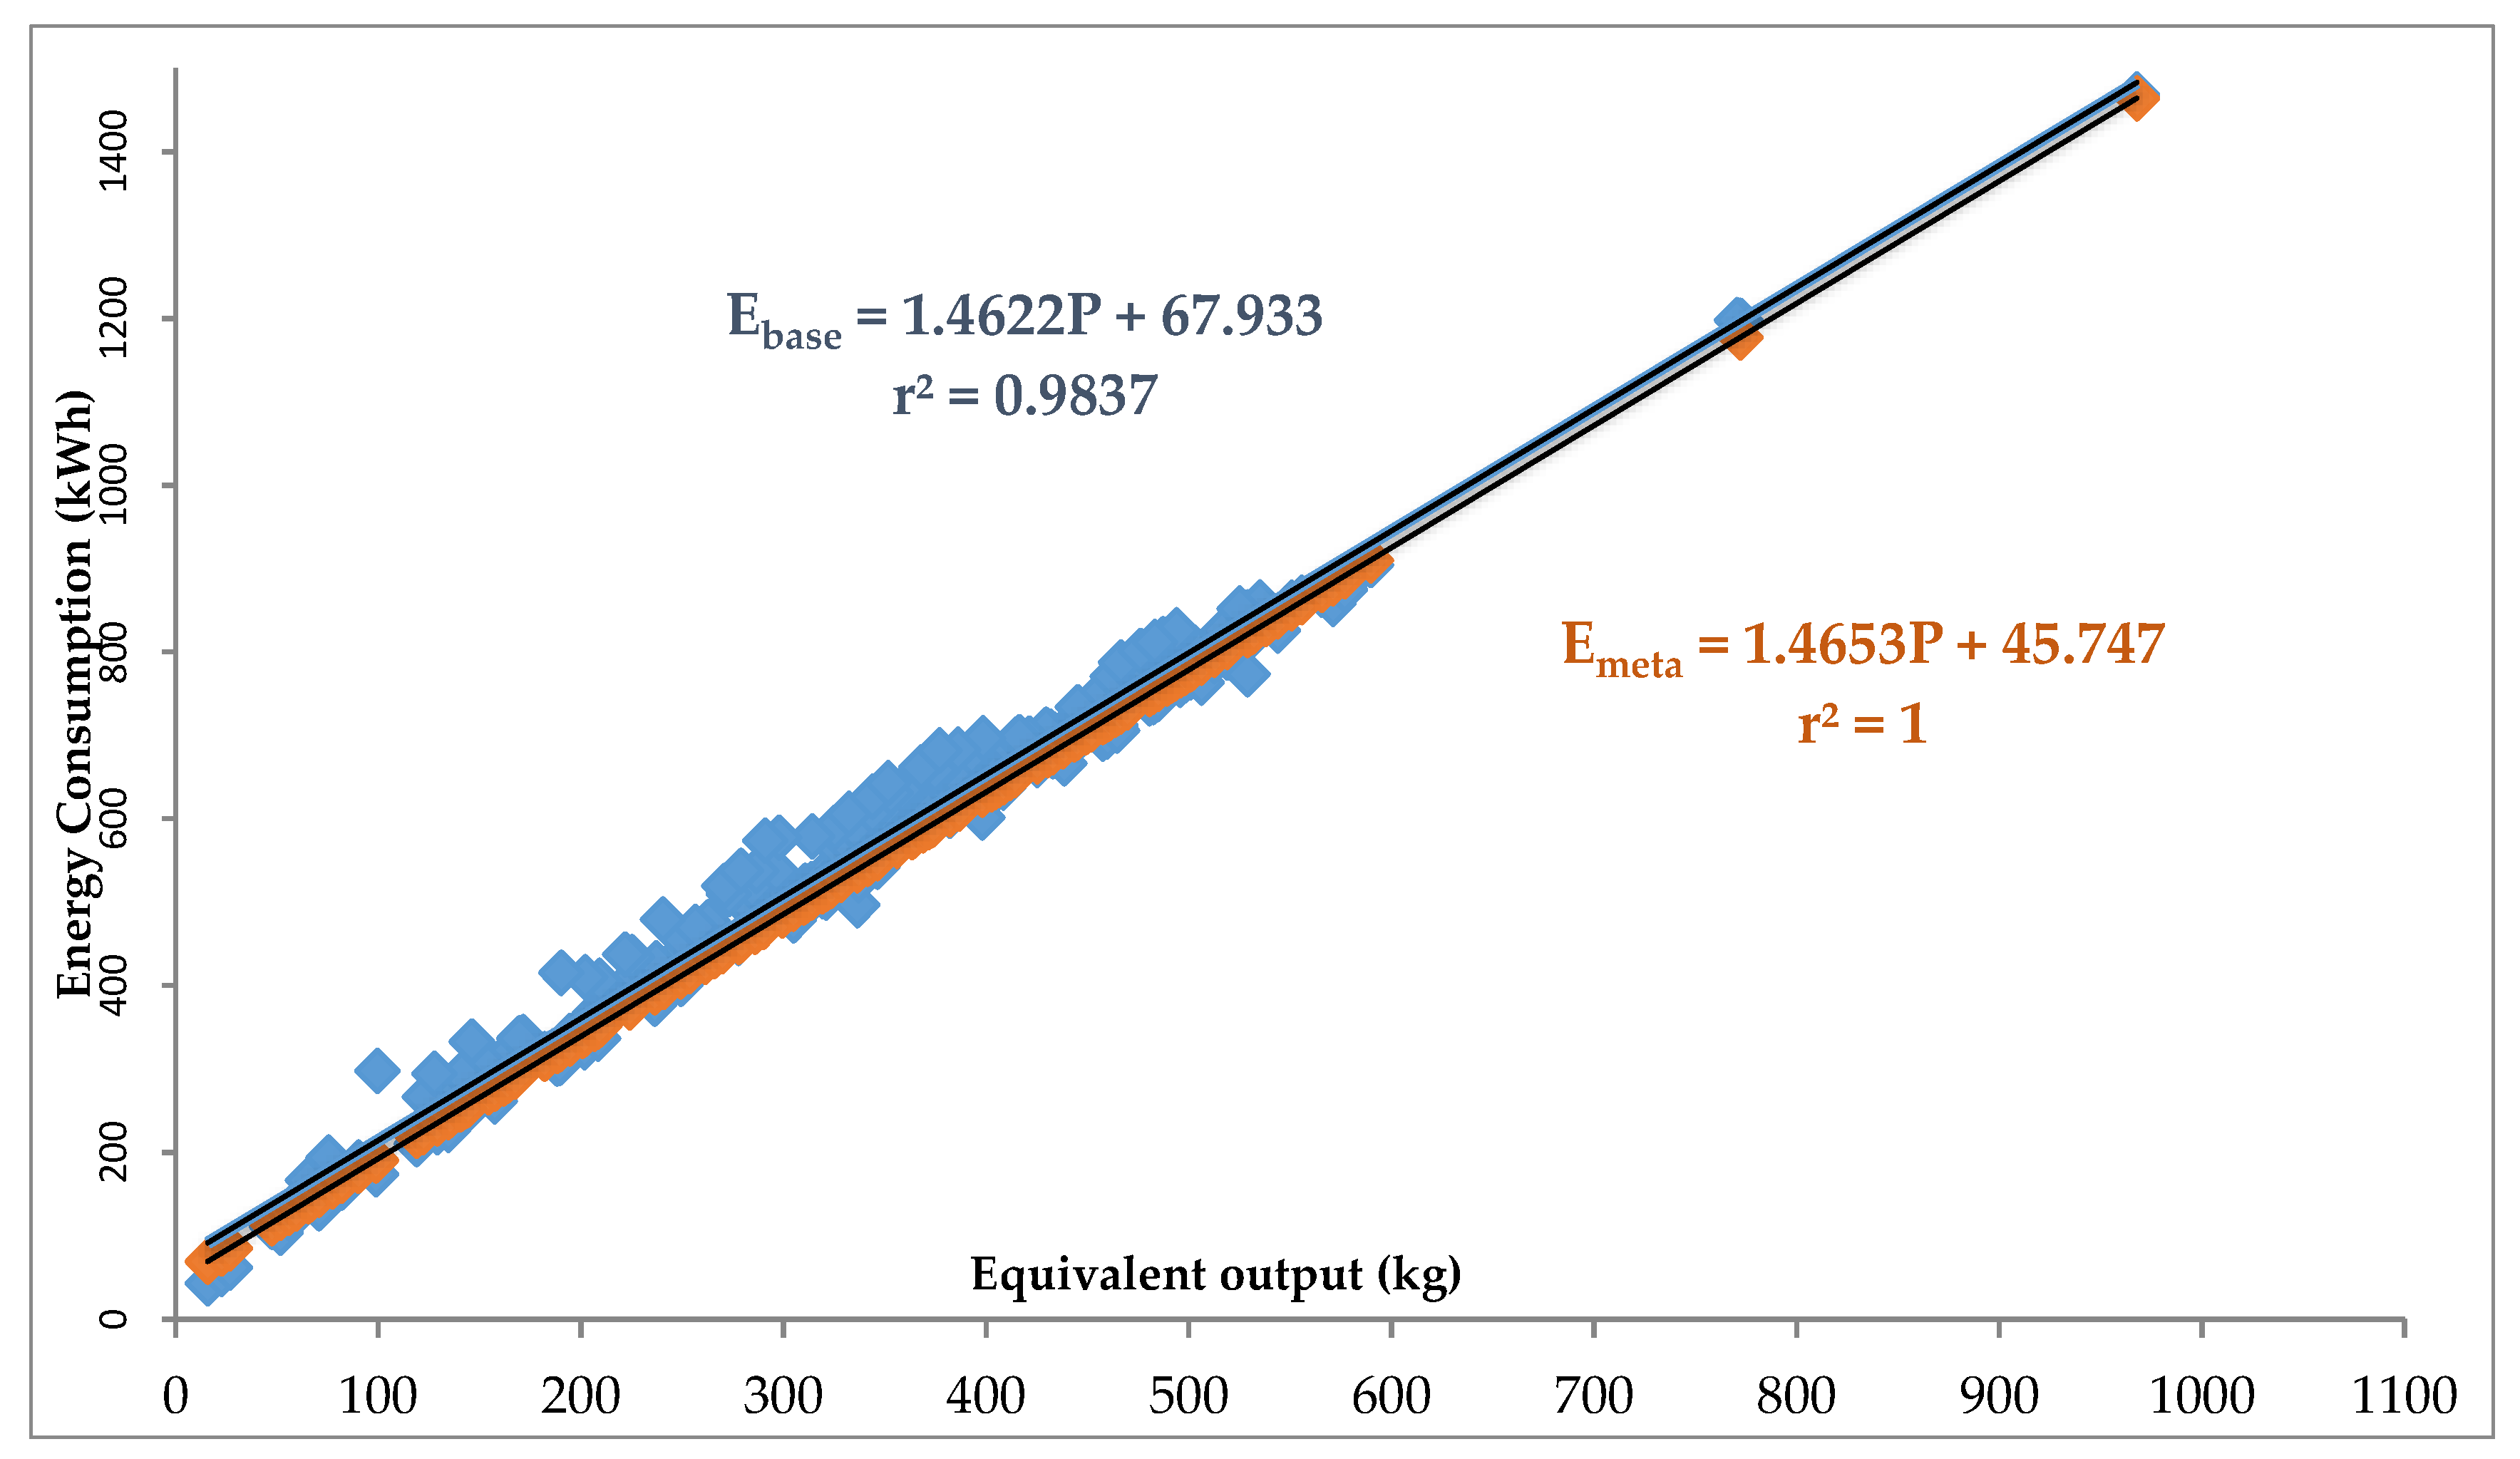
| Standard energy consumption | E = 1.4622Pequiv. + 67,9331 | 0.9837 | 1.4622P + 45.747 |
| Injection Molding Machine | Mold | Energy Baseline | Correlation Coefficient Ʀ2 | Target Line | |
|---|---|---|---|---|---|
| H-1 | Unstandardized Energy Consumption Equation | 0.769P + 1225 | 0.721 | - | |
| H241 | 0.5511P + 1937.5 | 0.8156 | 0.5511P + 1803.7 | ||
| H198 | 0.7882P + 1022.6 | 0.8419 | 0.7882P + 703.15 | ||
| H187 | 1.2325P + 888.93 | 0.9121 | 1.2325P + 644.42 | ||
| H007 | 0.7115P + 1523.4 | 0.6409 | 0.7115P + 1309.7 | ||
| H118 | 0.6985P + 1492.3 | 0.8489 | 0.6985P + 1315.7 | ||
| H447 | 1.0082P + 770.44 | 0.9959 | 1.0082P + 683.68 | ||
| H446 | 0.6504P + 1733.1 | 0.9719 | 0.5604P + 1689.1 | ||
| Standardized Energy Consumption Equation | 0.597P + 1830 | 0.864 | 0.597P + 1670 | ||
| H-17 | Unstandardized Energy Consumption Equation | 0.445P + 23.66 | 0.348 | - | |
| H377 | 0.5418P + 21.85 | 0.9024 | 0.5418P + 12.894 | ||
| H378 | 0.5871P + 12.708 | 0.9736 | 0.5871P + 8.6984 | ||
| H408 | 0.531P + 60.24 | 0.979 | 0.531P + 53.578 | ||
| H259 | 0.5838P + 36.849 | 0.9778 | 0.5838P + 27.669 | ||
| H292 | 0.1684P + 441.83 | 0.6115 | 0.1684P + 386.27 | ||
| Standardized Energy Consumption Equation | 0.5494P + 12.22 | 0.9985 | Negligible | ||
| I-11 | Unstandardized Energy Consumption Equation | 0.095P + 14.58 | 0.102 | - | |
| H329 | 0.0265P + 27.167 | 0.8035 | 0.0265P + 22.348 | ||
| H388 | 0.025P + 34.22 | 0.5972 | 0.025P + 26.681 | ||
| H197 | 0.022P + 29.474 | 0.6714 | 0.022P + 26.235 | ||
| H206 | 0.023P + 37.76 | 0.598 | 0.023P + 33.56 | ||
| H477 | 0.045P + 13.82 | 0.792 | 0.045P + 10.90 | ||
| Standardized Energy Consumption Equation | 0.0481P + 12.744 | 0.9386 | 0.0481P + 5.5258 | ||
| I-18 | Unstandardized Energy Consumption Equation | 0.721P + 351.1 | 0.427 | - | |
| H332 | 1.4611P + 51.866 | 0.9442 | 1.4611P + 22.51 | ||
| H429 | 0.9403P +155.79 | 0.8128 | 0.9403P + 93.822 | ||
| H246 | 2.2691P + 45.278 | 0.8388 | 2.2691P + 12.166 | ||
| H110 | 0.1277P + 594.42 | 0.7981 | 0.1277P + 581.89 | ||
| Standardized Energy Consumption Equation | 1.4622P + 67.933 | 0.9837 | 1.4622P + 45.747 |
© 2020 by the authors. Licensee MDPI, Basel, Switzerland. This article is an open access article distributed under the terms and conditions of the Creative Commons Attribution (CC BY) license (http://creativecommons.org/licenses/by/4.0/).
Share and Cite
Castrillón-Mendoza, R.; Rey-Hernández, J.M.; Rey-Martínez, F.J. Industrial Decarbonization by a New Energy-Baseline Methodology. Case Study. Sustainability 2020, 12, 1960. https://doi.org/10.3390/su12051960
Castrillón-Mendoza R, Rey-Hernández JM, Rey-Martínez FJ. Industrial Decarbonization by a New Energy-Baseline Methodology. Case Study. Sustainability. 2020; 12(5):1960. https://doi.org/10.3390/su12051960
Chicago/Turabian StyleCastrillón-Mendoza, Rosaura, Javier M. Rey-Hernández, and Francisco J. Rey-Martínez. 2020. "Industrial Decarbonization by a New Energy-Baseline Methodology. Case Study" Sustainability 12, no. 5: 1960. https://doi.org/10.3390/su12051960
APA StyleCastrillón-Mendoza, R., Rey-Hernández, J. M., & Rey-Martínez, F. J. (2020). Industrial Decarbonization by a New Energy-Baseline Methodology. Case Study. Sustainability, 12(5), 1960. https://doi.org/10.3390/su12051960