1. Introduction
In the last years, the most common grapevine (
Vitis sp.) diseases have significantly increased in Europe. This increase is partially due to the pathogen resistance developing over the years to agrochemicals products [
1] leading to a large use of conventional agricultural practices characterized by high inputs of fuel (heavy machine use) and electricity [
2]. Solutions leading to an increased sustainability in viticulture are highly desirable, therefore, it is crucial to adopt environmentally friendly methods able to reduce fungicides use and energy consumption. Therefore, in this context, the development and implementation of high-throughput phenotyping methods represents a key tool to acquire large quantity of data under controlled environments [
3,
4]. Indeed, plant phenotyping is the application of methodologies and protocols measuring plant structure or function, ranging from cellular to whole-plant levels [
5,
6].
Epidemics caused by powdery mildew (
Uncinula necator [Schw.] Burr., anamorph Oidium tuckeri Berk.) has drawn much attention due to the economic deficits it causes in terms of decreased yield, vine growth, winter hardiness, fruit and wine quality. Its primary infection has the need of at least 12–15 h of continuous wetness at 10–15 °C. To limit these problems, the crop responses to the disease should be investigated following both specific times and spatial scheduling according to the disease onset, growth stage and pathogen development [
7,
8]. In addition, this pathogen is currently controlled with repeated applications of fungicides leading to environmental pollution, resistant strains development, residual toxicity, and increased pathogen pressure over long period of time. Nowadays, sustainability is crucial within wine sector, as shown by the attention paid by the public opinion and sector operators. The fungicide treatments increase production costs while negatively affecting the environment, product quality and safety.
Therefore, recently, grapevines varieties resistant and/or tolerant to the most dangerous diseases, such as downy (
Plasmopara viticola) and powdery mildew, are gathering attention all over the producing countries [
9] to reduce the use of fungicide. To obtain durable field resistance, stacking resistance genes with different mechanisms, seems to be the only viable solution to this pathogen [
10]. Generally, these scopes are achieved through the genetics of quantitative traits, e.g., the adaption to abiotic or biotic stresses. Disease tolerant grapevine varieties are obtained by several generations of crossbreeds among
Vitis vinifera and not
vinifera. These new varieties, with about the 95% of the initial genome of
Vitis vinifera, exhibited a high level of tolerance to downy and powdery mildew due to the resistance gene not belonging to vinifera varieties. In this scenario, to identify a great number of genotypes, could be advantageous but often a limited approach due to time and cost [
11]. For these reasons, investigations using high throughput phenotyping methods could be a reasonable solution. Those techniques must include proper tools for data acquisition and appropriate algorithms to extract and to convert the large amount of these information [
12,
13].
The aim of this preliminary study is to identify the most tolerant cultivars to pathogen (i.e., powdery mildew) to reduce fungicides use and energy consumption through phenotyping approach in combination with advanced modeling techniques. The scope is to compare twelve grapevine varieties (i.e., ten disease tolerant grapevine varieties and two
Vitis vinifera cultivars) to assess those better tolerating the pathogen in terms of disease incidence, severity and first appearance. The concept of phenotyping was addressed, both in field with visual assessments, and as reported by Araus and Kefauver [
12], with physical tools such as algorithms, software and data processing management. A multivariate statistical approach allowed to create a metric index identifying the best tolerant cultivars in terms of disease incidence, severity and pathogen first appearance. The energy savings resulting from the increased efficiency of the use of fungicides is an innovative aspect investigated in the AGROENER project based on energy efficiency.
2. Materials and Methods
2.1. Plant Material and Data Collection
In spring of 2016, the CREA (Research Centre of Viticulture and Enology), located in Velletri (Central Italy, Rome), in collaboration with ARSIAL (Regional Agency for Development and Innovation of Agriculture of Lazio), implanted ten Italian tolerant cultivars. The experimental vineyard CREA is located in Velletri (Central Italy, Rome; 41° 40′ 12′’ N latitude, 12° 46′ 48′’ E longitude) at 332 m above sea level. The trials were made in 2019 using ten varieties obtained by several generations of backcrossing among
Vitis vinifera and not
vinifera, registered in the Italian National Grape Register 2015 [
14], and two
Vitis vinifera cultivars (i.e., Trebbiano Toscano (white grape) and Sangiovese (red grape);
Table 1). All the cultivars are conducted in trellised growing form with Guyot pruning system.
The plant density was set with a 0.9 m spacing of rows and 2.3 m within the rows (4000 vines per hectare) and was located on a south facing land. The randomized plot experiment was set as follows: 12 different cultivars (one row each), with three treatments, one “Untreated” and two treated with the same fungicide but at different timings and number of applications (“Treated 1” and “Treated 2”) and replicated three times within a plot of 50 m2 (50 plants for replicate).
All products were applied with a knapsack sprayer using compressed air as propellant. The sprayer was equipped with a gun and calibrated to apply a homogeneous volume at a constant pressure. The distance within the rows, the method of application, the equipment and the wind speed during the applications guaranteed the absence of drift and the contamination of the other rows.
The vineyard was carefully inspected once a week (for 6 weeks), from setting to beginning of ripening. The time of first appearance of powdery mildew lesions was detected. Random bunches were visually assessed from each replicate of the different classes (Untreated, Treated 1 and Treated 2) (for a total of 50 bunches per replicate).
The disease incidence was calculated as the total, minimum and maximum number of diseased bunches of the total number assessed (50) for replicate. The mean, minimum and maximum number of diseased grapes for each bunch (50 bunches per replicate), was also estimated to underline the disease severity. For each bunch was determined the percentage area occupied by powdery mildew. Visual assessments were carried out in accordance with the European and Mediterranean Plant Protection Organization (EPPO) guideline regarding the evaluation of fungicide efficacy on powdery mildew [PP 1/4(4)] [
15].
Moreover, a phenological observation was performed. The phenological stages were observed and defined in accordance with the international standard code BBCH [
16].
2.2. Climatic Data
Climatic data were taken from the ARSIAL weather station (RM10SPE, Cantina Sperimentale) positioned at the experimental vineyard CREA located of Velletri (Rome). For a general view of the weather conditions at the time of the treatments, the mean hourly wind speed at 10 m, the mean hourly wind speed at 2 meters (collected with a manual anemometer), the total hourly leaf wetness, the total hourly solar radiation, the mean hourly air temperature at 2 m and the mean hourly air humidity at 2 m of the days on which these treatments were carried out, was reported (
Table 2). Each treatment was carried out on the scheduled dates, at 07:00 a.m., and only when the weather conditions were favorable (i.e., wind <3 m/s and absence of leaf dew (leaf wetness) [
17].
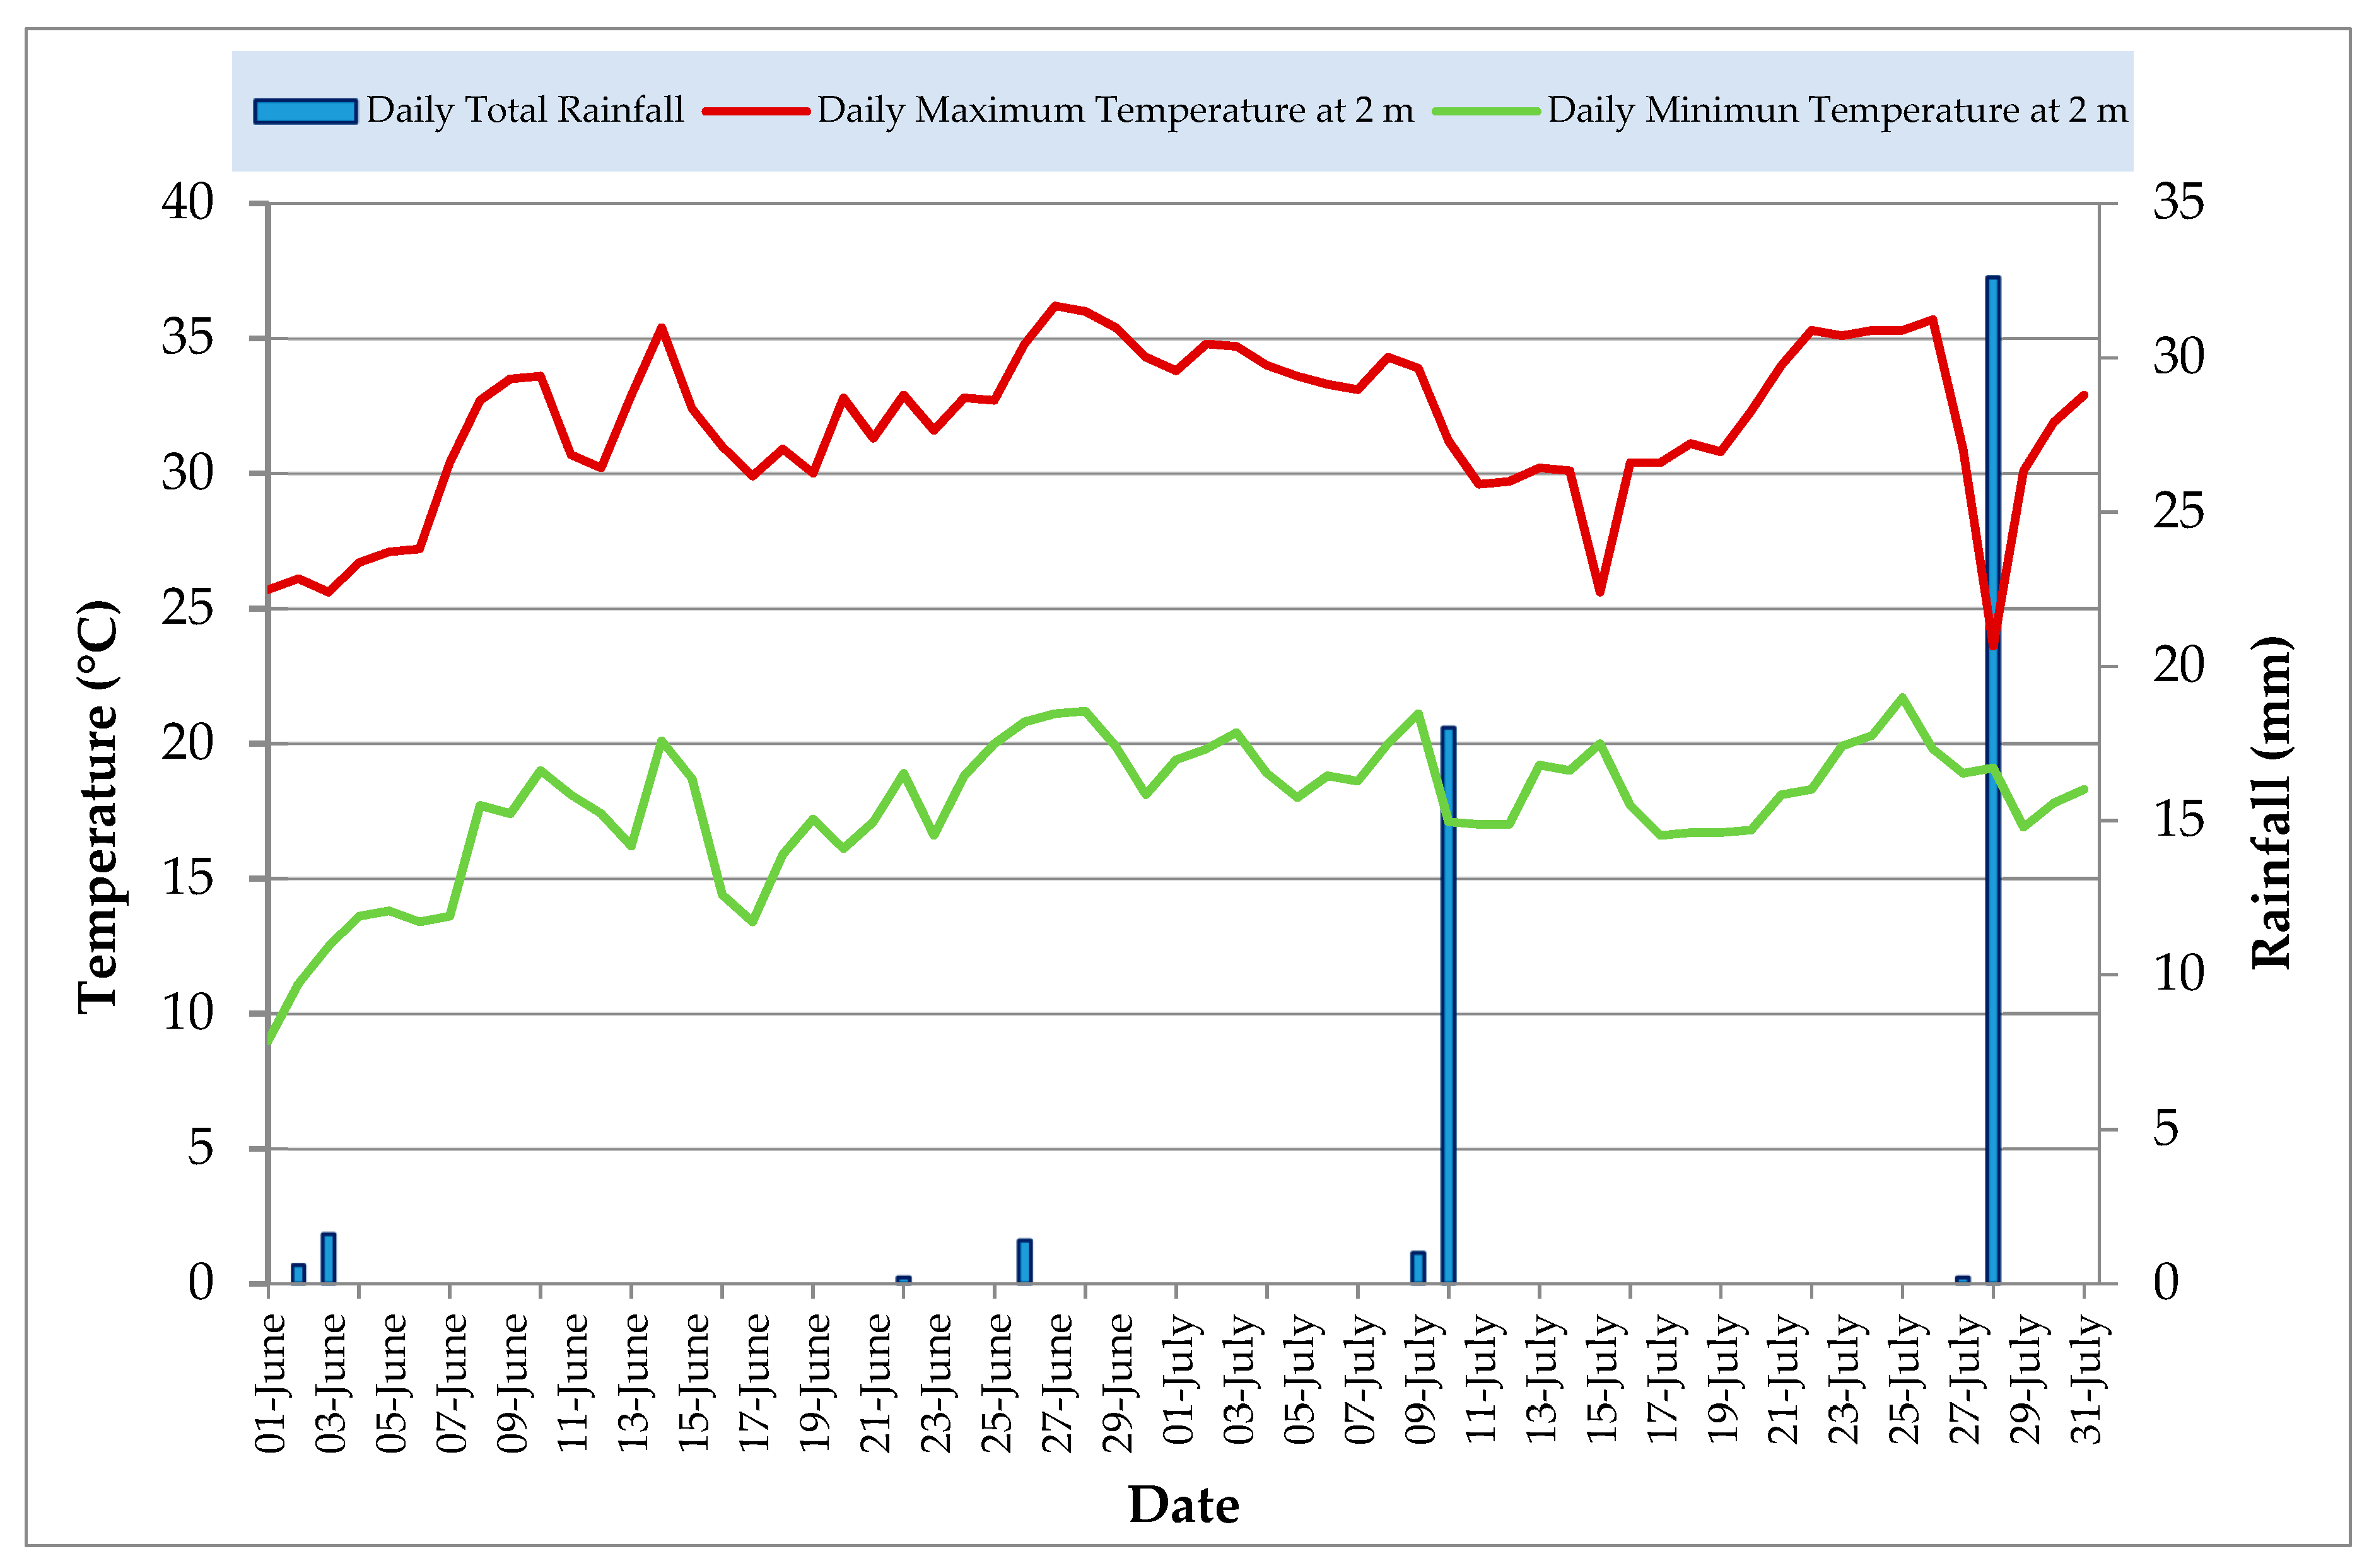
To evaluate the powdery mildew spread, the general environmental conditions and meteorological data of the assessment season (from 01 June to 31 July) were reported in
Figure 1 (i.e., daily total rainfall (mm), daily maximum and minimum temperature (°C) at 2 m).
From
Figure 1 it is possible to observe that June was dry and hot in the first part. In the second part of June and during July the relative humidity and temperature were favorable to the disease spread. In fact, from June, with the temperatures rising quickly there has been a rapid recovery of the phenological development; flowering for example occurred about 20–30 days late, with respect to the year before, but ended in less than a week. Even the phases from the grape’s growth, bunches closure and beginning of ripening were completed in a few days.
2.3. Dataset Construction
To visualize information useful to build, and successively analyze the dataset with multivariate statistical approach, two principal component analysis (PCA) were carried out. The PCA used the data regarding the disease incidence (total, minimum and maximum number of diseased bunches of the total number assessed) and the severity (mean, minimum and maximum number of diseased grapes of each bunch) belonging to each untreated classes, for 3 replicates per cultivar, six collection times and the first day of the pathogen appearance. Both the collection times and the first day of the pathogen appearance were expressed as Julian date (157, 164, 172, 179, 186 and 197).
An artificial model was constructed to identify the pathogen (i.e., powdery mildew) tolerant cultivars and therefore to reduce fungicides and energy consumption. The concept of artificial model has been developed by Abramo et al. [
18] and consists in combining fixed values of each variable (qualitative or quantitative) to cover the potential variability of a real dataset in a combinatory fashion. This dataset was composed by six independent quantitative and one qualitative variable. The quantitative variables were for the disease incidence the diseased bunches (total and maximum number on the total assessed) for six collection times; for the severity, the mean and maximum number of diseased grapes for each assessed bunch. The qualitative one was represented by the date (expressed as Julian date) of the first appearance of the powdery mildew.
Table 3 reports the fixed values for each independent variable used for the construction of the artificial dataset. These values were calculated on the optimum (low values of disease incidence and severity at a late date for the quantitative variables and high appearance values at a late date for qualitative ones) and on the base of these real observations, this dataset covered the most realistic range of observations. The total combination of these fixed values determines a total of 126 artificial records. The table did not show the constant values (i.e., the visual assessments without the pathogen appearance).
2.4. Multivariate Statistical Analysis
To identify the most tolerant cultivars to the powdery mildew in term of disease incidence and severity were built two Soft Independent Modeling of Class Analogy (SIMCA) [
19,
20,
21] models (single class modeling approach) [
22,
23]. These were created on the Artificial dataset and tested on the three classes (Untreated, Treated 1 and Treated 2).
SIMCA, computed with the software V-Parvus 2010, is a collection of Principal Component Analysis (PCA) models (NIPALS algorithm), one for each class of dataset (one in this case), after a separate category autoscaling. SIMCA cross validates the PCA model of each class (training set), splitting the data (evaluation set) into 4 contiguous groups (cross validation groups). In this case, the modified model with expanded range was used in substitution of the first one introduced by Wold and Sjöström [
19]. The procedure to build the model was reported by Zanetti et al. [
23]. The efficiency was evaluated by classification (training set) and prediction (evaluation set) matrices, which reported the percentage of correct classification for each considered class. SIMCA also expressed the statistical parameters indicating the modeling efficiency. Unknown objects could be either classified into the class or recognized as outliers. The modeling efficiency was indicated by sensitivity. This is the measure of how well the model correctly identifies the cases really belonging to the class. The modeling power for each variable, which represents the influence of that variable in defining the model, was expressed.
To visualize a metric index for pathogen tolerant cultivars, in term of disease incidence and severity for the 12 cultivars analyzed, square SIMCA distances were linearized converting the mean and maximum values into a logarithmic scale and then translating them by adding a certain value in order to have all positive values. To avoid overfitting, only 94 out of 126 artificial samples (75%) were used to construct and cross-validate each SIMCA model. The remaining 32 samples together with all the other classes samples have been used to test the performance of each SIMCA models. The partitioning of the artificial datasets was optimally chosen with Euclidean distances, based on the Kennard and Stone [
24] algorithm that selects objects without a priori knowledge of a regression model (i.e., the hypothesis is that a flat distribution of the data is preferable for a regression model). The samples were class-modelled on the base of the two artificial models of SIMCA. The two trained generalized regressions neural network (GRNN) were tested on 108 different samples (divided into the 3 classes (36 samples for class) Untreated, Treated 1 and Treated 2) affected by powdery mildew expressed as disease incidence and severity (external test) respectively, for the classification of the tolerant cultivars for fungicides reduction purpose. The GRNN models’ performances on the external test set were calculated.
3. Results
The results in this section were reported firstly for to disease incidence and then for disease severity. Each of these two sub-sections presented the PCA, useful to visualize information to build, and successively analyze the dataset with multivariate statistical approach. Subsequently, the SIMCA to identify the most tolerant cultivars (shown in the table) to the powdery mildew creating an Artificial dataset and testing the three classes (Untreated, Treated 1 and Treated 2) was shown. Finally, the most important variables in terms of weight for the metric index SIMCA construction for pathogen tolerant cultivars were displayed.
The importance to analyze both the disease incidence and the severity, concerns that these two parameters provide a complementary global vision of the disease pressure, showing the efficacy of the genetic resistance of the new varieties at the disease attack. The incidence shows the permeability of the genetic defense against the disease, and the severity shows the ability of the disease to spread on the bunches.
3.1. Disease Incidence
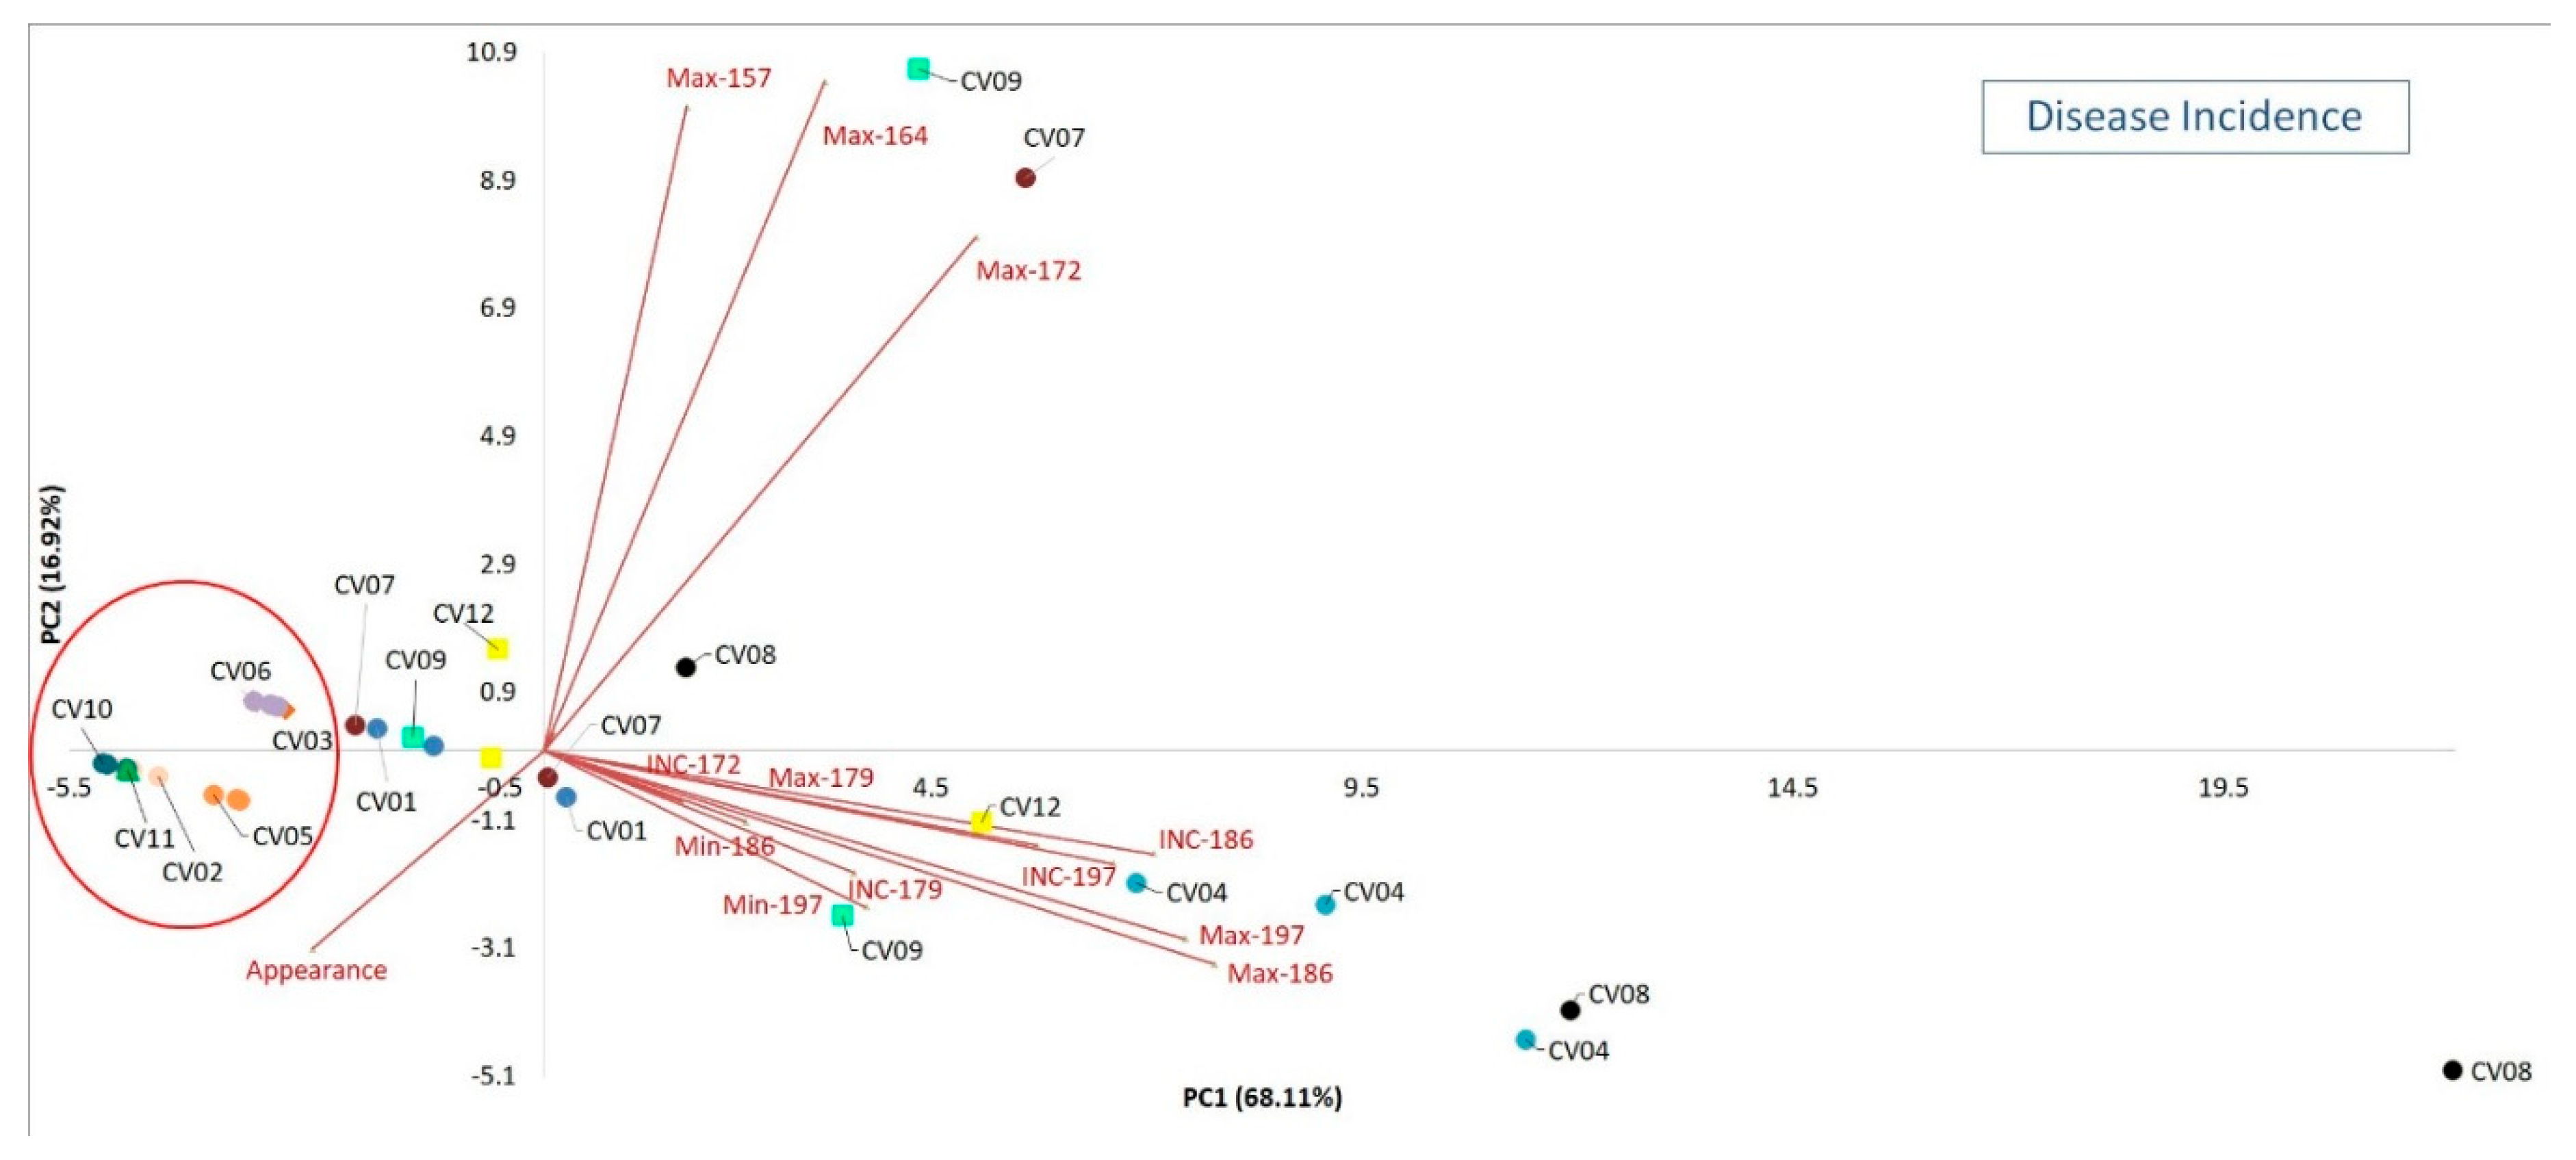
Starting from disease incidence,
Figure 2 shows the biplot of the PCA exploratively performed on total, minimum and maximum number of diseased bunches of a total number assessed (50) for replicate for six collection times and on the first day of the pathogen appearance.
It is possible to observe as in correspondence with the lower values of PC1 (68.11% of explained variance) are positioned the cultivars CV02, CV03, CV05, CV06, CV10 and CV11. These presented the lower disease incidence values (total, minimum and maximum) representing the best cultivars with respect to the cv at the higher PC1 values (CV04, CV07, CV08, CV09, CV12) in term of pathogen tolerance. The CV01 has an intermediate position. This is also true for the date of appearances that resulted the higher at the negative side of PC1. These cultivars resulted the best and, from a phenotyping point of view, presented a low pathogen infection (few bunches affected) in a late date (pathogen first appearance) with respect to the others.
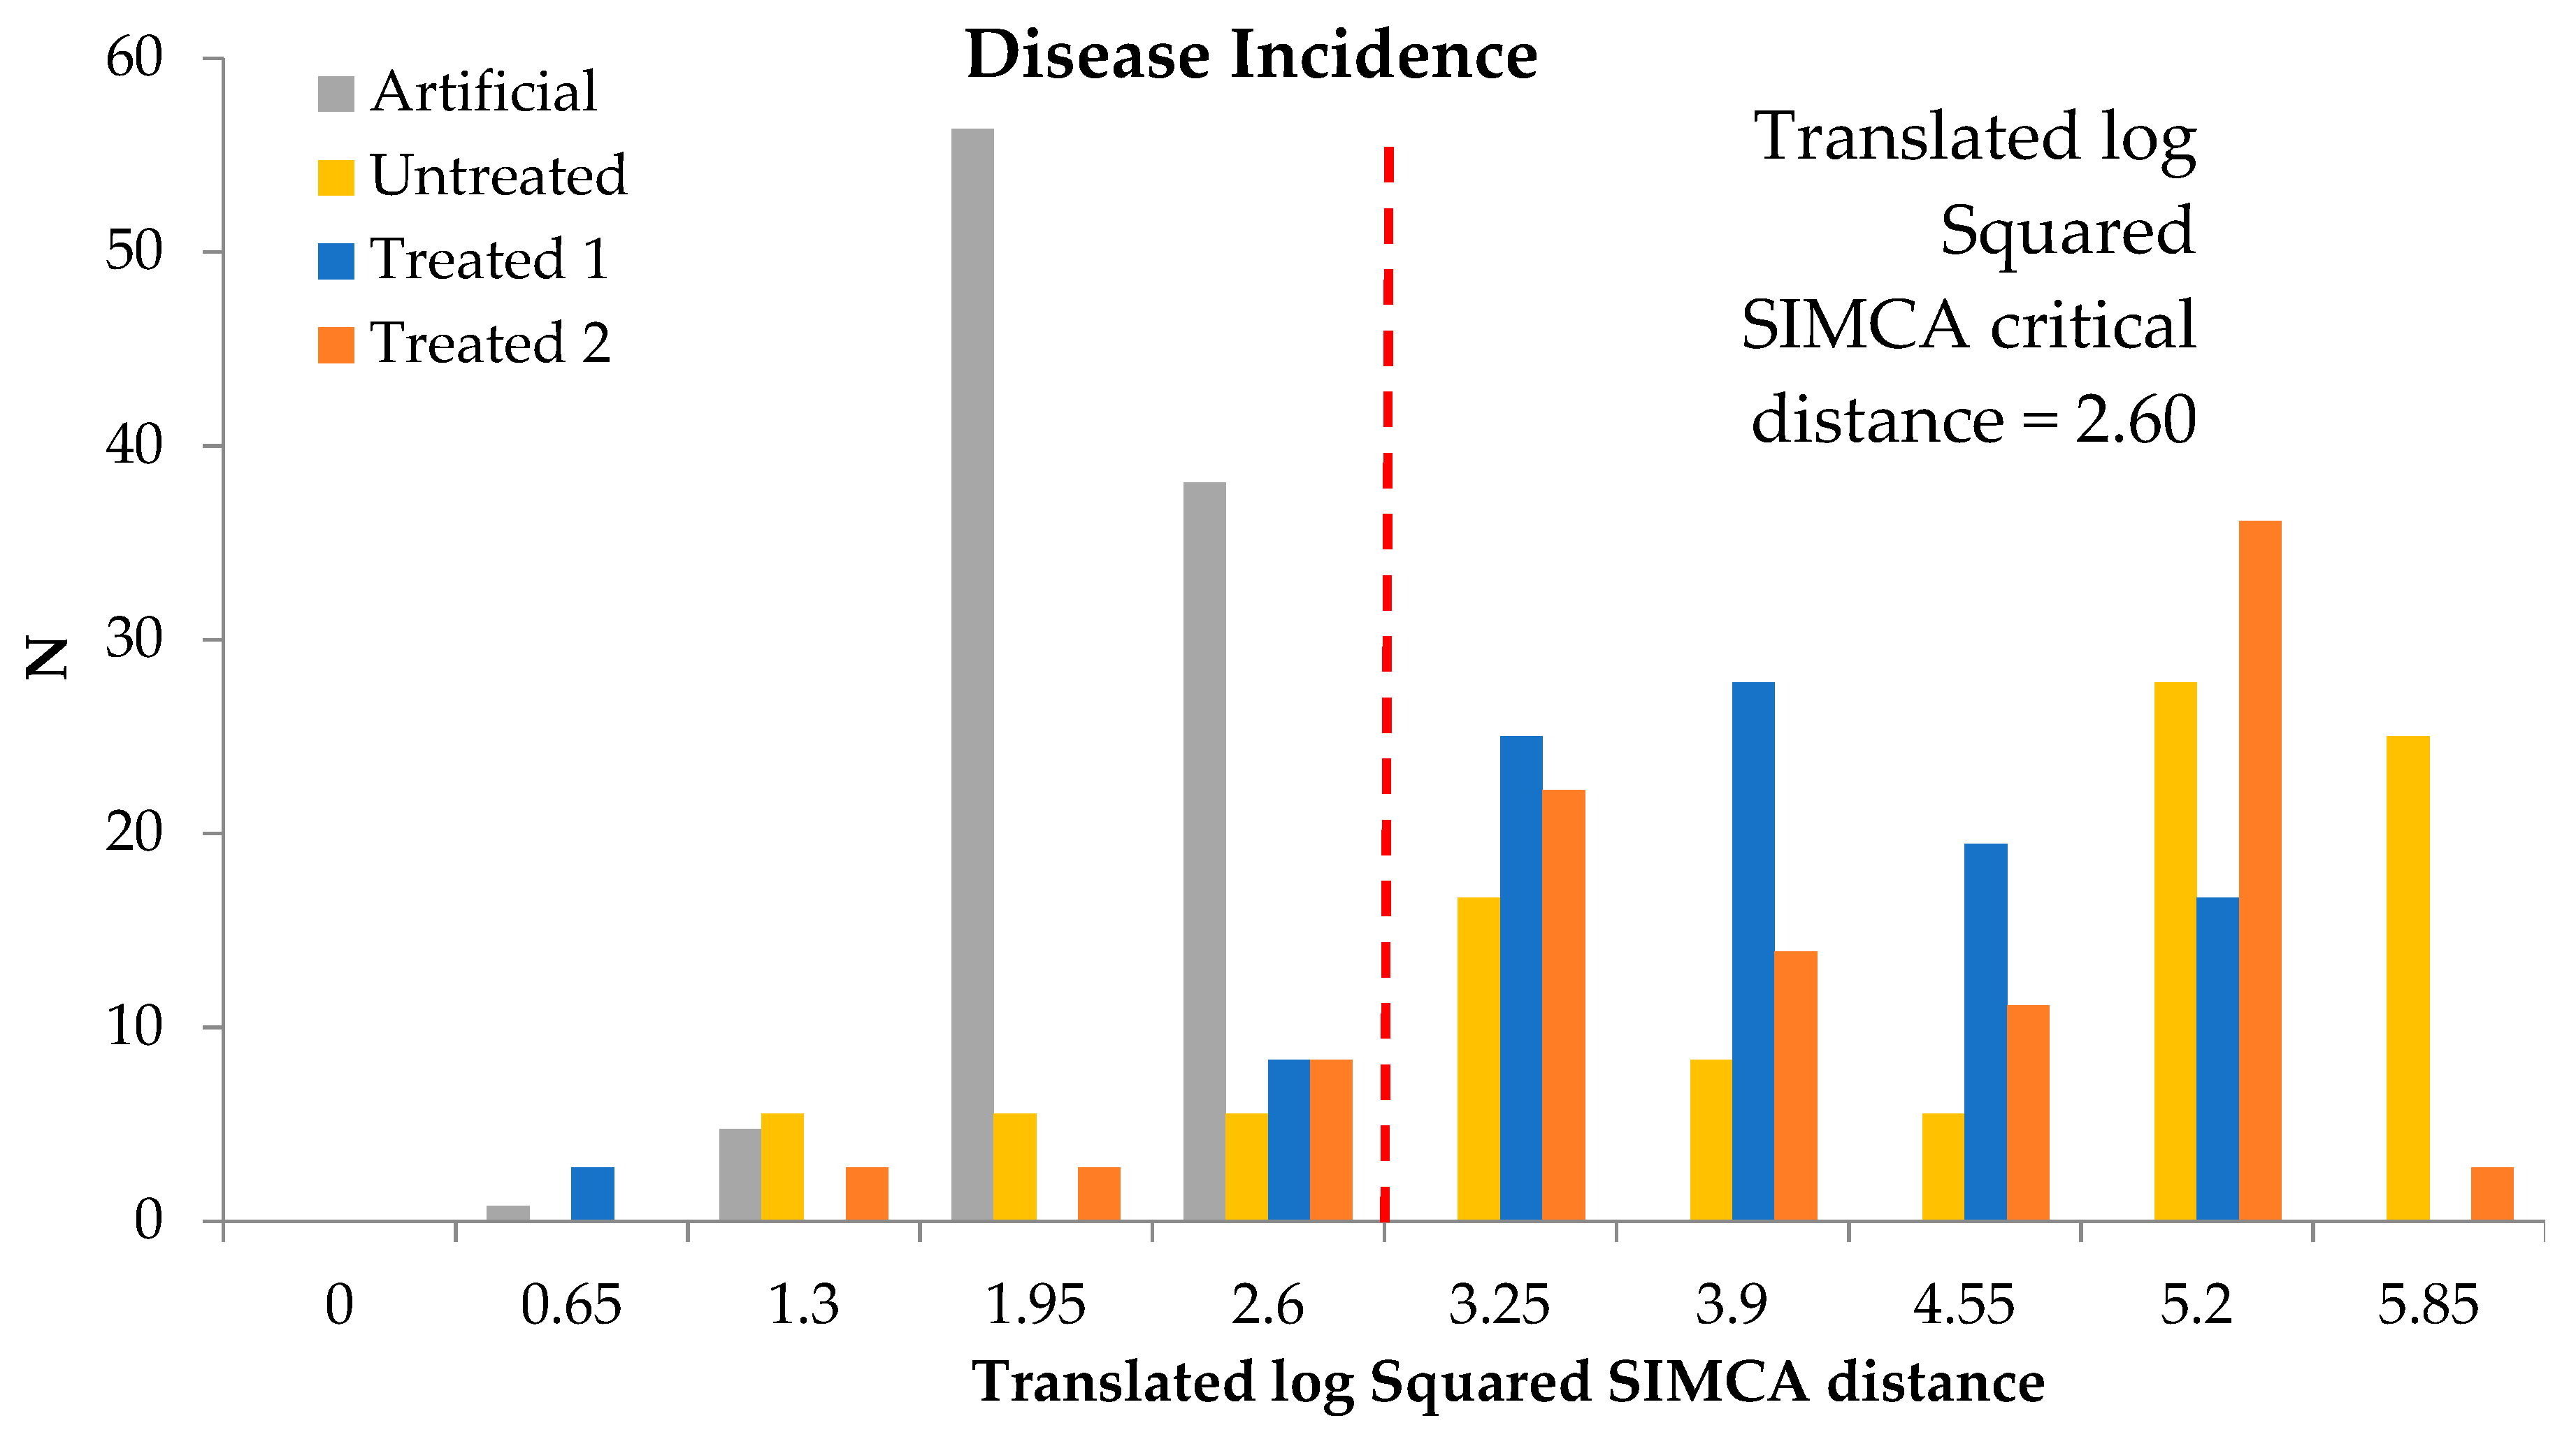
Figure 3 shows the SIMCA model performed on total and maximum number of diseased bunches of a total number assessed for the classification of disease incidence with a square critical distance equal to 2.60 indicating that a sample belonged to a cultivar with a SIMCA distance lower than the critical distance (i.e., 95% confidence interval) is considered having the best quality by the model. The disease incidence is checked on the samples divided into the 4 classes: Artificial, Untreated, Treated 1 and Treated 2. The modeling efficiency, indicated by sensitivity value, was equal to 100%. In fact, all artificial samples, either in validation and internal testing, are included within the model. The samples of the other classes (Untreated, Treated 1 and Treated 2) are partially overlapping.
To better identify samples belonging to the cultivars with SIMCA distance values lower than the critical distance (i.e., within the model graphically reported in
Figure 3) for disease incidence classification for the three tested classes (Untreated, Treated 1 and Treated 2).
Table 4 reports these values. These cultivars are the best performing in terms of tolerance to the pathogen.
Table 4 highlighted that the CV02, CV03, CV06, CV10 and CV11 are the same best found in the PCA (
Figure 1).
Figure 4 shows the variables weight for the SIMCA construction in term of disease incidence. The most important variables resulted to be the first day of pathogen appearance and the maximum values of disease incidence in the Julian date 186 and 197. In this case, the model confirmed that for tolerance scouting, the most influential variables are the first appearance and the maximum expression of the pathogen (late dates) in terms of disease incidence.
3.2. Disease Severity
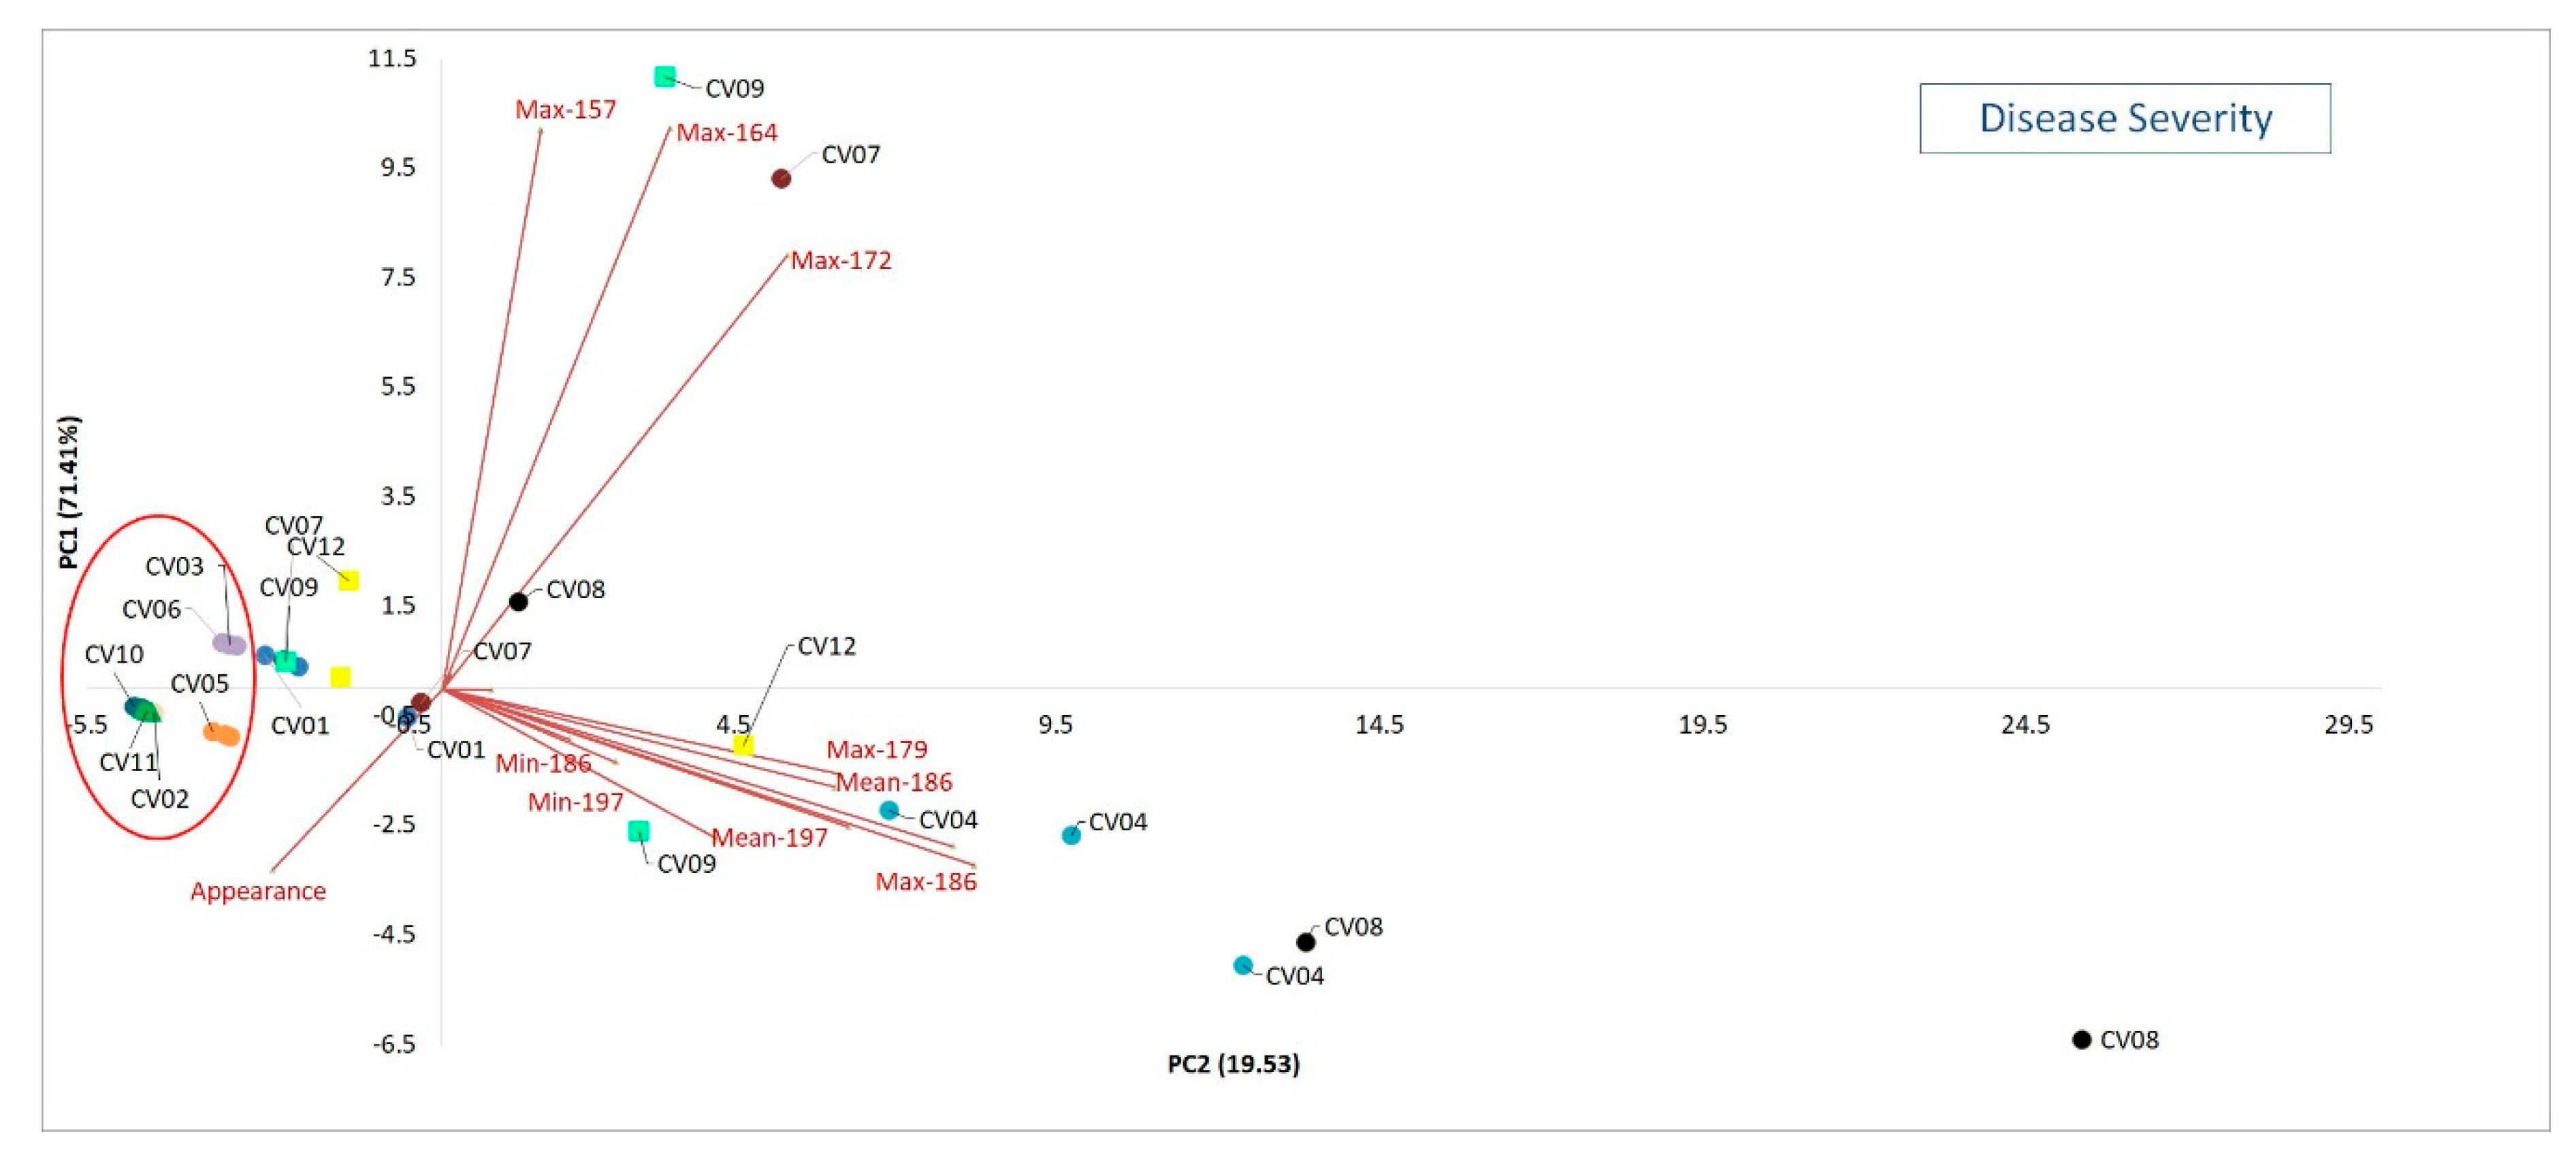
Moving on to results relative to the disease severity,
Figure 5 reports the plot of the PCA on mean, minimum and maximum number of diseased grapes of each bunch for six collection times and on the day of the pathogen first appearance.
Additionally in this case, in correspondence with the lower values of PC1 (71.41% of explained variance) are positioned the same cultivars of the previously exposed PCA (i.e., CV02, CV03, CV05, CV06, CV10 and 11). These presented the lower disease severity (mean, min and max) values representing the best cultivars with respect to the cv at the higher PC1 values (CV04, CV07, CV08 and CV09). The CV01, also in this PCA, is middle positioned on the axis.
The date of appearances resulted the highest at the negative side of PC1. This means that the best pathogen tolerant cultivars are those presenting, on a late date compared to the others, the least number of infected grapes.
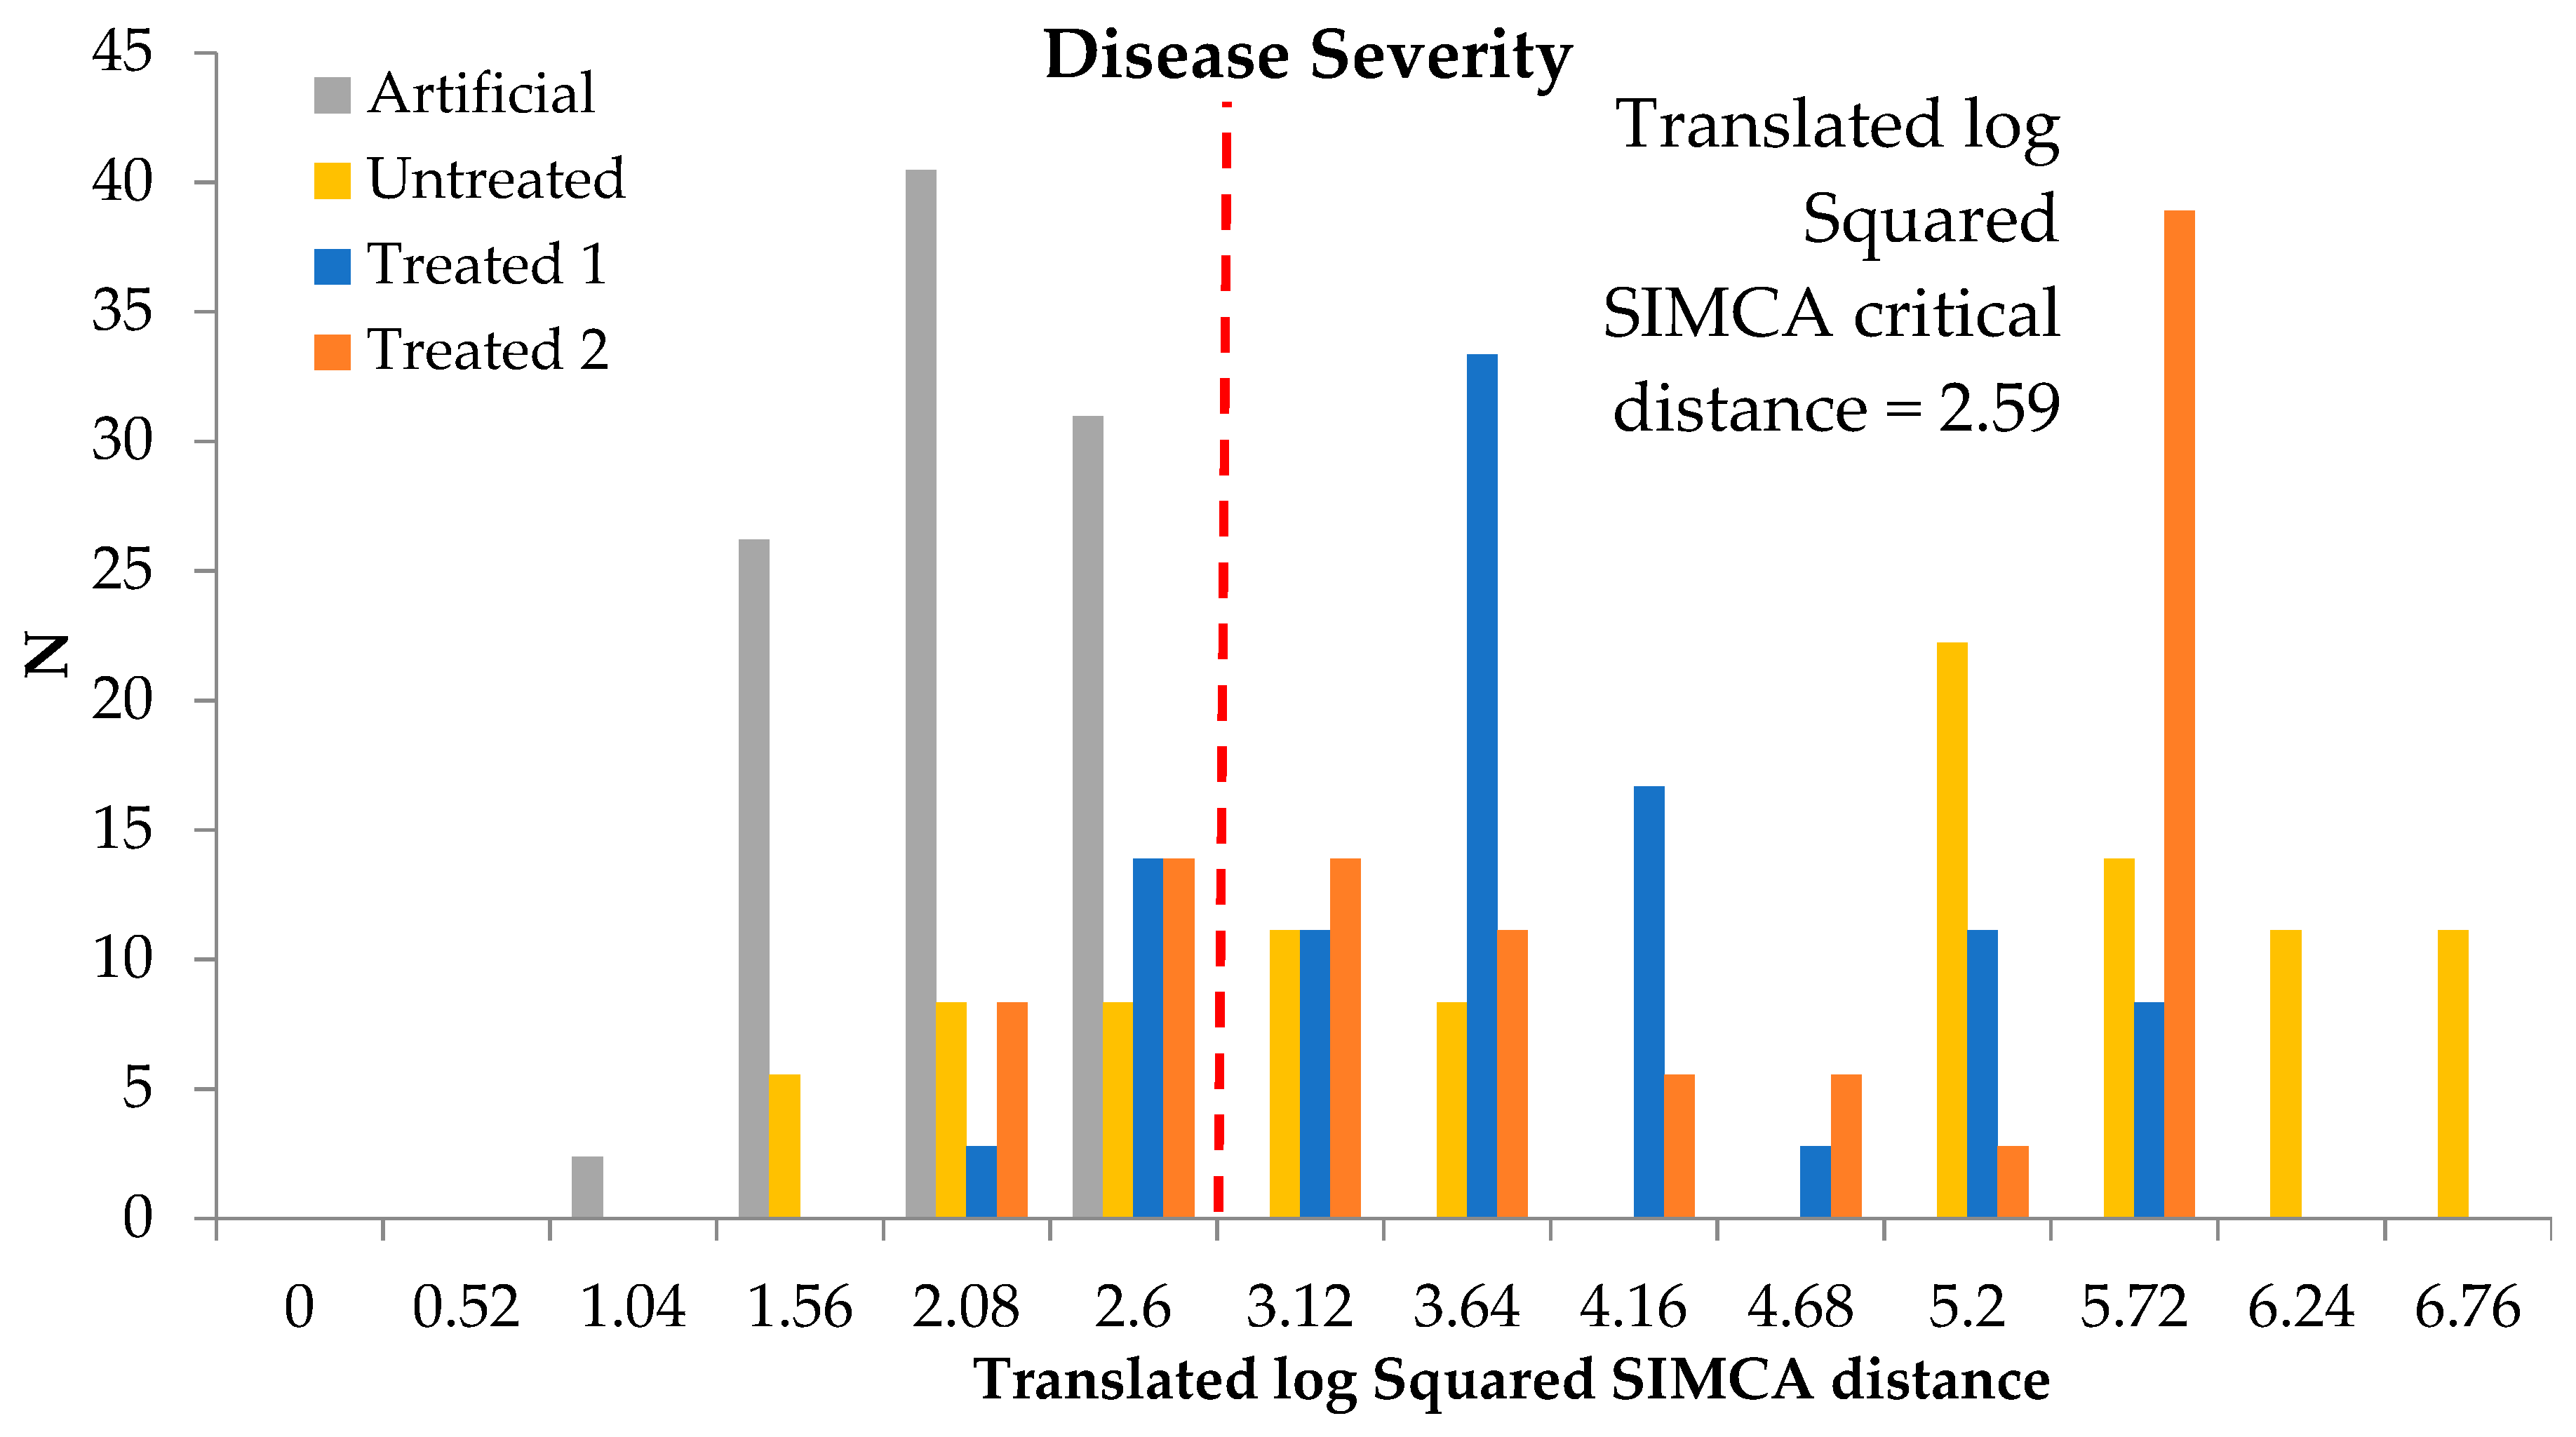
Figure 6 reports the SIMCA model performed on mean and maximum number of diseased grapes of each bunch with a square critical distance equal to 2.59. Additionally in this case, the modeling sensitivity was equal to 100% (all artificial samples, either in validation and internal testing, were included within the model).
To better define the best cultivars in term of pathogen tolerant,
Table 5 reports samples with SIMCA distance values lower than the critical distance (i.e., within the model graphically reported in
Figure 6) for disease severity classification and the three classes (Untreated, Treated 1 and Treated 2).
Table 5 confirms the PCA results for CV02, CV03, CV06, CV10 and CV11.
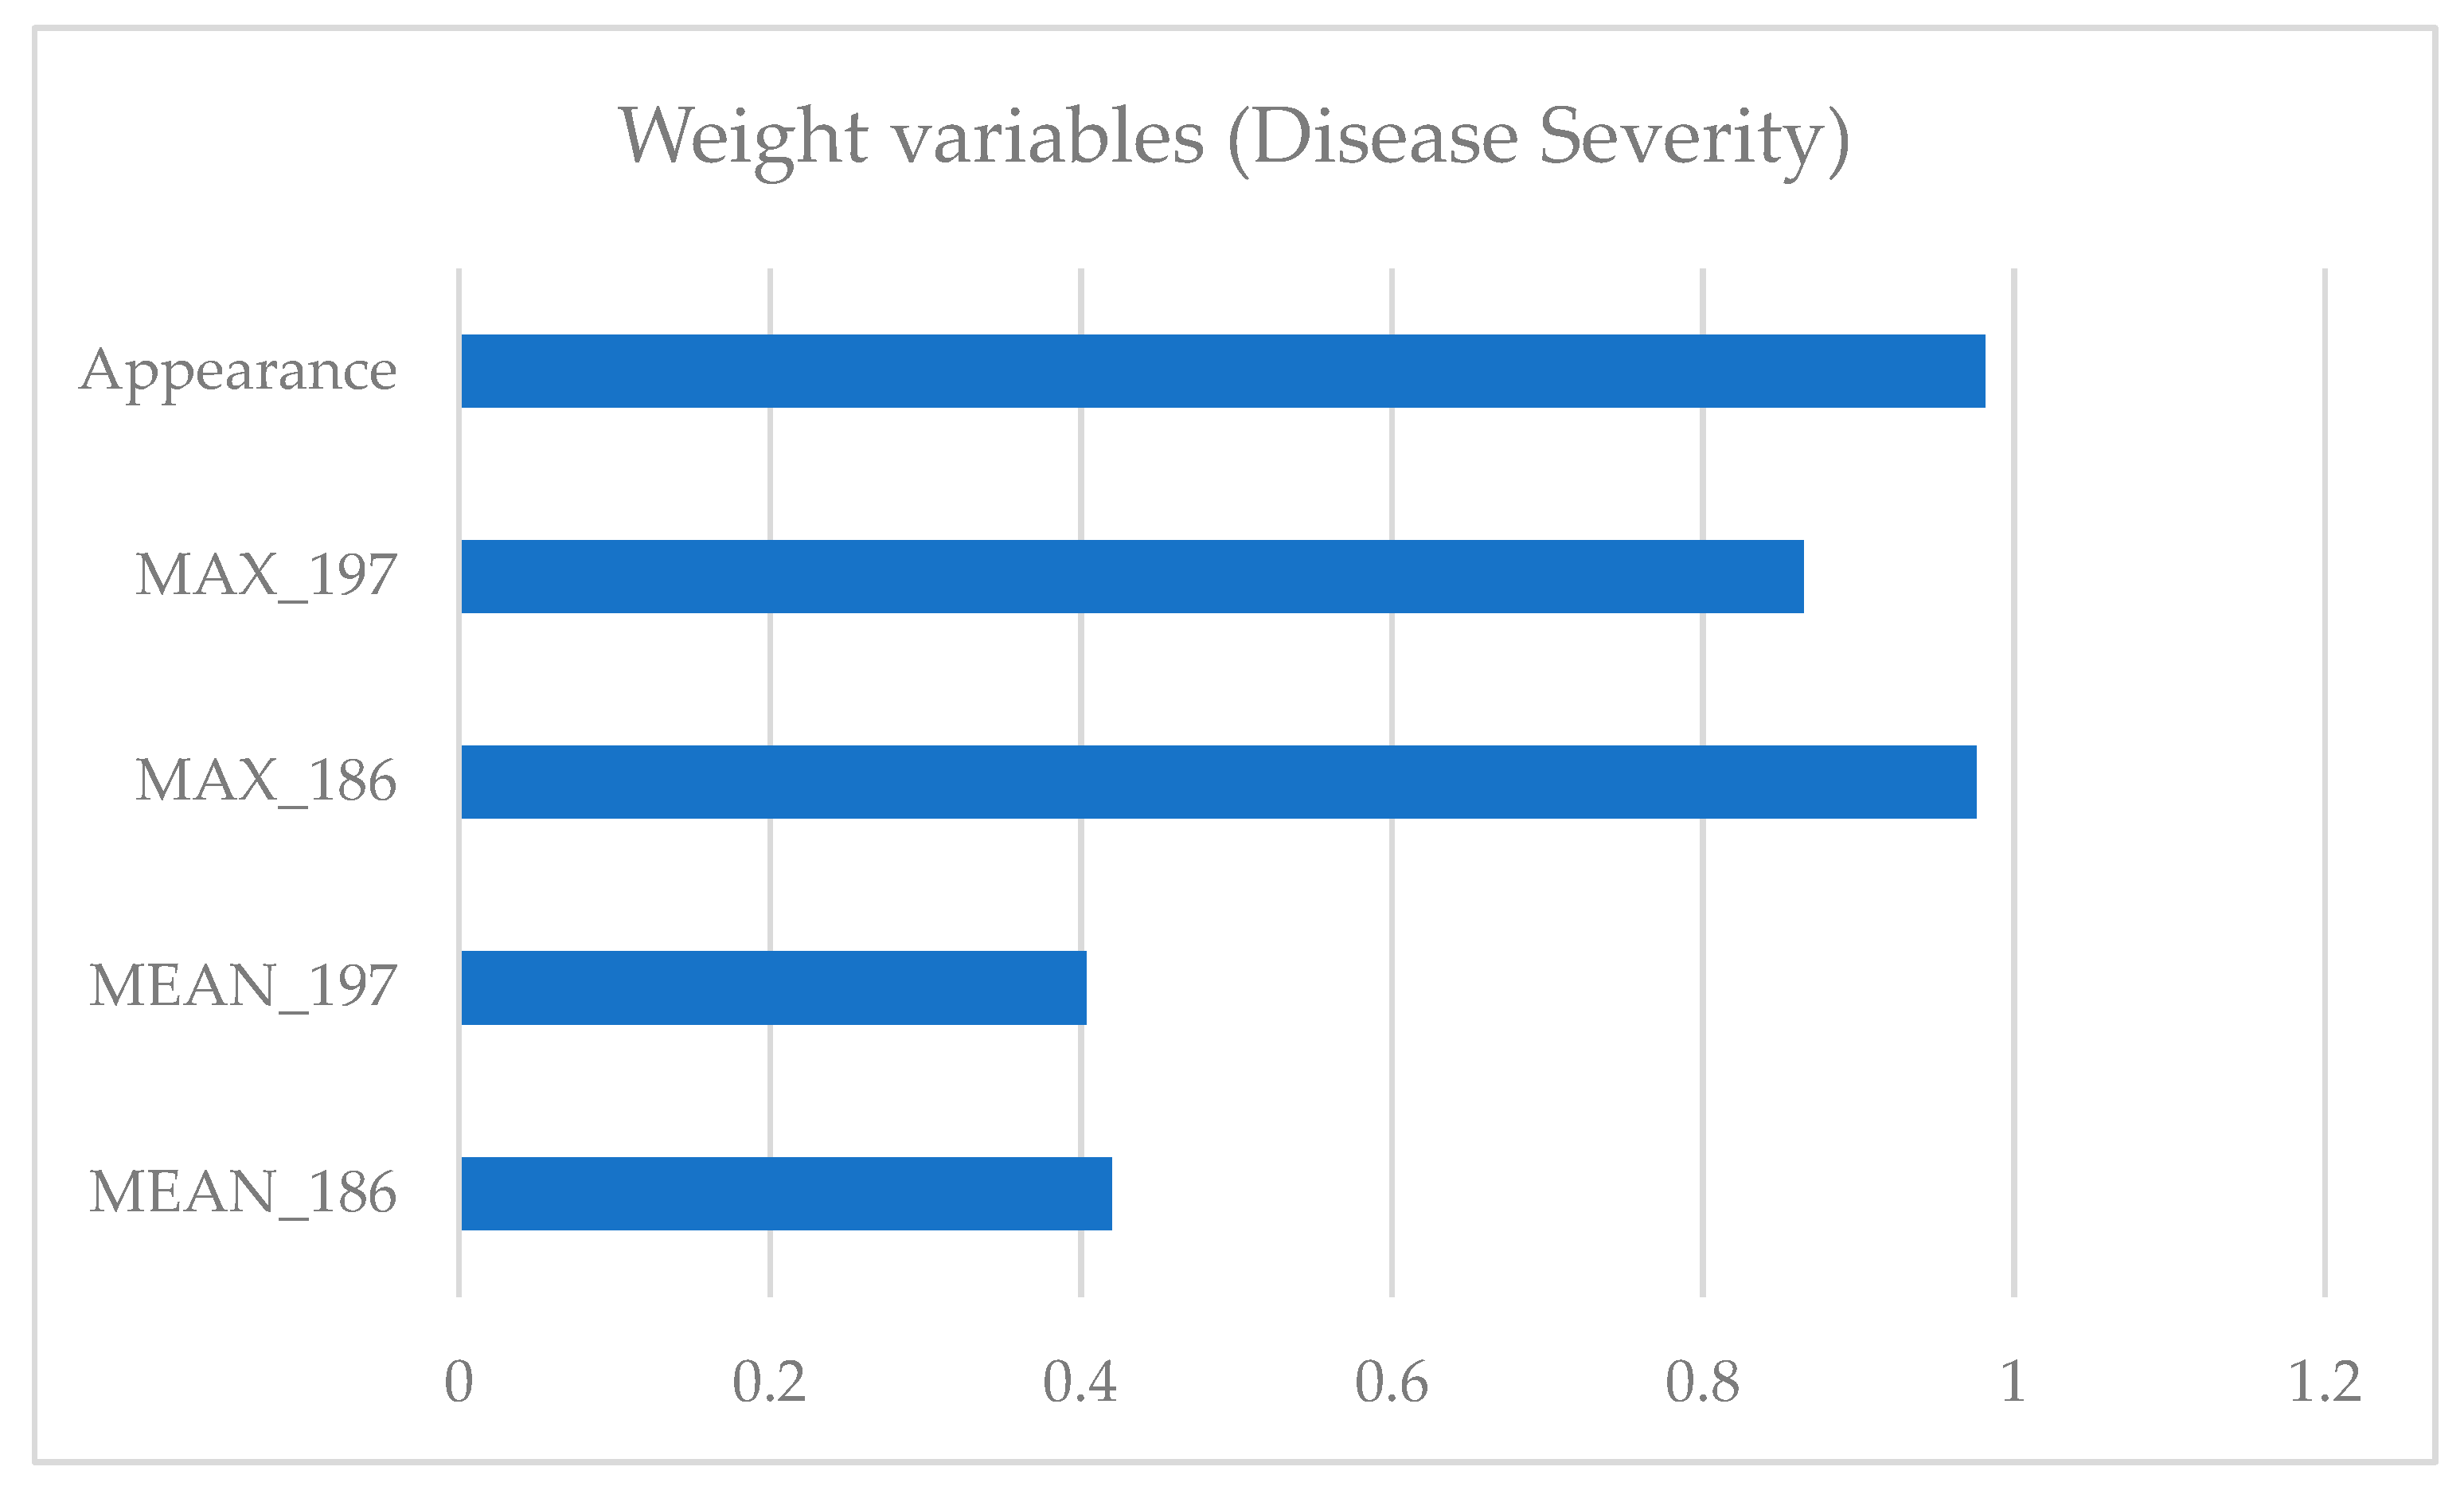
Figure 7 shows the weight variables for the SIMCA construction in term of disease severity. As for the disease incidence model, the variables most important resulted to be the first pathogen appearance and the maximum values of disease severity in the Julian date 186 and 197.
4. Discussion
In this study, ten disease tolerant grapevine varieties were tested. These were obtained by several backcrossing between
Vitis vinifera and not
vinifera, registered in the Italian vine variety catalog 2015 (
Table 1) and two
Vitis vinifera cultivars (i.e., Trebbiano Toscano and Sangiovese) to identify the most tolerant to powdery mildew and consequently to observe the agronomic behavior of these vines. These were introduced in a south and warm environment, as “Castelli Romani” (Central Italy, Rome). The scope is to compare all these cultivars, regardless of their genetic origin, to visualize those that best tolerate the pathogen in terms of disease incidence, severity and first appearance. The importance to analyze both the disease incidence and the severity, concerns that the incidence could provide an index of how many bunches per cultivar are infected while severity, verifying the percentage of grapes affected in each bunch, could provide a valuable tool to contain the disease [
25]. During the experiment, no climatically accident occurred. The climatic conditions gave a delay to the powdery mildew disease appearance: May was cold (in particular during the night), meanwhile June was dry and hot in the first part and only in the second part of the month and during July the moisture and temperature were favorable to the disease spread. In addition, during this last period, there was little rain. Willocquet and Clerjeau [
26] reported as the spread of spore dispersal occurred during a period of consecutive days with no rain.
As reported by Williams and Ayars [
27], grapevines are one of the world’s most economically important horticultural crops. In recent years, much effort has been made to challenge the rapid increase of the most common pathogens (e.g., powdery and downy mildew), that create serious consumption in terms of production [
4]. As reported by Willocquet and Clerjeau [
26], grapes powdery mildew conidia are not easily removed under natural conditions, forcing a great use of preventive fungicides against this pathogen to limit the spore dispersal and deposition.
In this context, precision crop protection strategies, such as phenotyping, result in potential reduction in pesticide use potentially reducing the energy consumption as well, the relative economic expense and the whole ecological impact of the agricultural crop production system [
28]. Nowadays, agricultural pathogen research programs need to phenotype a great number of samples for several traits during the pathogen growth cycle [
29]. This challenge to phenotype multiple traits and large populations is necessary for a prompt action aimed at reducing the use of fungicides. Due to its objective importance, intensive researches are currently moving on automated high throughput plant phenotyping [
30,
31].
Phenotyping, including physical tools, algorithms, software and data processing environment, could represent a feasible solution to identify a great number of samples saving time and costs. The knowledge of crops behavior in response to a given pathogen, is an excellent preventive strategy to reduce spraying costs and the negative effects of spraying [
32]. Breeding studies to improve tolerance and resistance were initiated just to reduce the use of these fungicides in new cultivars.
For this work, the application of the phenotyping method represents a potential solution to reduce fungicides and energy consumption, by comparing a great number of different grapevines phenotypes and anticipating, in the future, several targeted defense strategies allowing a lower use of fungicide and the consequent lower energy loss (e.g., reduced fuel consumption). In these terms, the construction of an artificial dataset characterized by absolute optima from the point of view of response to the pathogen (i.e., low values of disease incidence and severity at late date for the quantitative variables and high appearance value at late date for qualitative one) allowed to cover the potential variability of a real dataset in a combinatory fashion. In this preliminary study, the statistical multivariate classification performed by SIMCA identified some of these tolerant cultivars (for the disease incidence: Fleurtai, Merlot Kanthus and Julius; for the disease severity: Fleurtai, Soreli, Merlot Kanthus and Julius), following the indications provided by the artificial dataset, as the better responding to the powdery mildew (for both incidence and severity disease). Moreover, the PCA shows as the Vitis vinifera (Trebbiano Toscano and Sangiovese) cultivars presented a lower tolerance compared to those selected for this scope. The observations made in field have been confirmed by the classification carried out through SIMCA.
The acquisition of phenotypic data in grapevine research is almost exclusively restricted to the field and done by visual evaluation [
3]. To evaluate whether the algorithms are appropriate to convert the data extracted from the matrices into target traits, in this preliminary study, phenotyping was used both in terms of tools and platforms, and to include the amount of processing information. In addition, when field phenotyping represents the principal research aid, as in the present case, it must include proper characterization of the environmental conditions and spatial variability of the trials [
12].

 ,
, 


