Article

Phylogenetic Structure of Soil Bacterial Communities along Age Sequence of Subtropical Cunninghamia Lanceolata Plantations

1
State key Laboratory of Humid Subtropical Mountain Ecology of Ministry of Science and Technology and Fujian Province, Fujian Normal University, Fuzhou 350007, China
2
School of Geographical Science, Fujian Normal University, Fuzhou 350007, China
*
Author to whom correspondence should be addressed.
Sustainability 2020, 12(5), 1864; https://doi.org/10.3390/su12051864
Submission received: 16 January 2020 / Revised: 25 February 2020 / Accepted: 26 February 2020 / Published: 2 March 2020
(This article belongs to the Section Environmental Sustainability and Applications)

Abstract

:
Despite increasing investigations having studied the changing patterns of soil microbial communities along forest plantation development age sequences, the underlying phylogenetic assemblages are seldom studied for microbial community. Here, the soil bacterial taxonomic and phylogenetic diversity as well as the phylogenetic structure were examined to elucidate the community diversity and assembly in three typical ages (young, middle and mature) of Cunninghamia lanceolata plantations, a dominant economic tree species in southern China. Results indicated that the soil bacterial phylogenetic not taxonomic diversity increased with the increasing in stand age. The bacterial community composition differed significantly among the young, middle and mature plantations. Phylogenetic signals showed that bacterial communities were phylogenetically clustered and structured by environmental filtering in all studied plantations. In mature plantation, the effect of environmental filtering becomes stronger and bacteria taxa tend to intraspecific interact more complexly as characterized by co-occurrence network analysis. This suggests that ecological niche-based environmental filtering could be a dominant assembly process that structured the soil bacterial community along age sequences of Cunninghamia lanceolata plantations.

1. Introduction

Forest plantations have long been recognized by their contribution to humankind needs, such as industrial wood and local economy development [1]. The global forest plantations are estimated to cover 25% of a billion hectare of lands [2]. Reforestation on the natural forests occupies approximately 50% of the total increased plantations by area [2,3]. Due to the gradual replanting activities during the past several decades, forest plantations often consist a series of stands with different development ages [3,4]. Differences in vegetation production and canopy density along forest age sequences can influence the distribution of throughfall, solar radiation and the plant litters, which may subsequently show impacts on the soil carbon (C) and nutrient cycling as well as soil microbial characteristics [5,6]. Studies have demonstrated that forest age could significantly impact the soil microbial diversity and community composition [7,8]. For instance, Barber et al. [9] revealed that older lands harbored distinct bacterial communities from young lands, with greater abundance of Acidobacteria in older plantation. Another recent investigation reported that the abundances of Proteobacteria and Actinobacteria enhanced with increase in forest age, while Acidobacteria was largely unchanged [10]. Although the changing pattern of soil bacterial community composition among different development stand age sequences has been reported, few studies have examined the mechanistic resolution and ecological processes structuring bacterial communities of different plantations.
With the development of community phylogenetics, phylogenetic framework has been used to infer the mechanisms influencing community assembly [11,12]. Since niches are conserved in phylogeny, phylogenetic conservatism means that environment could act as a filter on organisms within community, while phylogenetically over-dispersion means competitive exclusion driving soil microbial community assembly [12]. These phylogenetic signals were firstly used to study the assemblages of plant communities [11,13,14], but is lately progressed to examine the microbial community assembly in a variety of ecosystems [15,16]. One recent investigation of bacterial phylogenetic structures has been addressed along a long-term sequence of forest and found that the soil bacterial community structures were greatly shaped by environmental filters [17]. However, the knowledge regarding the response of soil bacterial community structure across short term age sequences of forests is rarely studied.
Cunninghamia lanceolata plantations are one of the most important commercial timber sources in China. Its planting area accounts for approximately 21.4% and 6.5% of total plantations in China and the world, respectively [18]. Since the early 1980s, studies have evaluated plant productivity, soil respiration, soil C stocks as well as soil microbial properties in different stands of C. lanceolata plantations [19,20,21,22]. Here, we investigated the soil bacterial community composition and phylogenetic structure of three typical development stages (young, middle and mature) of C. lanceolata plantations. We addressed the following two questions: (1) how do bacterial community composition and phylogenetic structure respond to changed stand age of C. lanceolata plantations? (2) how the stand age of C. lanceolata plantations affect the ecological process structuring bacterial communities?

2. Materials and Methods

2.1. Site Description and Soil Sampling

The studied site is located in the Forest Ecosystem and Global Change Research Station of Fujian Province (26°19′55″N, 117°36′53″E) in Chenda town (Figure S1), Sanming city, Fujian Province, southeastern China. The mean annual temperature and precipitation of the region is 19.1° and 1750 mm, respectively. The soil is classified as red soil and Oxisol based on the Chinese and USDA Soil Taxonomy, respectively. C. lanceolata has been widely planted on former natural forest lands following clear-cutting and burning at different times.
Three first-generation C. lanceolata stands were selected by surveying geological map (http://www.ngac.org.cn) to represent different development stages according to the growth properties of C. lanceolata [23]: a 5-yr stand (Young), an 18-yr stand (Middle) and 40-yr stand (Mature). These stands are within 1 km from each other and had similar soil texture, parent material, elevation and topography. The plantations were located on well-drained uplands at slopes varying from 30° to 35°, with a mean elevation of 200 m above sea level. The average tree heights were 7.5 m, 14.5 m and 27.2 m, and the average basal diameters were 10.6 m, 15.6 m and 23.1 m in the young, middle and mature C. lanceolata plantations, respectively. Common understory plants in the stands at the time of this study were IIex pubescens, Dicranopteris dichotoma and Melastoma dodecandrumi. Details of the studied plantations are described in Table S1.
Soils were sampled from five plots (50 m × 50 m) in each of the three stands. In each plot, five trees of similar size were selected to sample surface soils (0–10 cm). At each selected tree, soils were taken from 1 m on four different directions of the trunk with soil corer (5 cm in diameter). All collected soils in each plot were pooled into a single composite sample, and then brought on ice packs to the laboratory immediately. Each composite soil sample was sieved (2 mm mesh) and stored at 4 °C and −80 °C for soil properties measurement and molecular analyses, respectively.

2.2. DNA Extraction, PCR and High-Throughput Sequencing

DNA was extracted from 0.25 g fresh soil per sample with a Power Soil Kit (MO BIO Laboratories, Carlsbad, CA, USA). The concentration of extracted DNA was measured by NanoDrop ND–2000 (Thermo Scientific, USA).
The target 16S rRNA gene fragment was amplified using the barcoded primers sets 515F/907R [24]. PCR was conducted in 50-μL mixture containing 0.5 μL (20 μM) of each primer, 25 μL (2 U) of Taq DNA polymerase mix, 1 μL (~ 30 ng) of template DNA and 23 μL sterile deionized water. PCR reactions were performed with an initial denaturation (94 °C, 5 min), 30 cycles (94 °C, 30 s; 55° C, 30 s; 72 °C, 30 s) and a final extension (72 °C, 7 min). The purified amplification products of all samples were mixed together based on equimolar concentrations, and then sequenced on an Illumina MiSeq system. Sequencing data was deposited to the NCBI database (accession number: PRJNA532954).

2.3. Statistical Data Analysis

The 16s rRNA reads were processed and analyzed following default parameters using the QIIME pipeline [25]. Sequences with length shorter than 200 bp, quality score lower than 25 were discarded. The remaining high-quality sequences were clustered into operational taxonomic units (OTUs) with a 97% similarity after de-replication and singleton exclusion with USEARCH. Taxonomic assignment of different bacterial OTUs was conducted using Silva 132 as the reference files. All sequenced samples were rarefied to the smallest sequence number (45,298 sequences) to evaluate bacterial communities at the same level of sampling effort. Phylogenetic diversity (PD) and OTU richness were respectively conducted using Faith’s index [26] and the rarefied index of richness to compare bacterial diversity among plantations of different development ages [27]. Nonmetric multidimensional scaling analysis (NMDS) plots of bacterial community taxonomic and phylogenetic composition were generated with Bray-Curtis and unweighted Unifrac distances, respectively. Permutational multivariate analysis of variance (PerMANOVA) was analyzed using vegan package with ‘adonis’ function in R (permutations = 999) to test the dissimilarity of soil bacterial community composition among different stands.
For the phylogenetic structure of bacterial communities, we calculated the mean pairwise phylogenetic distance (MPD) to estimate the mean phylogenetic relatedness of OTUs within a community using picante package with ‘comdist’ in R [28]. The nearest relative index (NRI) (-1 times the output of the standardized effect size (SES) of MPD) was then analyzed with ‘ses.mpd’ function in picante package to characteristic the degree of non-random phylogenetic structure [28,29]. A two-tailed t-test (p < 0.05) was used to determine the significant difference of NRI relative to zero that expected by null model. NRI values greater than zero, equal to zero or lower than zero mean the communities were phylogenetic clustered, random or phylogenetic over-dispersed, respectively [12]. Statistical analyses were carried out with SPSS 18.0. Different letters indicated significant differences (p < 0.05) between samples.
To analyze the linkage of environmental factors (stand age, soil moisture, total carbon (TC), total nitrogen (TN), available phosphorus (AP), dissolved organic carbon (DOC), pH, NH4+-N, NO3-N) with soil bacterial community composition, mantel tests were conducted with the vegan package in R. Redundancy analysis (RDA) was conducted to determine the relations between the environmental factors and the relative abundance of dominant bacterial phyla with CANOCO 5.0. The distance-based linear model (distLM) was used to calculate the predicted importance of environmental factors to the soil bacterial phylogenetic diversity and community composition based on a stepwise forward procedure with the Primer-E7 program [30].
To address the responses of the interactions among phylotypes to changes in stand ages, SparCC correlation was used to study the non-random co-occurrence pattern of phylotypes [31]. The relative abundance of OTUs higher than 0.001% per sample were used for this network analysis. The p-values were calculated by randomly selections of the data table (9999 permutations). The absolute coefficient of SparCC correlation higher than 0.90 and p value lower than 0.01 was selected for downstream network analyses. The interactive network of each treatment was visualized with the Gephi platform [32]. To better compare the topological properties of networks, the numbers of edges and nodes, clustering coefficient, modularity and average degree were calculated.

3. Results

3.1. Distribution and Composition of Soil Bacterial Community

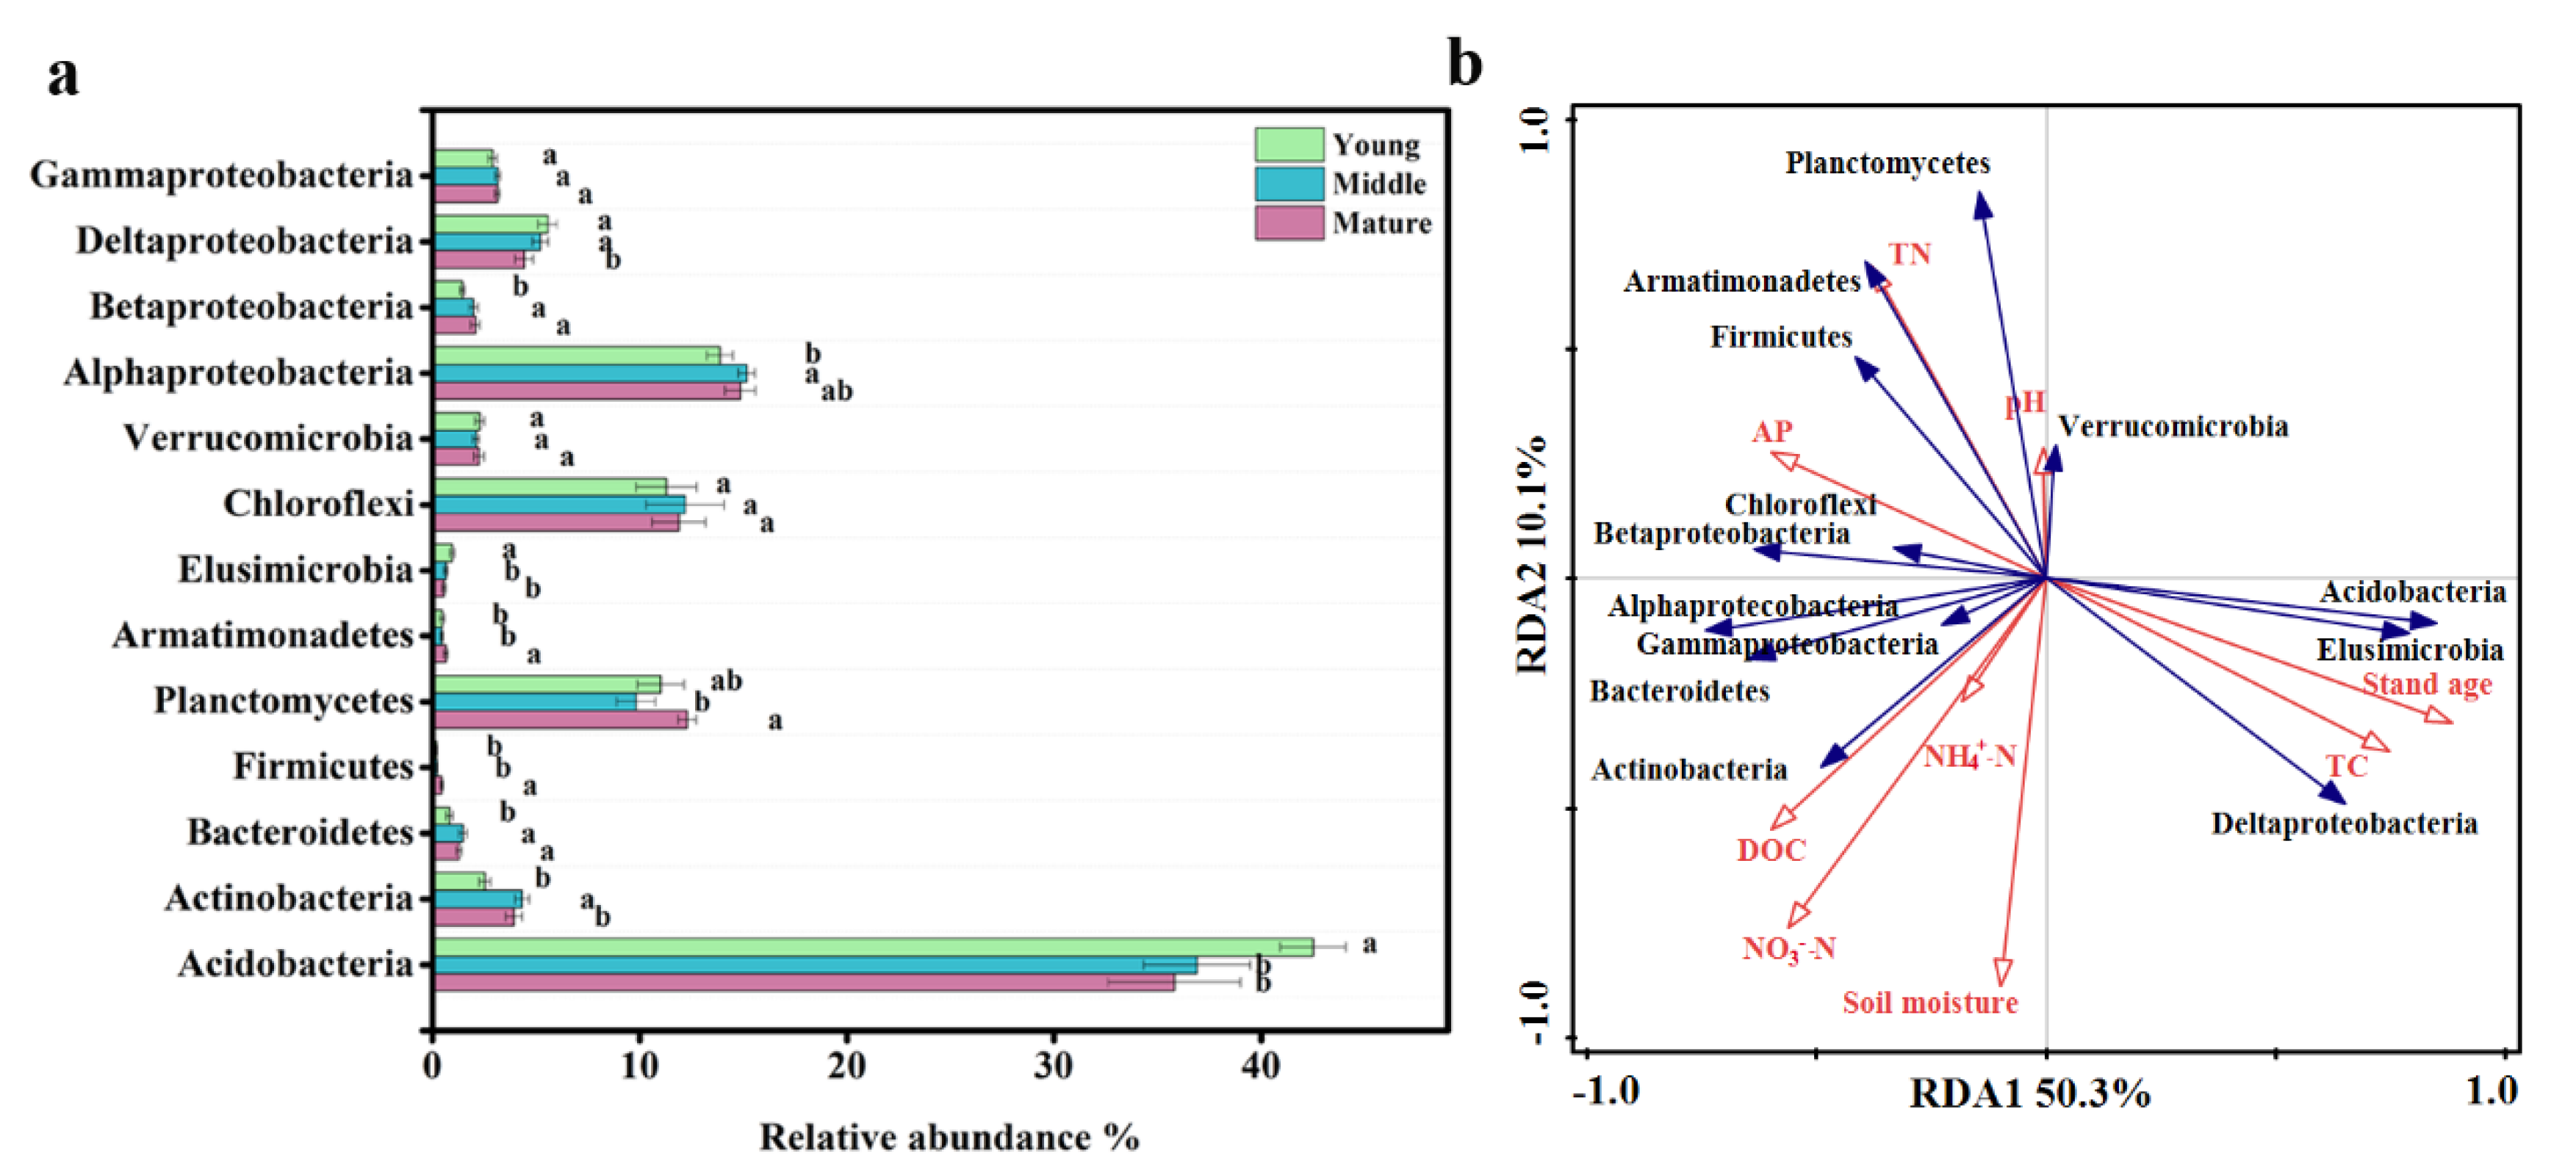
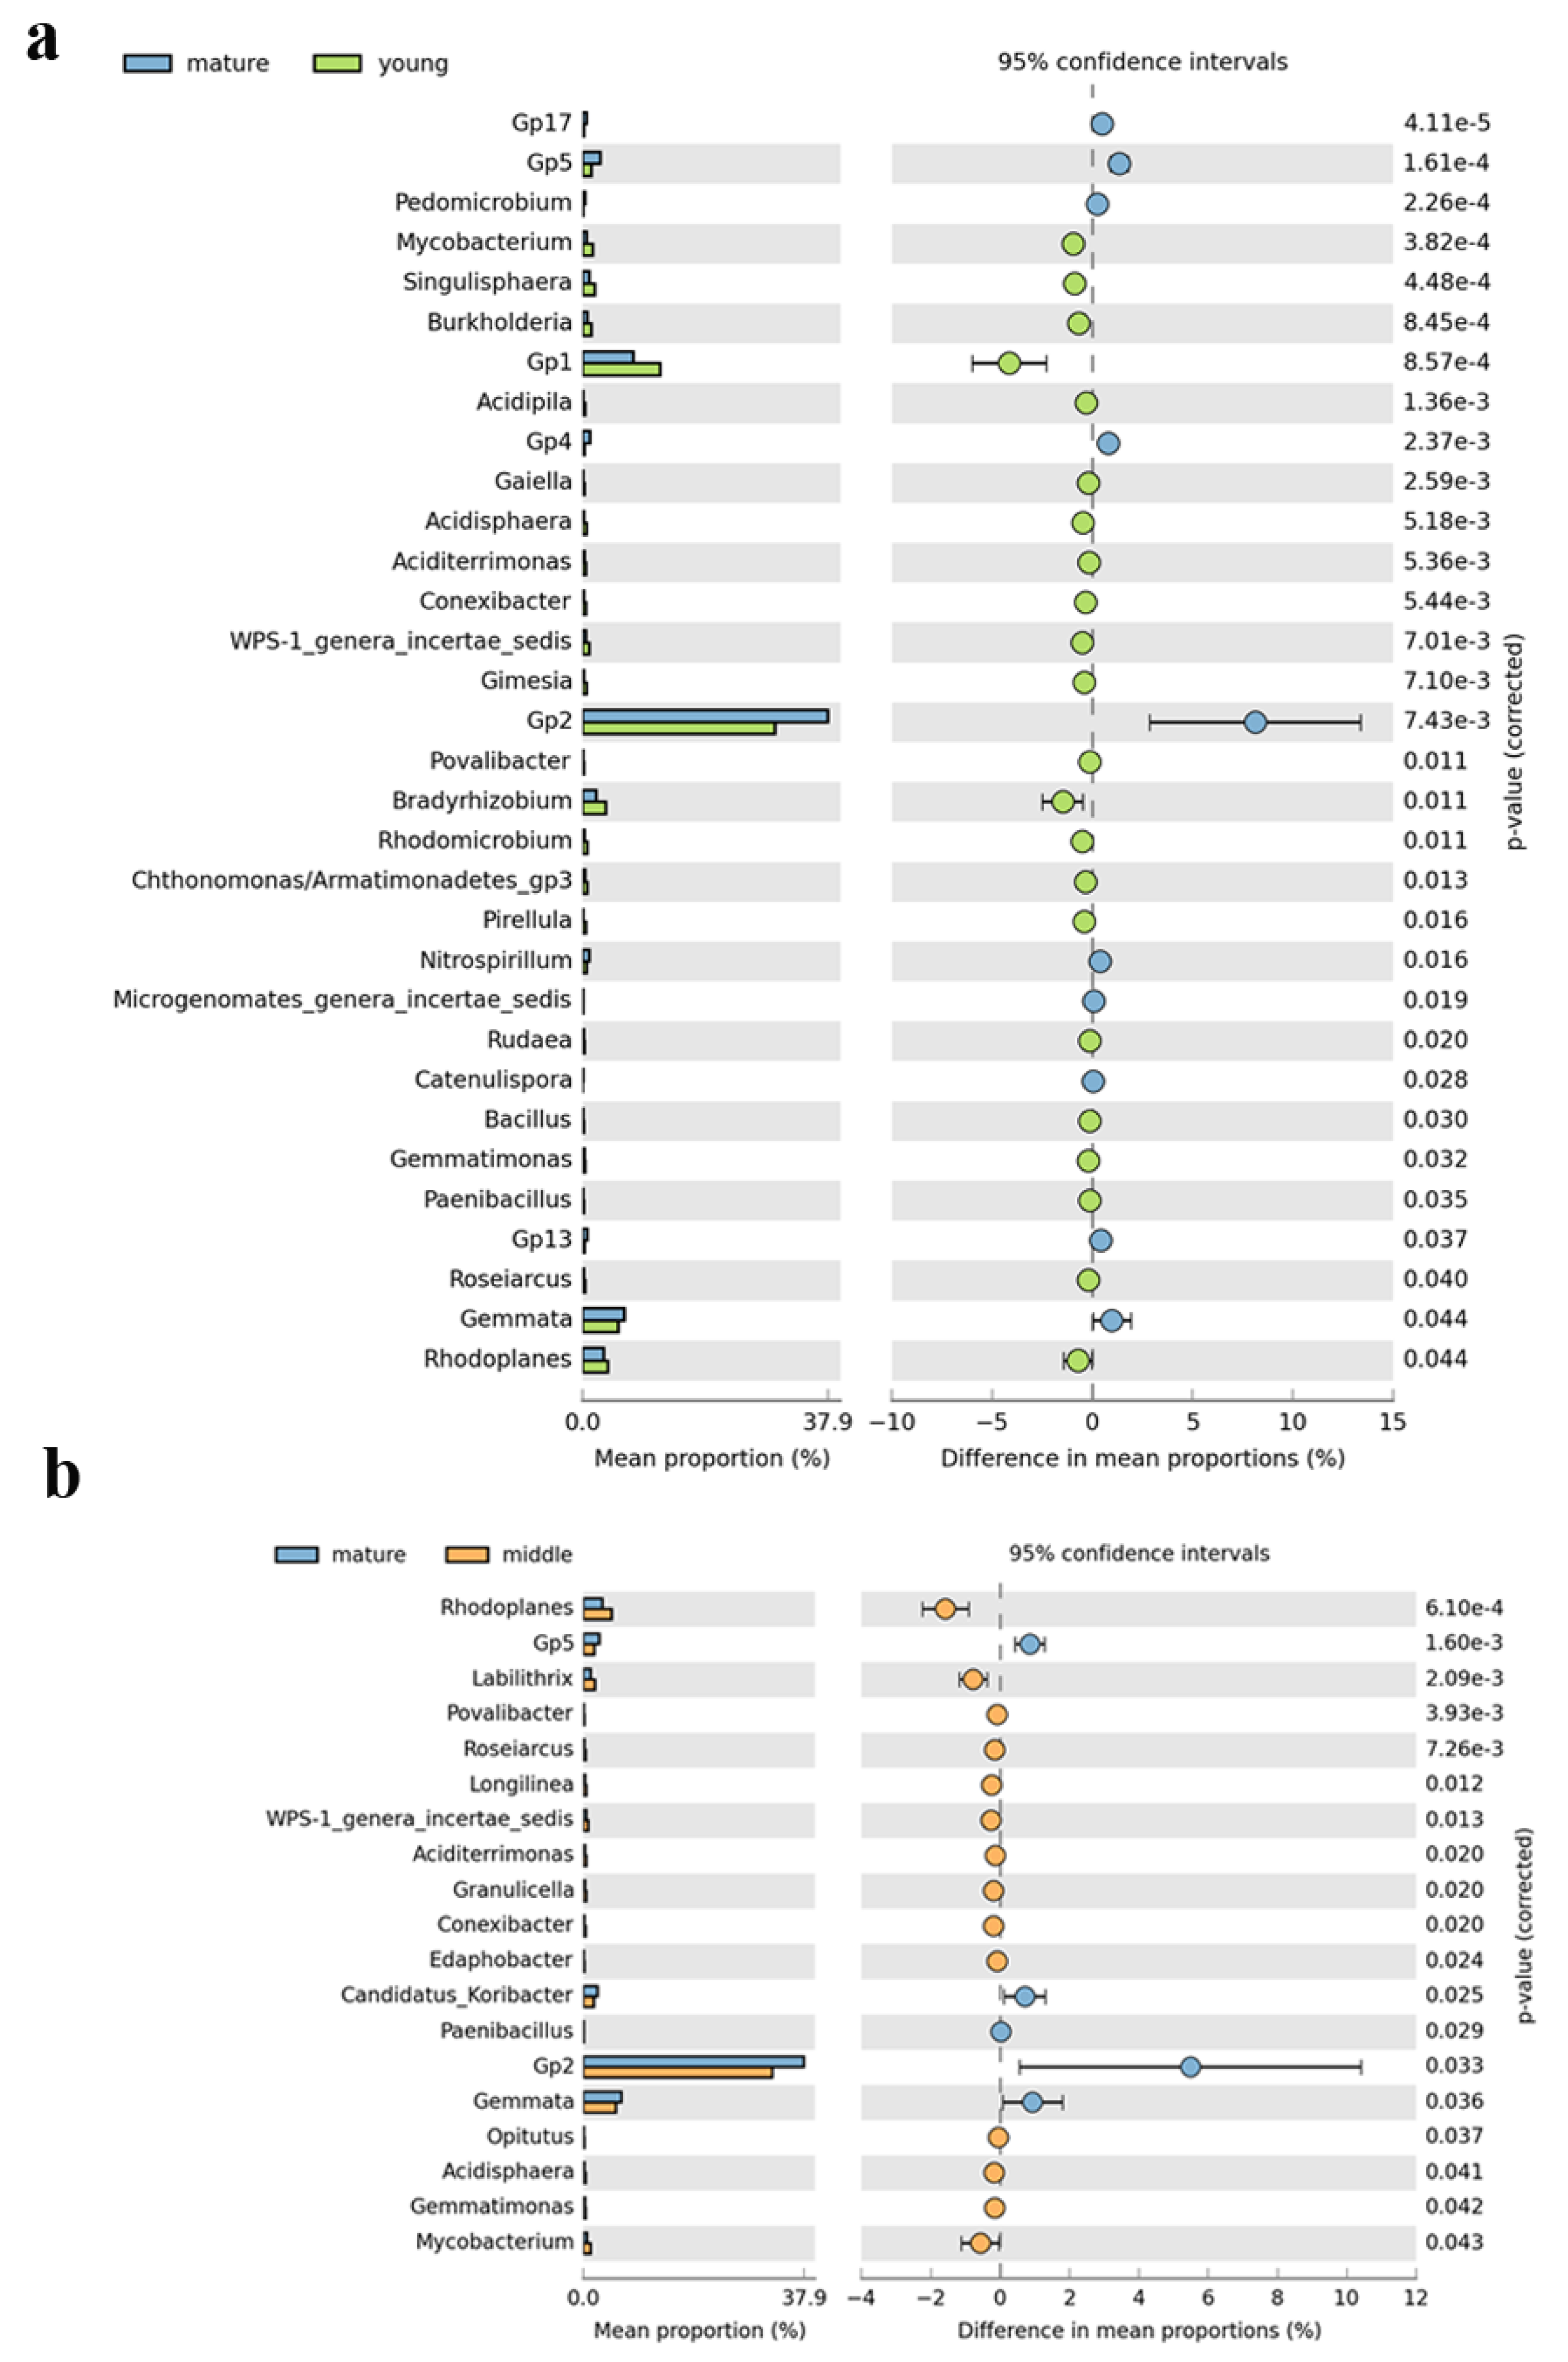
A total of 972,801 (ranging from 45,298 to 85,503) high-quality reads of bacteria were recorded from all soil samples (Table S2). Based on 97% similarity, the high quality sequences were identified into 4692 OTUs. The majority of bacterial sequences (~93.4%) can be categorized into Acidobacteria (~39.1%), Proteobacteria (~24.3%), Chloroflexi (~11.6%), Plantctomycetes (~11.2%), Actinobacteria (~3.96%), Verrucomicrobia (~2.20%) and Bacteroidetes (~1.05%), with Acidobacteria being the dominant phylum in all samples (Figure S2). All rarefaction curves tended to reach stable plateaus (Figure S3), suggesting that the analyzed sequences number was adequate to study the bacterial diversity. No change in OTU richness was recorded among different stands (Figure 1a). Phylogenetic diversity was significantly higher in mature plantation than that in young plantation (Figure 1b). The soil bacterial taxonomic and phylogenetic community composition can be separated into different clusters based on stand age according to the nonmetric multidimensional scaling (NMDS) analyses (Figure 1c,d). The bacterial community composition significantly differed both taxonomically and phylogenetically among different plantations based on the PerMANOVA results (Table S3). In general, the relative abundances of Acidobacteria and Elusimicrobia were highest at the mature plantation (Figure 2a). By contrast, the mature plantation had lower abundance of Alphaproteobacteria and Betaproteobacteria relative to the two younger plantations (Figure 2a). At genus level, 10 groups such as Gp2, Gp5 and Gp17 increased in mature plantation relative to young plantation (Figure 3a). Comparing to middle, five genera including Gp2 and Gp5 were increased in mature plantation (Figure 3b).
Correlation analysis showed that stand age exert the strongest impact on the bacterial community composition and the relative abundance of taxonomic members (Table 1, Figure 2b). Other factors such as soil moisture, TC, TN and AP also show significant correlation with bacterial community composition (Table 1).
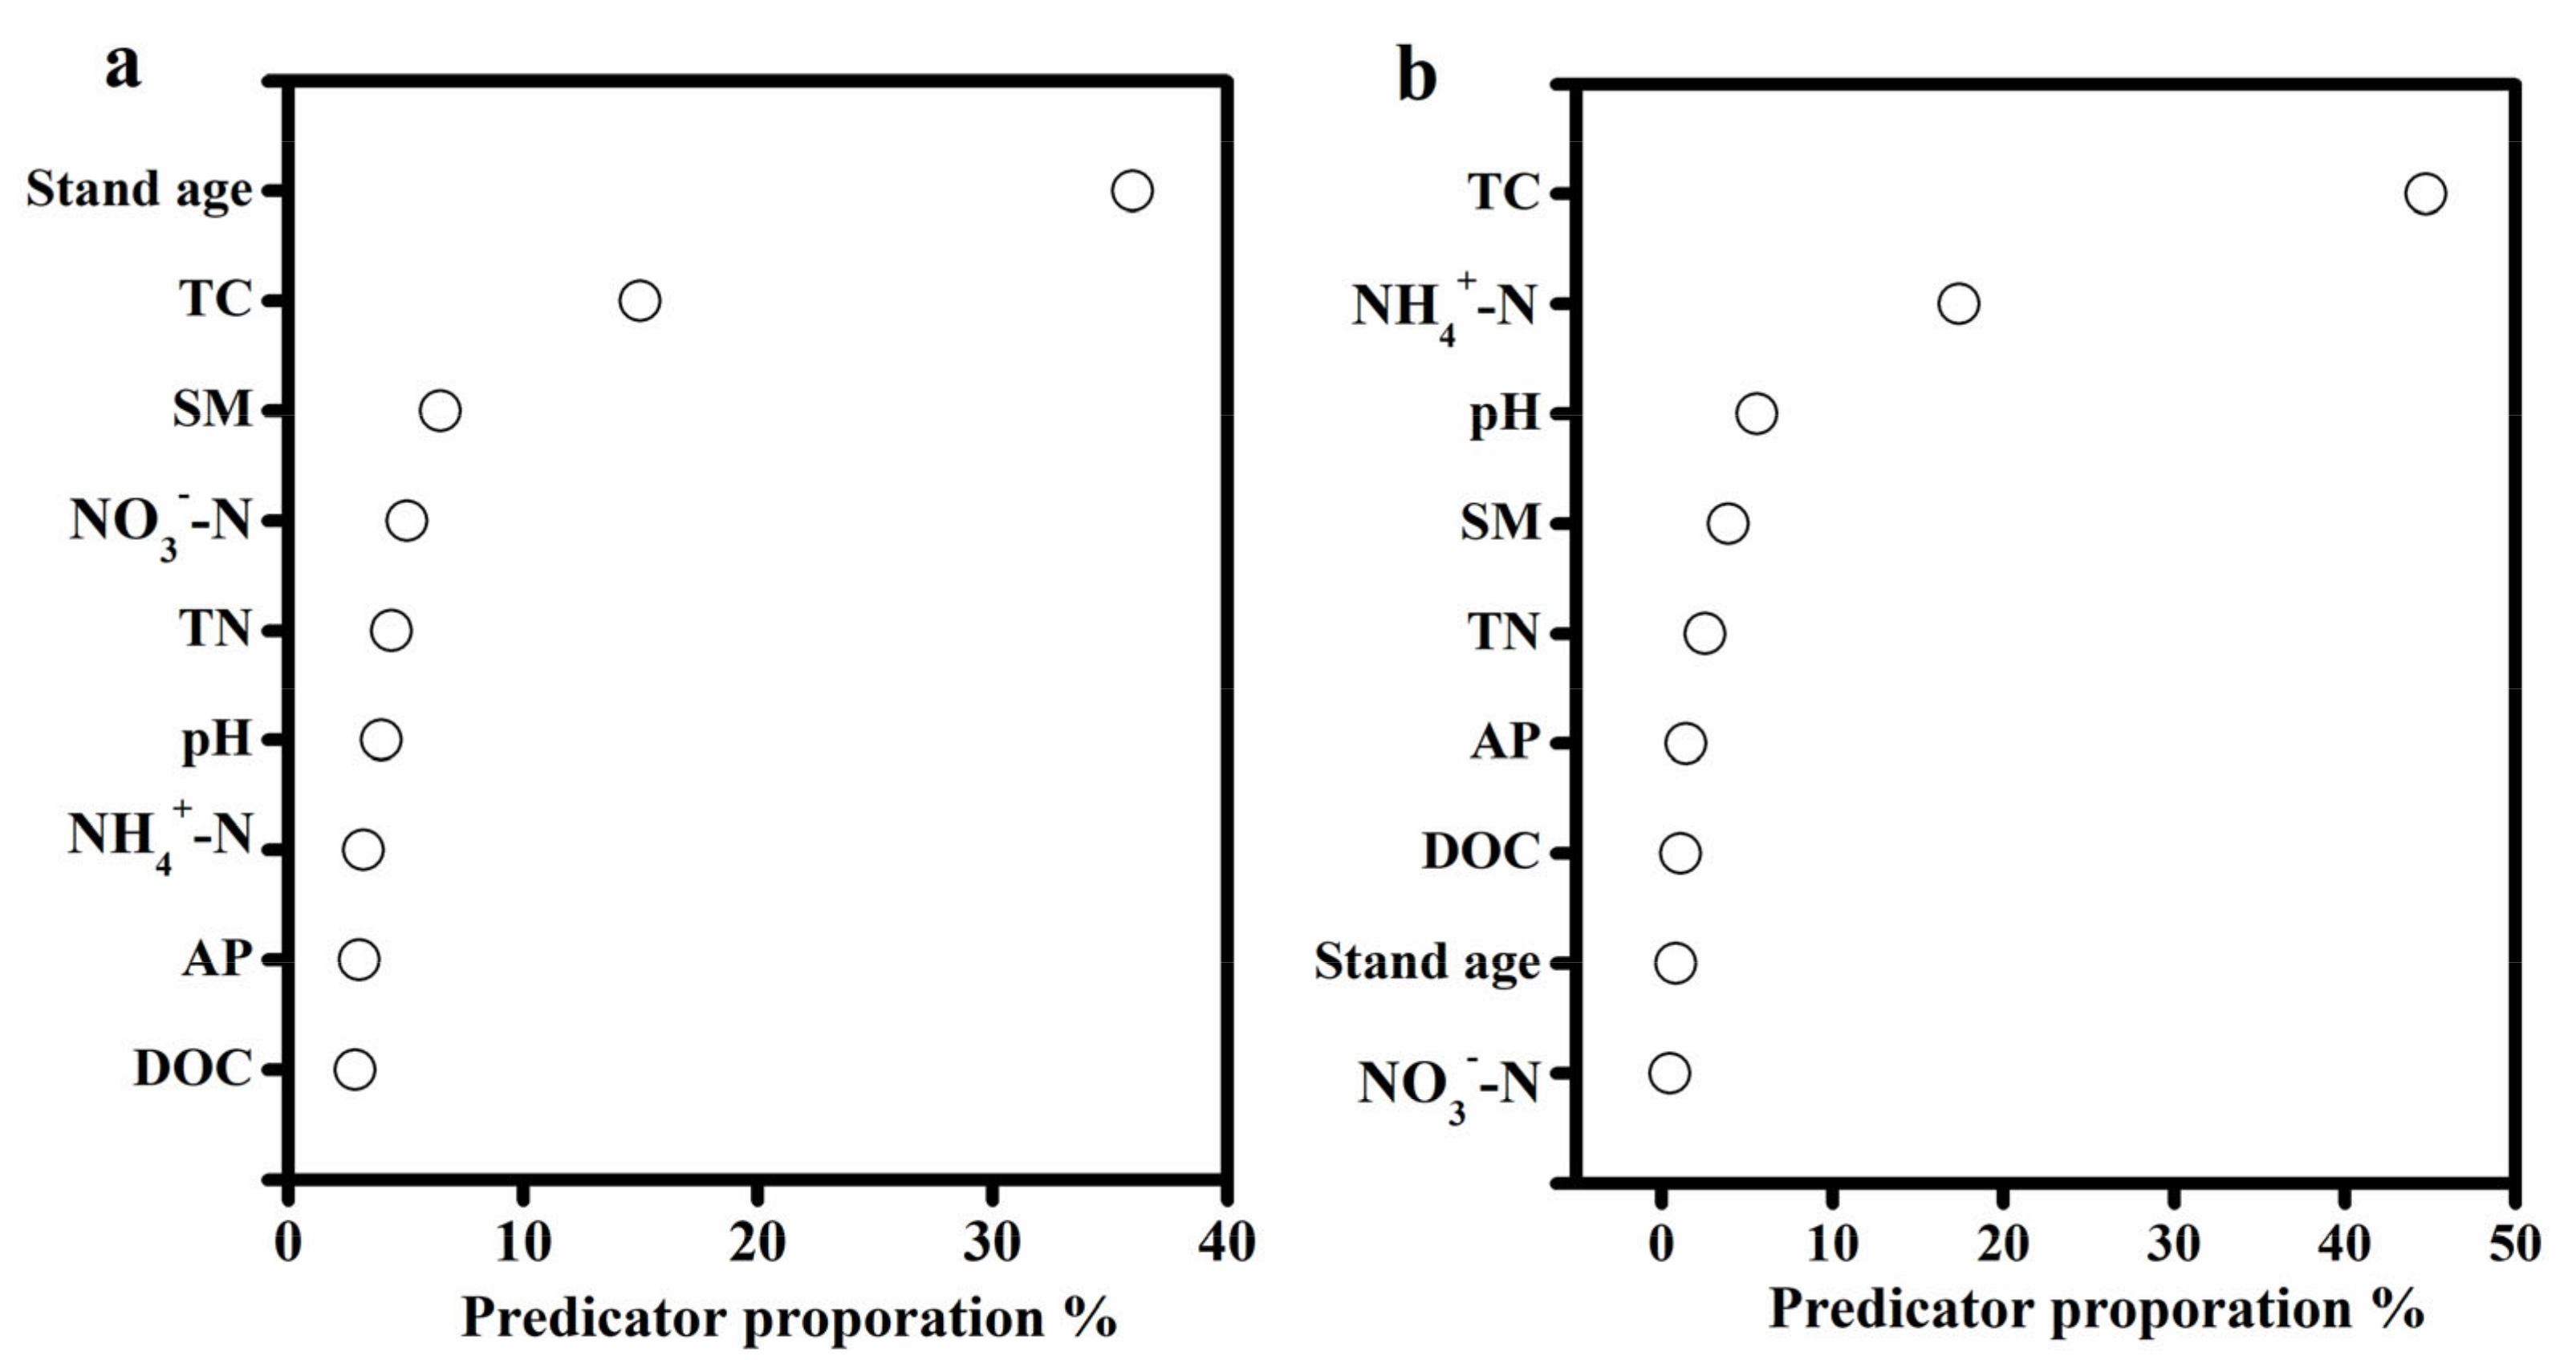
Specifically, stand age explained 40.3% of the variance in the relative abundances of bacterial phyla (Table S4). The relative abundances of Acidiobacteria, Elusimicrobia and Deltaproteobacteria positively correlated with stand age and TC, and negatively correlated with AP and TN (Figure 2b). The distLM also found that stand age was the biggest contributor of changes of the bacterial community composition (Figure 4a). In contrast, TC showed an important contribution to the changes in soil bacterial phylogenetic diversity (Figure 4b).

3.2. Network Co-Occurrence of Soil Bacterial Phylotypes

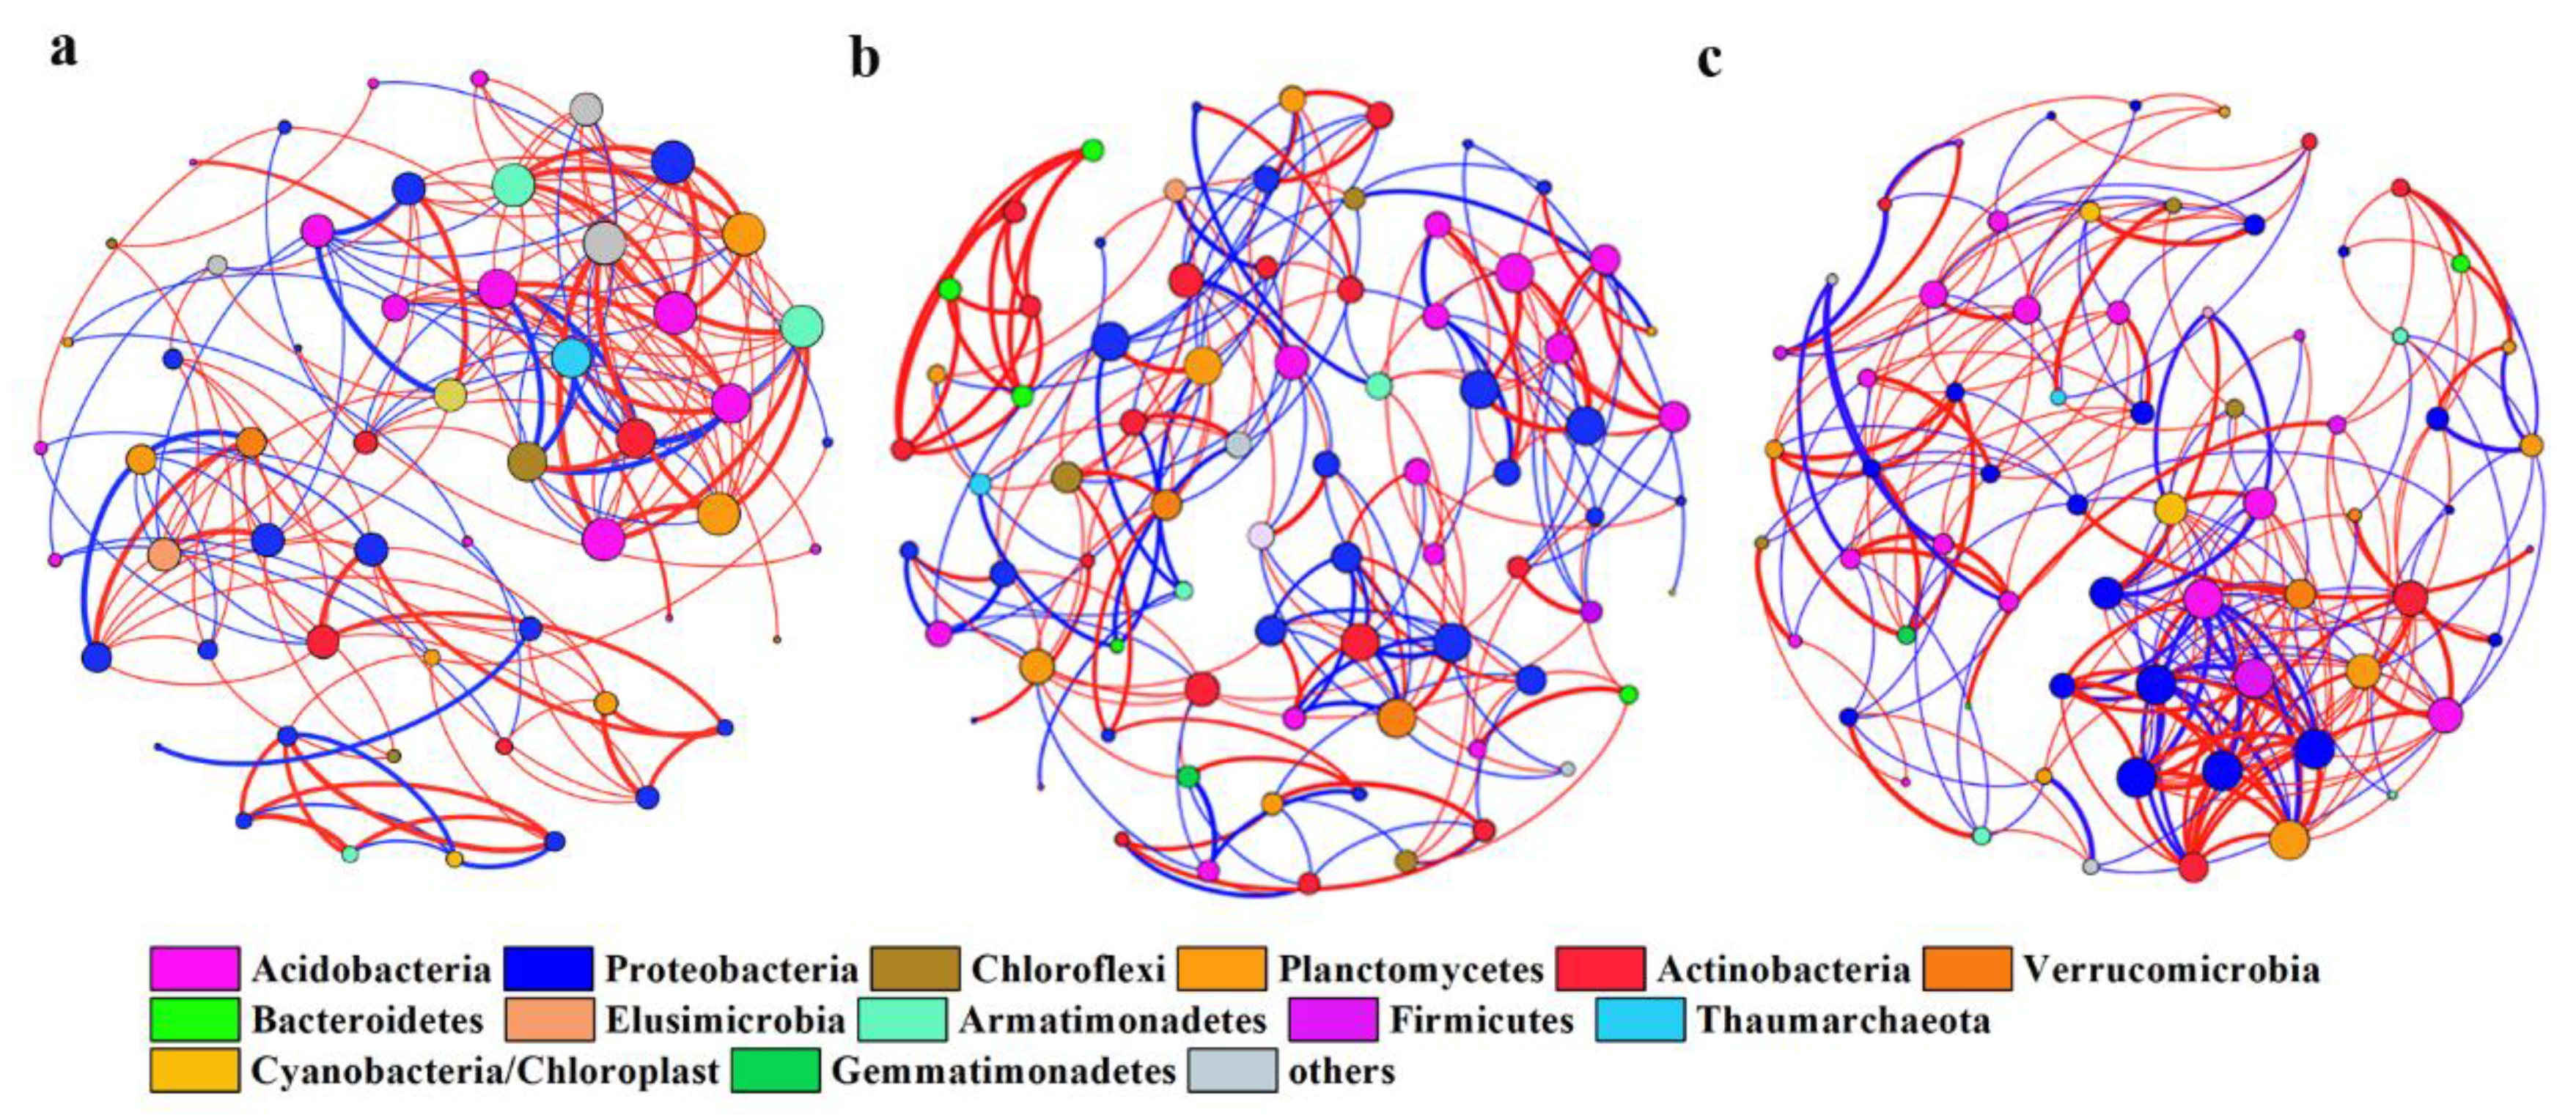
To address the responses of the interactions among phylotypes to changes in stand ages, non-random co-occurrence network pattern of phylotypes was analyzed (Figure 5). The modularity index values in different plantations were ranged from 0.511 to 0.712 (Table 2). These values were higher than the suggested threshold (0.4) in network analysis [33], indicating that all the networks were modularly structured. Number of nodes was reduced in mature plantation relative to those in middle and young plantations (Table 2). However, the number of edges (236), average clustering coefficient (degree of nodes tended to clustered together, 0.282) and average degree (node connectivity degree, 3.522) were higher in mature plantation relative to the younger plantations, indicating that bacterial species tended to interact more closely in mature plantation (Table 2).

3.3. Phylogenetic Structure of Soil Bacterial Community

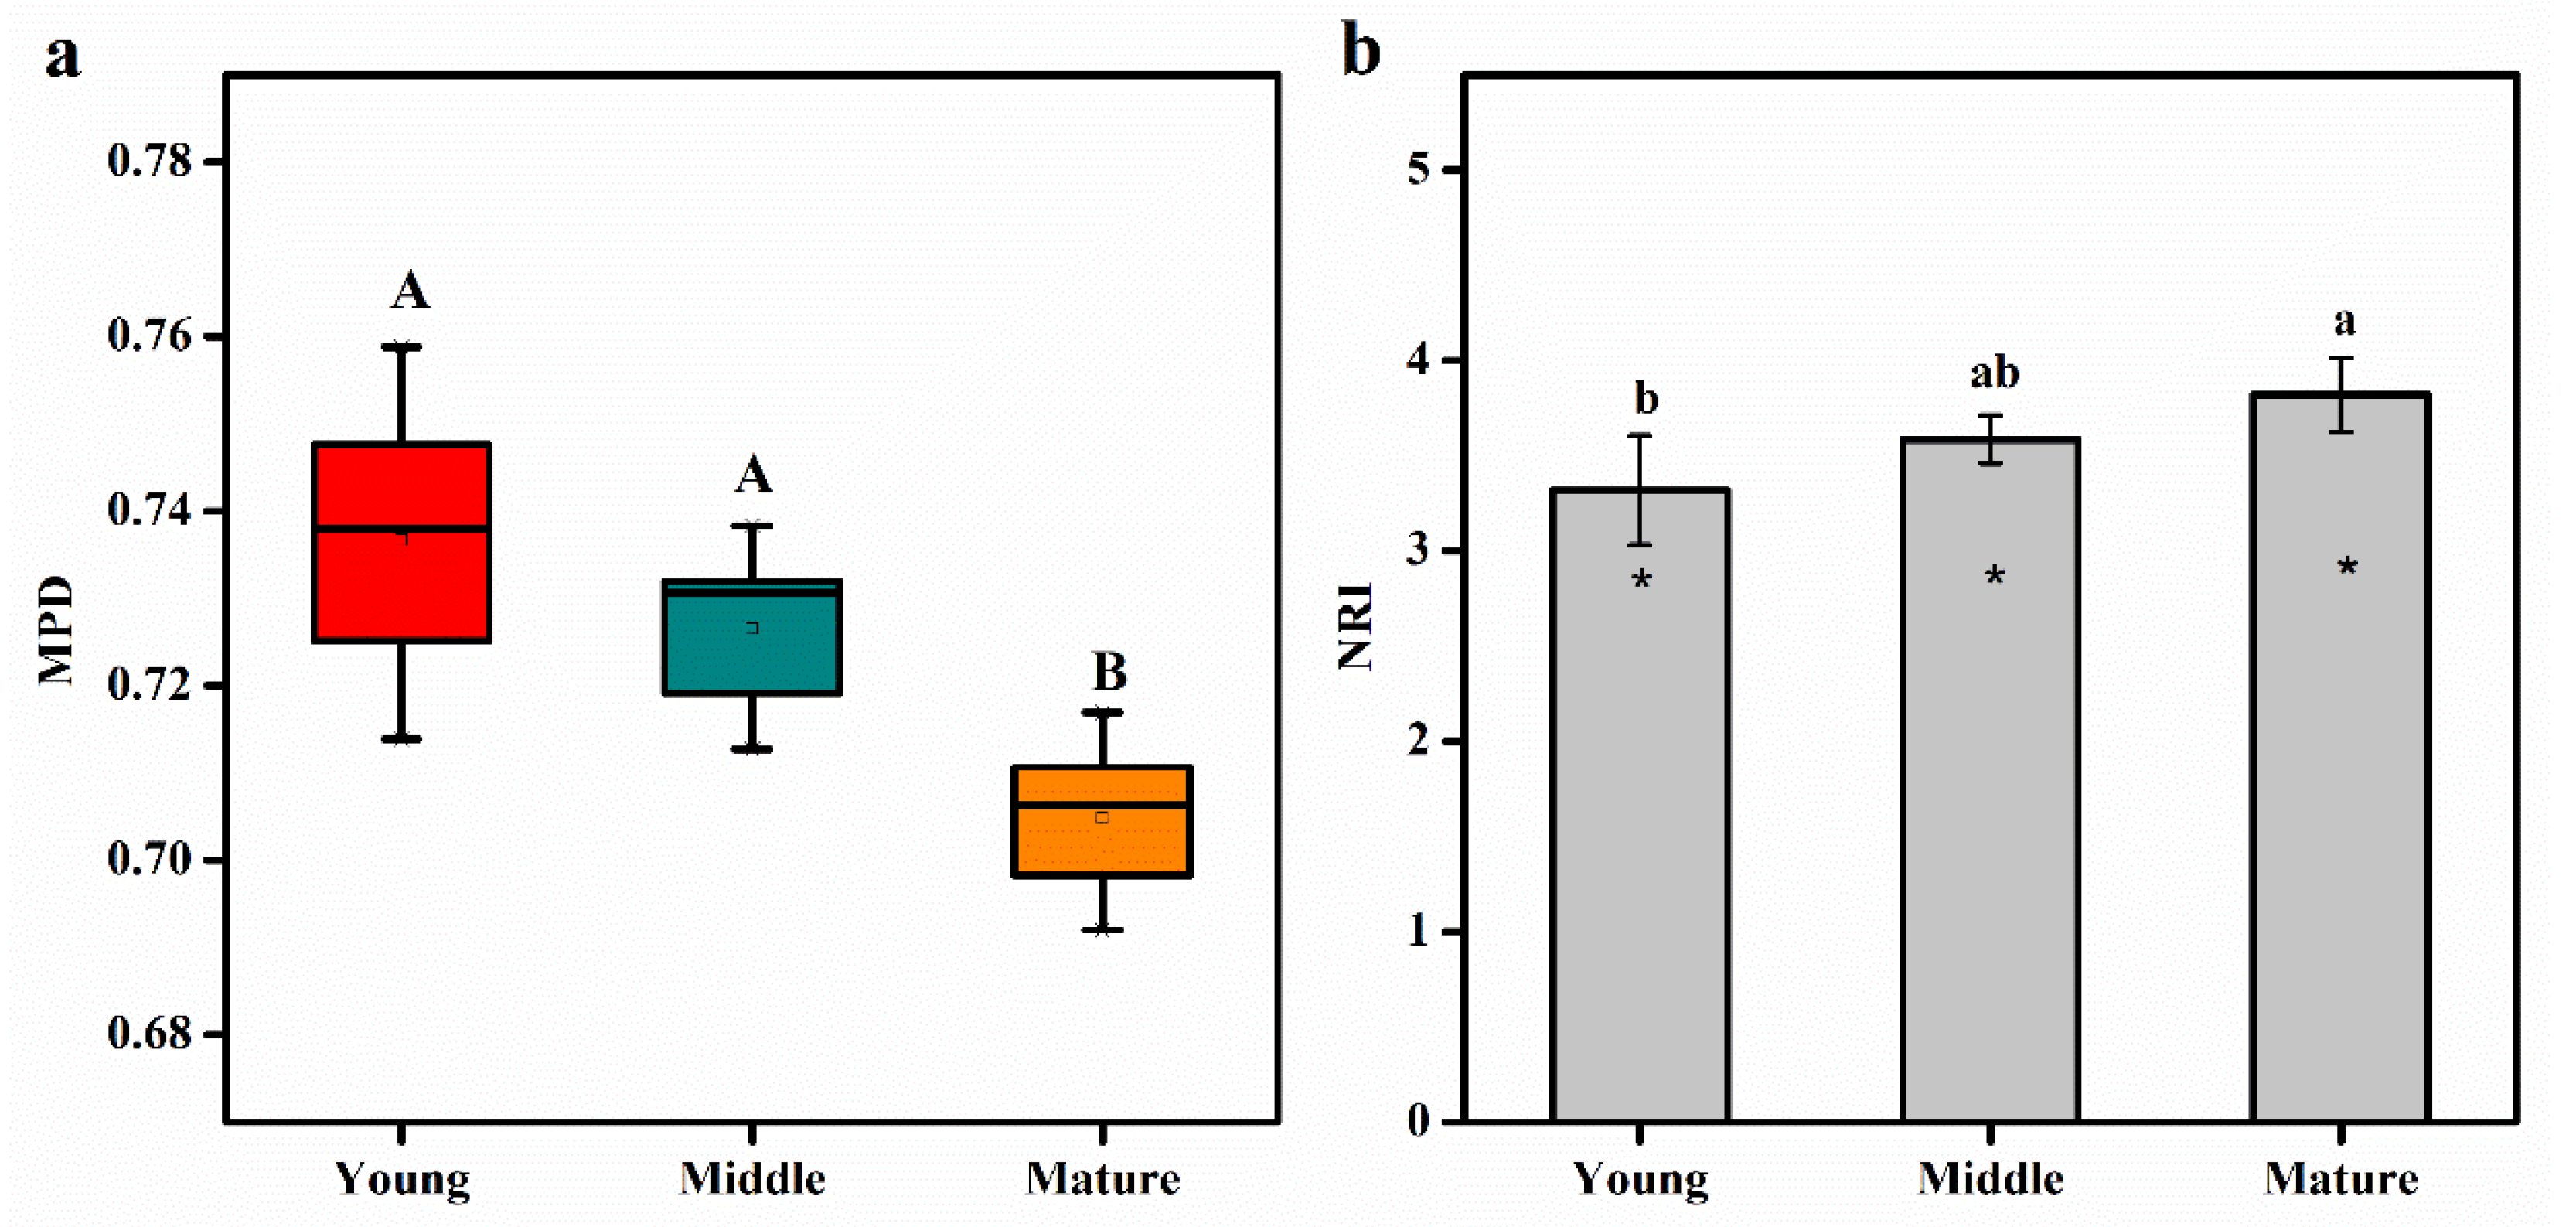
The MPD values of mature plantation was lower than the young plantations, indicating that the phylogenetic relatedness was smaller in mature plantation (Figure 6a). NRI values in all plantations were greater than zero, indicating that bacterial communities were phylogenetically clustered and taxonomic groups were more closely related than the expectation by null model (Figure 6b). The highest NRI occurred in mature plantation. Correlation analyses between soil parameters with MPD, NRI and phylogenetic diversity found that MPD and NRI increased significantly with TC concentration (Table S5).

4. Discussion

4.1. Changes of Soil Bacterial Community among Different Development Ages of C. lanceolata Plantations

Our sequencing results revealed that the bacterial OTU richness did not differ among young, middle and mature plantations (Figure 1a), similar to the reported poor relation between soil microbial richness and stand ages in previous studies [34,35]. However, both the phylogenetic diversity and community composition were sensitive to the changed stand age (Figure 1b, Table S3). The higher abundance of Acidobacteria was recorded in mature plantation relative to younger plantations (Figure 2a), indicating that the soils may become more oligotrophic along with age sequences since high Acidobacteria often observed in oligotrophic soils [36]. Although Acidobacteria is usually significantly related to the changes in soil pH [37], there was no significant relation between Acidobacteria and this environmental parameter, implying that soil pH play little influences on the changes of Acidobacteria across the age sequences of C. lanceolata plantations.
Highest correlation between stand age and bacterial community composition was recorded based on multivariate analyses (Table 1, Figure 4). This observation was in accordance with some studies that have found strong differences in community composition among different stand ages for bacteria [9,38]. However, stand age is an indirect gradient along which many environmental properties are changing. In this study, we found that both the bacterial abundances of dominant phyla and the community composition for bacteria were significantly related with TN, TC, soil moisture and AP (Table 1, Figure 2b). Recent studies also found a significant relationship between soil pH and TC and bacterial community structure [9,10]. It is suggested that plants can contribute to soil C storage through inputs of plant residues, including leaf and root litter, or enhanced input of photosynthetic C through root exudation [39]. Consistent with the previous related works [40], we found soil TC increased across the development age sequences. Another study observed that soil AP was the dominant environmental factor in affecting bacterial community composition along an age chronosequence of plantations [8]. Vegetation type has also been demonstrated to affect the soil microbial communities in forest ecosystem [8,41]. Here, vegetation characteristics may potentially show impacts on the bacterial community composition, however, we did not measure the vegetation characteristics and the understory plant community composition, so that we cannot analyze the relationships between vegetation characteristics and soil bacterial communities, and thus cannot exclude the possible contribution of vegetation on the shifts in the composition of soil bacterial community through alteration of soil C, N or AP. Nevertheless, our results suggest that soil C, N and AP concentrations were the dominant environmental factors shaping the soil bacterial community composition along age sequences of C. lanceolata plantations in this subtropics.

4.2. Phylogenetic Structure of Soil Bacterial Community Assembly under Different Development Ages of C. lanceolata Plantations

Phylogenetic matrices showed that the soil bacterial communities in all studied plantations were phylogenetically clustered (Figure 6), suggesting that all the bacterial taxa with in community was more closely related than the expectation by chance [12]. This means that environmental filtering was the main process governing the soil bacterial community assembly [15,16]. Such observation is in agreement with reports for phylogenetic structures of soil bacterial community in the hardwood forests and salt marsh along a chronosequence [17,31] as well as those in natural ecosystems [37,42], suggesting that the soil bacterial community assembly in our forest plantations of different ages might be similar to natural ecosystems. It has been documented that both abiotic and biotic determinants may impact the phylogenetic patterns [43,44]. Bacterial groups have different niches and tend to inhabit different soil conditions, therefore we speculated that the selection of soil bacterial groups with more close relatedness in our studied forests might be largely affected by multiple soil characteristics, which shaped the community composition and showed niche forces on the structure [45]. It is suggested that the relatedness of two species in phylogeny often positively correlated with their ecological similarity and life history as the species traits are often conservatism in the evolutionary lineage [46]. Therefore, environmental conditions may be considered as a filter, which may lead to closely related species apt to coexist. For forest plantation along age sequences, plant growth may select species that can grow best in the changed microenvironments [47]. Additionally, soil microorganisms responsible for providing nutrients to the plants; microbial communities are likely to be structured by plant-microbe interactions [44].
Although environmental filtering was the main process in structuring the soil bacterial communities, its impact was strongly altered by stand age of C. lanceolata plantation. The filtering effect was more important at the mature plantation relative to the younger plantations (Figure 6). This result was also observed in previous studies for microbial communities along stand age sequences [17,48], suggesting that soil bacterial community structure might closely related with stand age. Moreover, we found the interactions among taxa were more complex in mature plantation (Figure 5, Table 2). According to streamlining theory [49], an increase in interactions among organisms are always concurrent with improved competition of resources. A similar phenomenon was also reported that the selection effects of environments on bacterial community assembly were more prominent under low soil nutrient conditions [50]. Furthermore, the abundance of dominant Acidobacteria increased in mature plantation, which possibly contribute to the more clustered bacterial phylogenetic structure because of niche conservatism in phylogeny [51].

5. Conclusions

This study revealed that the soil bacterial communities in subtropical Cunninghamia lanceolata plantations differed with stand age and bacterial phylogenetic diversity significantly increased with increasing stand age. Soil total carbon, nitrogen and available phosphorus concentrations were closely related with bacterial community composition and some dominate bacterial taxa. The bacterial communities in all studied plantations were phylogenetically clustered, suggesting that the environmental filtering rather than other ecological process dominantly structured the bacterial community assembly in C. lanceolata plantations. The effect of environmental filtering becomes stronger and co-occurrence bacterial phylotypes tend to interact more complexly along with age sequences in this subtropical C. lanceolata plantations.

Supplementary Materials

The following are available online at https://www.mdpi.com/2071-1050/12/5/1864/s1, Table S1: Description of the sampling sites of C. lanceolata plantations; Table S2: Bacterial sequences and OTUs in each soil sample at different development age of C. lanceolata plantations; Table S3: Significant test of bacterial community taxonomic (Bray-Curtis) and phylogenetic (Unifrac) composition between different ages of C. lanceolata plantations based on PerMANOVA analysis; Table S4: Results of redundancy analysis; Table S5: Pearson correlations between soil properties and MPD, NRI and phylogenetic diversity; Figure S1: Location of study area in Chenda Town, Fujian Province, China; Figure S2: Taxonomic composition of soil bacterial communities at the phylum level under different development age of C. lanceolata plantations. Figure S3: Rarefaction curves of observed bacterial OTUs among different development age of C. lanceolata plantations.

Author Contributions

J.C. and Y.Y. designed the experiments; J.C. and Y.Z. performed the experiments; J.C., Y.Z. and Y.Y. analyzed the data, wrote and revised the paper. All authors have read and agreed to the published version of the manuscript.

Funding

This study was supported by the National Natural Science Foundation of China (31670623 and 31800520), the National Key Basic Research of China (2014CB954003) and China Postdoctoral Science Foundation Grant (2018M632571).

Conflicts of Interest

The authors declare no conflict of interest.

References

  1. Winjum, J.K.; Schroeder, P.E. Forest plantations of the world: Their extent, ecological attributes, and carbon storage. Agric. For. Meteorol. 1997, 84, 153–167. [Google Scholar] [CrossRef]
  2. Van Dijk, A.I.J.M.; Keenan, R. Planted forests and water in perspective. For. Ecol. Manag. 2007, 251, 1–9. [Google Scholar] [CrossRef]
  3. FAO. Global Forest Resource Assessment; Food and Agricultural Organization of the United Nations: Rome, Italy, 2010; p. 163. [Google Scholar]
  4. Ma, X.; Heal, K.V.; Liu, A.; Jarvis, P.G. Nutrient cycling and distribution in different-aged plantations of Chinese fir in southern China. For. Ecol. Manag. 2007, 243, 61–74. [Google Scholar] [CrossRef]
  5. Lucas-Borja, M.; Hedo, J.; Cerdà, A.; Candel-Pérez, D.; Viñegla, B. Unravelling the importance of forest age stand and forest structure driving microbiological soil properties, enzymatic activities and soil nutrients content in Mediterranean Spanish black pine(Pinus nigra Ar. ssp. salzmannii) Forest. Sci. Total. Environ. 2016, 562, 145–154. [Google Scholar] [CrossRef]
  6. Carletti, P.; Vendramin, E.; Pizzeghello, D.; Concheri, G.; Zanella, A.; Nardi, S.; Squartini, A. Soil humic compounds and microbial communities in six spruce forests as function of parent material, slope aspect and stand age. Plant Soil 2008, 315, 47–65. [Google Scholar] [CrossRef]
  7. Waring, B.; Adams, R.; Branco, S.; Powers, J.S. Scale-dependent variation in nitrogen cycling and soil fungal communities along gradients of forest composition and age in regenerating tropical dry forests. New Phytol. 2015, 209, 845–854. [Google Scholar] [CrossRef] [Green Version]
  8. Liu, J.; Yang, Z.; Dang, P.; Zhu, H.; Gao, Y.; Ha, V.N.; Zhao, Z. Response of soil microbial community dynamics to Robinia pseudoacacia L. afforestation in the loess plateau: A chronosequence approach. Plant Soil 2017, 423, 327–338. [Google Scholar] [CrossRef]
  9. Barber, N.A.; Chantos-Davidson, K.M.; Peralta, R.A.; Sherwood, J.P.; Swingley, W.D. Soil microbial community composition in tallgrass prairie restorations converge with remnants across a 27-year chronosequence. Environ. Microbiol. 2017, 19, 3118–3131. [Google Scholar] [CrossRef]
  10. Gao, P.; Zheng, X.; Wang, L.; Liu, B.; Zhang, S. Changes in the Soil Bacterial Community in a Chronosequence of Temperate Walnut-Based Intercropping Systems. Forests 2019, 10, 299. [Google Scholar] [CrossRef] [Green Version]
  11. Webb, C.O. Exploring the phylogenetic structure of ecological communities: An example for rain forest trees. Am. Nat. 2000, 156, 145–155. [Google Scholar] [CrossRef]
  12. Webb, C.; Ackerly, D.D.; McPeek, M.A.; Donoghue, M.J. Phylogenies and Community Ecology. Annu. Rev. Ecol. Syst. 2002, 33, 475–505. [Google Scholar] [CrossRef] [Green Version]
  13. Adler, P.B.; Salguero-Gómez, R.; Compagnoni, A.; Hsu, J.S.; Ray-Mukherjee, J.; Mbeau-Ache, C.; Franco, M. Functional traits explain variation in plant life history strategies. Proc. Natl. Acad. Sci. USA 2013, 111, 740–745. [Google Scholar] [CrossRef] [PubMed] [Green Version]
  14. Xing, D.; Swenson, N.G.; Weiser, M.D.; Hao, Z. Determinants of species abundance for eastern North American trees. Glob. Ecol. Biogeogr. 2014, 23, 903–911. [Google Scholar] [CrossRef]
  15. Chase, J.M. Stochastic Community Assembly Causes Higher Biodiversity in More Productive Environments. Science 2010, 328, 1388–1391. [Google Scholar] [CrossRef] [PubMed] [Green Version]
  16. Bulgarelli, D.; Rott, M.; Schlaeppi, K.; Van Themaat, E.V.L.; Ahmadinejad, N.; Assenza, F.; Rauf, P.; Huettel, B.; Reinhardt, R.; Schmelzer, E.; et al. Revealing structure and assembly cues for Arabidopsis root-inhabiting bacterial microbiota. Nature 2012, 488, 91–95. [Google Scholar] [CrossRef]
  17. Freedman, Z.; Zak, D. Soil bacterial communities are shaped by temporal and environmental filtering: Evidence from a long-term chronosequence. Environ. Microbiol. 2015, 17, 3208–3218. [Google Scholar] [CrossRef] [Green Version]
  18. State Forestry Administration of China. Forest Resources Report in China (2009–2013); China Forestry Publishing House: Beijing, China, 2014; p. 86.
  19. Yu, S.; Wang, D.; Dai, W.; Li, P. Soil carbon budget in different-aged Chinese fir plantations in south China. J. For. Res. 2014, 25, 621–626. [Google Scholar] [CrossRef]
  20. Chen, G.; Yang, Z.-J.; Gao, R.; Xie, J.; Guo, J.-F.; Huang, Z.; Yang, Y. Carbon storage in a chronosequence of Chinese fir plantations in southern China. For. Ecol. Manag. 2013, 300, 68–76. [Google Scholar] [CrossRef]
  21. Zhou, L.; He, Z.; Wang, R.; Wu, P.; Ma, X.; Cai, L. Thinning increases understory diversity and biomass, and improves soil properties without decreasing growth of Chinese fir in southern China. Environ. Sci. Pollut. Res. 2016, 23, 24135–24150. [Google Scholar] [CrossRef]
  22. Zhang, Y.; Tigabu, M.; Yi, Z.; Li, H.; Zhuang, Z.; Yang, Z.; Ma, X. Soil parent material and stand development stage effects on labile soil C and N pools in Chinese fir plantations. Geoderma 2019, 338, 247–258. [Google Scholar] [CrossRef]
  23. Yu, X.T. The Chinese Fir Silviculture; Fujian Science and Technology Press: Fuzhou, Fujian, China, 1997; pp. 37–44. [Google Scholar]
  24. Biddle, J.F.; Fitz-Gibbon, S.; Schuster, S.C.; Brenchley, J.E.; House, C.H. Metagenomic signatures of the Peru Margin subseafloor biosphere show a genetically distinct environment. Proc. Natl. Acad. Sci. USA 2008, 105, 10583–10588. [Google Scholar] [CrossRef] [PubMed] [Green Version]
  25. Caporaso, J.G.; Kuczynski, J.; Stombaugh, J.; Bittinger, K.; Bushman, F.D.; Costello, E.K.; Fierer, N.; Peña, A.G.; Goodrich, J.K.; Gordon, J.I.; et al. QIIME allows analysis of high-throughput community sequencing data. Nat. Methods 2010, 7, 335–336. [Google Scholar] [CrossRef] [PubMed] [Green Version]
  26. Faith, D.P. Conservation evaluation and phylogenetic diversity. Biol. Conserv. 1992, 61, 1–10. [Google Scholar] [CrossRef]
  27. Oksanen, J.; Blanchet, F.G.; Kindt, R.; Legendre, P.; Minchin, P.R.; O’Hara, R.B.; Simpson, G.L.; Solymos, P.; Stevens, M.H.H.; Wagner, H. Vegan: Community Ecology Package. R Package Version 2013, 2, 1–295. [Google Scholar]
  28. Kembel, S.W.; Cowan, P.D.; Helmus, M.; Cornwell, W.K.; Morlon, H.; Ackerly, D.D.; Blomberg, S.P.; Webb, C. Picante: R tools for integrating phylogenies and ecology. Bioinformatics 2010, 26, 1463–1464. [Google Scholar] [CrossRef] [Green Version]
  29. Kembel, S.W. Disentangling niche and neutral influences on community assembly: Assessing the performance of community phylogenetic structure tests. Ecol. Lett. 2009, 12, 949–960. [Google Scholar] [CrossRef]
  30. Clarke, K.; Gorley, R.N.; Somerfield, P.; Warwick, R. Change in Marine Communities: An Approach to Statistical Analysis and Interpretation; Primer-E Ltd.: Plymouth, UK, 2014; p. 260. [Google Scholar]
  31. Dini-Andreote, F.; Silva, M.D.C.P.E.; Triadó-Margarit, X.; Casamayor, E.O.; Van Elsas, J.D.; Salles, J.F. Dynamics of bacterial community succession in a salt marsh chronosequence: Evidences for temporal niche partitioning. ISME J. 2014, 8, 1989–2001. [Google Scholar] [CrossRef] [Green Version]
  32. Bastian, M.; Heymann, S.; Jacomy, M. Gephi: An open source software for exploring and manipulating networks. In Proceedings of the International AAAI Conference on Weblogs and Social Media, San Jose, CA, USA, 17–20 May 2009. [Google Scholar]
  33. Newman, M.E.J. Modularity and community structure in networks. Proc. Natl. Acad. Sci. USA 2006, 103, 8577–8582. [Google Scholar] [CrossRef] [Green Version]
  34. Sun, H.; Santalahti, M.; Pumpanen, J.; Koster, K.; Berninger, F.; Raffaello, T.; Jumpponen, A.; Asiegbu, F.O.; Heinonsalo, J. Fungal community shifts in structure and function across a boreal forest fFire chronosequence. Appl. Environ. Microb. 2015, 81, 7869–7880. [Google Scholar] [CrossRef] [Green Version]
  35. Liu, J.; Ha, V.N.; Shen, Z.; Zhu, H.; Zhao, F.; Zhao, Z. Characteristics of bulk and rhizosphere soil microbial community in an ancient Platycladus orientalis forest. Appl. Soil Ecol. 2018, 132, 91–98. [Google Scholar] [CrossRef]
  36. Fierer, N.; Bradford, M.; Jackson, R.B. Toward an Ecological Classification of Soil Bacteria. Ecology 2007, 88, 1354–1364. [Google Scholar] [CrossRef] [PubMed]
  37. Bryant, J.A.; Lamanna, C.; Morlon, H.; Kerkhoff, A.J.; Enquist, B.J.; Green, J.L. Microbes on mountainsides: Contrasting elevational patterns of bacterial and plant diversity. Proc. Natl. Acad. Sci. USA 2008, 105, 11505–11511. [Google Scholar] [CrossRef] [PubMed] [Green Version]
  38. Na, X.; Li, X.; Zhang, Z.; Kardol, P.; Xu, T.T.; Wang, M.; Cao, X.; Ma, F. Bacterial community dynamics in the rhizosphere of a long-lived, leguminous shrub across a 40-year age sequence. J. Soils Sediments 2017, 18, 76–84. [Google Scholar] [CrossRef]
  39. Nielsen, U.N.; Osler, G.H.R.; Campbell, C.; Burslem, D.F.R.P.; Van Der Wal, R. The influence of vegetation type, soil properties and precipitation on the composition of soil mite and microbial communities at the landscape scale. J. Biogeogr. 2010, 37, 1317–1328. [Google Scholar] [CrossRef]
  40. Knelman, J.E.; Legg, T.M.; O’Neill, S.P.; Washenberger, C.L.; González, A.; Cleveland, C.C.; Nemergut, D.R. Bacterial community structure and function change in association with colonizer plants during early primary succession in a glacier forefield. Soil Biol. Biochem. 2012, 46, 172–180. [Google Scholar] [CrossRef]
  41. Landesman, W.; Nelson, D.; Fitzpatrick, M.C. Soil properties and tree species drive ß-diversity of soil bacterial communities. Soil Biol. Biochem. 2014, 76, 201–209. [Google Scholar] [CrossRef]
  42. Wang, J.; Shen, J.; Wu, Y.; Tu, C.; Soininen, J.; Stegen, J.; He, J.-Z.; Liu, X.; Zhang, L.; Zhang, E. Phylogenetic beta diversity in bacterial assemblages across ecosystems: Deterministic versus stochastic processes. ISME J. 2013, 7, 1310–1321. [Google Scholar] [CrossRef]
  43. Narwani, A.; Matthews, B.; Fox, J.; Venail, P. Using phylogenetics in community assembly and ecosystem functioning research. Funct. Ecol. 2015, 29, 589–591. [Google Scholar] [CrossRef] [Green Version]
  44. Goberna, M.; Garcia, C.; Verdú, M. A role for biotic filtering in driving phylogenetic clustering in soil bacterial communities. Glob. Ecol. Biogeogr. 2014, 23, 1346–1355. [Google Scholar] [CrossRef]
  45. Chase, J.M.; Myers, J.A. Disentangling the importance of ecological niches from stochastic processes across scales. Philos. Trans. R. Soc. B Boil. Sci. 2011, 366, 2351–2363. [Google Scholar] [CrossRef] [Green Version]
  46. Martiny, J.B.H.; Jones, S.E.; Lennon, J.T.; Martiny, A.C. Microbiomes in light of traits: A phylogenetic perspective. Science 2015, 350, aac9323. [Google Scholar] [CrossRef] [Green Version]
  47. Warwick, R.; Clarke, K.R.; Pienkowski, M.W.; Watkinson, A.R.; Kerby, G. Taxonomic distinctness and environmental assessment. J. Appl. Ecol. 1998, 35, 532–543. [Google Scholar] [CrossRef]
  48. Letcher, S.G. Phylogenetic structure of angiosperm communities during tropical forest succession. Proc. R. Soc. B Boil. Sci. 2009, 277, 97–104. [Google Scholar] [CrossRef] [PubMed] [Green Version]
  49. Giovannoni, S.J.; Thrash, J.C.; Temperton, B. Implications of streamlining theory for microbial ecology. ISME J. 2014, 8, 1553–1565. [Google Scholar] [CrossRef] [PubMed] [Green Version]
  50. Feng, Y.; Guo, Z.; Zhong, L.; Zhao, F.; Zhang, J.; Lin, X. Balanced Fertilization Decreases Environmental Filtering on Soil Bacterial Community Assemblage in North China. Front. Microbiol. 2017, 8, 2376. [Google Scholar] [CrossRef] [Green Version]
  51. Wiens, J.J.; Graham, C. NICHE CONSERVATISM: Integrating Evolution, Ecology, and Conservation Biology. Annu. Rev. Ecol. Evol. Syst. 2005, 36, 519–539. [Google Scholar] [CrossRef] [Green Version]
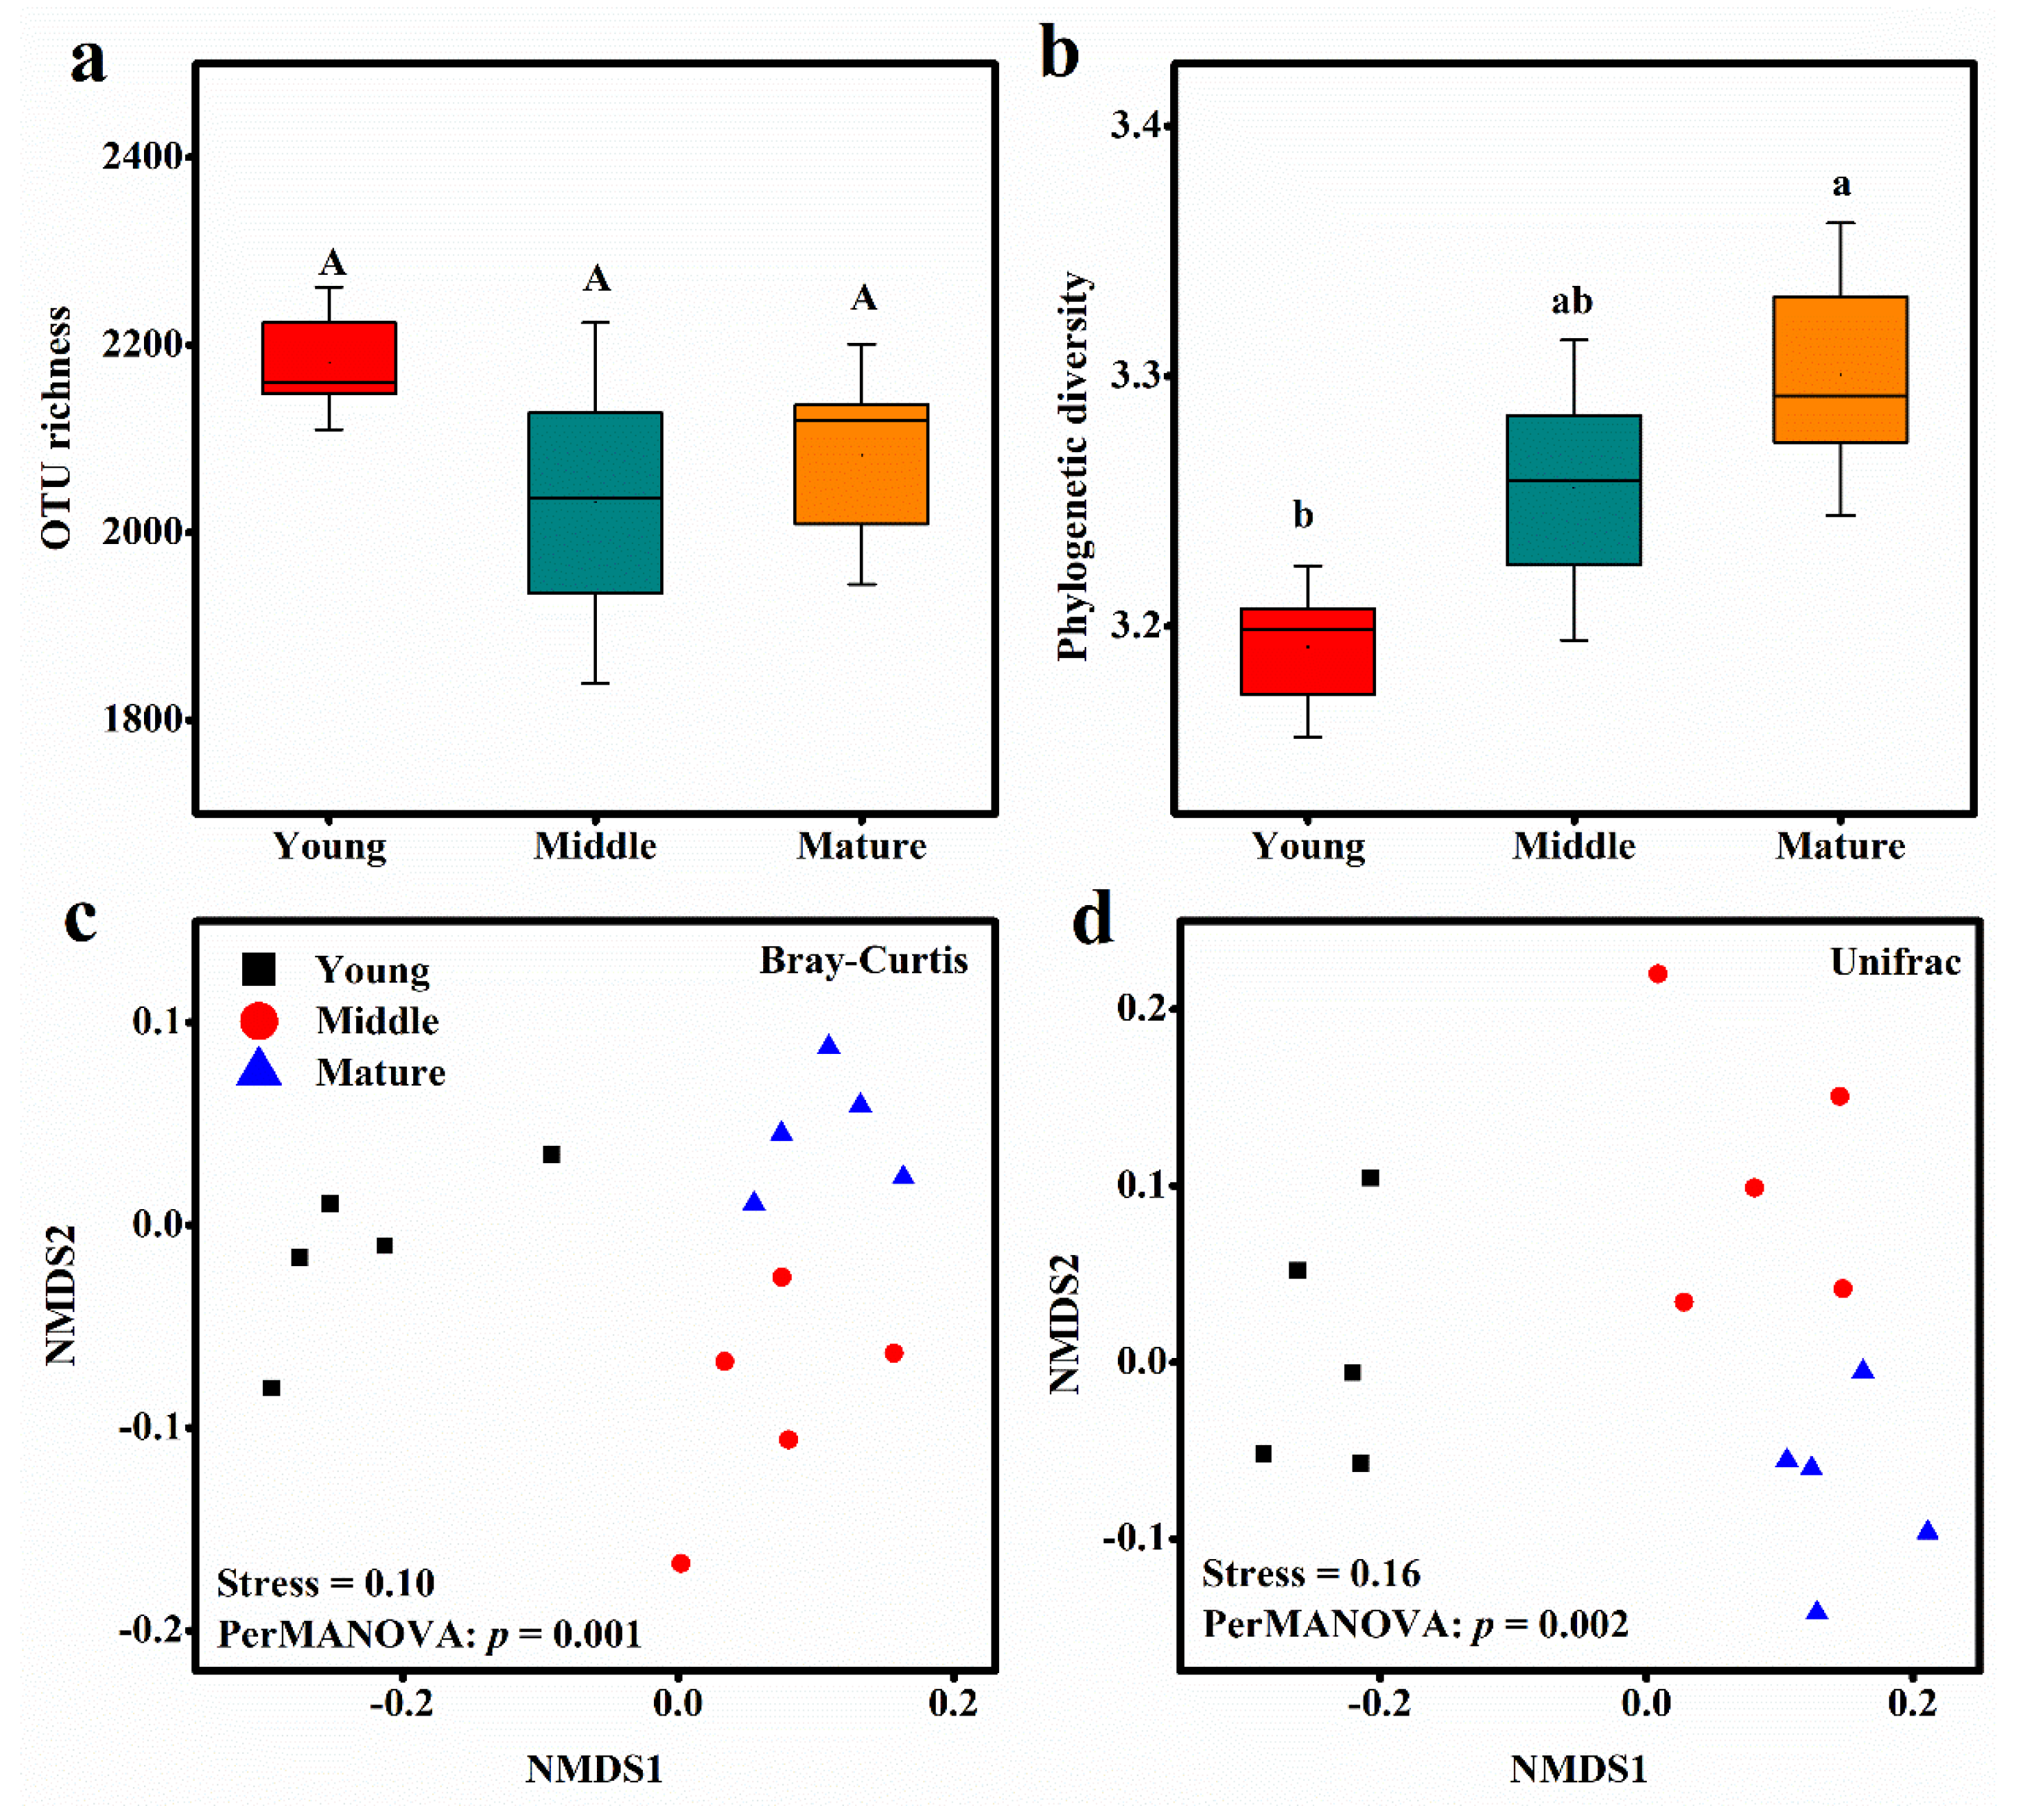
Figure 1. Operational taxonomic units (OTU) richness (a), phylogenetic diversity (b), taxonomic composition (c) and phylogenetic composition (d) of soil bacterial communities under different development ages of C. lanceolata plantations. No different uppercase letters above bars indicate no differences of OTU richness among different development ages of C. lanceolata plantations. Different lowercase letters above bars indicate significant differences of phylogenetic diversity among different development ages of C. lanceolata plantations (p < 0.05).
Sustainability 12 01864 g001
Figure 2. Relative abundance of the dominant bacterial phyla (a) and redundancy analysis of bacterial groups with environmental factors (b) under different development ages of C. lanceolata plantations. Vertical T bars indicate standard deviations (SD). Different letters indicate significant differences among different development ages of C. lanceolata plantations (p < 0.05). TC, total carbon; TN, total nitrogen; DOC, dissolved organic carbon; AP, available phosphorus.
Sustainability 12 01864 g002
Figure 3. Significant responded bacterial groups at genus level between young and mature (a), between mature and middle (b) by using t-test analysis at 95% confidence intervals.
Sustainability 12 01864 g003
Figure 4. Relative importance of stand age and environmental factors to bacterial community composition (a) and phylogenetic diversity (b) determined by distance based linear model analysis (distLM) under different development ages of C. lanceolata plantations. TC, total carbon; TN, total nitrogen; DOC, dissolved organic carbon; AP, available phosphorus.
Sustainability 12 01864 g004
Figure 5. Network co-occurrence analysis of bacterial communities of young (a), middle (b) and mature (c) C. lanceolata plantations. Each node represents a bacterial phylotype (an OTU clustered at 97%) and is colored at the phylum level. The size of each node is proportional to the number of connections (that is, degree). An edge stands for statistically strong (Spearman’r > 0.9; positive correlation-red edges; negative correlation-blue edges) and significant (p < 0.01) correlation. The width of each edge represents its weight.
Sustainability 12 01864 g005
Figure 6. Phylogenetic clustering of the soil bacterial communities based on the mean pairwise phylogenetic distance (MPD) (a) and the nearest relative index (NRI) (b) under different development ages of C. lanceolata plantations. Asterisk (*) in the column indicates that the NRI value is significantly larger from zero by t-test. Vertical T bars indicate standard deviations (SD). Different uppercase letters above bars indicate significant differences of MPD among different development ages of C. lanceolata plantations, and different lowercase letters above bars indicate significant differences of NRI among different development ages of C. lanceolata plantations (p < 0.05).
Sustainability 12 01864 g006
Table 1. Mantel test results for the correlation between bacterial community composition and environmental variables for bacteria under different development ages of C. lanceolata plantations.
Variablerp
Stand age0.6350.002
Soil moisture0.5190.002
TC0.5480.001
TN0.5280.001
AP0.2870.025
DOC0.0700.701
NH4+-N0.0810.763
NO3-N0.1160.129
pH0.0430.366
TC, total carbon; TN, total nitrogen; DOC, dissolved organic carbon; AP, available phosphorus; Values in bold indicate significant correlation (p < 0.05).
Table 2. Topological properties of networks obtained of each age of plantations.
Network MetricsYoungMiddleMature
Number of nodes567667
Number of edges180204236
Average clustering coefficient0.2220.2590.282
Modularity0.5110.7120.579
Average degree3.2142.6843.522