1. Introduction
The Industry 4.0 paradigm is based on sensors, machines, workpieces and IT systems being connected along the value chain. These connected cyberphysical systems can interact with one other using Internet-based protocols and analyze data to configure themselves and adapt to changes [
1]. In the Industry 4.0-oriented approach, simulations are used extensively in specific plant operations. The digital twin of the manufacturing or processing architecture will become a part of the manufacturing plant design [
2]. This digital twining will provide a diagnosis of the system performances in different manufacturing scenarios based on simulations including machines, products, and humans [
3]. In this paradigm, operators test and optimize the machine settings during the manufacturing process in the virtual world, thereby driving down machine setup times. Manufacturer’s sensors and machines are networked and make use of embedded computing using digital twining in order to introduce changes in the manufacturing scenarios [
4]. All structural elements of the manufacturing architectures are enriched with embedded computing and connected to communicate and interact both with one another and with centralized controllers as necessary [
5]. Products are identified by radio frequency codes, and workstations are informed about the manufacturing steps that must be performed for each product to perform the specific operation. Transforming manufacturing devices in smart products requires a rethinking of design. As intelligent, connected devices, which are increasingly embedded in broader systems, manufacturing devices radically reshape industrial engineering. Manufacturing goes beyond the production of the physical object, because operating a smart, connected manufacturing device requires a supporting cloud-based system [
6]. The digital twin of the manufacturing architecture is related with all the above-mentioned technologies used in this paradigm.
Big data is one of the nine pillars involved in achieving Industry 4.0. A huge amount of data are available in manufacturing systems, waste management systems, etc., but the data and information should be properly collected, encoded and transmitted to the cloud application in order to be processed and to allow a real-time monitoring of equipment and systems. The major challenges are represented by: data acquisition from smart sensors, actuators and PLCs; data conversion; data security and privacy; data encoding, encryption and decryption [
7,
8,
9,
10].
Software architectures of the big data processing platforms are analyzed in the literature, including solutions for job scheduling for big data applications [
11], solutions which offer a flexible co-programming architecture able to support the life cycle of time-critical cloud native applications [
12], mobility-driven cloud-fog-edge collaborative real-time framework solution, which has IoT, Edge, Fog and Cloud layers and which exploits the mobility dynamics of the moving agent [
13].
Several data encoding and encryption solutions for cloud applications are presented in the literature [
14,
15,
16,
17,
18,
19,
20,
21,
22], but without including detailed case studies to present identified problems, propose solutions, and implement results.
The main problem is the identification of the right solution that will ensure the data transmission and processing in a secure way, quickly, efficiently and with low costs. The proposed solution presented in Chapter 2 can be used both in smart factories and for smart city applications including automated waste collection systems.
Waste management comprises prevention, collection (metal, paper, cardboard, aluminum cans plastic), removal, recycling, reuse, and safe disposal of toxic and dangerous waste. In order to perform these activities at all levels of households, institutions, community and industrial entities, a complex monitoring system is needed.
Anagnostopoulos et al. [
23] suggest the use of various devices like RFIDs, sensors, and actuators to transform different objects into “smart things”. The role of smart things embedded in the environment is to monitor and collect ambient information. Embedding “smart things” in the city environment may lead to “smart cities” [
23]. The promise of smart cities is great because intelligent services could be offered on top of such information related to any aspect of humans’ activities. Perera et al. [
24] pointed to the need for a service model for smart cities supported by the Internet of Things (IoT).
IoT network is a decentralized network in which mobile devices communicate with gateways and they pass the information to the applications. In order to secure the communication channel, security access protocols such as Diffie–Hellman algorithm are implemented, based on symmetric encryption keys and RSA Rivest–Shamir–Adleman (RSA) and based on a public encryption key and a private decryption key. These encryption algorithms are relatively slow. The changing of keys also requires a time synchronization between all network devices, for which the following are used: network time protocol (NTP), based on GPS time synchronization, precision time protocol (PTP), based on time server, and time lay technique (in this technique, an average time of all nodes is computed and used as a reference). All this leads to the increased complexity of the system and supplemental power consumption.
To highlight the efficiency of the proposed solution for data encoding and encryption for cloud applications, we conducted a case study on an automated waste collection systems developed in a previous research project.
The automated waste collection system concept developed in a previous research project consists in different modules based on the waste type:
Plastic recipients and glass bottles and aluminum cans module;
Small waste electrical and electronic equipment module;
Large waste electrical and electronic equipment module;
Cardboard and paper module;
Batteries module.
Thanks to modularity, different configurations of the system can be obtained based on location requirements. Currently, only the plastic recipients and glass bottles and aluminum cans module has been developed and is already operating on the market, but in the near future other modules will be developed and added to the existing module.
The plastic recipients and glass bottles and aluminum cans module consists of:
The RVM equipment identifies and sorts the waste. The conveyor transports the waste to the dedicated container (cans, plastic, glass). The conveyer contains deviation units to sort the waste to the dedicated container. The ultrasonic sensors notices when a container is full and the conveyer will transport the waste to the next available container. At the end, the client receives the voucher [
25].
The paper is organized as follows: In
Section 2, details about the new method of data encoding and encryption for cloud applications using PNG format images are presented. In
Section 3, the case study results are presented, while
Section 4 discusses the conclusion of the research.
2. Materials and Methods
To send all the data from smart sensors, actuators, PLCs, etc., into the cloud, a new method of data encoding and encryption using images in PNG format is presented. In the proposed method, pixels are generated according to data values and type, and afterwards they are encrypted using a symmetric key (RGB pixel values from a different image).
The color of each pixel may be defined by three component values, R, G and B, ranging between 0 and 255, or 0 and FF in hexadecimal [
26].
Depending on the type of values to be stored, several encoding methods for generating the pixel colors are used:
In the case of positive integers between 0 and 16,777,215, the encoding can be done directly by converting the decimal number to hexadecimal (ex. 16,777,215 becomes FFFFFF), the six-digit hexadecimal string explodes into three groups of two digits and each of this group is (R = 255, G = 255 and B = 255, in this case, a white pixel corresponding to the maximum value that can be stored);
In the case of float numbers, the conversion is done to 16-digit hexadecimal values: 00.00.00.00.00.00.00.00, requiring three pixels for storage (R1G1B1, R2G2B2, and R3G3, the last component, B3, is not used). Thus, any float value with any number of decimals, positive or negative, (in IEEE 754 double-precision standard, the full range of numbers is −9.999999 × 1096 through 9.999999 × 1096) can be archived using a group of three consecutive pixels. The image will have the number of pixels equals three times the number of archived float values;
For String, alphanumeric values (UTF8), the conversion of each alphanumeric character into hexadecimal is made according to the UTF8 encoding table or a custom-defined table (for example, A becomes hex: 41, z becomes hex: 7a), so each pixel can store a hexadecimal to a decimal number of three alphanumeric characters, one for each component—R, G, and B. The image will have a number of pixels equal to one third of the total number of characters.
Booleans values can be stored as alphanumeric values 0 and 1.
For encrypting data of any kind, corresponding to the above-mentioned encoding methods, an encryption image with the number of pixels equal to the number of stored variables is used.
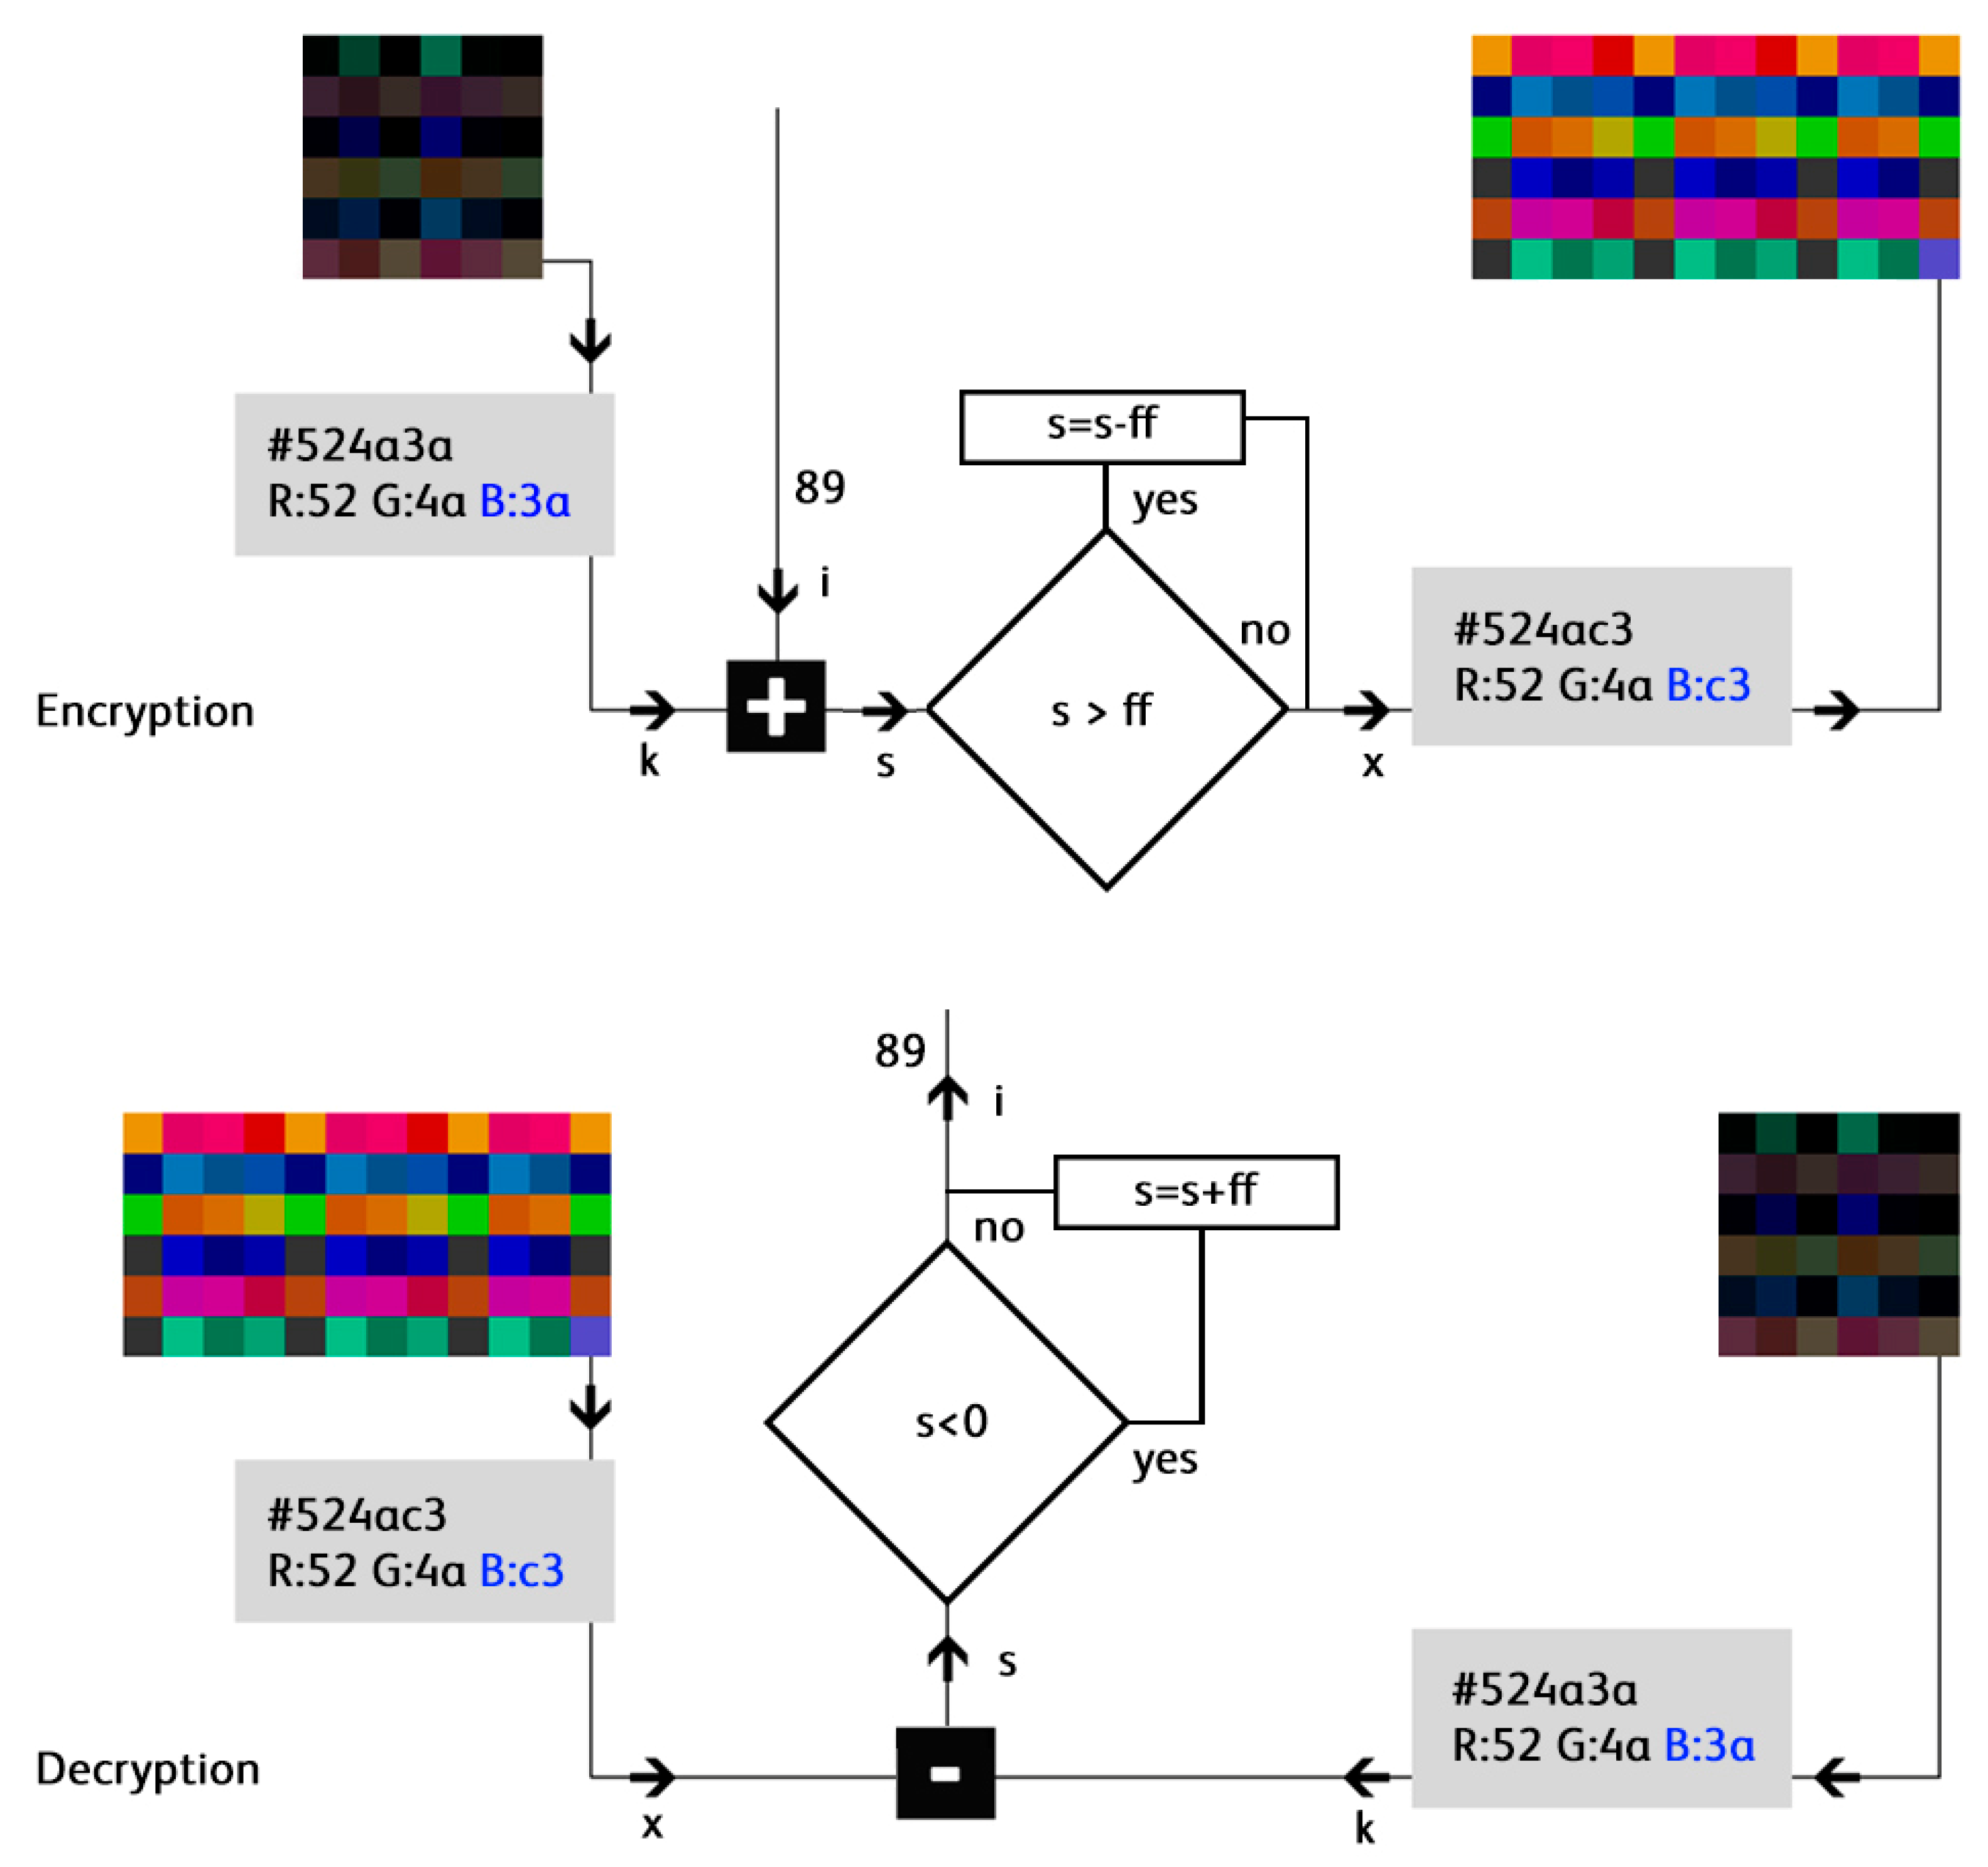
The automated generation of the image key is based on image size and uses random values for Rk, Gk, Bk. When variables (properties values) are encoded, for each variable converted in hexadecimal, the hexadecimal value returned from the correspondent pixel in the image key will be added (for the first variable will be used the first pixel, for the second variable the second pixel, and so on, or we can scramble the pixel order based on an established rule). The hex sum or RGB values or only one hex value can be used (from R, G, or B, based on a variable ID established rule). If the resulting value of R, G or B is greater than 255, (FF in hex), the result will be decreased by 255 (FF in hex).
The decryption and decoding process is analogous but in reverse. In other words, from the hexadecimal value returned by decoding the RGB values of each group of pixels (based on variable type and encoding method) the hexadecimal value returned by RGB of the correspondent pixel in the Image Key will be subtracted based on the established rule, and then, based on the encoding method, the variable value will be decoded. If the value obtained by subtraction is negative, then this value will be increased with 255 (FF in hex) before decoding the variable value. (
Figure 1).
Some descriptive information may also be entered in the first pixels of the storage image, such as: time stamp, location ID, the number of variables of each type, the size of varchar variables (number of characters), like a dictionary. In this way, a more flexible solution can implemented. For example, the first three pixels will store the timestamp (as a float), the fourth pixel will store the location ID (as integer), pixels 5, 6, 7, 8 will store data types, the number of variables of each data type and the order of placement in the image, and pixel 9 will store the number of characters of the varchar variable. For the type of variable, the values are: 1 for Boolean, 2 for integer, 3 for float, 4 for varchar. Regarding the order of placement, the data will be sorted by variable type before encoding, the number of variables of each type will be counted, and then an order of encoding for each type of variables will be selected.
For descriptive information, nine pixels will be used:
4 × Booleans, order 1 (using four pixels, from 10 to 13);
6 × integers, order 2 (using sox pixels, from 14 to 19);
12 × float, order 3 (using 36 pixels, from 20 to 55);
1 × varchar order 4, size 8 (characters) (using three pixels, from 56 to 58).
In this case, the pixels 5, 6, 7, 8, 9 with: [R: 1, G: 4, B: 1], [R: 2, G: 7, B: 2], [R: 3, G: 12, B: 3], [R: 4, G: 1, B: 4], [R: 0, G: 0, B: 8] will be generated.
The generated image will have: 4 pixels (for timestamp) + 5 pixels (for variable dictionary) + 4 pixels for Booleans + 6 pixels for integers + 36 pixels for float + 3 pixels for varchar, in total 58 pixels for data storage. If one wants to use an image with 1:1 aspect ratio, the number of pixels for width and height can be computed using this formula:
where w: image width (in pixels), h: image height (pixels), n: number of pixels needed for storage
In the above example, a minimum of 58 pixels is needed, so the image will have
The generated image will have 64 pixels (8 × 8), with the first 58 pixels containing our data and the other six unused pixels.
Using this approach, it will be much easier to read any kind of generated images by reading the content of the first nine pixels, which describe the structure and content of the image.
The central cloud application receives data from multiple distributed systems and stores this telemetry data in an image-based database. The web interface allows the live monitoring of image feeds from cameras, loading weights and filling level data and condition monitoring information, and is able to generate multiple reports for each equipment or module. Alarms can also be sent in case of malfunction or when the waste must be collected. Using a graphical map, the application suggests the most economical route for discharging the waste for each city.
The interface views of the application are the following:
a. Dashboard view
The dashboard shows some reports and live information:
Number of collection centers;
Number of collecting modules;
Daily quantity of waste collected for each type of waste (plastic recipients, glass bottles, aluminum cans);
Errors reported by the condition monitoring with links to a detailed view of the corresponding collecting modules;
Filling rate statistics with links to a corresponding collecting module, with a filling rate greater than 80 %.
b. Collection system view
This view shows the specific information regarding each collection system:
Center location (longitude and latitude, street address and map view);
Number and types of collecting modules;
Historian telemetry reading for all modules;
Errors reported by the condition monitoring.
c. Live video feeds view from each collecting module
This view automatically shows camera flows from active collection modules and also allows the manual selection of all installed video cameras from collecting modules.
d. Discharging map view (at city level)
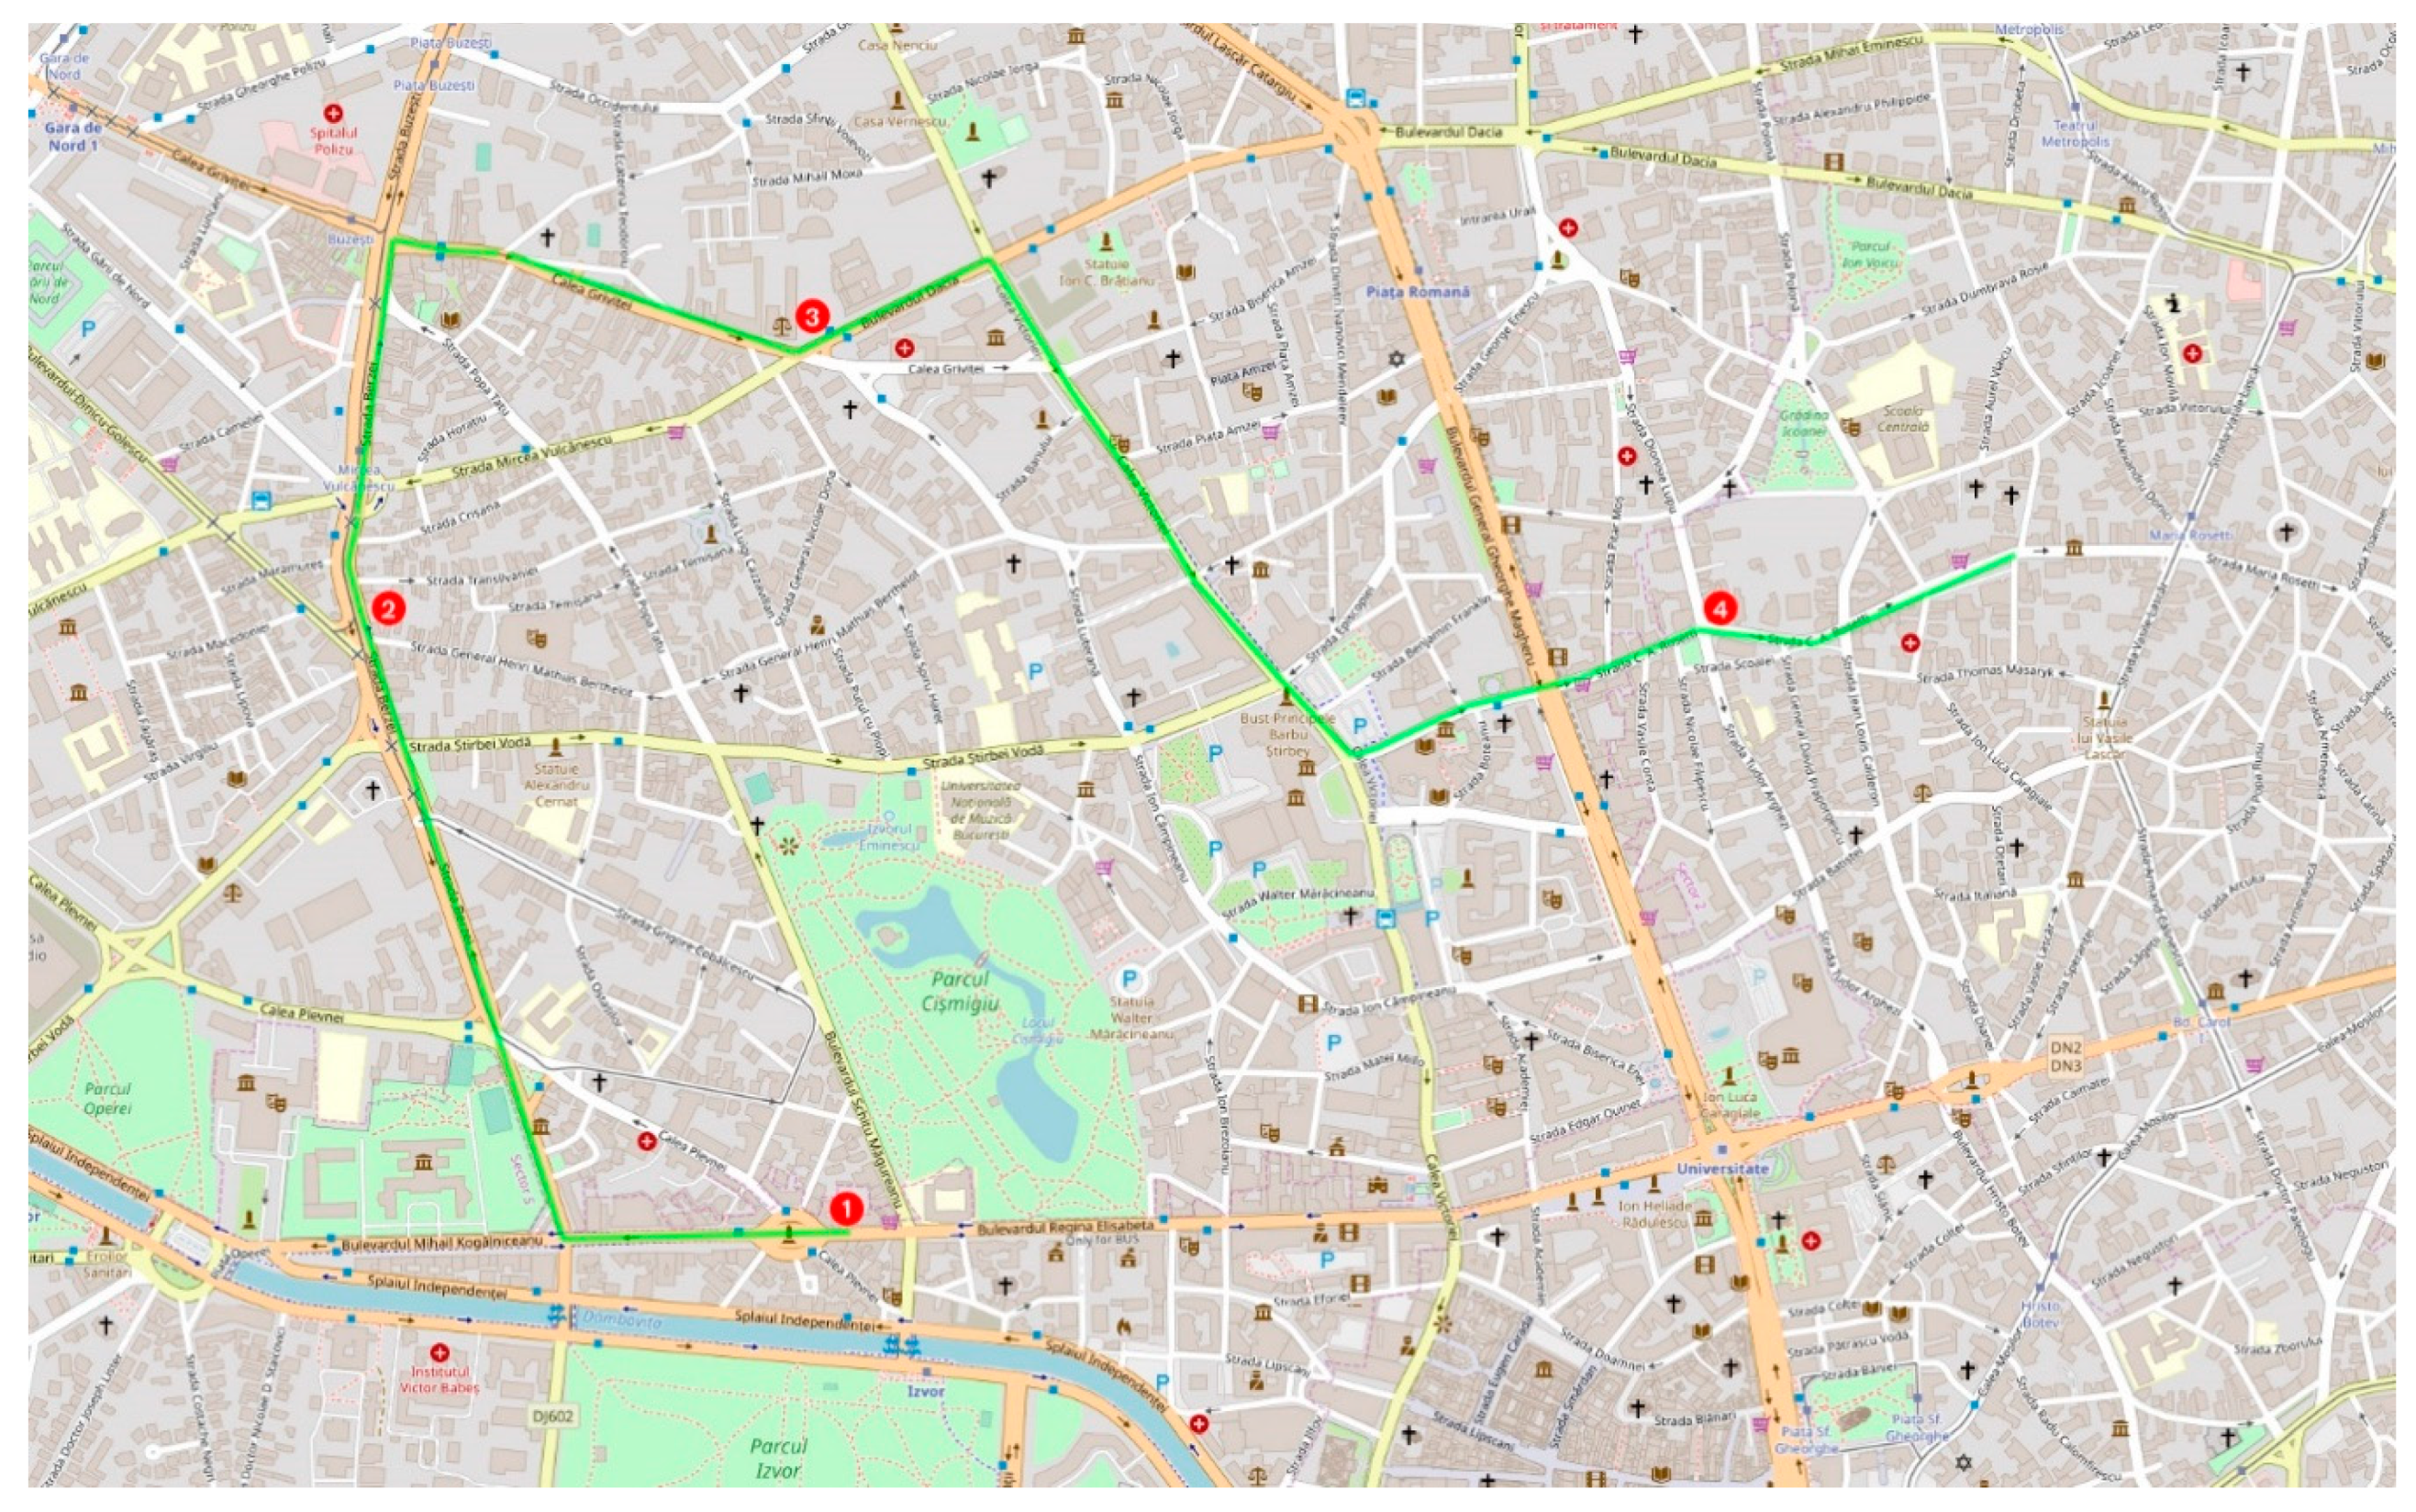
The implementation of the map (
Figure 2) was made using GO.js (
https://gojs.net), by superimposing the path layer above a leaflet mapping library (
https://leafletjs.com/) and the routing was done using leaflet routing machine library (
https://www.liedman.net/leaflet-routing-machine/). The application reads all the locations of modules in the city with a filling rate of more than 80%, reads their geographical coordinates, places them on the city map and draws the most economical discharging route using several points.
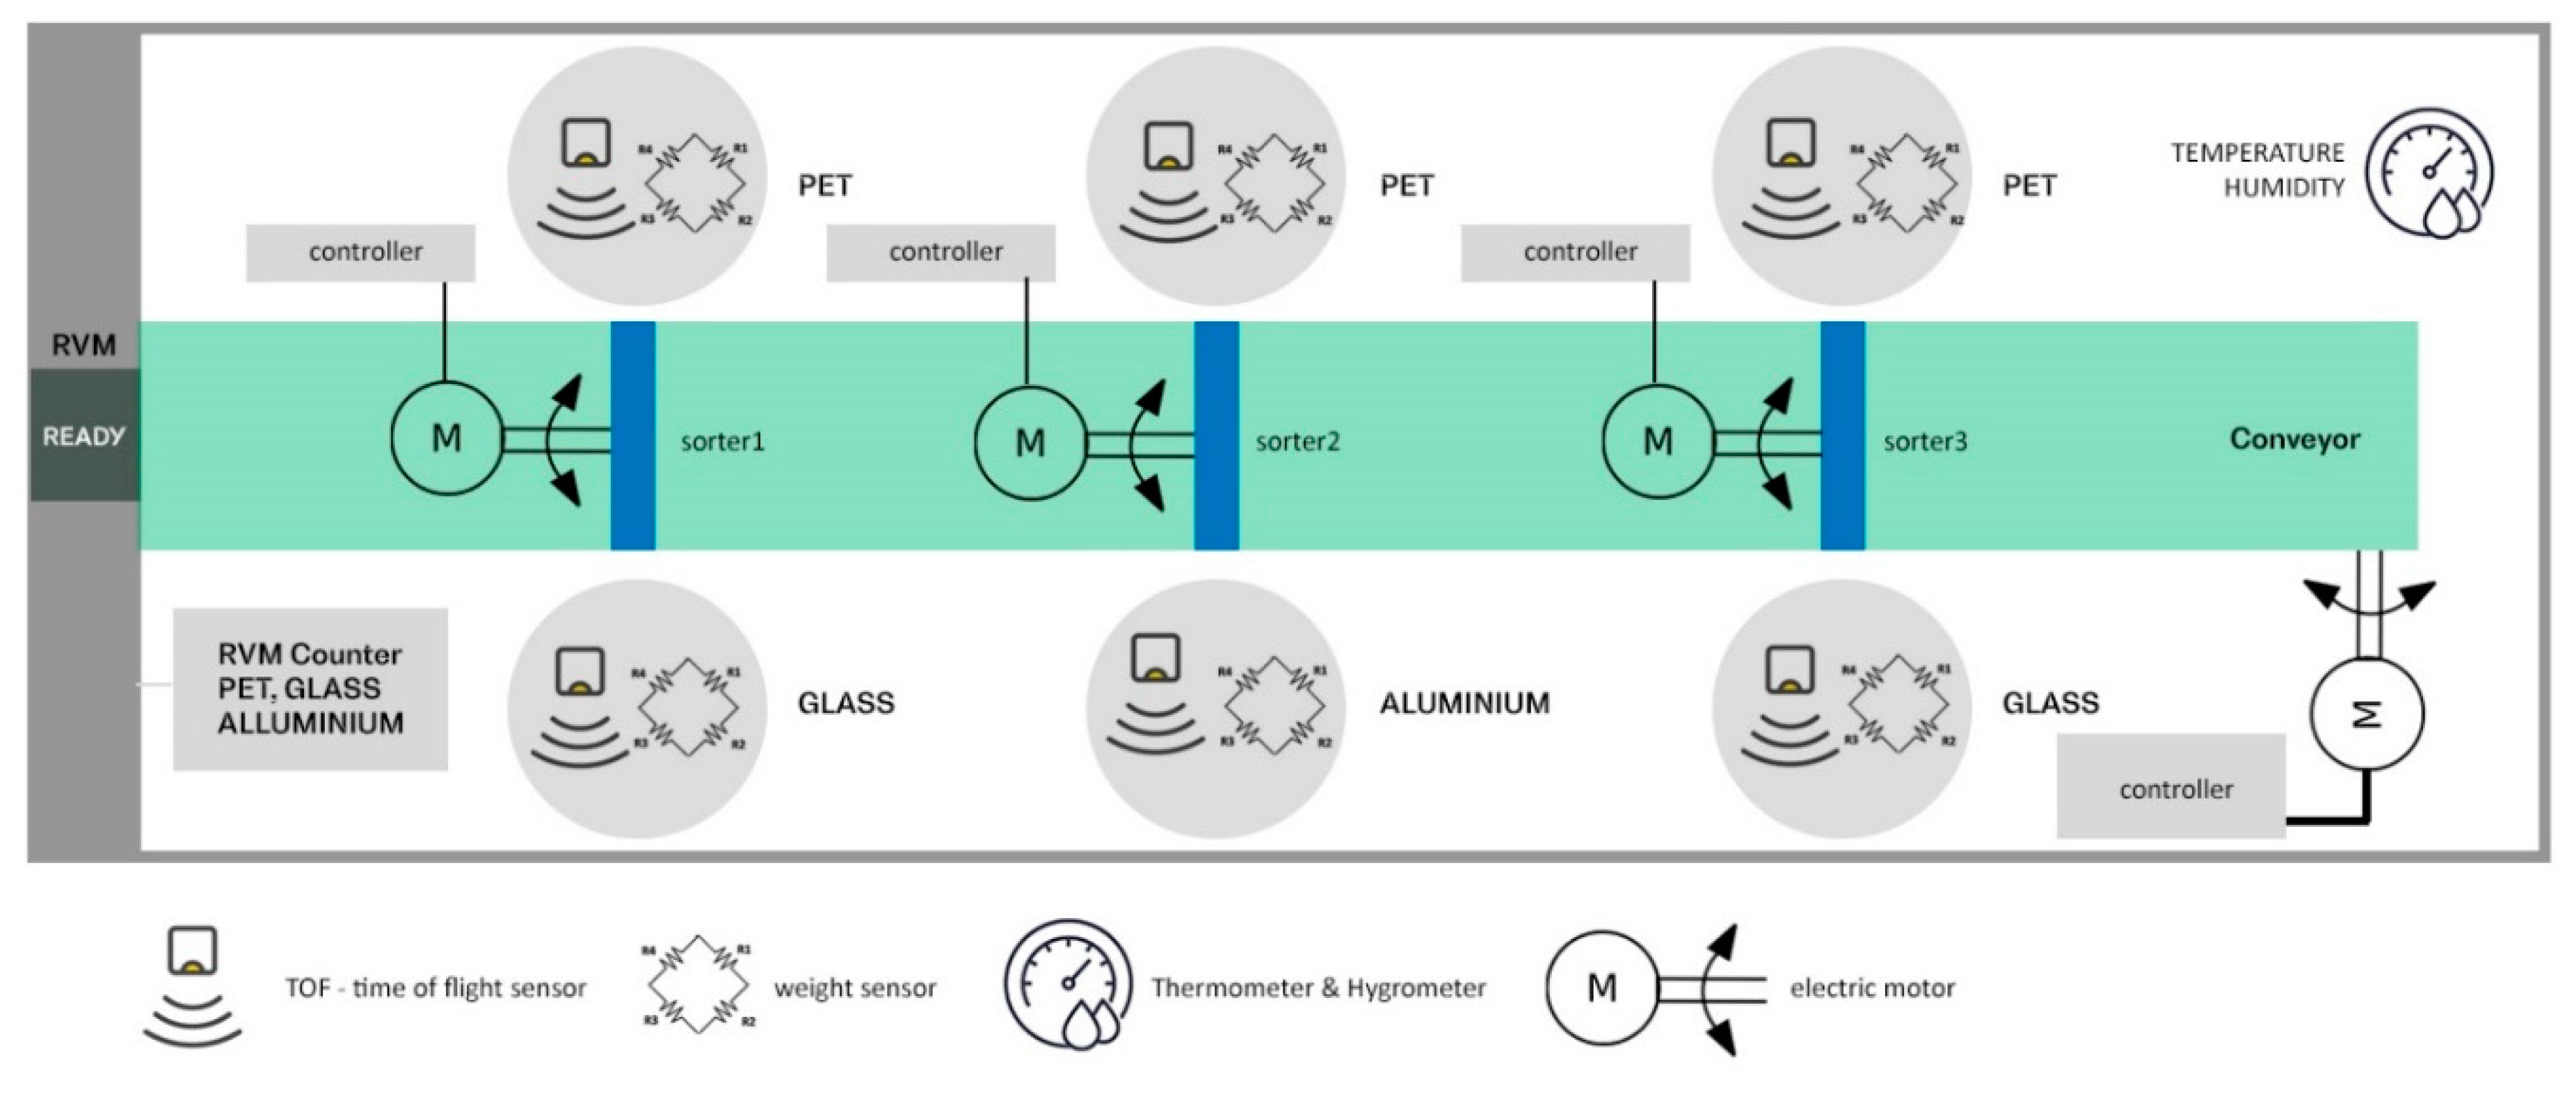
For the case study, a plastic recipients and glass bottles and aluminum cans module composed of RVM, conveyor, three sorting systems and six smart bins is presented (
Figure 3).
Figure 3 shows the diagram for the location of the sensors for each component, in order to collect the data as well as the controllers of the in-line motors.
Several pieces of equipment have been used:
8 × ESP 32 microcontroller (development boards with ESP-WROOM-32, wireless and Bluetooth);
6 × Time of flight sensors (VL53L1X ToF Distance Ranging Sensor 4m);
6 × Button load cells 1000 kg;
5 × Raspberry PI (Raspberry Pi 4 Model B/1GB), one for the edge server and four as motor controllers;
3 × L298N DC Motor Drive Controller Board Module;
1 × DHT22 humidity and temperature sensor of −40 to 80 °C (accuracy ±0.5 °C) and humidity from 0% to 100% (accuracy ±2%);
1 × Wireless router (Netgear Nighthawk AC1900).
From the plastic recipients and glass bottles and aluminum cans module, different data from sensors, RVM and motor controllers are collected. The data from RVM (number of collected items: plastic recipients, glass bottles and aluminum cans) are collected with an ESP 32 microcontroller; the weight and level of filling on each container are collected with six container filling detectors and the status of conveyor and sorting systems is determined using the motor controllers. A hygrometer connected to an ESP32 captures temperature and humidity. All these microcontrollers are connected to a local wireless network. On the same network, there is a raspberry PI as a central edge server, that reads the data from each microcontroller using the local wireless network and exports the data to the central server.
Each second the following data are collected:
Timestamp: float;
RVM status: BOOLEAN (1: OK, 0: STUCK);
CONVEYOR STATUS: integer (1: RUNNING, 2: PAUSE, 3:STUCK);
Separator 1: BOOLEAN (1: OK, 0: STUCK);
Separator 2: BOOLEAN (1: OK, 0: STUCK);
Separator 3: BOOLEAN (1: OK, 0: STUCK);
Collected PET: float;
Collected GLASS: float;
Collected ALUMINIUM: float;
Container1 filling rate: integer (form 0 to 100);
Container1 weight: float;
Container2 filling rate: integer (form 0 to 100);
Container2 weight: float;
Container3 filling rate: integer (form 0 to 100);
Container3 weight: float;
Container4 filling rate: integer (form 0 to 100);
Container4 weight: float;
Container5 filling rate: integer (form 0 to 100);
Container5 weight: float;
Container6 filling rate: integer (form 0 to 100);
Container6 weight: float;
Hygrometer sensor Si7021 temperature: float;
Hygrometer sensor Si7021 Humidity: float.
Data type:
Boolean: 4;
Integer: 7;
Float: 12.
In the case study, two methods for data transmission and database storage were used, one using the proposed PNG image database and a classical method using JSON files and a Cassandra database.
In the classical method, the data are sent from the edge server in JSON format over the internet and stored in a Cassandra database.
JSON stands for JavaScript Object Notation, and is a concise hierarchical data serialization syntax that is supported by all modern browsers. This format makes it a lightweight way of representing objects, while remaining human-readable [
27]. For this reason, it has replaced XML notation on many platforms.
JSON values can be any one of the following:
String (contained with quotes);
Number (integers and decimals);
Boolean (written as true or false, without quotes);
Object (wrapped in curly braces, thus creating a hierarchy);
Array (wrapped in square brackets and can contain lists of any type, including mixed types);
Null (written exactly as null to denote a non-value).
The Apache Cassandra database is a modern solution for data storage with linear scalability, fault tolerance and support in replicating across multiple datacenters, being one of the favorite solutions for IoT. Cassandra was designed as decentralized to handle big data workloads across multiple nodes without any single point of failure [
28,
29]. Cassandra has a peer-to-peer distributed system across its nodes, and data are distributed among all the nodes in a cluster. All the nodes in a cluster play the same role. Each node is independent and, at the same time, interconnected to other nodes [
30].
Each node in a cluster can accept read and write requests, regardless of where the data are actually located in the cluster. When a node goes down, read/write requests can be served from other nodes in the network.
By using the PNG Image database (Method 1), the following values have been obtained:
4 × Boolean: needs one pixel (RGB) + R (from a second pixel);
7 × Integer: needs two pixels (RGB) + G (from a second pixel);
12 × Float: needs 36 pixels;
Total: 40 pixels;
Image size average: 205 bytes (0.2 kB);
Image size on disk 1KB.
During the test, data were sent with a frequency of one data snapshot/second.
For one day operation of the module: data sent (at 1 s snapshot): 86400 × 0.2 kB = 17.280 MB. Using a 3G internet connection with 10 Mb/s upload bandwidth, the average data sending time for each snapshot was 1.953 milliseconds.
Data storage on disk for one day operation of the module: 86.4 MB.
After all the snapshots were uploaded to the central server, the historian data reading speed average was: 0.002833 sec/SELECT WHERE clause.
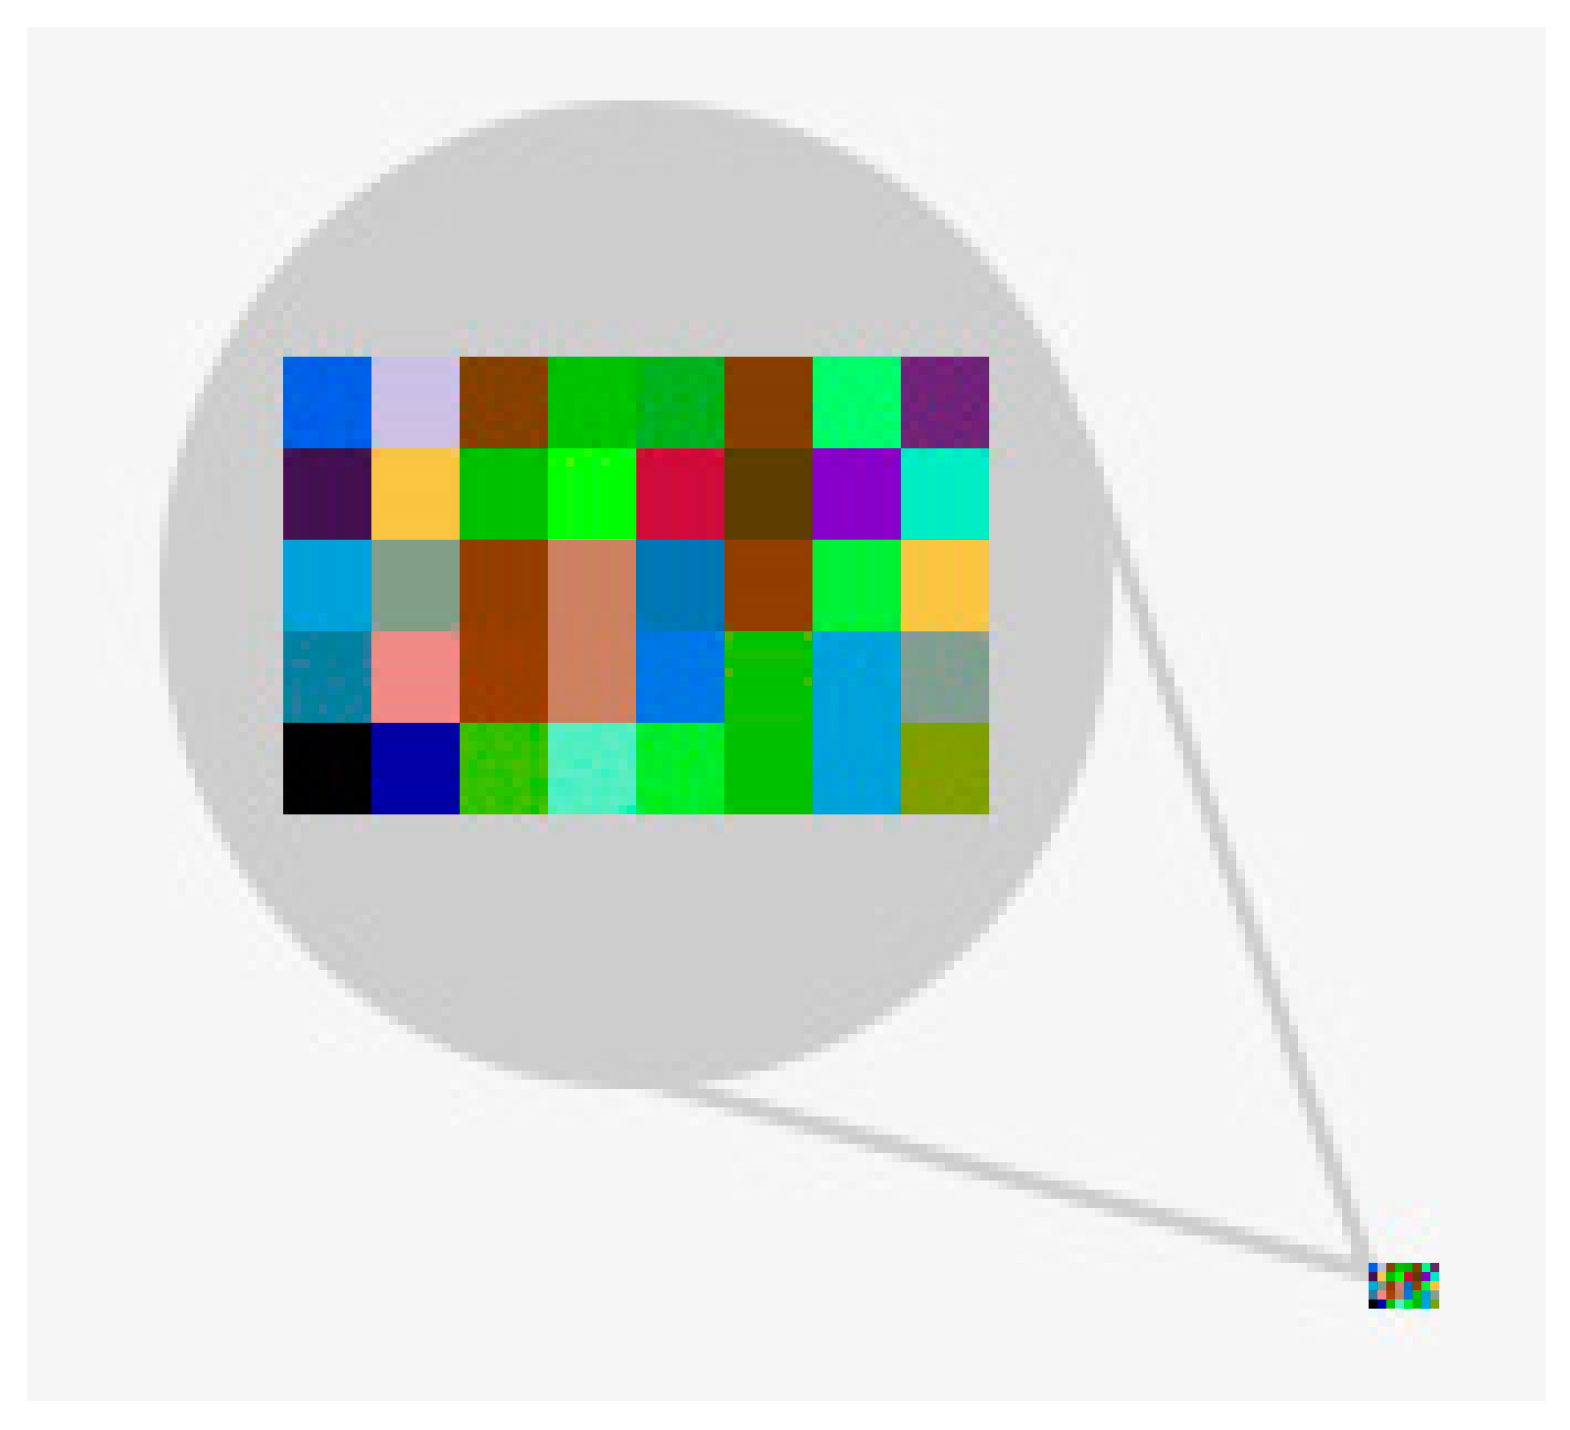
In
Figure 4, one can see in the lower right corner the real size of the PNG image generated based on the transmitted values (8 × 5 pixels). In the center, the same image, magnified 10 times, is represented. Each pixel from top left to bottom right was generated based on R, G, B components and the values of these components were calculated based on the encoding method of each data type using a symmetric image key with the same size (8 × 5 pixels). The snapshot image is very small and the LZW nondestructive compression of PNG image format compresses it even more [
31]. The main advantage of this format for data transmission is that the values are obfuscated and encrypted, so without the proper algorithm and the right image key, it is impossible to read the values.
For testing purposes, in order to be able to perform the experiment in a short period of time, but with a relatively large volume of data, in order to be conclusive, the data were sent with a frequency of one snapshot/second.
By using JSON files (Method 2), the following values have been obtained:
Average JSON file size: 568 B;
Size on disk 1 kB;
One day operation data sent (at 1 s snapshot): 86400 × 0.55 kB = 47.520 MB;
Cassandra database size for one day: 100 MB.
Using the same 3G internet connection with 10 Mb/s upload bandwidth, the average data sending time for each snapshot was 5.42 milliseconds.
By using this method, the values from sensors were sent using JSON format, which is human-readable and is uncompressed, so the JSON file size is slightly bigger.
Compared to the image generated by the image data method, an example of a JSON file looks like this:
| { | |
| "timestamp": 1572964433478, |
| "cell-ID": "0012", |
| "temperature": 21, |
| "humidity": 20, |
| "filling": { |
| "plastic1": 85, |
| "plastic 2": 0, |
| "plastic 3": 0, |
| "glass1": 65, |
| "glass2": 0, |
| "aluminum": 12 |
| }, |
| "weights": { |
| "plastic 1": 350, |
| "plastic 2": 0, |
| "plastic 3": 0, |
| "glass1": 265, |
| "glass2": 0, |
| "aluminum": 25 |
| }, |
| "collected": { |
| "plastic": 860, |
| "glass": 1230, |
| "aluminum": 425 |
| }, |
| "rv-status": 1, |
| "conveyor-status": 1, |
| "separator1-status": 1, |
| "separator2-status": 1, |
| "separator3-status": 1 |
| } | |
By implementing this method of encrypted PNG images, a secure and simple solution for IoT data exchange was tested. This method solves some of the existing problems, providing security without the implementation of secure access protocols such as Diffie–Hellman or RSA and without the need for time synchronization. The method also ensures data compression, allowing for shorter transmission times, and it can be used as an alternative method of historical data storage, replacing the classic databases.
3. Results and Discussion
In a real life scenario, a frequency of one data snapshot/minute will be enough, so our database will be smaller, compared with the database with one data snapshot/second.
In this scenario, by using the PNG Image database (Method 1), during an entire day 1440 images will be sent, of 0.2 kB each, resulting in 288 kB to be sent to the cloud application, and the allocation size on disk will be 1.44 MB for each module.
By using JSON files (Method 2), during an entire day 1440 JSON files will be sent, of 0.55 kB each, resulting in 792 kB to be sent to the cloud application, and the Cassandra database will increase by about 2 MB/day.
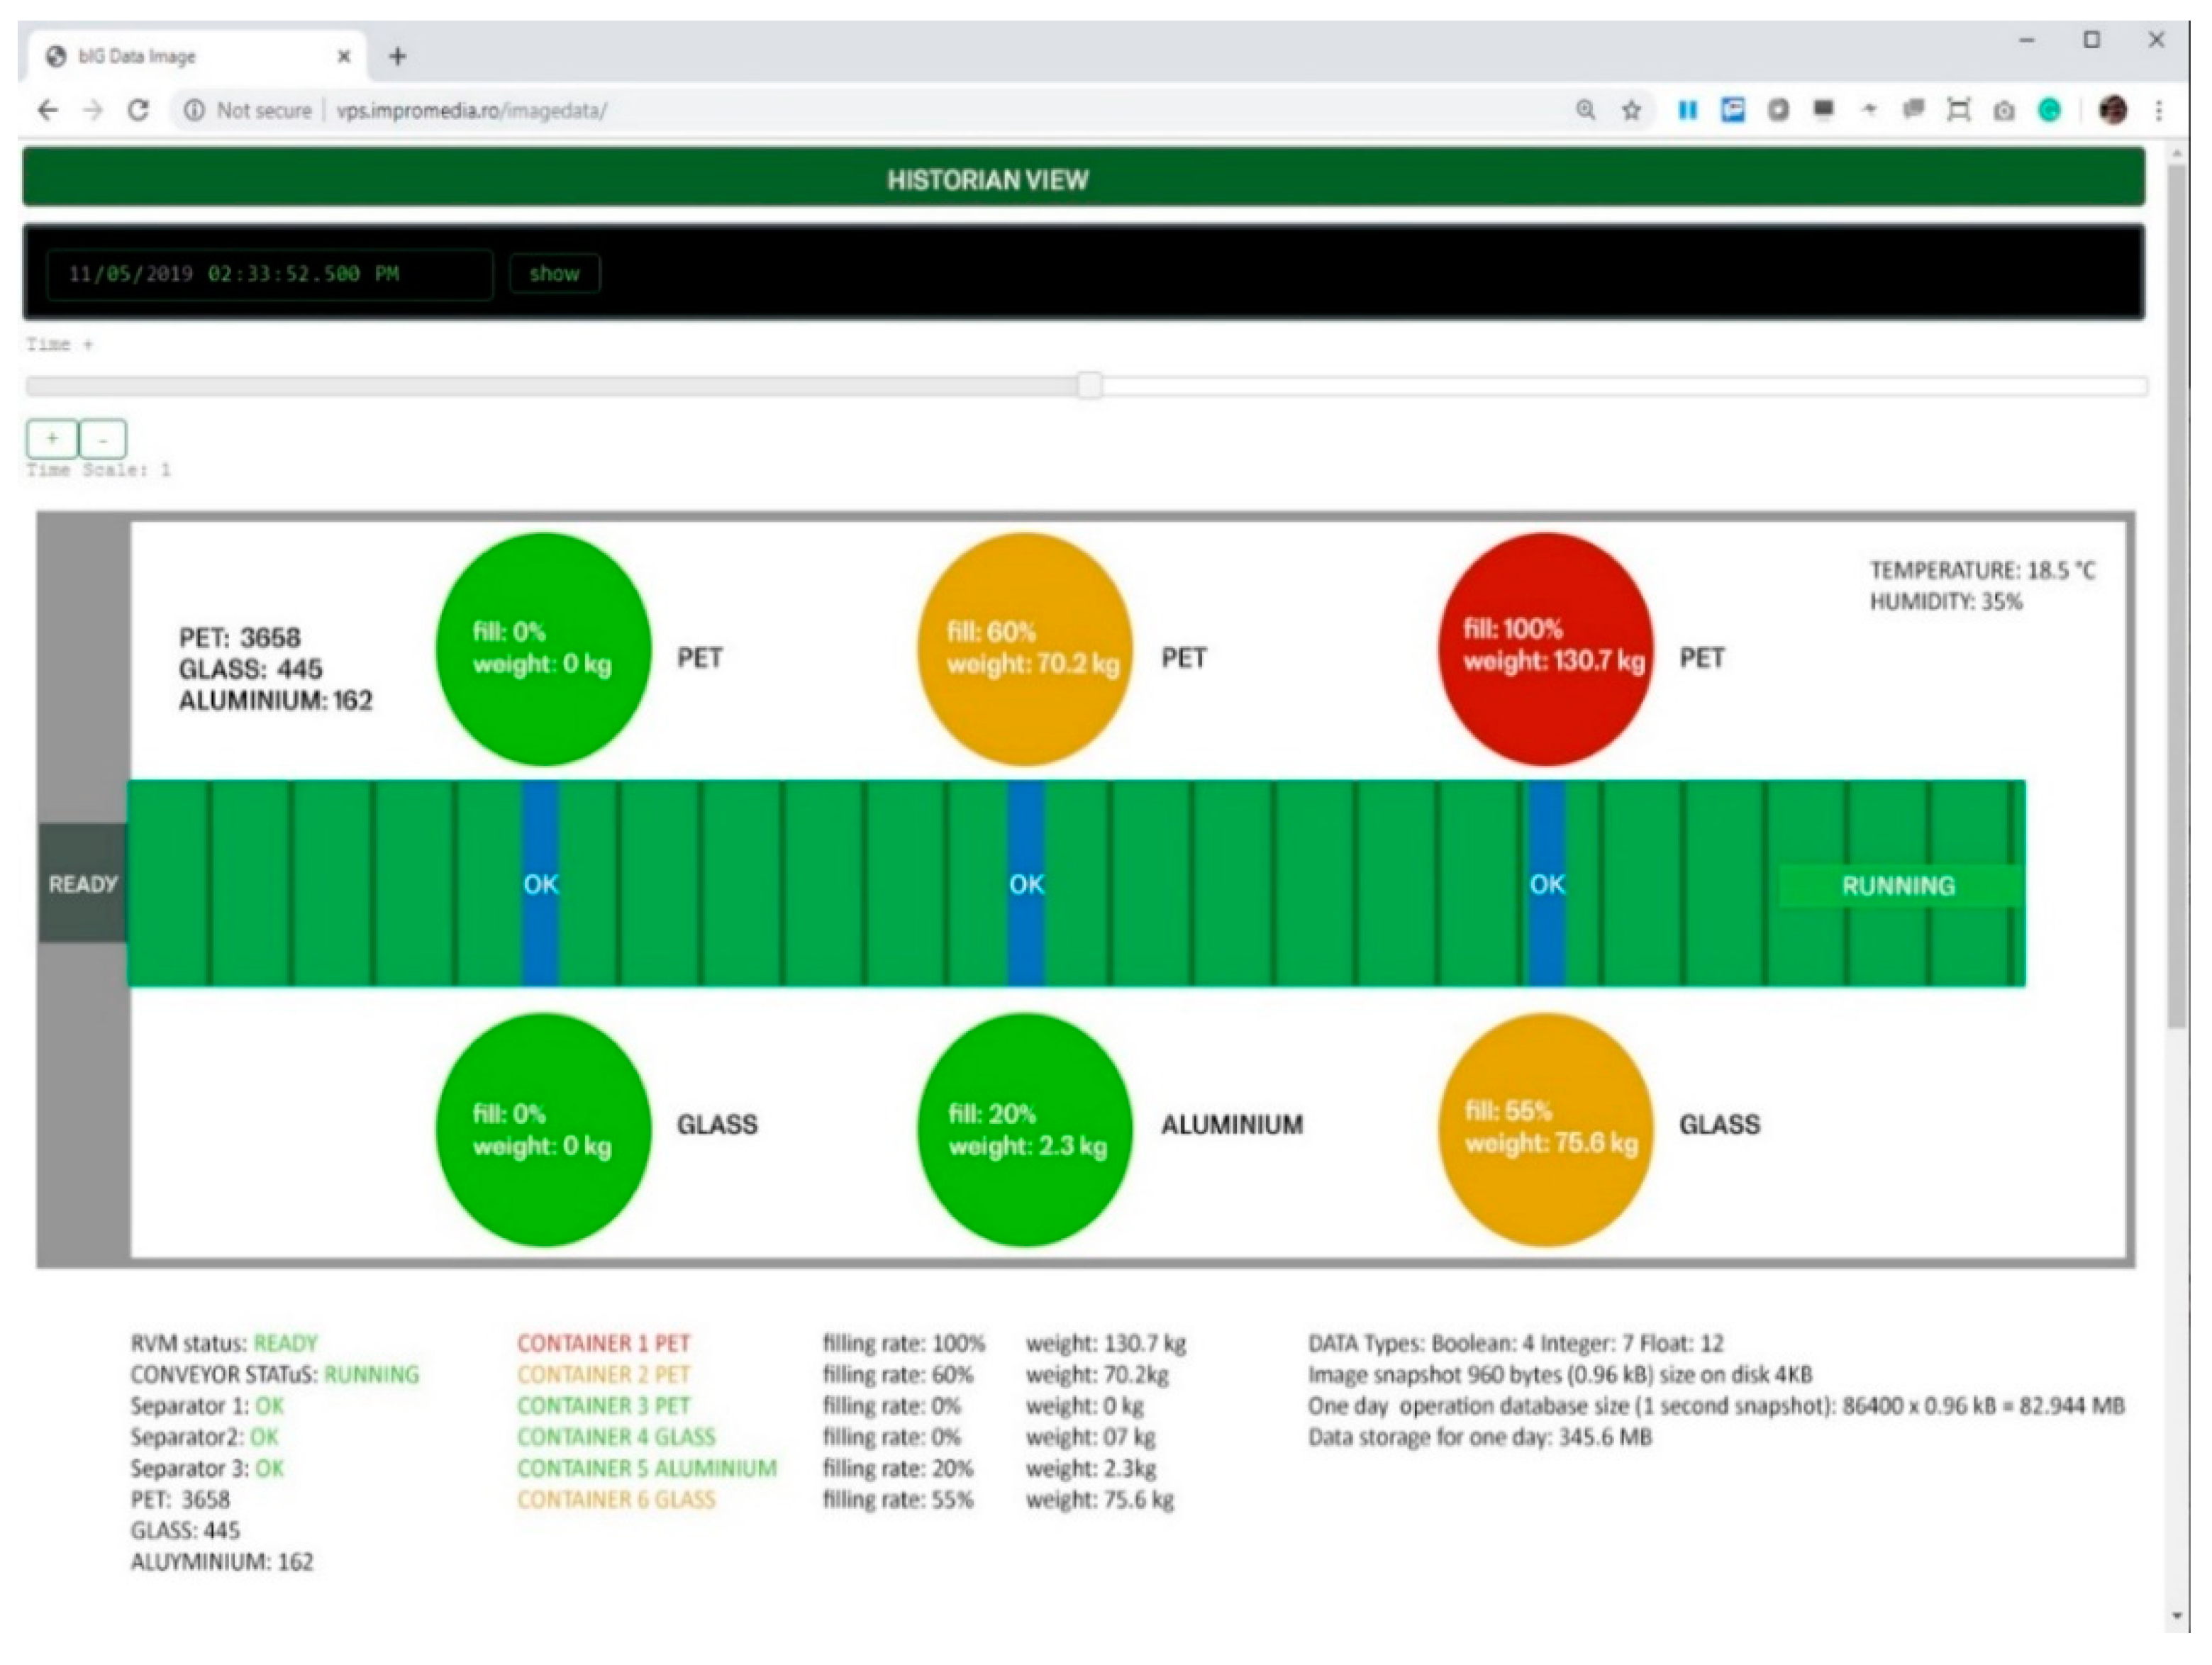
The telemetry data sent to the central application can be viewed in real time for each module in the historian reading interface (
Figure 5). In this view, all the current live values are shown (equipment status, module status, filling rate, weights, temperature, humidity, total waste collected: number of plastic recipients, number of glass bottles, number of aluminum cans ) and also any past date/time, to show how a status from that moment can be selected. In this view the RVM, the conveyor, the three sorting mechanisms and the six smart bins are represented. The status of each component is color-coded (green, ok; red, failure). For containers, depending on their filling rate, the following colors are represented: green from 0% to 40%, orange from 40% to 80%, and red over 80%.
Next the data encoding, encryption and transmission from an automated waste collection system with 10 modules was simulated.
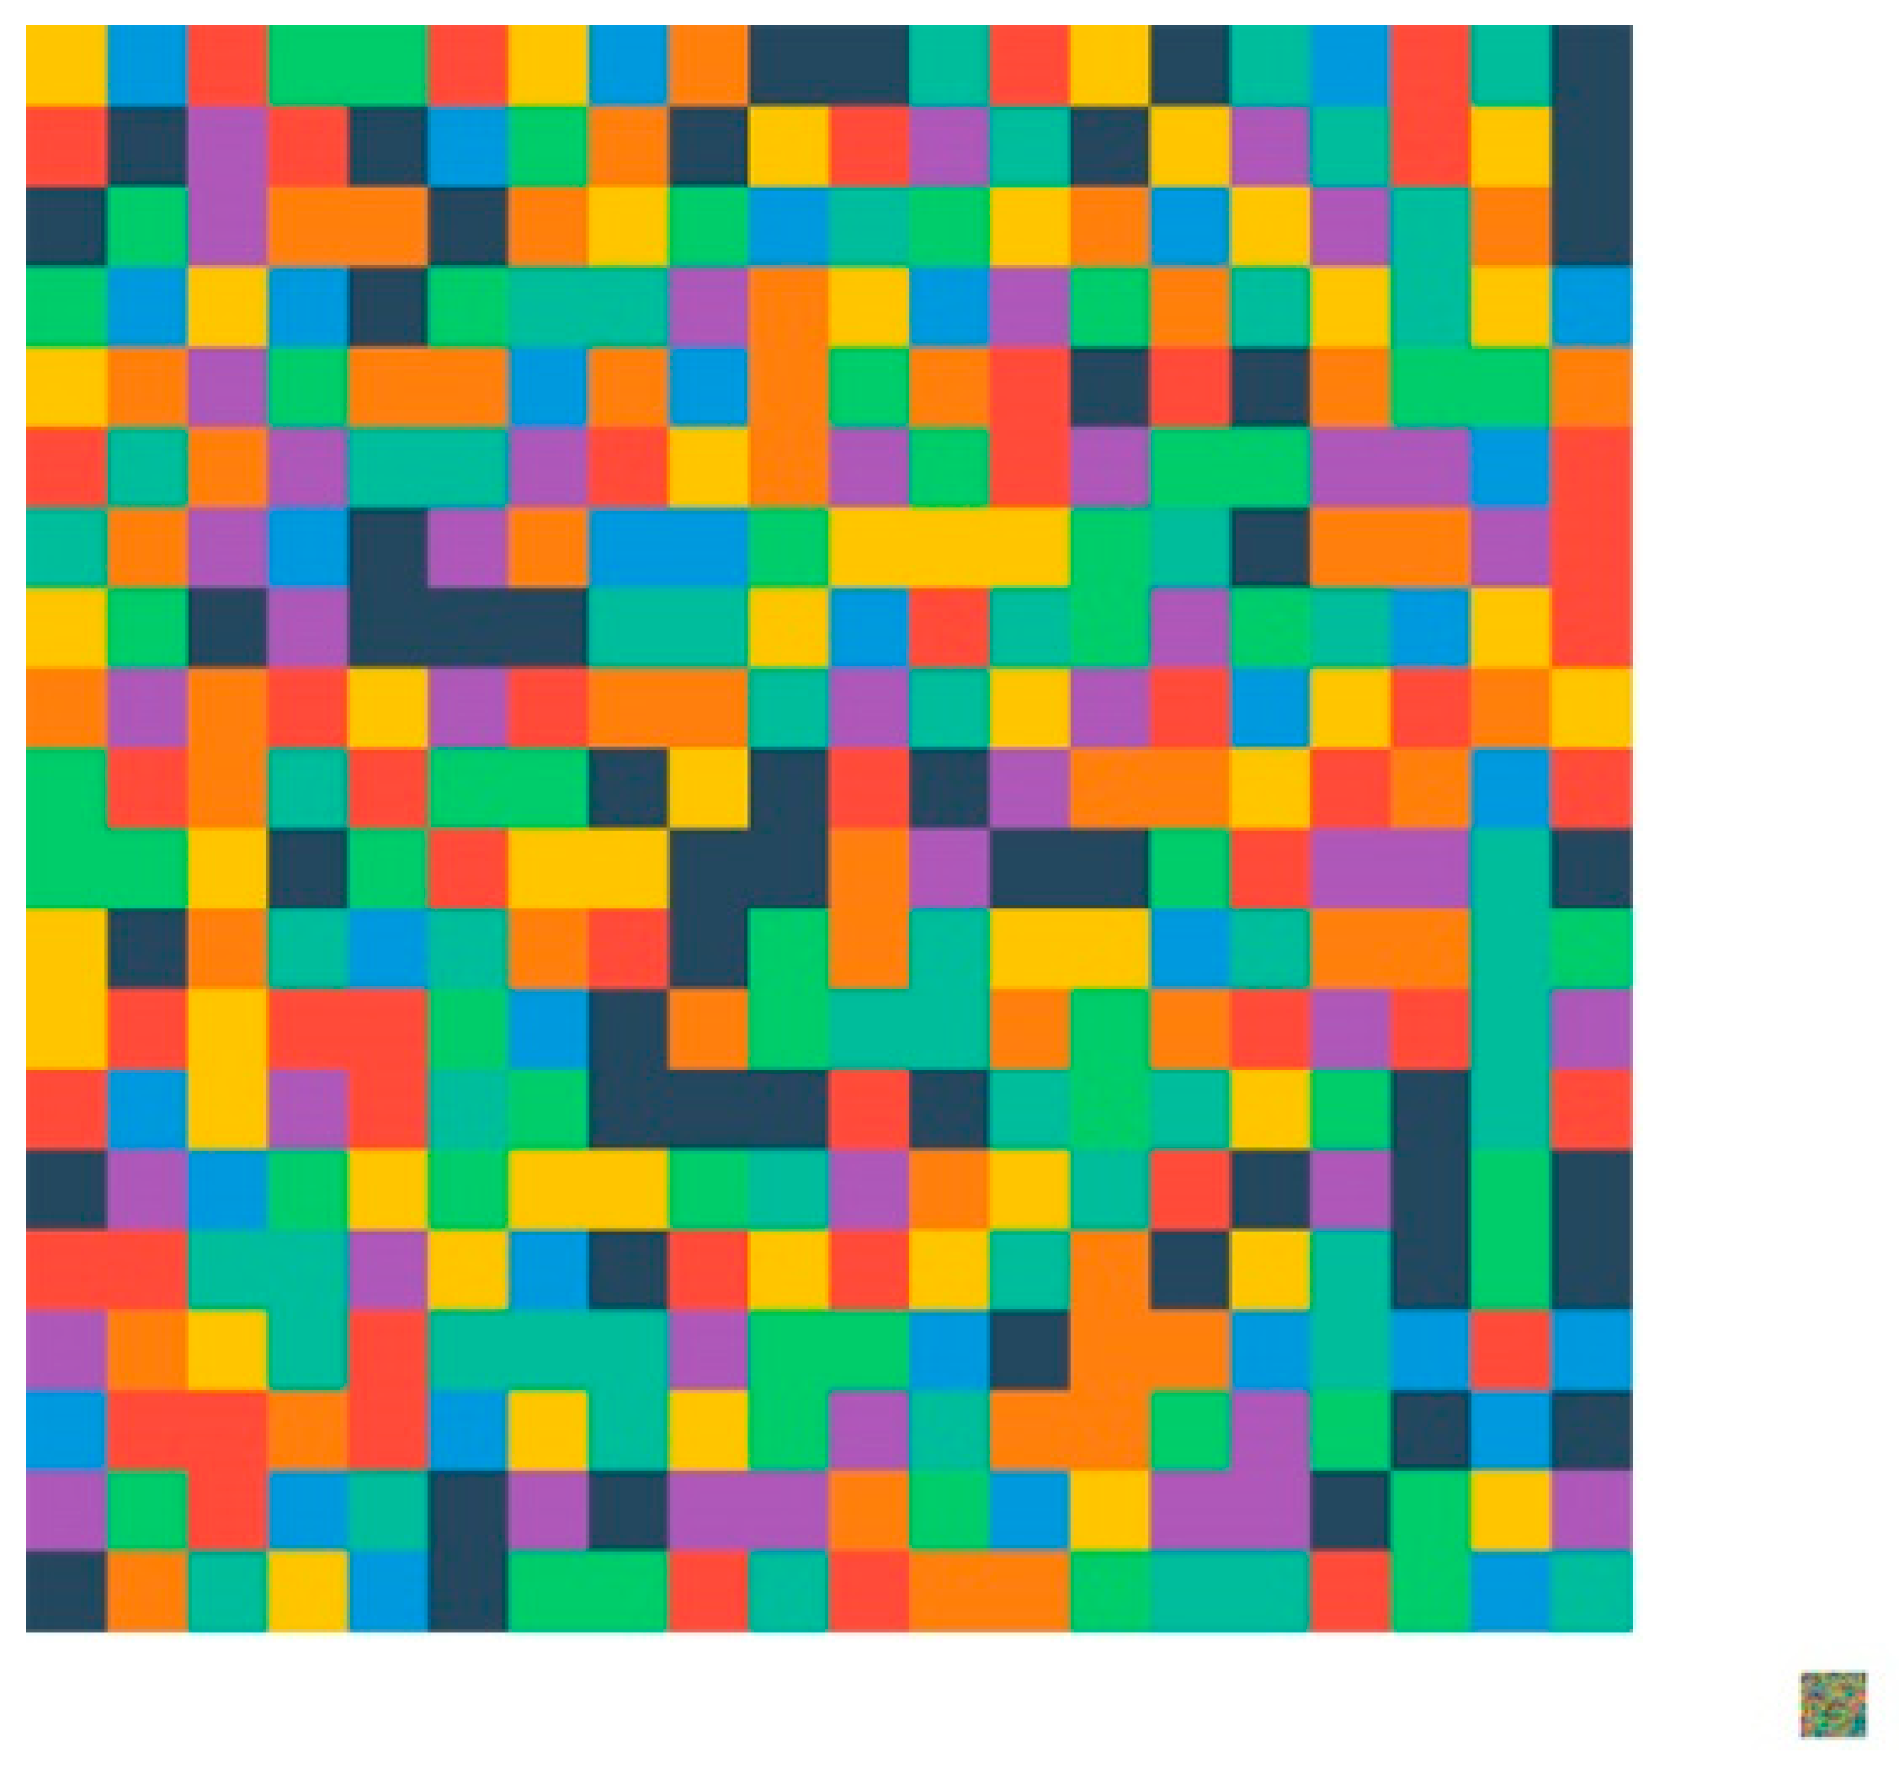
Method 1—Using the PNG Image database: In this case, the image data method performs even better, because a bigger number of pixels will result and the LZW compression will be much stronger. To send the data from 10 modules, an image of 400 pixels (20 × 20 pixels) will be generated (
Figure 5).
The average size of PNG file for 10 modules is 783 bytes and needs 4kB to be stored.
The average upload time for a data snapshot of 10 collecting cells using a 10 Mb/s upload connection was 5.3 milliseconds.
The storage space on disk for one day will be around 5.76 MB, and for one year of operation it will be around 2.1 GB of storage.
Method 2—using JSON files and Cassandra database: The JSON file has an average size of 5.57 kb and needs 8 kb to be stored on the disk.
The average upload time for a data snapshot of 10 collecting cells using a 10 Mb/s upload connection was 37.7 milliseconds.
Using the Cassandra database, the storage needed for an automated waste collection system with 10 modules will be about 11.5 MB/day of operation.
For an entire year of operation, the database for an automated waste collection system with 10 modules will rise to 5 GB.
Finally, the data encoding, encryption and transmission (Method 1) for a central application was simulated, an application that will collect data from 100 automated waste collection systems, from different locations, and the results showed that the data will not exceed 210 GB/year at a 1 min data snap.
The PNG files can be named using this model:
deviceUniqueID_timestampInMiliseconds.png
example: k137_1494270124240.png
The folder structure can be generated based on timestamp by exploding the first seven characters and storing the images inside the last subfolder (t7).
/deviceUniqueID/t1/t2/t3/t4/t5/t6/t7/deviceUniqueID_timestampInMiliseconds.png
example:
/k137/1/4/9/4/2/7/0/k137_1494270124240.png
The reading speed of data for the historian application is not dependent on the volume of stored data. Each time a timestamp snapshot is called, the application will read the correspondent PNG image, based on timestamp value (
Figure 6).
All the data can be hosted on a small server instance, with a 4TB SSD drive, with the operation cost being around 1.200 USD/year.
It is easy to do the backup and data replication by copying the folder structure with the PNG files.
Historian data reading speed average: 0.002833 sec/SELECT WHERE clause.
By using JSON files and Cassandra database (Method 2), for a central application that will collect data from 100 different automated waste collection systems, the database size will be about 500 GB, which means about three Cassandra nodes with an operation cost of about 3100 USD/month, 37,200 USD/year for a 1 min data snap.
The average speed of using CQL in Cassandra for a historian is about 2 s/SELECT WHERE clause.
In case of internet connection loss in one automated waste collection system, the data will not be sent to the central application and an alarm will be triggered to mention the telemetry data interruption. In order to prevent data loss, a small local storage could be used on the edge of Raspberry PI servers to store the data in case of connection interruption. All missed data will be sent to the central application when the internet connection will be restored.
To store data for a long period of time, a different SSD drive could be used to store database for each year in case of the data image method. The cost of a 4 TB drive is quite small, about 500 USD.
4. Conclusions
It is known that JSON files could cause a potential security breach, and in order to prevent this, a lot of verifications are needed, such as: adequate authentication, session management, input validation of all parameters, effective security controls for all API types, including cloud and serverless API, parsing validation, validation of JSON object values and formal JSON schema validation. (OWASP Application Security Verification Standard 4.0
https://owasp.org).
Using the proposed method of Image database, a secure, fast and efficient way to send and store the data in the cloud can be achieved. The data, in the case of the proposed method, are encrypted using symmetric encryption, each value being differently encrypted based on the correspondent pixel color on the image key, compared with plain text JSON files.
Because of the LZW compression, the PNG is much smaller than JSON files and requires three times less bandwidth for sending the same amount of data, or, in the case of the same connection bandwidth, the data sending is about three times faster.
In our example, the number of properties is quite small (23 properties) and the number of pixels is also small; therefore, for 10 collecting modules, the generated image is 20 × 20 pixels. For large number of properties, the LZW nondestructive compression of PNG can perform better.
We can conclude that the proposed Image database method is better than the classical JSON/Cassandra method, with the amount of data sent to the central server (or cloud), the storage space needed, and the operation costs being smaller (
Table 1).
The advantage of the proposed method relies on the fact that PNG is stored in a time-based folder architecture and the speed of retrieval of the information based on a timestamp doesn’t depend on the size of the database, because there is no need to load the entire database in memory to execute the selection query (
Table 2).
The replication of the database is also much simpler in the proposed method and consists of simply copying the folder structure with its content to a new machine. It is also possible to select only a needed period for data, by copying only the specific folders.
The data retrieval mechanism in the proposed method needs significantly smaller hardware resources, compared to other databases like Cassandra that need to load the data in memory to do the queries.
The operation cost is about 30 times smaller in the case of proposed method, compared to classical NOSQL databases like Cassandra.
Even if the speed of reading historian data is significantly higher in the case of image data compared to the classical databases, in the case of complex reports, which include thousands of records for long periods of time, due to the large number of PNG files to be read, the speed may decrease dramatically. As a future research study we aim to solve this limitation by implementing new scripts able to run periodically based on the data accumulated during a day and able to generate unique images for each property, thus reducing the number of images in the case studied from 86,400 images/day of operation at 22 (number of properties, excepting time stamp). Since these images will contain a larger number of pixels, the non-destructive compression LZW of the PNG format will have a much better compression rate, the space needed for storage being smaller. Also, images containing precalculated statistical data could be generated, such as averages, maximum and minimum values for that time period.
In the future, after the waste electrical and electronic equipment module will be developed, the propose method of data encoding and encryption will be tested using the new configuration of the automated waste collection system.


