Article

The Potential for Integration of Wind and Tidal Power in New Zealand

1
Electrical and Electronic Engineering Department, School of Engineering, Computing and Mathematical Sciences Auckland University of Technology, Auckland 1010, New Zealand
2
Technology Research Department, R&D Centre, Fusheng Industrial Co., Ltd, Taipei 24142, Taiwan
*
Author to whom correspondence should be addressed.
Sustainability 2020, 12(5), 1807; https://doi.org/10.3390/su12051807
Submission received: 29 January 2020 / Revised: 21 February 2020 / Accepted: 24 February 2020 / Published: 28 February 2020
(This article belongs to the Special Issue Process Integration and Optimisation for Sustainable Systems)

Abstract

:
This research focuses on proposing and evaluating an optimized hybrid system of wind and tidal turbines operating as a renewable energy generating unit in New Zealand. Literature review indicates increasing worldwide investment in offshore renewable energy in recent years. Offshore energy shows a high potential as an alternative energy generation solution to that of fossil fuels. Using the capacities of wind and tidal power in renewable technologies would be a suitable alternative for fossil fuels and would help prevent their detrimental effects on the environment. It is a cost-effective procedure for the power generation sector to maximize these renewables as a hybrid system. At the design phase, turbine types appropriate to environmental conditions for an area with high wind speed and tidal flow need to be considered. When selecting which turbines should be used, horizontal or vertical axis, number and length of blades, and optimized rotational speed are all important to get maximum capacity from either the wind or tidal energy for the hybrid system. Comprehensive simulation models of the hybrid system are now being set up, using several available commercial software packages such as QBlade, Simulink, and RETScreen. Several different parameters will be required for these simulation models to run in order to test performance, capacity and efficiency of the proposed hybrid system. To decide which regions are suitable for the hybrid system, it will be necessary to analyze available wind and tide records from NIWA, and online databases such as GLOBAL ATLAS. This next phase of research will aim to create optimized scenarios for the hybrid model by considering the effect of wind and water speed on performance. After deciding which region and scenarios are suitable, it will also be necessary to evaluate the costs and returns of a hybrid system. This final phase will be performed using the RETScreen simulation model.

1. Introduction

1.1. Outline of Project Objective

Sources of energy which are renewable, such as wind and tidal, continue be to be used for solving the world’s massive demand for energy, and for reducing use of its fossil fuels. In the available literature, the effects of configuration parameters on the performance of wind and tidal turbines are investigated separately. However, there is little research on performance if wind and tidal turbines are combined into one hybrid system. The advantages of a hybrid system consisting of a wind and tidal turbines are predictable energy generation, increased energy density of array, and shared transmission/foundation/operation/maintenance costs. The technical challenges are immaturity of tidal technology, increased operational complexity, maintaining system stability, and finding suitable locations. This paper describes a New Zealand research project which aims to redress this shortage of research by carrying out a detailed numerical study. A thorough and comprehensive numerical simulation and modelling will be performed using QBlade, Simulink, and RETScreen. The intended outcome of the research is to propose an optimized hybrid system using wind and tidal turbines for power generation.

1.2. Review of Offshore Energy Generation

Renewable energy is seen as the only solution in order to solve a developing energy crisis [1]. Two factors are the key causes. The first is global warming attributed to the combustion of fossil fuels. Figure 1 shows a rising trend since the industrial revolution [2].
The second is the increase of energy demand in recent years. Figure 2 shows an oil supply–demand gap starting from 2000 which will become very great by 2040 [2].
Renewable energy facilities such as hydro began to be built through the 1900s. Between the 1960s and 1980s, geothermal schemes, onshore wind turbines, tidal turbines, and solar panel installations started to appear.
The use of offshore wind energy commenced in 1990s. Figure 3 shows its potential [3].
Most existing wind farms have been built on land (onshore). Currently, most of the existing installed offshore capacity has concentrated within the United Kingdom (UK), Denmark (DK) and the Netherlands (NL), as shown in Figure 4 [4]. The installed generation capacity in these countries has been forecast to increase from 2008 to 2020; in the UK from 0.59 to 13 GW, DK from 0.41 to 1.3 GW, and NL from 0.25 GW to 6 GW [5].
The first offshore wind turbine was installed in Sweden in 1991 at Nogersund. One year later in 1992, the first offshore wind farm was installed in Denmark, off Vindeby in a water depth of between 2 to 4 m using gravity foundation at a distance 3 km from shore. Until 2001, Denmark, Sweden, and The Netherlands used turbines rated at less than 1 MW. After 2001, Denmark started to develop large offshore wind farms: (a) Middelgrunden (2001) using turbines rated at 2 MW; (b) Horns Rev I (2002): 160 MW using turbines rated at 2 MW; and (c) Nysted (2003): 166 MW using turbines rated at 2.3 MW.
The UK, Germany, and Belgium started large offshore wind projects 2003 onwards and since 2008 the UK has dominated. Figure 5 shows the evolution of the turbine diameter for both onshore and offshore wind turbines. Offshore turbine diameters and generating capacities have become higher than onshore from this year.
The European Wind Energy Association (EWEA) [5] has forecast 2005 prices. Investment in wind energy for both onshore and offshore should reach €23.5 billion in 2020 and €25 billion in 2030. Figure 6 shows investment after 2023 is projected to be stable, at around €25 billion annually; however an increasing share of investment offshore [6].
Tidal turbines are high energy intensity, because they can gain over four times as much energy per m2 of rotor as a wind turbine [2]. The exploitable tidal energy with present technologies is estimated at about 75 GW worldwide. It is estimated that more than 10% of total resource (6 GW) is in France and the UK (3.4 GW). Figure 7 shows tide resources at the world level.

1.3. Reasons for Investigating a Hybrid System (Wind plus Tidal)

At any offshore tower site there is tidal flow as well as wind flow. At many sites the tidal flow may not be enough to add much extra generating capacity. Or, in the reverse case, wind flow may not add much extra generating capacity. However, at some sites, tidal flow combined with wind flow will enable substantial extra generating capacity. Presently, nobody knows where such sites are on the New Zealand coast. Or anywhere else in the world. Just identifying suitable sites will contribute new knowledge about places where there is potential for extra renewable energy generation. However, what is really novel about the new project described in this paper, is that it investigates whether it is possible to boost power output by installing a hybrid system at an offshore energy generation site where until now, solely wind turbines or solely tidal turbines would have been installed. The research will be very significant if it demonstrates increased power output is technically feasible, substantial, and economic. If not, the research outcome will still be significant, because it will establish the reason why a hybrid system may be infeasible (technical difficulty integrating; extra power output not enough; construction cost too high), and will indicate what the obstacles are that need to be overcome by future research.

2. Methods

A wind turbine above sea level and two tidal turbines below sea level can be combined by an electric microgrid when connecting to an onshore supply [9]. Parameters for offshore wind turbines issued on IEA Wind TCP Task 37-May 2019 can be used to model a hybrid system [10]. Preliminary evaluation of several simulation models for this project is under way. They are:

2.1. Preliminary Evaluation od Models

2.1.1. QBlade

QBlade is an open-source wind turbine simulator for the design and simulation of vertical or horizontal axis wind turbines. The functionality includes two-dimensional airfoil design and analysis, lift and drag polar extrapolation, rotor blade design, and wind turbine performance simulation. A generator module, pitch and rotational speed controllers, and the simulation of rotor characteristics. QBlade consists of major modules (Figure 8) embedded in a graphical user interface [11]:
  • Airfoil design and analysis
  • Lift and drag coefficient polar extrapolations to 360° angle
  • Rotor blade design and optimization
  • Wind turbine setup and simulation.

2.1.2. RETScreen

RETScreen is a feasibility study tool developed by the Ministry of Natural Resources, Canada, for evaluating different renewable energy technologies at any location in the world (Figure 9). The RETScreen PV model covers off-grid PV applications and includes stand-alone, hybrid and water pumping systems. It has a global climate data database of more than 6000 ground stations, energy resource maps (i.e. wind maps), hydrology data, wind turbine power curves, and links to NASA’s climate database. RETScreen 4 can determine the technical and financial viability of on-grid renewable energy, energy efficiency and cogeneration projects including energy modelling, emission modellings, financial analysis, and also sensitivity and risk analysis. [12].

2.1.3. Simulink

Simulink is a block diagram environment for multidomain simulation and model-based design. It supports system-level design, simulation, automatic code generation, and continuous test and verification of embedded systems. Simulink provides a graphical editor, customizable block libraries, and solvers for modelling and simulating dynamic systems. It is integrated with MATLAB, enabling incorporation of MATLAB algorithms into models and export of simulation results to MATLAB for further analysis. There are two major classes of items in Simulink: blocks and lines. Blocks are used to generate, modify, combine, output, and display signals. Lines are used to transfer signals from one block to another. The blocks are defined as below.
S-Function: displays the name of any user-defined function, plus the number of input and output specified by the function.
Sum: Add or subtract inputs.
Mechanical Rotational Reference: is to connect mechanical rotational ports that are rigidly affixed to the frame (ground).
Ideal torque sensor: a device that converts a variable passing through the sensor into a control signal proportional to the torque with a specified coefficient of proportionality.
Solver configuration: defines solver settings to use for simulation.
Inertia: represents an ideal mechanical rotational inertia.
Gearbox: represents an ideal, non-planetary, fixed gear ratio.

2.2. Sites which are Suitable for Hybrid Wind and Tidal Generation

Previous investigations of the New Zealand coast have identified good sites for wind energy generation, or good sites for tidal energy generation. However, nobody has prepared a list of sites which are suitable for hybrid generation, i.e., install a wind turbine plus tidal turbine at the same site to increase electricity generated, and link using a microgrid. A short list of sites which may be suitable for hybrid generation has been prepared by referring to previous investigations.
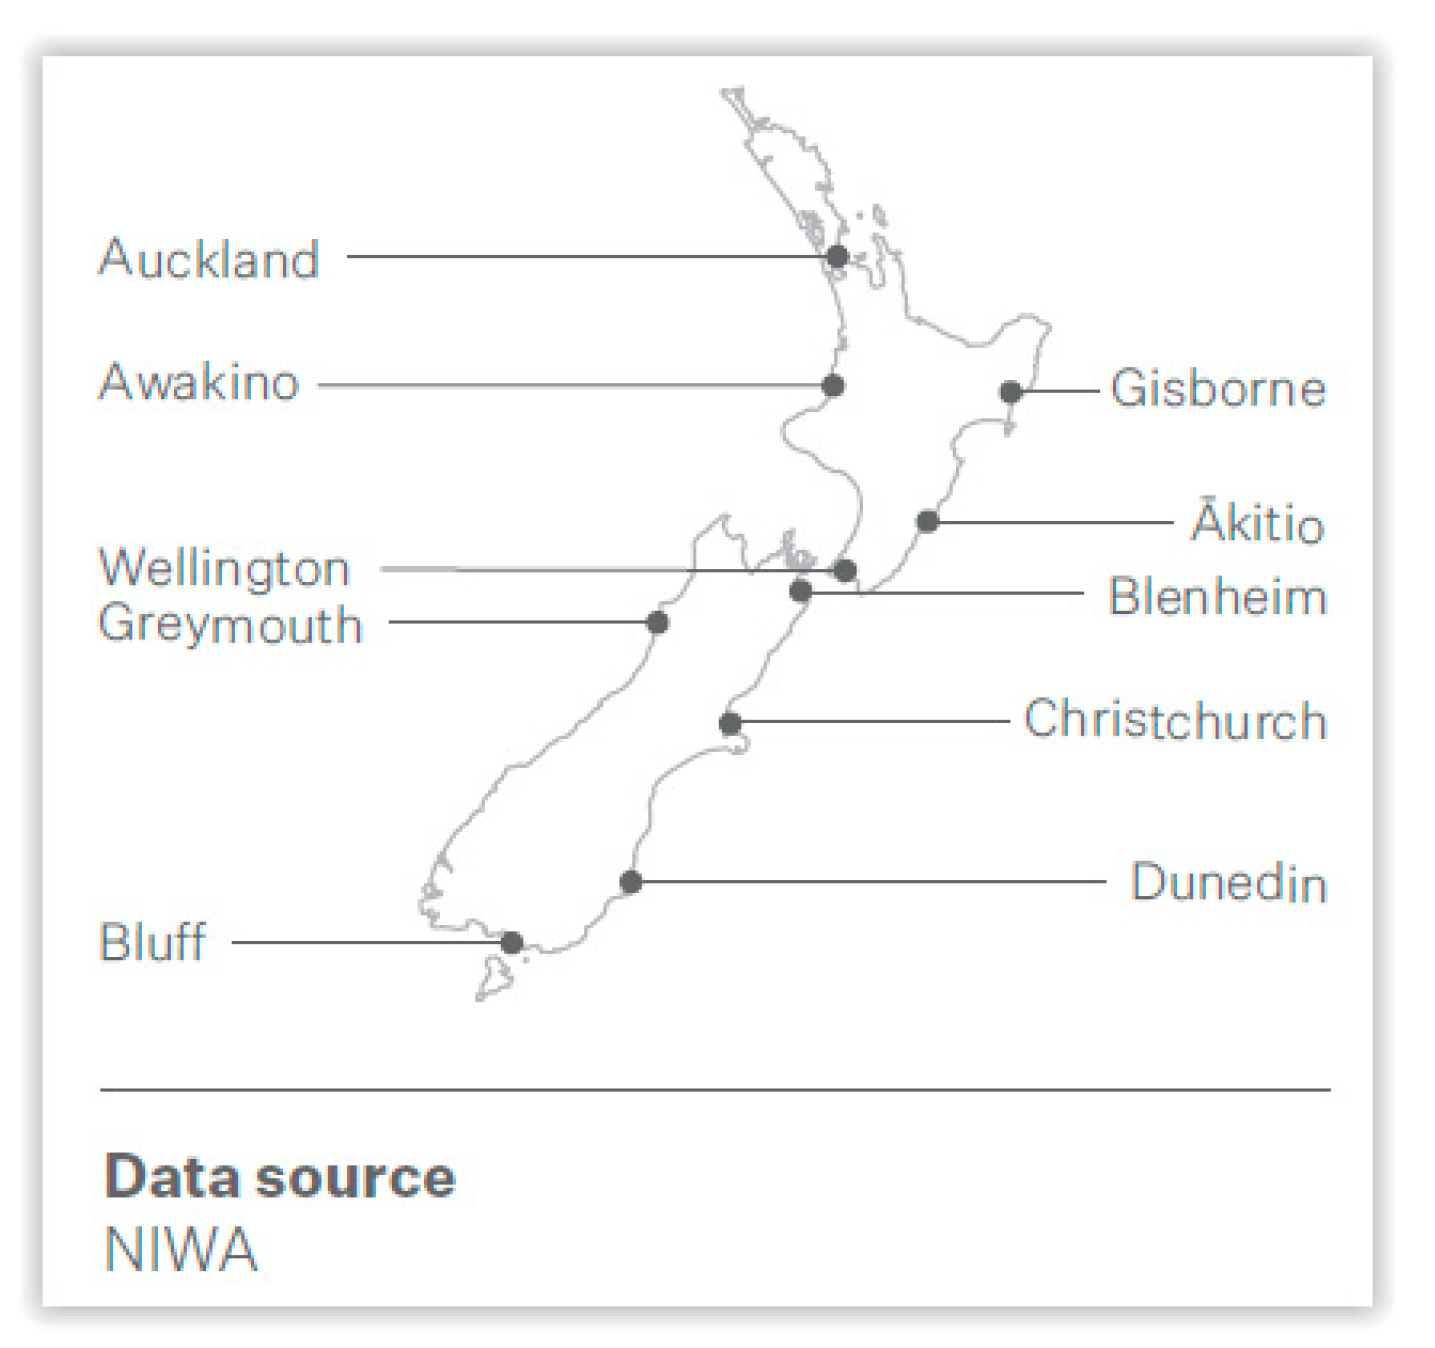
Westerly wind patterns prevail in most parts of New Zealand. NIWA recording sites summarize every hourly measurement, illustrating patterns of turbulence and calm in different places. Figure 10 shows sites selected to show typical wind patterns.
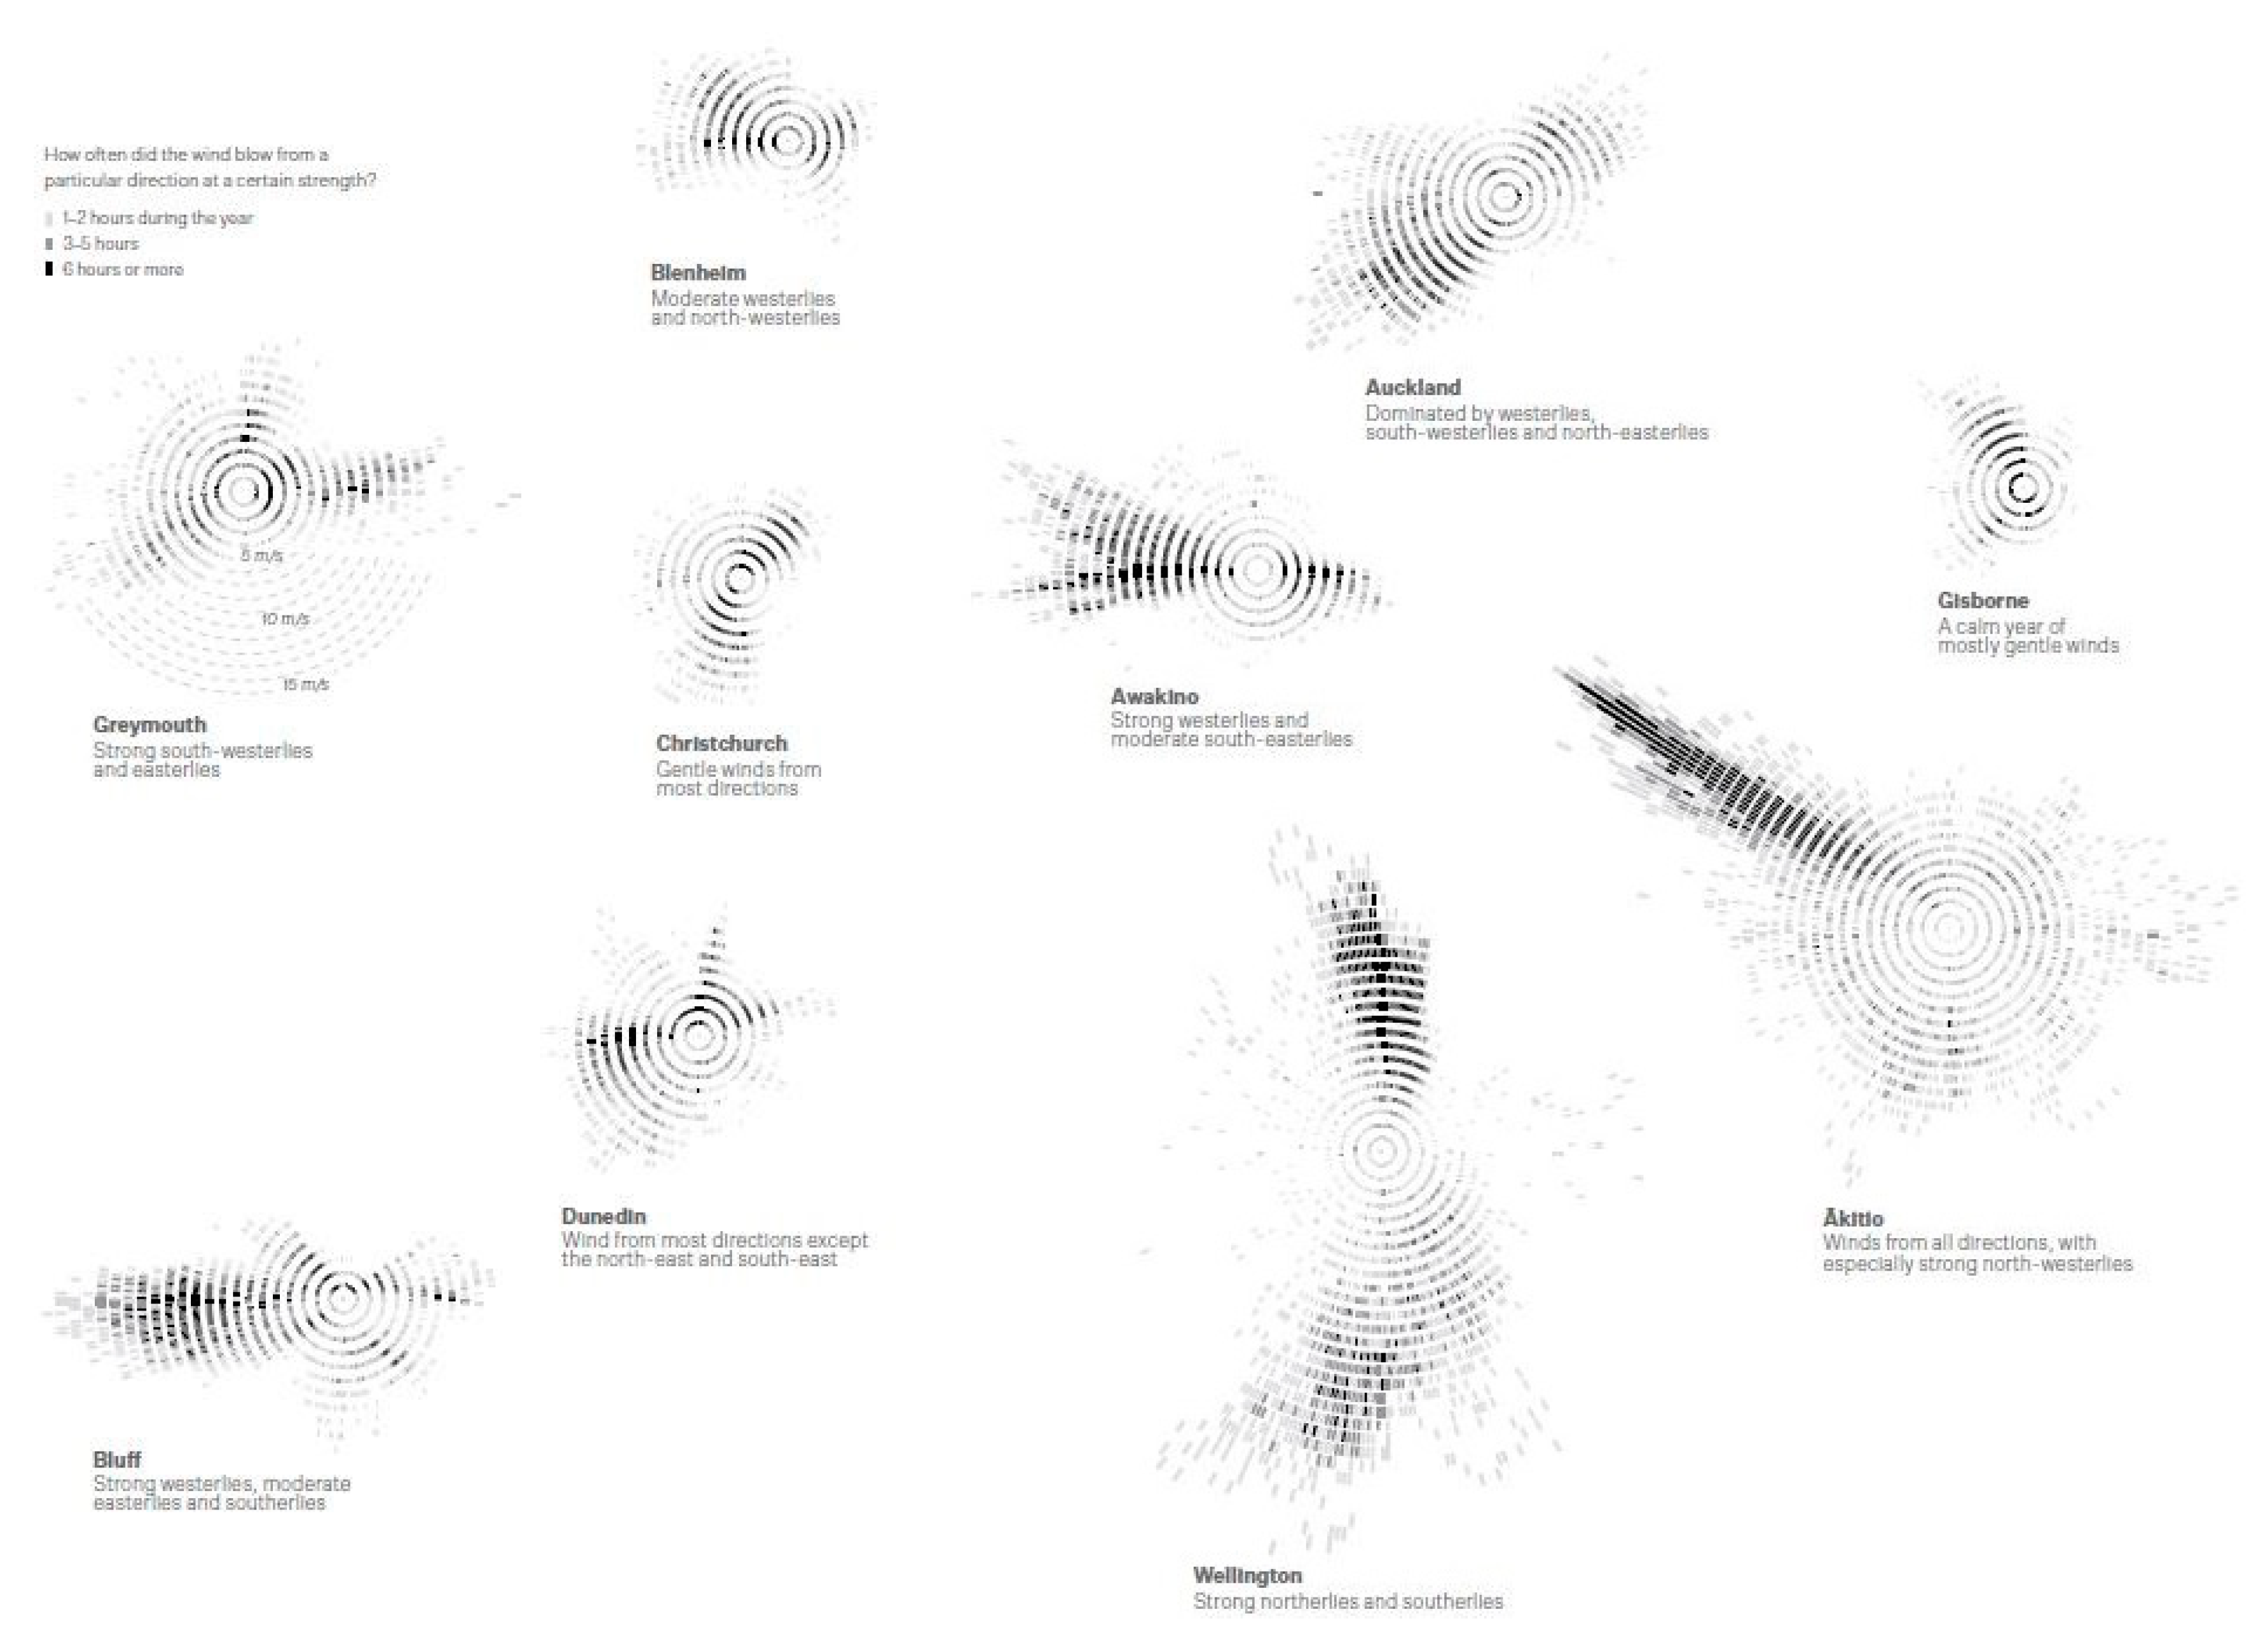
For each site selected, scatter charts (Figure 11) show how often and how strongly winds blow from different directions during 2014. The center of each plot represents calm conditions. Wind strength is shown by the distance from the chart center, in 1 meter-per-second steps. The further a tick is from the calm center, the stronger the wind. Wind direction is determined by angle from the center. Northerly winds are at a 12 o’clock position; easterlies at 3 o’clock. The duration for which wind blows from a particular direction at a certain strength is shown by periodic time symbols in Figure 11 [13]:
The sites in Figure 11 show typical wind speeds and directions on different New Zealand coastlines:
*
West coast of the South Island (Greymouth site) has strong south-westerlies (from sea), also strong easterlies (from mountains). However, this coast is stormy (frequent big waves), so cost of building and maintaining offshore turbine towers may be too high. Sheltered sites on this coast are the fiords at the south end, e.g., Dusky Sound. However, fiord sides are mountains which cause turbulent changes in wind direction and velocity. Another sheltered site is a big tidal estuary, Whanganui Inlet at the north end near Farewell Spit. Here mountains are not so high, so turbulent wind changes are not so great.
*
West coast of the North Island (Awakino site) has strong westerlies and moderate south-easterlies. This coast is also stormy, so cost of building and maintaining offshore turbine towers may also be too high here. Sheltered sites on this coast are several large harbors e.g. Manukau. Shores are hilly to flat, so local turbulence may not be a problem when operating wind turbines.
*
East coast of the North Island. North-east part from North Cape to East Cape is represented by the Auckland site. This coast is dominated by south-westerlies, but also has strong north-easterlies. Sea bottom is shallow creating opportunity for offshore tower installation in absence of big waves, (except during north-easterly storms, when wave damage might be a risk). Here are many harbors with deep channels, also many tidal estuaries.
The east part—from East Cape to Cape Kidnappers—is represented by the Gisborne site. Here, winds from all directions are mostly gentle. So, this coast may be unsuitable for wind turbines (although north-west winds blow from inland ranges towards coast—and may be stronger in some years, than the wind rose diagram indicates). The east part’s harbors and estuaries are few, small, and shallow.
The south-east part from Cape Kidnappers to Cook Strait is represented by the Akitio and Wellington sites. Winds blow from all directions, and especially strong north-westerlies and northerlies blow from inland ranges towards coast. This coast may have potential for installing wind turbines offshore (but just close to coast where sea bottom is shallow—Hikurangi Trench farther out is too deep). There are no harbors, just a few estuaries (miniscule).
*
North coast of South Island (Blenheim site). Between Farewell Spit and Cape Campbell, dominant winds are moderate westerlies and north-westerlies. The offshore sea bottom is shallow in the bays (Golden Bay, Tasman Bay, Cloudy Bay). Marlborough Sounds are narrow harbors with deep channels. Additionally, there are some estuaries, e.g. Collingwood, Waimea, Nelson, and Wairau. However, because this coast does not have a strong wind prevailing from one direction, it may not be as good for wind energy.
*
East coast of South Island (Christchurch and Dunedin sites). Winds from most directions are gentle to moderate. Along the Canterbury coast, north-west winds blow from the mountains across the plains (and may be stronger in some years, than the wind rose diagram indicates). On the Otago coast (Dunedin), south-west winds have greater frequency and strength. However, overall, this coast may not be good for finding suitable sites.
*
South coast of South Island (Bluff site) has very strong prevailing westerlies, plus moderate easterlies and southerlies. Offshore sea bottom is shallow in Foveaux Strait. Here, wave attack is frequent, but waves are moderately sized. There is only one large harbor (Bluff), and several large shallow estuaries (Mataura, Oreti, Aparima). The south coast of Stewart Island is stormier, with very large waves. It has two large harbors (Paterson and Pegasus).
This review of information about wind speeds and directions on the New Zealand coastline shows that the west coast of the North Island, the south-east coast of the North Island, and the south coast of the South Island are coasts with great potential to generate electricity from wind energy. Bathymetric maps of depth to seabed, also gives information about the storminess of these coasts, suggest that the cost of constructing and maintaining towers in harbors or estuaries may be much less than cost of installation offshore in open water.
Open-water tidal circulation around the New Zealand coast is anti-clockwise. It is the reason why when tides on the west coast are high, tides on the east coast are low. It also creates strong reverse-direction tidal currents in open water where the two coasts meet, i.e., North Cape to Cape Maria van Diemen, Cook Strait, Foveaux Strait, and the South Cape of Stewart Island [14]. Close to shore, where open-water tidal circulation moves across shallow sea bed and enters bays, harbors or estuaries, normal reversals of tidal current are observed twice a day, i.e., incoming and outgoing tides [15].
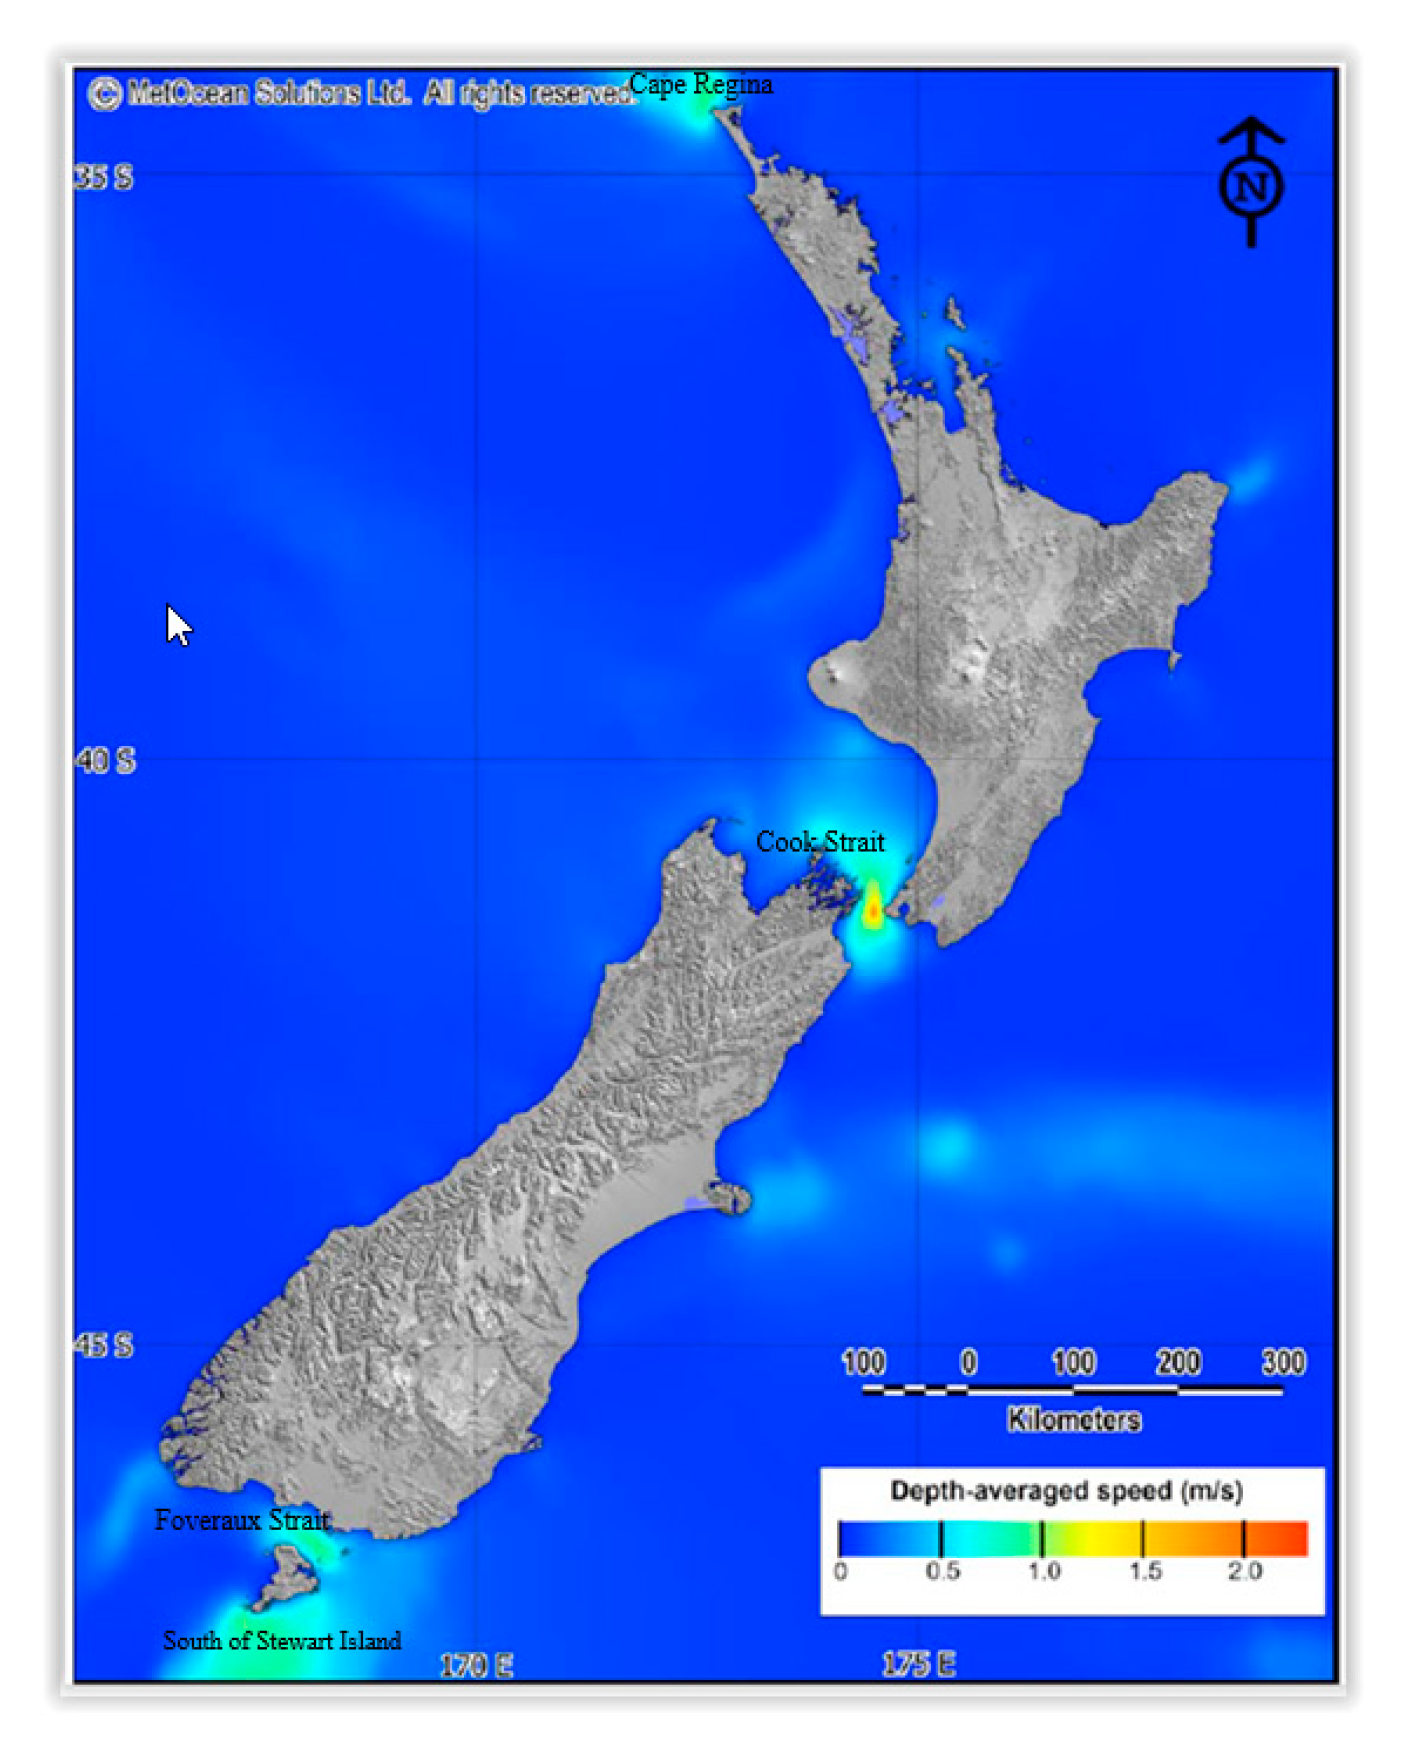
Huckerby and Johnson (2008) modelled tidal flow around the New Zealand coasts [16,17]. The national distribution of utilizable open ocean tidal currents is very limited. Only four areas have mean current speeds that exceed 1 m/s (Figure 12). Two (north of Cape Reinga and south of Stewart Island) are exposed to severe storms and a third (Cook Strait) is deep water (most parts are too deep to attach towers to seabed) and are also prone to undersea earthquakes. The fourth (Foveaux Strait and adjacent estuaries) is shallow water (seabed 10 to 40 meters below sea level), so easier and cheaper to install turbines.
Hicks and Hume (1996) determined tidal volumes and current velocities in harbors on the northern coast of the North Island by (Table 1) [
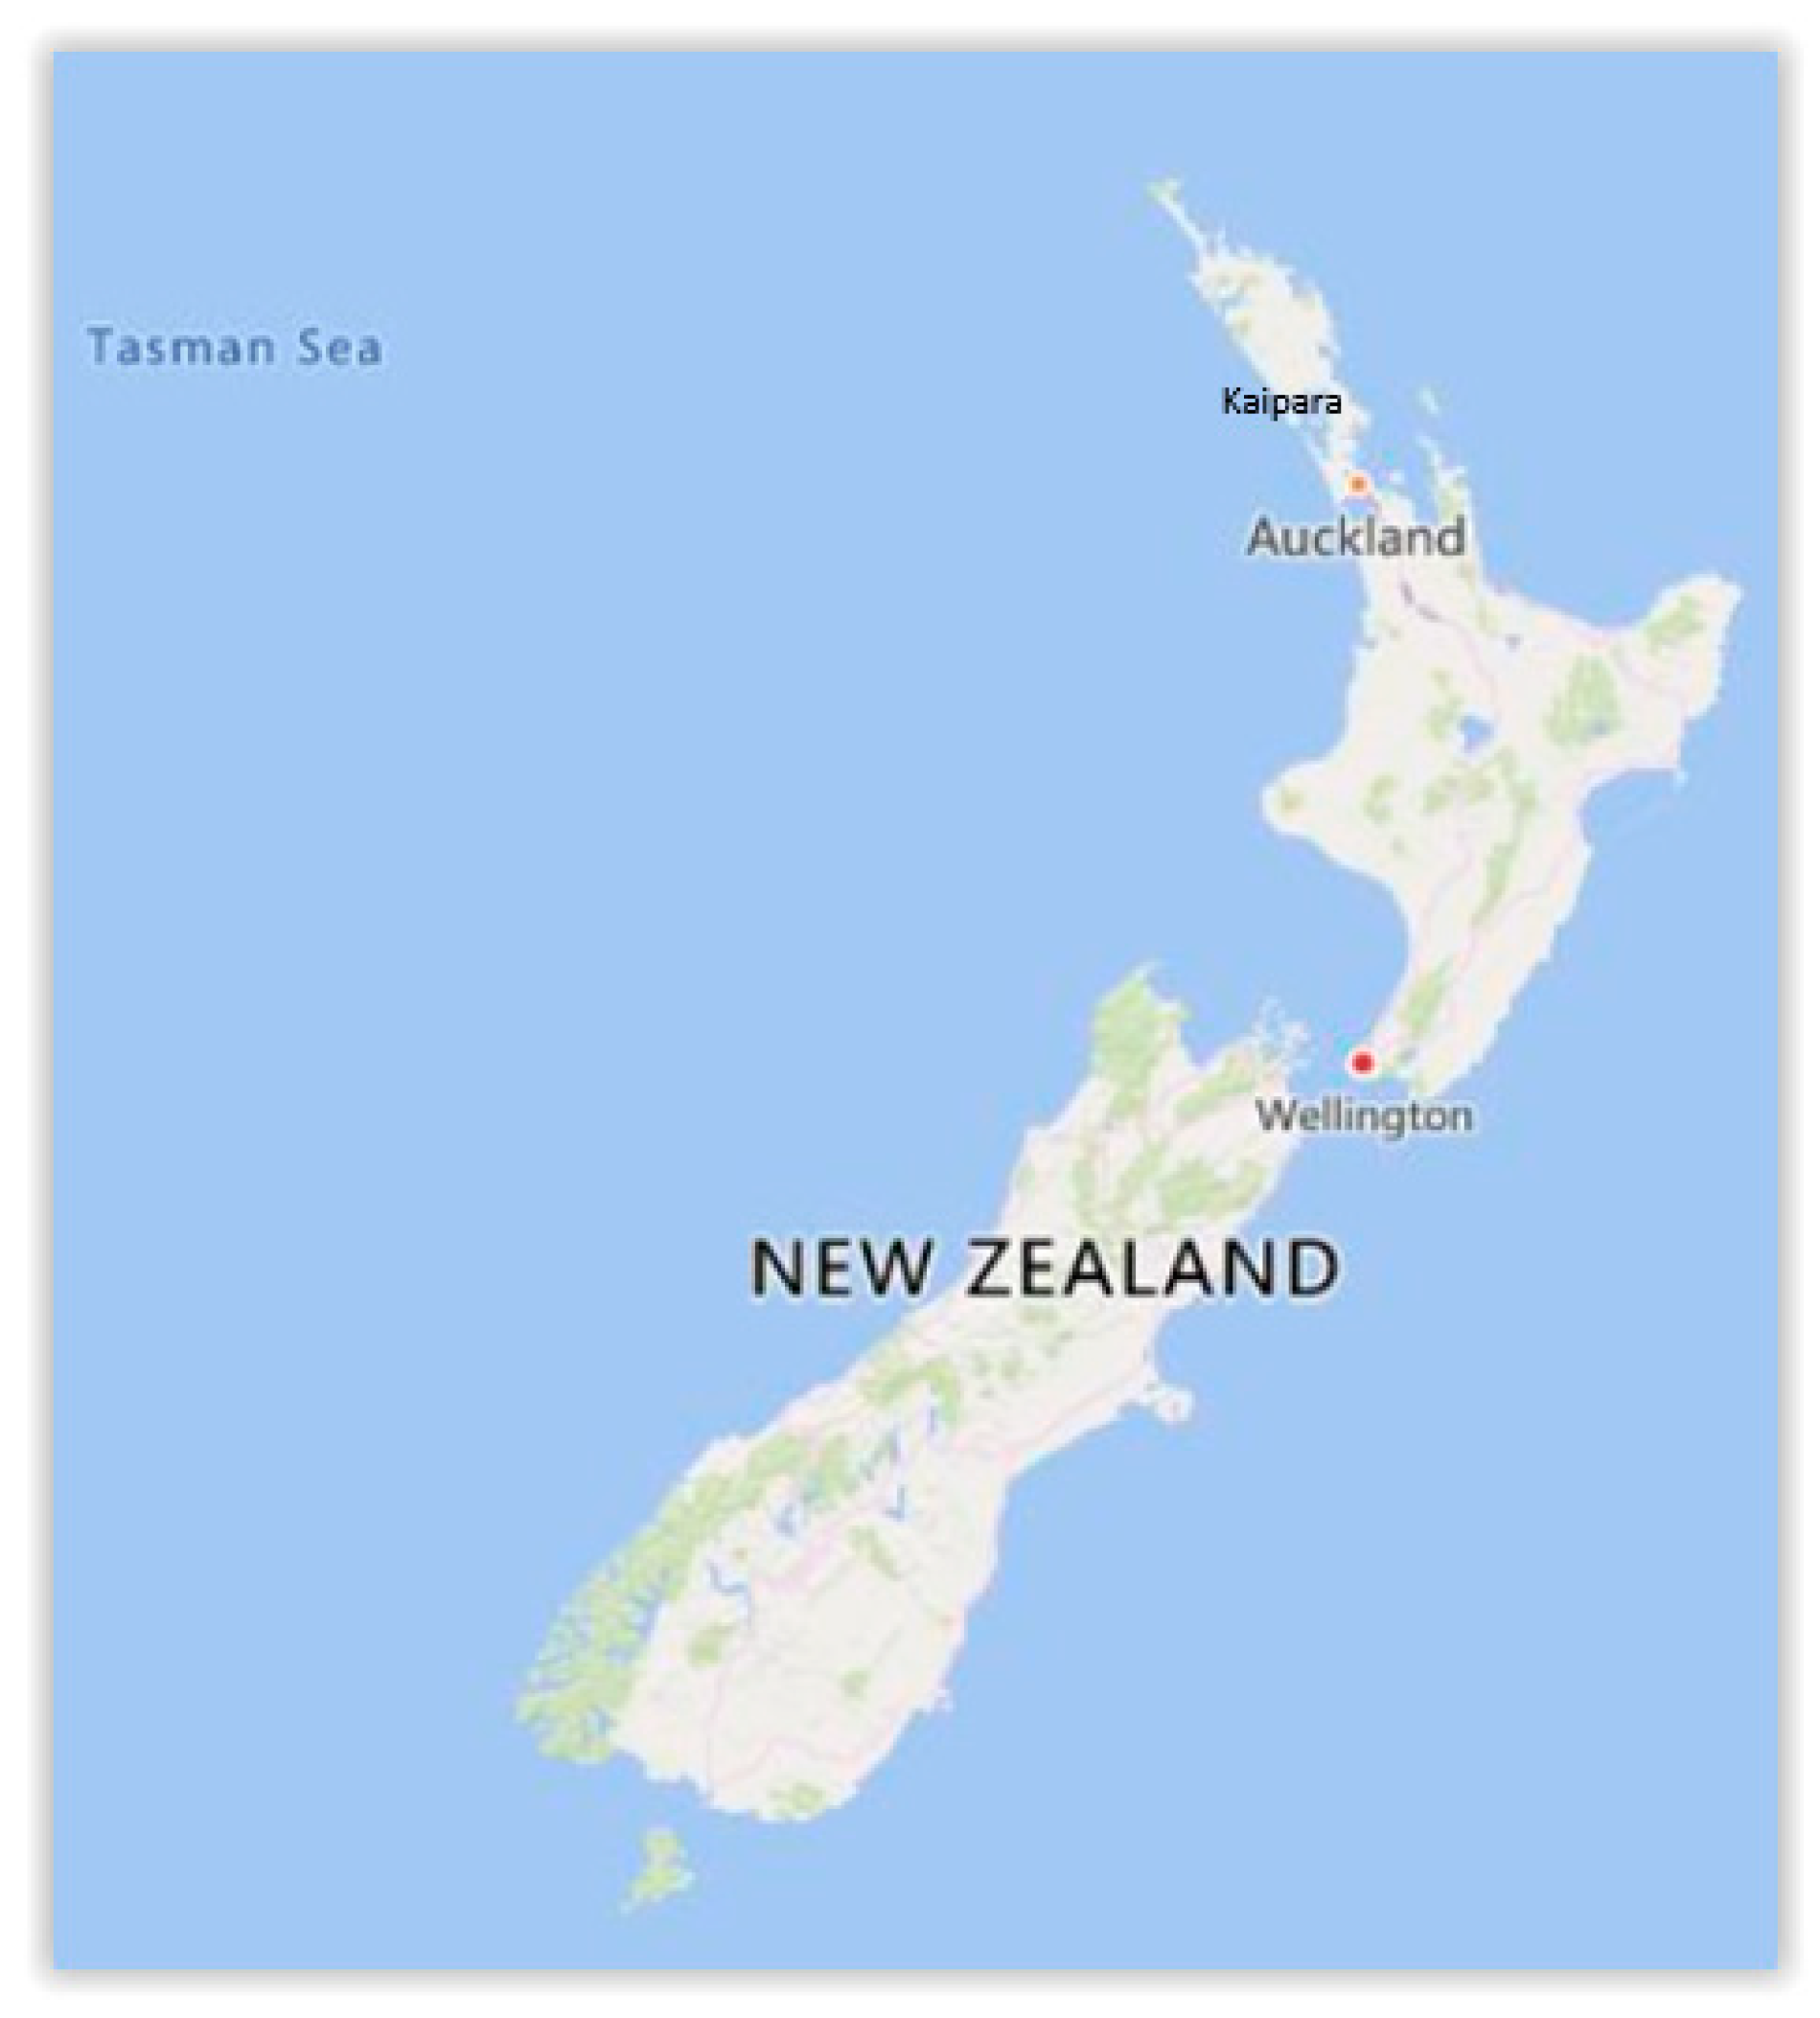
18]. Their investigation shows that the largest are Kaipara, Manukau, Hokianga, Rangaunu, and Whangarei Harbors, respectively. Tidal flows of Kaipara Harbor are the greatest, exchanging at each spring flood or ebb movement a tidal prism of ~1990 million cubic meters at average current of 1.12 m/s. Bellve, Austin, and Woods [19] cite Hicks and Hume’s data in a report identifying the Kaipara harbor as most suitable for tidal energy generation. Crest Energy, based on this evaluation, proposes installing 200 marine turbines in the Kaipara Harbor to generate ~1.2 MW peak with expected power capacity of 1.750 GWh per annum. The Crest Energy proposal is on hold. Intellectual property (designs, models, economic analyses) and development rights are now held by another company; Todd Energy.
Farther south, some older data are available from Heath (1976) [20] which show large open bays have big tidal prisms but weak tidal flows (Table 2). Small harbors or estuaries can have strong flows, but their prisms are small. Large harbors with deep narrow entrances combine large tidal prisms with strong tidal flows. Heath’s measurements indicate Aotea, Waimea, Parengarenga, Tauranga, Kawhia, Rangaunu, Raglan, Whangarei, Bluff, Otago, Hokianga, Manukau, Lythelton, Kaipara, Akaroa, and Wellington Harbor could be worth investigating.
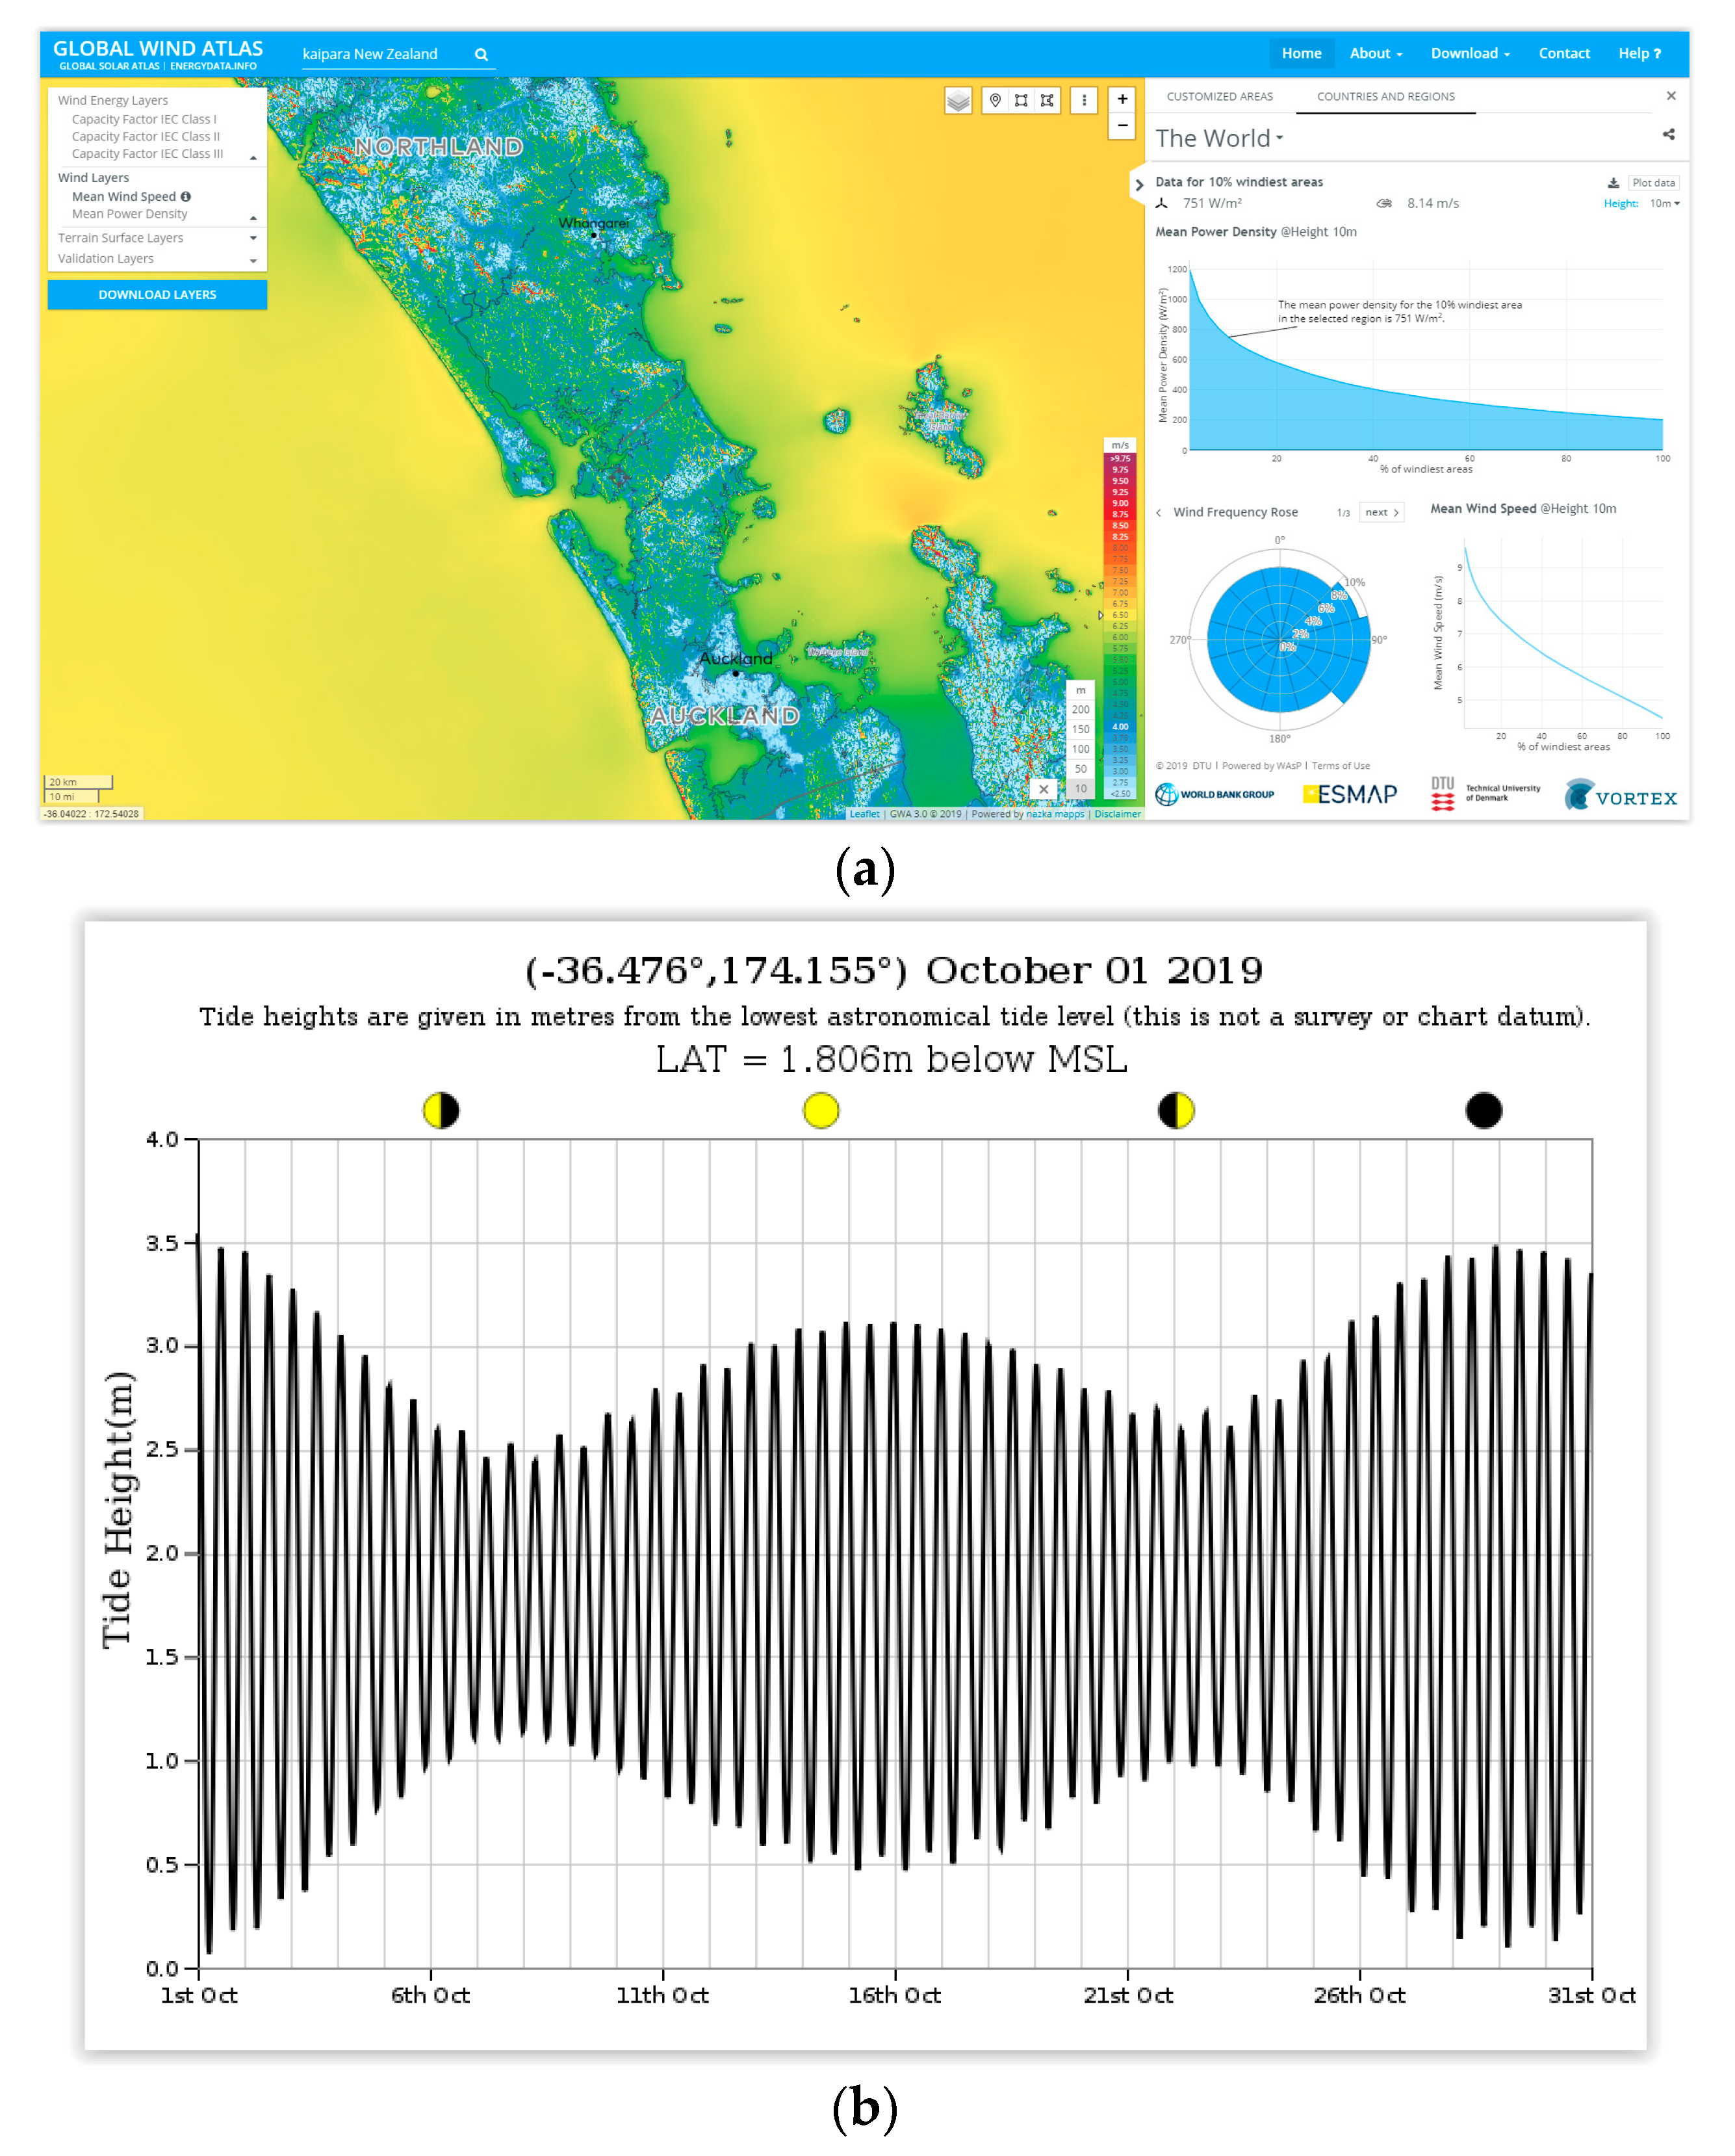
Global Wind Atlas data have been used to identify which of these harbor/estuary sites in Table 1 and Table 2 also have good wind runs (expressed as mean annual wind speed). The latitude, longitude, wind run, and tide range of sites, which appear to have potential for hybrid generation, are summarized in Table 3.
Many sites identified by Heath or Hicks and Hume as having strong tidal flows and large tidal prisms can be ruled out because wind run is not good (Hokianga, Kawhia, Aotea, Tauranga, Lyttelton, Akaroa). Some harbors in Table 3 can be ruled out, because they have commercial ports. Here turbine monopiles will be navigation hazards (except if the deep-water channel extends upstream beyond wharf). Commercial ports ruled out are Whangarei, Waitemata (Auckland), Manukau (Auckland), Tauranga (south entrance), Port Nicholson (Wellington), Lyttelton (Christchurch), Otago (Dunedin), and Bluff (from wharf to entrance).
Some estuaries must also be ruled out, because they contain marine reserves, or they are next to national parks etc. (Port Pegasus, Paterson Inlet, Akaroa, parts of Golden Bay, Whanganui Inlet). Here, the Department of Conservation will not allow resource consent.
Finally a few estuaries with deep entrance channels have to be ruled out because their shores are inhabited by tangata whenua (Maori) who say that the estuaries are taonga (valuable possessions) for fishing, gathering shellfish etc; or that the shores are wahi tapu (sacred places) which must not be disturbed. Examples are Parengarenga, Whangaroa, Bay of Islands, and Whangaruru. Maybe also Hokianga, Whaingaroa (Raglan), Aotea, and Kawhia.

2.3. Selection of Turbines

The turbines proposed for evaluation are Siemens SWT3.6-107-80m for wind above sea level and Atlantis’AR2000 for tide at below sea level.
Atlantis and General Electric are working in partnership since September 2018 on the development and performance validation of Atlantis’ AR2000 tidal generation system (Figure 13 and Table 4), which is expected to be the world’s largest and most powerful tidal turbine available for sale to commercial developers in the fourth quarter of 2019. The AR2000 will have a 25-year design life with quarter-life interventions for routine maintenance.
Output power for the range until 4.5 m/s for an AR2000 tidal turbine is shown in Figure 14.
Figure 15 shows a comparable wind turbine is Siemens, SWT-3.6-107 Offshore which is a production of Siemens Wind Power A/S, a manufacturer from Denmark taken over by Siemens Gamesa Renewable Energy in 2017 (Figure 15 and Table 5).
The wind power curve of the SWT-3.6-107 Offshore wind turbine is depicted in Figure 15.

2.4. Selecting Components for a Microgrid System Design

SIMULINK will be used to design a microgrid system for hybrid offshore wind and tidal energy generation (Figure 16 and Figure 17) and combined model (Figure 18) with Siemens SWT-3.6-107 wind turbines and Atlantis AR2000 tidal turbines.

3. Results and Discussion

3.1. Site Selected for Simulation

Table 6 shows just one site which appears to meet project criteria in all respects (Firth of Thomas does not appear in Table 6 because its wind run is inferior to Kaipara).
The geographical location of this site is shown in Figure 19.
Using Global Wind Atlas (Figure 20a), NIWA tide forecaster (Figure 20b) and RETScreen (Figure 20c), the energy resource parameters for Kaipara harbor are as below Figure 20:

3.2. Wind Energy Yield Estimation

Coefficients, which affect the wind energy yield, are listed in Table 7. Some examples of RETScreen output for the short-listed sites are given in Table 8 and Table 9.
Relevant output parameters from the model are summarized in Table 8. The specific energy yield is found to be 1382 for Kaipara harbors. (The model calculates the specific yield (kWh/m2) of the wind energy equipment, which is a common criterion in the wind energy industry to evaluate and compare the performance of a wind turbine in conjunction with the wind regime at the site. The specific yield is obtained by dividing the energy produced by a proxy wind turbine by the swept area of the rotor. The specific yield normally ranges from 150 to 1500 kWh/m2 per turbine where the low end corresponds to a small wind turbine in a mediocre wind regime and the high end, to a larger wind turbine in a good wind regime.) Annual gross energy yield which is the calculated by multiplying pressure and temperature coefficients at unadjusted energy delivered is 13,766 MWh/year. [23]. The Unadjusted energy delivered or produced energy at standard conditions of temperature and atmospheric pressure, is found to be 13,826 MWh/year.

3.3. Tidal Energy Yield

Tidal energy yield is more difficult to estimate because RETScreen does not have links to a tidal flow atlas, nor an energy yield estimation module for tidal flow. Presently the energy yield obtainable from tidal flow must be estimated in RETScreen by using average tidal flow and making several assumptions (Table 9). Later in the project, the RETScreen model must be refined or an alternative model found, in order to produce more accurate estimates from a complete range of tidal flow velocities and directions at the site.
Meanwhile, the extra energy yield which could be obtained from adding a tidal turbine to each wind turbine at Kaipara harbor is estimated to be at least 415 kWh/m2. The extra annual gross energy yield, without losses, is at least 4130 MWh/year. The extra renewable energy deliverable, after losses, is estimated to be at least 3882 MWh/year, as given in Table 10.

3.4. Economic and Environmental Analysis

Assumptions used about installation cost (Table 11) and financial parameters (Table 12) indicates the feasibility of hybrid system (Table 13) as an example of RETScreen output. The assumptions are not entirely hypothetical, because they are derived from real wind and tidal turbine installations overseas [23,24]. In the following examples, assumptions generated by RETScreen for adding a tidal turbine to a wind turbine are extra capacity factor 30%, extra initial cost $10,400/kW, and extra operating/maintenance cost $70/kW-year.
As seen from Table 11, electrical equipment including turbines accounts for 74% of total cost. About 14%, is balance of plant (BOP) cost, i.e., construction. Other cost parameters are summarized in Table 12.
Economic analysis demonstrates a hybrid system which, (wind plus tidal) if installed at Kaipara harbor, may return 9.7% on investment over life of the project, and may pay back construction cost after the first 13 years (Table 13).
Environmental analysis (Table 14) demonstrates that there would be a benefit of 8533 tons Co2/year greenhouse gas emission reduction (the amount which would be emitted generating an equivalent amount of energy from burning fossil fuel).
An example of the key RETScreen findings for hybrid (wind plus tidal) energy deliverable at the Kaipara site is given in Table 14.

4. Conclusions

Results so far indicate that Kaipara harbor has good potential for energy generation from a hybrid system (wind plus tidal) with good wind energy yield, and additional energy from tidal energy.
To complete this research, it will be necessary to obtain realistic installation and operating cost estimates for the proposed NZ site, plus financial parameters appropriate to the NZ electricity market.
Preliminary findings for Kaipara site indicate:
  • It is practical to erect a microgrid system for offshore hybrid wind and tidal generation, at the selected NZ coastal site.
  • The quantities of electricity generated by a hybrid system (compared to solely offshore wind or solely offshore tidal) at the selected site.
  • Cost of erecting and operating a hybrid wind plus tidal turbine at Kaipara on the NZ coast.
  • Value of extra electricity generated by a hybrid (compared with either a single wind or a single tidal turbine) at the same site.
  • There is an economic benefit from the extra electricity generated.
  • The economic benefit may be sufficient to warrant constructing a hybrid wind plus tidal system.
Whether there is a sufficient benefit will remain unknown unless more research is carried out. Completion of the research will establish what benefits exist. One or more benefits might be found:
  • Increased generating capacity (at any site).
  • Or increase in actual power output (at sites where wind frequency and tidal cycle favor co-generation).
  • Reduced cost of constructing a tower (per unit of electricity generated) if two turbines can be installed on it.
  • Plus, reduced cost of operating multiple towers (per unit of electricity generated).
  • Whether a power company could increase its revenue by sale of extra electricity.
  • Or whether it could increase its market share (by reducing cost of electricity to customers).

Author Contributions

“Conceptualization, N.M.N., J.K. and L.B.; methodology, N.M.N., J.K. and L.B.; software, N.M.N.; validation, N.M.N., J.K. and L.B..; formal analysis, N.M.N.; investigation, N.M.N.; resources, N.M.N., J.K.; data curation, N.M.N.; writing—original draft preparation, N.M.N., J.K.; writing—review and editing, N.M.N., J.K.; visualization, N.M.N.; supervision, J.K.; project administration, N.M.N.; funding acquisition, No funding. All authors have read and agreed to the published version of the manuscript.

Funding

This research received no external funding.

Acknowledgments

The authors wish to acknowledge the technical support of Douglas Hicks who edited and proof-read our draft paper.

Conflicts of Interest

The authors declare no conflict of interest.

References

  1. Kulkarni, S.J. Tidal Energy: A Review. Int. J. Res. 2015, 2, 55–59. [Google Scholar]
  2. Fraenkel, P. Marine Current Turbines: Exploiting Tidal Currents for Large-scale Power Generation. 2007. Available online: https://www.google.com.hk/url?sa=t&rct=j&q=&esrc=s&source=web&cd=13&ved=2ahUKEwiljd7tnO7nAhVCI6YKHXBtCVwQFjAMegQIBBAB&url=http%3A%2F%2Fwww.iom3 (accessed on 5 December 2019).
  3. Esteban, M.D.; Diez, J.J.; López, J.S.; Negro, V. Why offshore wind energy? Renew. Energy 2011, 36, 444–450. [Google Scholar] [CrossRef] [Green Version]
  4. Green, R.; Vasilakos, N. The economics of offshore wind. Energy Policy 2011, 39, 496–502. [Google Scholar] [CrossRef]
  5. A Report by the European Wind Energy Association; Wind Energy Targets for 2020 and 2030. Available online: http://www.ewea.org/fileadmin/files/library/publications/reports/Pure_Power_III.pdf (accessed on 5 December 2019).
  6. Kaldellis, J.; Kapsali, M. Shifting towards offshore wind energy—Recent activity and future development. Energy Policy 2013, 53, 136–148. [Google Scholar] [CrossRef]
  7. Peyrard, C.  Offshore Wind Turbine Foundations.EDF R&D . LNHE Laboratoire d Hydraulique St Venant. Available online: https://docplayer.net/37756517-Offshore-wind-turbine-foundations-christophe-peyrard-edf-r-d-lnhe-laboratoire-d-hydraulique-st-venant.html (accessed on 5 December 2019).
  8. Pinon, G. Tidal energy—Hydrolien. In Proceedings of the CNRS Conference, Nantes, France, 19–20 October 2016. [Google Scholar]
  9. Wang, L.; Lin, C.-Y.; Wu, H.-Y.; Prokhorov, A.V. Stability analysis of a microgrid system with a hybrid offshore wind and ocean energy farm fed to a power grid through an HVDC link. IEEE Trans. Ind. Appl. 2017, 54, 2012–2022. [Google Scholar] [CrossRef]
  10. Bortolotti, P.; Tarres, H.C.; Dykes, K.L.; Merz, K.; Sethuraman, L.; Verelst, D.; Zahle, F. IEA Wind TCP Task 37: Systems Engineering in Wind Energy-WP2. 1 Reference Wind Turbines; National Renewable Energy Lab.: Golden, CO, USA, 2019.
  11. Marten, D.; Wendler, J.; Pechlivanoglou, G.; Nayeri, C.N.; Paschereit, C.O. Development and application of a simulation tool for vertical and horizontal axis wind turbines. In ASME Turbo. Expo. 2013: Turbine Technical Conference and Exposition; American Society of Mechanical Engineers: New York, NY, USA, 2013. [Google Scholar]
  12. Sinha, S.; Chandel, S. Review of software tools for hybrid renewable energy systems. Renew. Sustain. Energy Rev. 2014, 32, 192–205. [Google Scholar] [CrossRef]
  13. Denee, C.M.A.T. We Are Here An. Atlas of Aotearoa; Massey University Press: Auckland, New Zealand, 2019.
  14. Pinkerton, R.M. The Variation with Reynolds Number of Pressure Distribution Over an Airfoil Section; US Government Printing Office: Washington, WA, USA, 1938. [Google Scholar]
  15. Danao, L.A.; Abuan, B.; Howell, R. Design analysis of a horizontal axis tidal turbine. In Proceedings of the 3rd ASIAN Wave and Tidal Conference, Sheffield, UK, 31 August 2016. [Google Scholar]
  16. Huckerby, J.; Johnson, D.; Nobs Line, N.P. New Zealand’s wave and tidal energy resources and their timetable for development. In Proceedings of the International Conference on Ocean, Energy (ICOE), Brest, France, 15–17 October 2008; pp. 15–17. [Google Scholar]
  17. Johnson, D.; McComb, P.; Beamsley, B.; Zyngfogel, R. Marine Energy Resources: Ocean Wave and Tidal Current Resources in New Zealand, Tech. Rep. P0021-01; MetOcean Solutions Ltd.: New Plymouth, New Zealand, 2008. [Google Scholar]
  18. Hicks, D.M.; Hume, T.M. Morphology and size of ebb tidal deltas at natural inlets on open-sea and pocket-bay coasts, North Island, New Zealand. J. Coast. Res. 1996, 12, 47–63. [Google Scholar]
  19. Bellvé, A.R.; Austin, G.; Woods, B.; Power, T. Pathway to Energy Generation from Marine Tidal Currents in New Zealand’s Kaipara Harbour. Available online: http://www.thesustainabilitysociety.org.nz/conference/2007/papers/BELLVE-Pathway%20to%20Renewable%20Marine%20Energy.pdf (accessed on 5 December 2019).
  20. Heath, R. Broad classification of New Zealand inlets with emphasis on residence times. N. Z. J. Mar. Freshw. Res. 1976, 10, 429–444. [Google Scholar] [CrossRef]
  21.  Retscreen International, Clean Energy Project Analysis Software. Available online: https://www.nrcan.gc.ca/maps-tools-publications/tools/data-analysis-software-modelling/retscreen/7465 (accessed on 2 December 2019).
  22.  NIWA Tide Forecaster. Available online: https://tides.niwa.co.nz/ (accessed on 2 December 2019).
  23. Koukouvinis, P.K.; Anagnostopoulos, J.S.; Papantonis, D.E. SPH method used for flow predictions at a Turgo impulse turbine: Comparison with fluent. World Acad. Sci. Eng. Technol. 2011, 79, 659–666. [Google Scholar]
  24. Himri, Y.; Rehman, S.; Draoui, B.; Himri, S. Wind power potential assessment for three locations in Algeria. Renew. Sustain. Energy Rev. 2008, 12, 2495–2504. [Google Scholar] [CrossRef]
Figure 1. Effect of CO2 emission from fossil fuels in the last 1000 years [2].
Sustainability 12 01807 g001
Figure 2. Supply–demand gap of oil by 2040 [2].
Sustainability 12 01807 g002
Figure 3. Comparison between the potential of onshore and offshore wind energy in different water depths and European energy demand [3].
Sustainability 12 01807 g003
Figure 4. Installed Offshore Wind Power (end of 2011) [6].
Sustainability 12 01807 g004
Figure 5. Evolution of the Turbine Diameter in onshore and offshore wind turbines [7].
Sustainability 12 01807 g005
Figure 6. Annual Wind Energy Investments up to 2030 based on the European Wind Energy Association (EWEA), 2009c.
Sustainability 12 01807 g006
Figure 7. Global tidal resources [8].
Sustainability 12 01807 g007
Figure 8. Modules in QBlade [11].
Sustainability 12 01807 g008
Figure 9. Schematic representation of RETScreen [12].
Sustainability 12 01807 g009
Figure 10. NIWA recording sites, selected to show typical wind patterns in 2014 [13].
Sustainability 12 01807 g010
Figure 11. Wind patterns in New Zealand [13].
Sustainability 12 01807 g011
Figure 12. Depth-averaged tidal current speeds for mean spring flows (in m/second).
Sustainability 12 01807 g012
Figure 13. The AR2000 tidal turbine.
Sustainability 12 01807 g013
Figure 14. Output power of Tidal turbine—(PTidal max for one rotor = 2000 kW→PTidal max for two rotors = 4000 kW).
Sustainability 12 01807 g014
Figure 15. Output power of Wind turbine—(PWind-max = 3600 kW).
Sustainability 12 01807 g015
Figure 16. Simulink model of tidal turbine portion.
Sustainability 12 01807 g016
Figure 17. Simulink model of wind turbine portion.
Sustainability 12 01807 g017
Figure 18. Simulink model of combined system.
Sustainability 12 01807 g018
Figure 19. Map showing the location of the site which might be suitable for modelling a microgrid hybrid system.
Sustainability 12 01807 g019
Figure 20. Tide Heights [22] and Environmental conditions [21] of Kaipara Harbour.
Sustainability 12 01807 g020aSustainability 12 01807 g020b
Table 1. Characteristics of tidal inlets in North Island [18].
InletMean Spring Tide Range (m)Mean Spring Tidal Prism 106 m3)Throat Width@MT (m)Throat Area @ MT (m2)Throat Depth (mean) @ MT (m2)
Hokianga2.77228109013,00011.9
Kaipara2.681990560082,00014.6
Katikati1.695.8380468012.3
Kawhia2.912160011,00018.3
Mangawhai1.86.552165002.31
Manukau3.38918190046,00024.2
Ngunguru1.713.831093102.84
Ohiwa1.628.130818806.10
Parengarenga2.1373.0500700014.00
Raglan2.846.064036005.63
Rangaunu2.0134101264906.41
Tairua1.65.021304303.31
Tauranga1.6131480626013.0
Whananaki1.81.46791301.60
Whangarei2.115579014,60018.5
Whangateau2.210.51746603.79
Whitianga1.612.624013005.42
Table 2. Physical characteristics of 32 New Zealand inlets [20].
Inlet NameCross-Sectional Area EntranceTidal Range (m)Tidal Compartment
Low Tide Spring (103 m2)Mid Tide Spring (103 m2)Spring Tides (m)Neap Tides (m)Spring Tides (106 m3)Neap Tides (106 m3)
Moutere0.40.94.22.4159
Avon-Heathcote--2.11.3116
Aotea2.23.62.91.75935
Waimea2.35.83.41.85831
Whanganui Inlet2.33.92.91.54222
Parengarenga6.272.131.47348
Nelson22.63.42.63023
Tauranga7.37.81.621.24178136
Kawhia8112.91.712171
Porirua-Pauatahanui1.41.81.61.32217
Rangaunu7.18.82.01.5134101
Raglan2.93.62.81.84629
Whangarei13142.461.74164116
Bluff3.84.52.21.59766
Otago4.75.11.741.286951
Hokianga11132.771.78228147
Manukau42463.381.95918530
Whangaruru212321.52821
Lyttelton28301.921.647261
Firth of Thames4004403.722.6825801860
Kaipara73822.681.5219901130
Whangaroa4.34.71.951.343323
Akaroa45471.891.528165
Doubtless Bay6426521.91.4346255
Paterson Inlet55592.01.4168120
Tasman bay245025603.441.816,0008300
Poverty Bay1401461.41.28170
Pelorus Sound1171212.371.46660410
Bay of Islands103410501.951.46340260
Wellington Harbor38391.010.948882
Queen Charlotte Sound8808901.40.59835
Hawke Bay525053001.341.2239503600
Table 3. The geographical coordinates and tide range and wind run of New Zealand harbors and estuaries [20,21].
LocationLatitude (deg)Longitude (deg)Spring Tides (m)Neap Tides (m)Annual Wind Speed (m/s)
Bluff−46.4° N168.3° E2.21.510.7
Whanganui Inlet−40.8° N175.8° E3.42.64.3
Hokianga−35.1° N173.3° E2.771.784.5
Kawhia−37.8° N175.3° E2.91.74.7
Manukau−37.0° N174.8° E3.381.955
Kaipara−36.8° N174.8° E2.681.526.4
Aotea−37.8° N175.3° E2.91.74.7
Parengarenga−34.5° N172.9° E2.131.48.5
Tauranga−37.7° N176.2° E1.621.244.1
Rangaunu−34.9° N173.3° E2.01.54.5
Whangarei−35.7° N174.3° E2.461.746.5
Otago−45.8° N170.6° E1.741.285.9
Lyttelton−43.6° N172.7° E1.921.624.2
Akaroa−43.8° N173.0° E1.891.524.2
Wellington −41.3° N174.8° E1.010.947.3
Firth of Thames−37.0° N175.4° E3.722.685.7
Table 4. AR2000 Tidal Turbine Parameters.
ItemValue
ModelAR2000 tidal turbine 2 MW
Rated power (kW)2000
Rotor diameter (m)20
Height from the seabed (m)25
Swept area of rotor (m2)314
Cut-in speed (m/s)1
Cut-out speed (m/s)3
Weight (t)150
Table 5. SWT-3.6-107 Offshore Wind Turbine Parameters.
ItemValue
ModelSiemens SWT-3.6-107 Offshore 3.6 MW
Rated power (kW)3600
Rotor diameter (m)107
Hub height (m)80
Swept area of rotor (m2)8992
Cut-in-wind-speed (m/s)4
Rated wind speed (m/s)15
Cut-out-wind speed (m/s)25
Rotor Speed (rpm)13
Tower TypeSteel tube
Table 6. The geographical coordinates, tide range, and wind run of the New Zealand sites which might be used for modelling a microgrid hybrid system [20,21].
LocationLatitude (deg)Longitude (deg)Spring Tides (m)Neap Tides (m)Annual Wind Speed (m/s)
Kaipara−36.8° N174.8° E2.681.526.4
Table 7. Wind energy related coefficients used in energy yield estimation.
Wind Energy Related CoefficientsKaipara Harbor
Array losses (%)0
Airfoil soiling and/or icing losses (%)2
Miscellaneous losses (%)6
Pressure adjustment coefficient0.999
Temperature adjustment coefficient0.997
Wind shear exponent0.14
Table 8. Summary of energy yield and related output from SWT-3.6-107 Offshore wind turbine.
Summary of Energy Yield and Related Output from SWT-3.6-107 Offshore Wind TurbineKaipara Harbor
Annual mean wind speed (m/s)6.35
Specific yield (kWh/m2)1382
Gross energy yield (MWh/year)13,766
Unadjusted energy delivered (MWh/year)13,826
Table 9. Tidal energy related coefficients used in energy yield estimation.
Wind Energy Related CoefficientsKaipara Harbor
Array losses (%)0
Miscellaneous losses (%)6
Pressure adjustment coefficient0.999
Temperature adjustment coefficient0.98
Energy adjustment coefficient1.3
Table 10. Summary of energy yield and related output from AR2000 tidal turbine.
Summary of Energy Yield and Related Output from AR2000 Tidal TurbineKaipara Harbor
Annual mean tidal flow (m/s)1.12
Specific energy yield (kWh/m2)415
Gross energy yield (MWh/year)4130
Tidal energy delivered (MWh/year)3882
Table 11. Cost of hybrid system development [24].
Cost itemHybrid Amount ($)Percent of Total Cost (%)
Feasibility study372,0000.6
Development1,240,0002.0
Engineering868,0001.4
Energy equipment46,314,00074.7
Balance of plant8,556,00013.8
Miscellaneous4,650,0007.5
Initial costs-total62,000,000100
Table 12. Economic input parameters [23].
ItemsValue
Inflation (%)2
Discount rate (%)9
Project life (year)30
Annual operation and maintenance cost ($/year) for each turbine 490,000
Table 13. Economic feasibility indicators for hybrid system.
ItemKaipara Harbor
IRR (internal rate of return)-equity (%)9.7
IRR-assets (%)4.3
MIRR (modified internal rate of return)-equity (%)9.3
MIRR- assets (%)6.6
Simple payback (year)13.6
Total annual savings and revenue5,051,832
Net present value—NPV ($)3,312,754
Annual life cycle savings ($)322,451
Benefit–cost (B–C) ratio1.2
Energy production cost ($/kWh)0.344
Table 14. Key RETScreen finding for hybrid model.
Key RETScreen Findings for Hybrid ModelKaipara Harbor
Electricity exported to grid MWh18,042
Electricity exported revenue $5,051,832
GHG emission reduction (tons CO2/year)8533

