Article

Assessment of the Impact of Climate Change Policies on the Market for Forest Industrial Residues

1
Great Lakes Forestry Centre, Canadian Forest Service, Natural Resources Canada, Sault Ste. Marie, ON P6A 2E5, Canada
2
Economic Analysis Division, Canadian Forest Service, Natural Resources Canada, Ottawa, ON K1A 0E4, Canada
*
Author to whom correspondence should be addressed.
Sustainability 2020, 12(5), 1787; https://doi.org/10.3390/su12051787
Submission received: 30 December 2019 / Revised: 11 February 2020 / Accepted: 23 February 2020 / Published: 27 February 2020
(This article belongs to the Special Issue Economic Evaluation of Renewable Energy Sources)

Abstract

:
As part of the Pan-Canadian Framework (PCF) on Clean Growth and Climate Change, the Government of Canada (GoC) introduced carbon pricing and is in the process of developing a Clean Fuel (CF) Standard. Both policies are key elements of the PCF and aim to reduce greenhouse gas (GHG) emissions through the use of lower carbon fuels, including bioenergy. Carbon pricing and the CF Standard are expected to increase the demand for biomass feedstocks, possibly threatening feedstock availability for existing forest industrial residues users, including composite panel manufacturers. To assess the potential impact of carbon pricing and the CF Standard on Canadian composite panel producers, a Monte Carlo-based model was developed to estimate possible increases in feedstock price-points that composite panel manufacturers may face as a result of increases in bioenergy consumption. Results suggest that the composite panel industry may be negatively impacted in the long-term (2030) by the relative price increase of fossil fuels covered by carbon pricing and additional revenues for biofuel suppliers from CF Standard credits, assuming no other adjustments to the market. Although these results are preliminary in that the analysis excludes external market factors that could influence the outcome, there is evidence that such policies have the potential to generate supply risks for the Canadian composite panel industry without careful consideration of the associated externalities.

1. Introduction

In order to meet its commitments to the Paris Agreement, the Government of Canada (GoC) is in the process of developing and implementing a set of policies and programs to meet its greenhouse gas (GHG) emissions reduction target of 30% below 2005 levels by 2030 [1]. As part of an effort to achieve this goal, the GoC, in collaboration with provinces and territories, developed a Pan-Canadian Framework (PCF) on Clean Growth and Climate Change [1]. The PCF addresses emissions reduction in many ways, including a carbon pricing system and the development of a Clean Fuel Standard (CF Standard), which is designed to promote the use of lower carbon fuels including bioenergy. Both carbon pricing and the CF Standard may have significant implications for the Canadian economy and the Canadian forestry sector.
Canada’s forest sector has the potential to play a significant role in climate change mitigation and contribute to the successful implementation of the PCF [1]. Due to its abundant forest resources, Canada is well placed to generate a wide range of bioenergy products. Both carbon pricing and the CF Standard could support further growth in forest-based bioenergy. Carbon pricing is intended to increase the cost of fossil fuels (and electricity generated from fossil fuels), positively influencing the relative competitiveness of bioenergy generated from renewable sources, including wood pellets. The CF Standard will create requirements for fossil fuel producers, importers and distributors to lower the carbon intensity (i.e., life cycle GHG emissions) of their fuels [2]. The options available for compliance includes the purchase of credits generated by low-carbon fuel producers, providing an additional source of revenue for bioenergy producers. Both carbon pricing and the CF Standard are designed to incent continued reductions in emissions over time via increases in emissions costs (carbon pricing) and increases in credit values [2], potentially increasing the demand for biofuels and biomass over time.
The Canadian forest sector is considered to be well integrated between industries and across supply chains. The sawmill residues typically considered by GHG policies for direct energy use or conversion into bioenergy are generally used as feedstocks for manufacturing other wood products, including composite panels. Although the supply of materials for bioenergy may seem significant, volumes that are truly available may be limited [3] as industrial residues are almost already entirely used within the forest sector [4]. This results in an increased focus on underutilized sources, such as harvest residues and salvaged trees from forest fires and pests, with recent studies pointing to significant volumes of such biomass available to meet an increasing demand for bioenergy [5,6,7]. However, ecological (e.g., requirements to leave standing dead trees and other residues for decay) and technical (e.g., limited accessibility with machinery) constraints combined with the cost of specialized equipment for combing and bundling residues limits the volume of residues that are economically attractive to extract [6]. It should also be noted that harvest residues and salvaged trees require further conditioning for use in some applications when compared with “clean” industrial residues. At the moment, the collection of residues for energy use is limited in Canada, except in certain situations, like British Columbia where an increase in pellet production capacity to meet export markets is combined with a decline in fiber supply caused by recent forest fires and pest outbreaks [8,9,10]. Policies like carbon pricing or the CF Standard that support low carbon fuels could contribute to diverting feedstocks from traditional forest products, possibly impacting the competitiveness of these industries.
The potential for diversion of feedstock from traditional wood-product industries towards bioenergy use is well known [3,11,12,13], although none have examined the specific impacts of the GoC’s climate change policy and the unintended consequences of these policies on traditional wood-product industries in Canada. Studies conducted using the forest sector in Norway as their base case have modeled the impact of increased energy prices [14] and potential future prices of electricity and oil [15] on the production of bioenergy and traditional forest products. Another study looked at the impact of bioenergy subsidies for coal to biomass conversions and carbon pricing on the uptake of bioenergy in the European Union [16]. Modeling done with the French Forest Sector Model has demonstrated that the impact on forest resource prices and availability depend on the type of policy implemented and whether policies are supporting biomass for heat or for energy [17,18] For example, the impacts on the forest sector and beyond depend on where in the supply chain the policies are targeted, e.g., upstream as a producer subsidy, downstream as a consumer subsidy or as fixed demand in the form of public procurement [17]. In Canada, researchers have examined the impact of increased bioenergy production on carbon emissions [19,20,21], changes in fiber flows and supply [13,22], production [12]. Johnston and van Kooten [12] found that doubling global pellet demand could lead to an increase in the production of some forest products, like lumber and plywood, but increased competition for residuals fiber leads to decreased production of particleboard and pulp.
The Canadian composite panel industry has expressed concerns that the implementation of carbon pricing and the CF Standard will lead heat consumers to increase their demand for bioenergy, thereby jeopardizing the composite panel manufacturers’ ability to access a stable supply of wood chips, shavings and sawdust at current prices. The purpose of this study is to evaluate the indirect effects of the carbon pricing and CF Standard policies in Canada with respect to the Canadian composite panel industry. A stochastic spreadsheet model was developed to estimate future heating fuel and energy prices for various consumer groups in different regions after the implementation of carbon pricing and the CF Standard.

Background

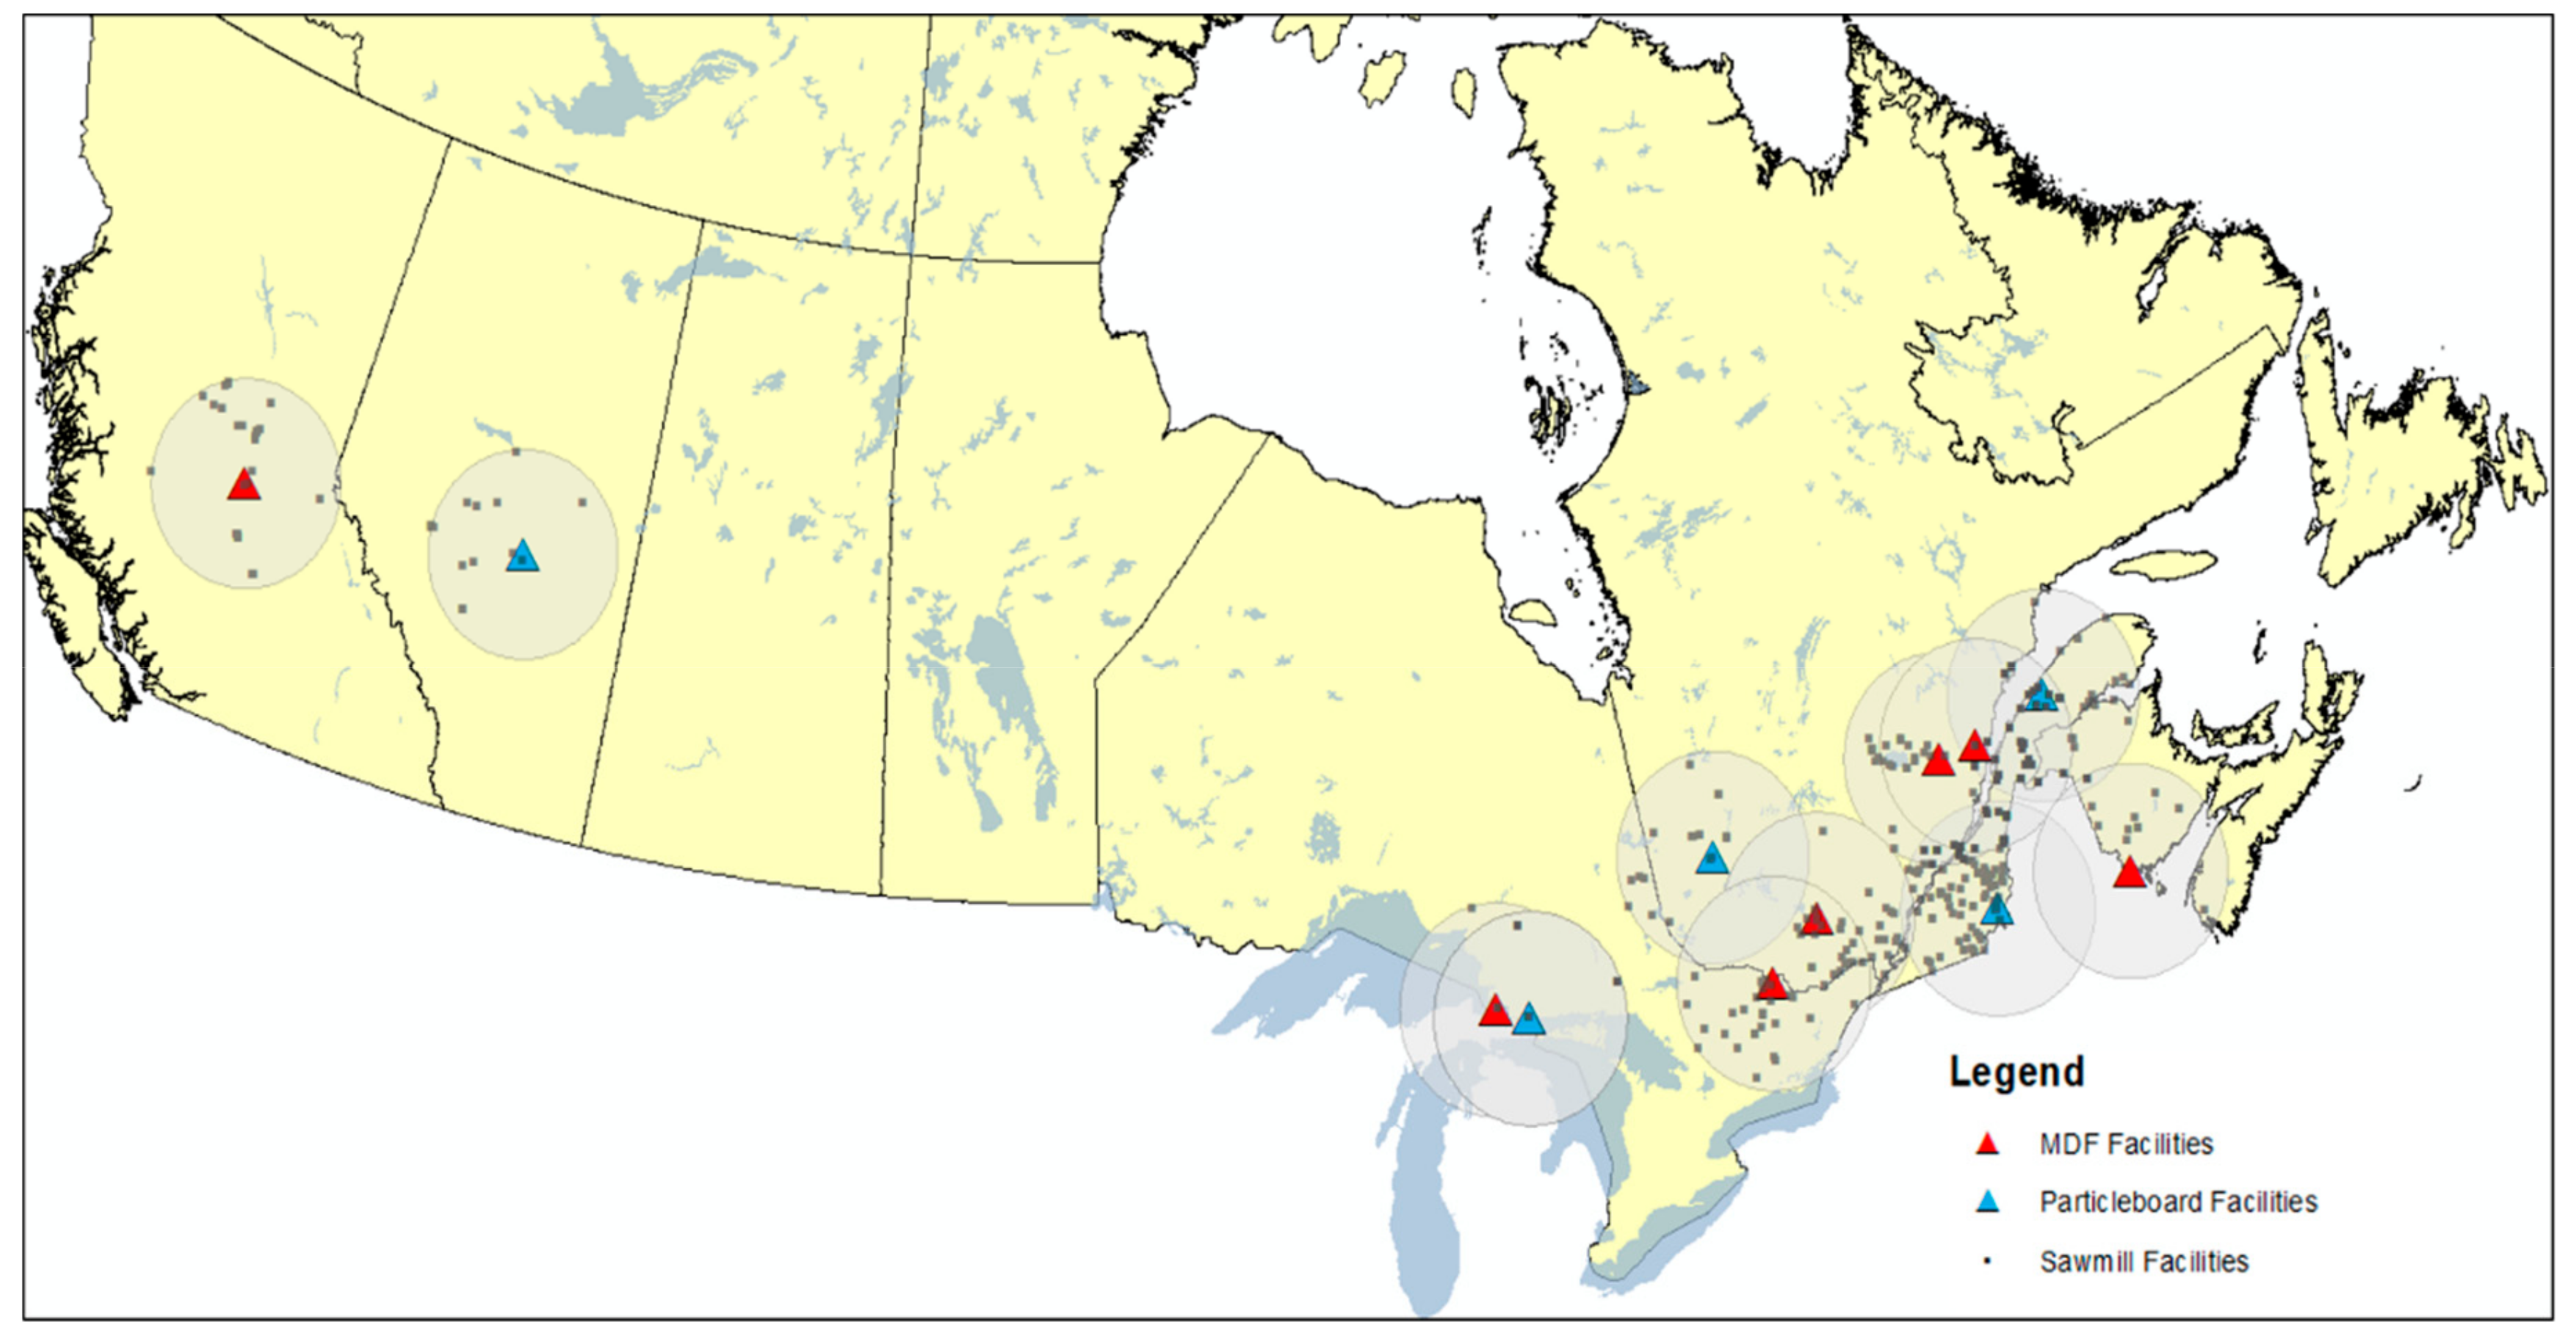
The composite panels industry relies on a supply of sawdust, shavings and chips from sawmills for the production of particleboard and medium-density fiberboard (MDF), used for residential and office furniture, cabinets, countertops, etc. The Canadian composite panel industry currently has a production capacity of approximately 2,400,000 cubic meters of particleboard and 1,350,000 cubic meters of MDF, which represents approximately 25% of North America’s total capacity [23].The value of the exports from the sector totaled $CAD 790 million in 2018, 2.0% of total Canadian wood product export value of $CAD 38.6 billion [24]. As of November 2019, composite panel manufacturers employed over 2000 persons in 12 mills located across the country. The mills are often located in close proximity to feedstock suppliers such as sawmills, as shown in Figure 1.
Under the carbon pricing and CF Standard elements of the PCF, the composite panel industry is concerned that the additional incentivized demand for biomass will divert sawmill by-product feedstocks towards bioenergy production. The PCF underpins climate action at a national level and aims to increase technology development and adoption to ensure Canadian businesses are competitive in the global low-carbon economy [1]. The framework was developed by the GoC with provinces and territories and through engagement with Indigenous peoples. Built on four pillars, the PCF prices pollution, supports complementary actions to reduce emissions across the economy, encourages adaptation and climate resilience, and encourages clean technology, innovation and jobs. Sector specific regulations are part of complementary actions under the PCF, with the CF Standard expected to deliver 30 megatonnes of GHG reductions in 2030 from the 2016 baseline. The suite of actions proposed by the PCF influence how energy is produced and consumed across the economy, and therefore has direct and indirect impacts on all industrial sectors.
Currently, forest biomass is a dominant source of bioenergy used across the Canadian economy [25], but bioenergy as a whole only represents 5% of the country’s total primary energy supply [26]. Approximately two thirds of the forest bioenergy is used within the forest sector itself, in the form of solid residues or pulping liquor, while the rest consists mostly of firewood used for home heating [27]. Interestingly, forest biomass accounts for 60% of energy used by Canadian pulp and paper mills and for 50% of energy used by wood product manufacturers [28]. The increased use of bioenergy helped the forest sector decrease its GHG emissions by 49% between 2004 and 2015 [29]. Wood represents 11% of energy use in the residential sector [30] and its use remains marginal in other industrial sectors, commercial and institutional buildings, and for stand-alone electric generation. However, commercial and institutional bioheat installations across Canada have increased significantly in the past eight years. According to data collected by the Canadian Forest Service (CFS), the number of bioheat installations across Canada increased from 66 to 350 between 2011 and 2017 [31].

2. Materials and Methods

2.1. Model

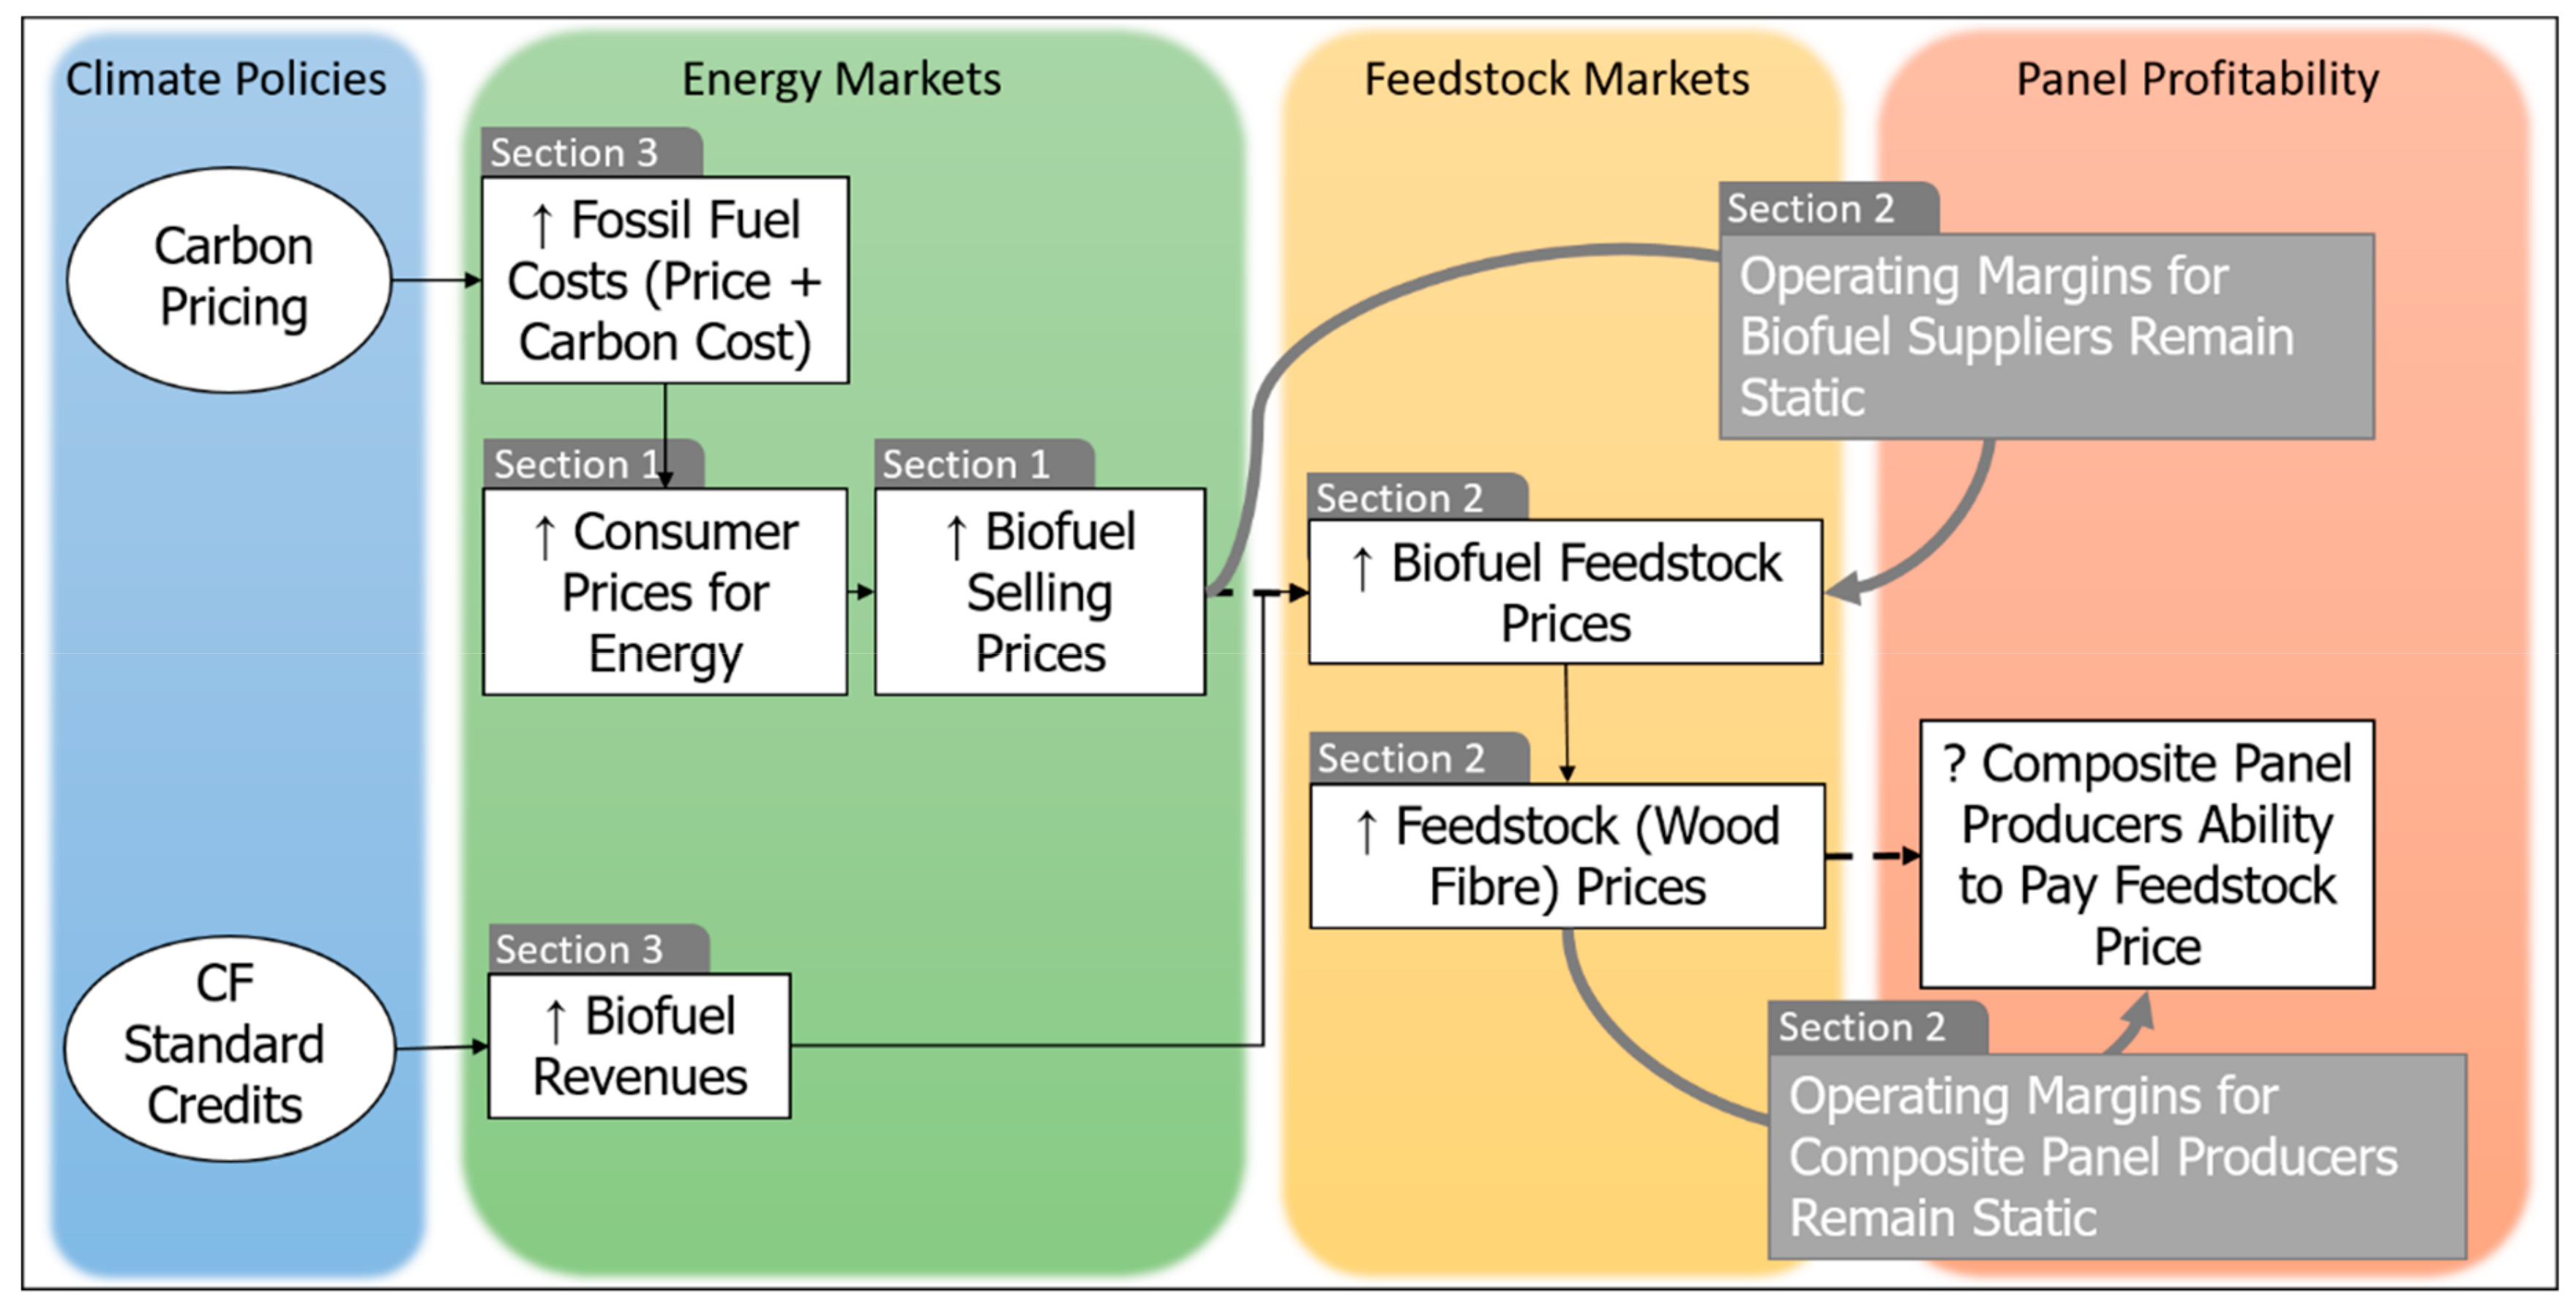
To evaluate the potential effect of carbon pricing and the CF Standard on composite panel mill feedstock prices, we modeled the impacts of both regulations on fuel consumers, pellet producers, and indirectly, on composite panel producers. The model assumes that fuel consumers will accept higher price-points for biomass energy as a heat source as fossil fuels become comparatively more expensive. Pellet producers and chip suppliers are thus theoretically able to pay higher prices for their feedstocks. The model assumes that the sawmills supplying the biomass feedstocks are profit maximizing, and will sell their by-products to the highest paying customer. Canadian composite panel mills may be unable to respond to feedstock price changes as their revenues depend on North American composite panel selling prices, subsequently impacting their access to sawmill residues. Figure 2 illustrates the key process and relationships within the model. External factors, including shifts in biomass supply, changes to fossil fuel prices, etc., may also influence changes in price-points and break-even costs, however, modeling and including these external factors was beyond the scope of this analysis, and we therefore assess the effects of carbon pricing and CF Standard credits ceteris paribus. Additionally, current demand elasticities specific to the Canadian situation for fossil fuels and bioenergy feedstock were unavailable. We examine four types of consumers (residential, commercial and institutional buildings, electric utilities and industrial), and assume that each will be selecting from a certain set of fuels for their heat energy needs (Table 1). Fossil fuel and electricity prices vary provincially, impacting regional pellet and chip supply and local panel mills. In addition to a national analysis, the model examines five specific Canadian provinces in which panel mills are located: British Columbia (BC), Alberta (AB), Ontario (ON), Québec (QC) and New Brunswick (NB).
Our spreadsheet-based model is augmented with @Risk, a Monte Carlo simulation software (@Risk v7.5, Palisade Co., Ithaca, NY, USA, 2016). Incorporating Monte Carlo simulations allows the model to address some of the uncertainty associated with key variables, specifically fossil fuel prices and estimated price-points for energy and biomass feedstocks. These variables are assigned unique distributions representative of price estimates available from the literature and available data. The model is iterated a thousand times and produces output distributions for each variable of interest; because the inputs are stochastic in nature, the output metrics also represent a level of stochasticity.
The approach devised to assess the theoretical prices consumers would pay for biomass begins with an estimate of the cost per GJ of heat across a select set options. The model assumes rational cost minimizing consumers that are indifferent between heating systems. These consumers would be willing to switch to a bioenergy system as long as the cost per GJ was comparable to the next least cost option, accounting for the additional capital costs that may be associated with a bioenergy system.
Based on the calculated prices consumers would be willing to pay for heat output, the model derives an approximate price that bioenergy suppliers (i.e., pellet producers or chip suppliers) would be able to pay for their feedstock. We equate the price-points at which consumers would be indifferent between a biomass heating system and a fossil fuel/electricity-based system to an approximate selling price for pellets or chips. From this selling price, the model calculates the price pellet producer/chip suppliers would be able to pay for their respective biomass feedstocks, accounting for profit margins, operating costs and transportation costs associated with the production of industrial and residential pellets. We assume that pellet producers and chip suppliers maintain margins similar to those obtained prior to the implementation of carbon pricing and the CF Standard.
With the assumption that the feedstock will be sold to the producer offering the highest price, we then compare the calculated prices bioenergy suppliers might pay against the feedstock prices Canadian composite panel producers pay given current and projected selling prices and operating costs. The ability of panel manufacturers to secure access to feedstock and outbid other users of sawmill residues such as pellet manufacturers is assessed as follows for the different applications:
  • High: Panel mills can only afford to pay less for feedstock than biofuel producers or users.
  • Medium: Panel mills and biofuel producers or users can afford to pay a similar price for feedstock.
  • Low: Panel mills can afford to pay more for feedstock than biofuel producers or users.
We assess the feedstock accessibility risk for the panel industry based on the relationship between the distribution of prices that pellet producer/chip suppliers would be willing to pay, and the distribution of prices that panel producers pay. In the event that the 75th percentile of the distribution of the price values for bioenergy suppliers is less than the 25th percentile of the distribution of prices for the panel producers, we assume that there is a relatively low risk to the panel producers; they are likely able to outbid bioenergy suppliers for the feedstock. We assume a mid-level of risk under three circumstances when the distributions overlap:
  • first, the 75th percentile of the bioenergy supplier distribution lies between the 25th and the 75th percentiles of the panel distribution and the 25th percentile of the bioenergy supplier is less than the 25th percentile of the panel distribution;
  • second, the 25th and 75th percentiles of the bioenergy supplier distribution are between the 25th and 75th percentiles of the panel distribution;
  • third, the 25th percentile of the bioenergy supplier distribution lies between the 25th and 75th percentiles of the panel distribution, and the 75th percentile of the bioenergy supplier is greater than the 75th percentile of the panel distribution.
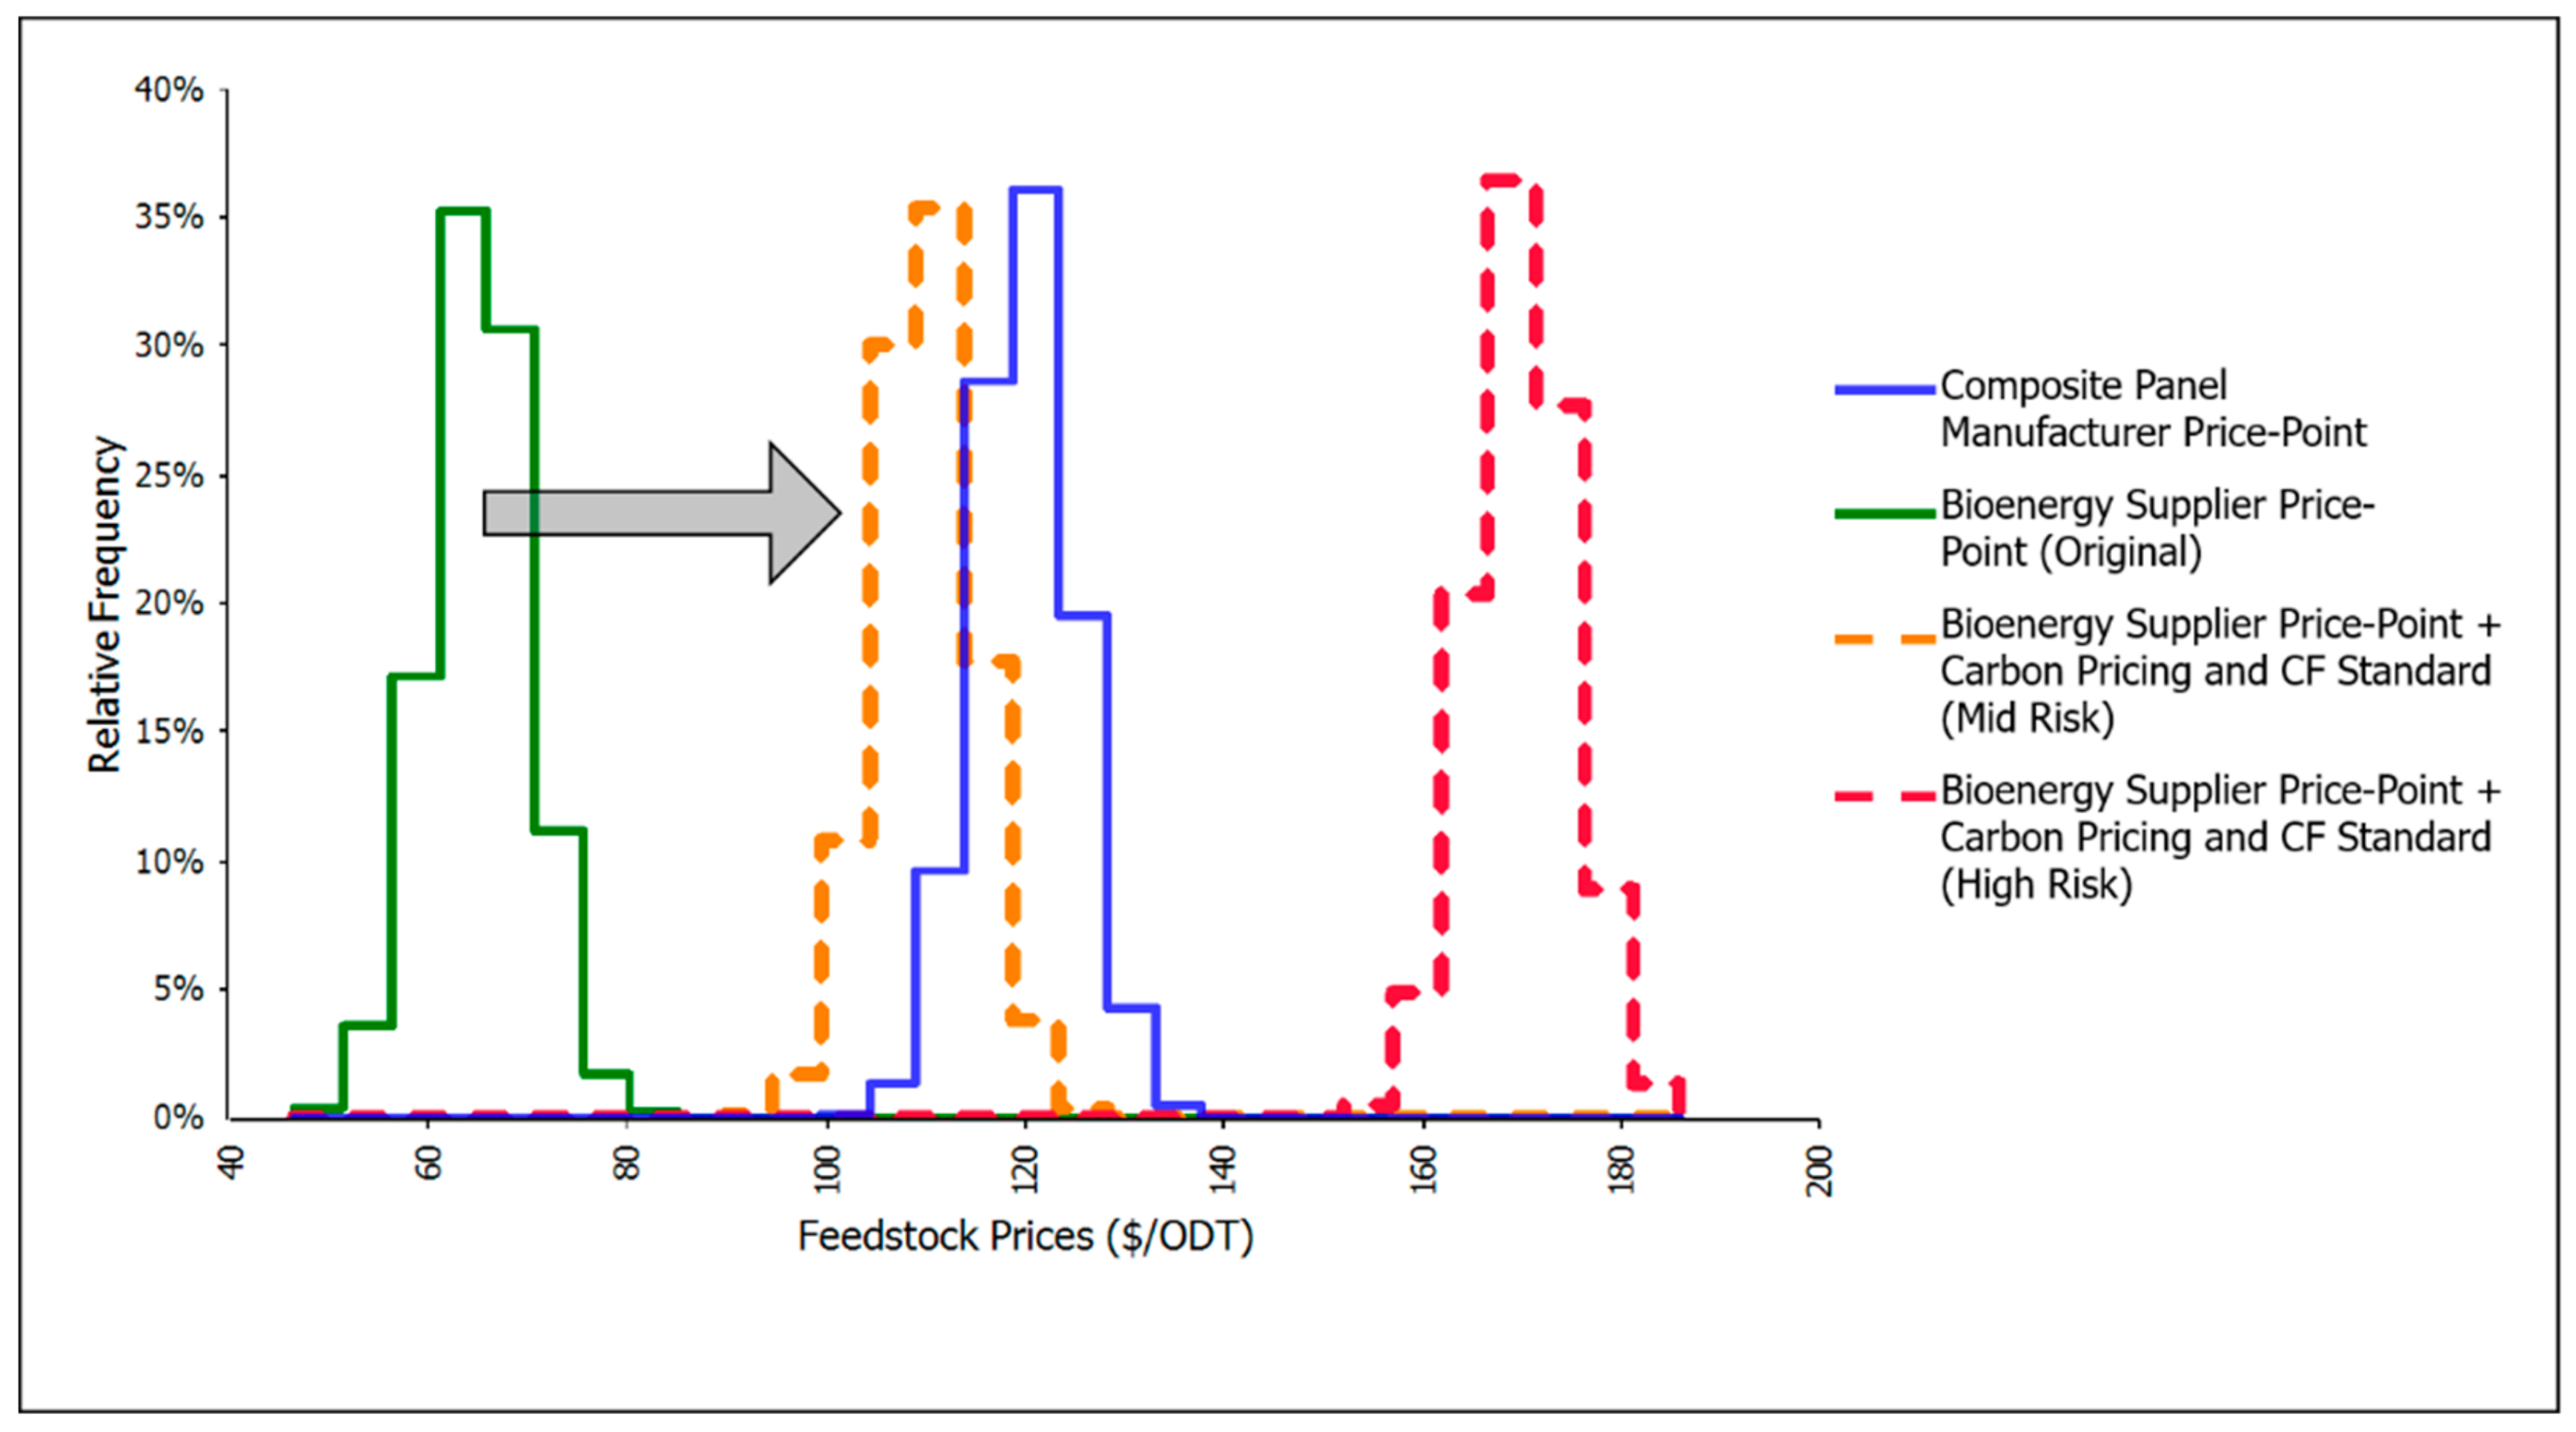
High risk is assumed when the 25th percentile of the bioenergy supplier distribution is greater than the 75th percentile of the panel distribution. Figure 3 illustrates an example of all three levels of risk, as the PCF policies allow pellet producers and chip suppliers to pay higher prices for their feedstock such that the composite panel industry’s ability to access the same feedstock at historic prices is challenged.
The CF Standard and carbon pricing initiatives put forward by the GoC aim to motivate behavior change by increasing the cost of fossil fuels over time. As such, we estimated the potential impacts of the policies under three different time periods; the short-term (2018), mid-term (2023) and long term (2030). Under each time period, the carbon price increases as a result of increased stringency in environmental regulations, and the CF Standard credit price increases to encourage the supply of low carbon fuels. Note, however, that future forecasts for fossil fuel prices are not directly captured here; we account for the potential change in fossil fuel prices within the uncertainty distributions assigned to each fuel variable.

2.2. Data

To estimate prices that consumer might pay for biomass as a heat source (identified as section 1 in Figure 2), the levelized cost of energy (LCOE) was calculated for each energy system using Equation (1) [32] and includes the capital cost, the fuel cost and other operation and maintenance cost. The LCOE was estimated for every application within each consumer group and within each region:
L C O E =   C R F * C a p C + F C * Q * E f f 1 + O M C * Q 1
where LCOE represents the levelized cost of energy ($/GJ), CRF is the capital recovery factor (1/yr), CapC is the capital cost ($), FC is the fuel cost in $/GJ, Q is the energy demand in GJ/yr, Eff is the conversion efficiency (%) and OMC represents operation and maintenance costs, excluding fuel ($/yr).
The capital cost per unit of heat generated is a function of the annual heat demand, the installed capacity and the time period over which the system is financed. The relationship between heat or power generation (Q * Eff-1) and installed capacity is a function of the capacity factor, which is equivalent to the fraction of time the system is used at full capacity over a year. The annuity associated with the capital cost was calculated using Equation (2) [32]:
C R F = i * 1 + i n * 1 + i n 1 1
where i is the annual interest rate (%) and n is the number of annuities.
Parameters used to calculate the capital cost per unit of heat generated are provided in Table 2. The number of annuities reflects the decision time frame of the investor for each application, while the assumed interest rate for the study period is 5%, based on recent interest rates posted by Canadian chartered banks for a 5-year conventional mortgage [33].
Values for fuel cost, energy efficiency and operating and maintenance costs are provided in Table 3. The range for natural gas prices are based on current (2019) utility rates in Canadian provinces (BC [34], AB [35], ON [36,37], QC [38,39], NB [40]), for both residential and commercial applications. Given the relatively stable projected natural gas prices at the National Inventory Transfer and Henry Hubs over the 2015–2030 period [41], real delivered natural gas prices are kept constant over the study timeline. Natural gas prices for electric utilities and industry are not publicly available but were assumed equal to the cost of natural gas supply at regional hubs, plus transmission costs. The range for fuel oil prices is based on historic prices (2010–2017) in the Canadian provinces examined [42]. Since crude oil price variations over 2010–2017 cover the projected crude oil prices over the study period [41], historic prices for fuel oil are assumed to reflect a reasonable range for the study period. Propane prices for residential applications were only available for parts of BC [43], ON [44] and NB [45]. The range for current propane prices across provinces is considered representative of prices for the study period, based on recent projections by the Conference Board of Canada [46] for domestic propane prices. The range for electricity prices is based on current (2019) utility rates in the Canadian provinces listed above, for both residential and commercial applications [47]. On average, electricity prices are assumed to follow inflation over the study period, based on the trend for 2011–2019 [47,48]. Electricity prices are regulated in Canadian provinces and increases in rates are subject to approval by utility boards. Prices for coal and pet coke are based on historical prices (2010–2017) for the United States [49], as no data specific to Canada is publicly available. Fuel costs for wood pellet and wood chip systems are variable in the model, as they are driven by the prices that of consumers are willing to pay for energy. Details on fuel costs by province used to conduct the regional analysis are found in the Supplementary Materials Table S1.
For residential, commercial and institutional applications, efficiency, operations and maintenance (O&M) costs and capital costs are based on technology forecasts for residential and commercial building technologies prepared for the U.S. Energy Information Administration [50]. Values are representative of typical equipment in 2017 and do not vary significantly over the study period. Wood pellet boilers and wood chip boilers are not covered in the cited technology forecasts, hence cost estimates are based on information provided by Canadian suppliers and project developers for recent projects. Efficiency values are available for residential wood pellet boilers [51]. For electric utilities and industrial facilities, only the incremental cost of conversion to biomass is considered, based on the conversion of the Ontario Power Generation Atikokan coal power plant [52]. Typical conversion efficiencies are used for electricity generation [53] and industrial facilities [54,55,56].
To derive the potential price-points for biomass feedstocks from panel manufacturers, wood pellet producers and chip suppliers (biomass feedstock consumers) (identified as section 2 in Figure 2), we estimate product selling prices, wood costs, variable and fixed costs, distribution costs and operating profit margins for each biomass feedstock consumer. The operating profit (OperP) for panel manufacturers, wood pellet producers and chip suppliers was calculated using Equation (3) and represents the difference between operating revenues and operating expenses:
O p e r P = S e l P   W o o d C + V a r C + F i x C + T r a C
where OperP represents operating profits, SelP is selling price, WoodC is wood cost, VarC is variable costs other than wood, FixC is fixed costs, TraC is transportation costs (where applicable). Values are in $/m3 for panel manufacturers, $/t for wood pellets and $/ODT (Oven Dried Tonne) for wood chips. For panel manufacturers, wood cost is equal to fiber price ($/ODT) multiplied by fiber use (ODT/m3). The ratio of operating profit to operating revenues (OperP/SelP) is the operating profit margin.
Values for operating revenues and expenses for bioenergy suppliers and composite panel producers are provided in Table 4. Selling prices and costs for particleboard and MDF are from Forest Economic Advisors (FEA) [57]. Selling price and wood cost for wood pellets and wood chips are derived within the model via the prices consumers are willing to pay for energy. Production and transportation costs for wood pellets reflect values found in the literature [58,59], with higher production costs assumed for residential applications that require higher quality pellets and additional packaging. Given the lack of publicly available data on distribution costs of wood pellets for residential use, the incremental cost compared to industrial pellets (for electricity generation) was derived from the price difference between both types of pellets in several regions [58]. For use in buildings, costs are associated with wood chip conditioning and storage at a regional supplier [60] and transportation to user, while chips are delivered directly from the sawmill to the industrial users (no variable, fixed or distribution costs). The operating profit margin was set at 15% for all producers, which is consistent with recent values for the wood product sector in Canada [61].

2.3. Climate Policy Impacts

Under the GoC’s carbon pricing and CF Standard policies, the price of fossil fuels will increase through time. As the model iterates over the time periods, fossil fuel prices for consumers increase, theoretically increasing prices for bioenergy, and subsequently increasing the prices bioenergy suppliers might be able to pay biomass feedstocks. This phase of the model is identified as section 3 within Figure 2. Fuel costs in Table 3 reflect prices prior to the application of carbon pricing. As described before, sale revenues for wood pellets and wood chips suppliers are expected to be complemented by credits generated through the production of low carbon fuels under the CF Standard. Carbon price and the value of CF Standard credits assumed over the study period are provided in Table 5. Fuel charges for fossil fuels under the federal carbon pricing system are set out in the Greenhouse Gas Pollution Pricing Act [62] until 2022 and reflect GHG combustion emissions for each fuel. CO2 emissions from the combustion of biomass is not subject to carbon pricing. Because the price of carbon in 2030 under the federal system has not been set, the estimate is based on projections for the Western Climate Initiative (California–Québec carbon market) allowance price [63].
The CF Standard is planned to come into force in 2022 for the liquid stream and in 2023 for the solid and gaseous stream. Credit prices will be set through a credit market system and will depend on multiple factors including the carbon intensity reduction requirements and low carbon fuel supply to the Canadian market. Compliance pathways (e.g., upstream GHG reductions, accumulation of early action credits) and market stability mechanisms (e.g., payment into an emissions reduction fund, market-clearing mechanisms) are expected to provide flexibility to fossil fuel suppliers. Hence, CF Standard credit prices are set at the same level as carbon pricing, which is lower than recent market pricing for North American low carbon fuel standards. Under the CF Standard, the amount of credits generated by low carbon fuel producers depend on the difference in carbon intensity (kgCO2e/GJ) between the reference (i.e., substituted) fossil fuel and the low carbon fuel. Carbon intensities for fossil fuels and low carbon fuels are provided in Table 6.
For fossil fuels, preliminary values for the CF Standard [64] were available for light fuel oil and propane. For other fossil fuels, upstream emissions from GHGenius [56] were combined with combustion emissions in GHG reporting regulations [65]. The carbon intensity of wood pellets are highly dependent on the fuel used to dry the feedstock (natural gas or biomass) and transportation to user (mode and distance). The values used in this study reflects the range found in the literature [66,67,68]. We assume the carbon intensity of wood chips to be identical to wood pellets but excludes the pelletization process. In addition to the calculation of carbon intensity for biomass, the carbon or climate neutrality of forest biomass has been the subject of much debate over the last decade [69,70,71] and multiple approaches were proposed to take into account biogenic CO2e emissions and removals when quantifying GHG reductions from harvested wood products, including biofuels [72]. However, biogenic CO2 emissions and removals will not be included in the calculation of carbon intensities under the CF Standard and GHG reductions from the substitution of fossil fuels with solid biofuels calculated accordingly in this study.
2.4. Sensitivity Analysis

In addition to the Monte Carlo analysis built into the model, we explored the effects of changes to two key assumptions. The first sensitivity analysis assumes that end consumers are incentivized to adopt bioenergy via financial assistance, which may be available under federal, provincial or territorial programs to promote the use of bioenergy. This support is modeled as a 50% reduction in the additional capital costs associated with bioenergy. The second analysis examines the effects of a 25% decline in panel producers’ ability to pay for feedstock by decreasing the price they pay. Although the data used to derive the price distributions for the panel producer within the base case is robust, it may not reflect the full range of feedstock prices paid by Canadian panel producers.

3. Results

3.1. Base Case

Base case results examine carbon pricing policy alone and in conjunction with CF Standard credits across three time periods, multiple consumers types and regions. Detailed results are described below, with national and regional results illustrated in Table 7. In cases where the risk level is the same without CF Standard credits (carbon pricing only) and with the addition of CF credits to carbon pricing, only one risk level is provided in Table 7, Table 8 and Table 9. In addition to the simulations with and without CF Standard credits, two fuel scenarios for residential and commercial/institutional consumers are examined: a ‘natural gas’ (N.G.) scenario in which all applicable energy sources are included, and a ‘no natural gas’ (no N.G.) scenario, in which natural gas is excluded. The purpose of this breakdown is to capture potential differences in fuel switching for consumers that do not have access to natural gas infrastructure.
In the short term, the results of the base case analysis with carbon pricing alone suggest that panel producers are likely to be able to maintain access to their feedstocks. Across the country, most consumers will continue to use fossil fuels; at this stage, the carbon price has not yet increased fossil fuel prices sufficiently to incent consumers to fuel switch. Although some fossil fuels (e.g., light fuel oil) are expensive in comparison to bioenergy, rational consumers are likely to switch towards electricity as the cheaper energy source, rather than biomass. However, in provinces with higher electricity prices, such as Ontario and Alberta, commercial/institutional consumers without access to natural gas are more likely to transition to wood chips at prices that generate a mid-level of risk for composite panel producers. For all other consumer groups in the short term, the cost of biomass and the additional cost associated with the capital expenditure is too large (when compared to other available fossil fuel or electricity options) to incent bioenergy adoption.
Results for the mid-term period are similar to the short term for the residential, electric utilities and industrial consumer groups. For commercial/institutional consumers however, the additional fees associated with fossil fuels as a result of carbon pricing are now large enough to incent more consumers without natural gas to switch to bioenergy systems at a national scale, creating a mid-level risk for panel producers. As in the short-term, high electricity prices in Alberta, Ontario and now New Brunswick encourage consumers to transition to biomass, generating high-level risk for composite panel producers located in Alberta and Ontario, and a mid-level risk for those located in New Brunswick.
Carbon pricing has more of an effect on fossil fuel consumption in the long term. Nationally, the risk across residential, electricity generating and industrial consumer groups remains low and the risk posed by commercial/institutional consumers without natural gas remains at a mid-level. As in the mid-term, higher electricity prices in Alberta, Ontario and New Brunswick encourage consumers to increase their price-points for bioenergy, thereby increasing the bioenergy feedstock supplier’s own price-points for feedstock, challenging the panel industry’s ability to access feedstock at existing prices.
Although CF Standard credits were available in the mid-term, the potential revenue generated was insufficient to incent behavior change for any consumers. In the long term however, CF Standard credits may encourage industrial consumers to switch towards bioenergy. Carbon pricing and the additional incentive provided by the CF Standard credits serve to make bioenergy an attractive option for industrial consumers. Increased fossil fuel prices and low additional capital expenditure costs associated with adopting bioenergy ensure that consumers are willing to pay higher values for biomass such that the national and provincial level of risk for panel producers is likely to be high. An exception exists in British Columbia however, where natural gas prices are lower and consumers are willing to pay higher prices for bioenergy, generating a mid-level risk for panel producers.
The likelihood that the GoC’s carbon pricing policy alone will divert available feedstock resources away from composite panel producers is low for most consumers, although there is some risk posed from commercial/institutional consumers as the effects of the carbon pricing policy increase through time. When the carbon pricing policy is considered in conjunction with CF Standard credits, the outlook changes. This additional incentive is likely to generate higher risk in the long term as industrial consumers start to find bioenergy a more attractive solution to their heating needs, on top of the mid-level risk posed by commercial/institutional consumers.

3.2. Sensitivity Analysis Results

Presented in Table 8, the implications of a 50% reduction in the capital expenditures associated with biomass under the GoC’s carbon pricing policy are somewhat similar to the base case. We assume that it is unlikely for CF Standard credits and biomass subsidies to be widely offered at the same time, and therefore exclude the possibility of credit generation from this scenario. Results suggest that the national level, a 50% reduction in the capital costs of a bioenergy system would be sufficient in the short term to generate mid-level risk for the composite panel industry from commercial/institutional consumers without access to natural gas. This average national level risk is driven by high risk in Alberta, Ontario and New Brunswick, as consumers are willing to pay more for bioenergy, based on decreased additional capital expenses and higher electricity costs.
In the mid-term, the national level of risk remains the same, although provincially, commercial/institutional consumers in British Columbia become more interested in switching away from electricity to biomass. The national risk level increases to high in the long-term as commercial/institutional consumers respond to higher carbon prices and increased interest in adopting bioenergy across all provinces. For all other consumer groups, a decrease in the additional bioenergy capital costs required is not enough to encourage a switch to bioenergy.
The second analysis examines the sensitivity of the model to a 25% reduction in the price that panel producers are able to pay for their feedstocks under the carbon pricing policy. The results of this scenario are shown in Table 9. No changes from the base case results are observed at the national level, for any period, although differences are visible at the provincial level. In Alberta, commercial/institutional consumers in the short-term that operate without natural gas are willing to pay a price for chips which challenges the reduced price that composite panel producers are able to pay, generating high-level risk. Commercial/institutional consumers in Ontario and New Brunswick are also willing to pay a price for bioenergy which challenges the panel producers reduced ability to pay for feedstock, creating a mid-level risk. Over the mid- and long-term periods, the results are identical to the base case for all provinces, as the reduced panel price-points for feedstocks is combined with increased carbon pricing and CF Standard credits.
The sensitivity analysis results support the main conclusion from the base case; minimal risk to composite panel producers is expected in the near term, but levels of risk increase through time as the additional costs imposed by carbon pricing increase the prices consumers are willing to pay for bioenergy, and the composite panel industry’s ability to pay for feedstock decreases. The sensitivity analysis results indicate that commercial/institutional consumers pose the largest risk to the panel industry’s ability to access feedstocks, although the industrial sector may also generate some competition for feedstock in the long-term.

4. Discussion

Carbon pricing alone will have a limited impact on the Canadian panel industry’s ability to access feedstocks in the short-term. In the mid- and long-term periods, the combined effect of carbon pricing and the CF Standard may increase the demand for what biomass and bioenergy suppliers could be willing to pay more for bioenergy feedstocks, especially for applications in the commercial/institutional sector and industry. This may have a negative impact on the panel industry’s capacity to secure feedstock. The concerns expressed by panel manufacturers regarding the future price of feedstock appear to be warranted in some cases, although it is important to note that the model assumes no changes to external factors. As such, changes in the supply and price of biomass and other fossil fuels external to the GoC’s policies are ignored, as are changes in the availability of biomass from other sectors [73], and external shifts in consumer demand, all of which may have an impact on the ability of panel producers to access feedstock, but are beyond the scope of this analysis.

4.1. Consumer Considerations

From the consumer perspective, the high incremental costs of biomass combustion equipment combined with access to cheap natural gas in most regions hinders the adoption of bioenergy. Bioenergy becomes increasingly cost-competitive in the mid- and long-term for consumers that currently rely on heating oil or propane when CF Standard credits are provided to biofuel producers. However, the availability of cold-climate heat pumps makes electrification an even more interesting option, thereby reducing the potential demand for biomass feedstocks. Bioheat remains a more economical option for commercial and institutional applications in provinces with high electricity costs. As the Proposed Regulatory Approach for the CF Standard focuses [64] on the liquid fuel stream, it is not yet clear how the substitution of liquid or gaseous fossil fuels with solid biofuels will be recognized. The results indicate that the provision or not of credits to chip suppliers will greatly influence their use for heat generation in buildings. Barriers other than costs exist for the adoption of biomass systems in buildings, such as the need for fuel storage and handling, equipment maintenance, disposal and access to capital to cover the initial investment.
Excluding coal for electricity generation from the proposed CF Standard generally makes co-firing of wood pellets at coal power plants or full conversion to biomass less attractive. The closure of coal power plants at the end of their useful life or their conversion to natural gas in response to the Reduction of Carbon Dioxide Emissions from Coal-fired Generation of Electricity. Regulations will also reduce co-firing opportunities in the future. Nevertheless, under certain circumstances, provincial electric utilities might still decide to go forward with such conversions projects, following the trend seen in some European or Asian countries. For example, electricity generation from biomass is supported by the United Kingdom government through Renewable Obligation Certificates (ROCs) and Contracts for Difference (CfDs), while the feed-in-tariff (FIT) scheme in Japan spurred coal co-firing and dedicated biomass generation. Since 2014, Ontario Power Generation has been operating a biomass power plant in Atikokan converted from coal [67]. Composite panel mills in eastern Canada indicate that pellet producers exporting to the United Kingdom to meet an increasing demand for power generation have contributed to an increase in feedstock price. However, it is also worth noting that power generation from biomass also competes with other renewables (e.g., hydro, wind, solar PV), which also become increasingly attractive compared to fossil-fueled power generation as carbon price rises. Such technologies already have a LCOE similar or lower than fossil fuel power plants [74], with recent cost reduction trends expected to continue in the short-term [75], reducing the potential risk of feedstock diversion for electricity generation.
For industries, conditions for a broader adoption of chips or other types of residual biomass are more favorable if eligible for CF Standard credit generation, especially in the long-term. Since fossil fuels used as a process inputs (e.g., metallurgical coke for primary steelmaking) are exempt from the CF Standard, increased demand would not come from all sectors. Limitations for process heat also exist in other sectors such as cement because of requirements regarding the heat content of fuels needed to achieve high temperatures. Nevertheless, given the high reliance of heavy industries on fossil fuels, even low ratios of fuel switching represent large quantities of biomass. This is illustrated at Table 10 by comparing by province the amount of wood fiber required for composite panel mills to operate at full capacity [23] and the potential biomass required to meet energy demand for mid and high risk applications in the long-term: industrial sector [28] (natural gas and coal) in all provinces as well as in the commercial and institutional sector [76] (fuel oil and propane) for comparison purposes (considering a high heating value of 19 GJ/ODT for solid biofuels).
For all provinces, except in the Atlantic, the potential demand from industrial fuel switching to solid biofuels is far greater than the demand for either composite panel manufacturing or fuel switching at commercial and institutional buildings. Given that energy use is concentrated in fewer facilities for industrial applications, it could also be expected that demand for chips or other types of residual biomass would increase faster in that sector if it becomes cost-competitive when compared with the commercial and institutional sector.

4.2. Other Market Considerations

The goal of the PCF and the underlying programs and regulations is to reduce GHG emission in order for Canada to meet its 2030 Paris Agreement target of 30% below 2005 levels by 2030. Several studies have demonstrated the potential of forests and the forest sector to contribute to climate change mitigation and adaptation [19,77]. Increasing the use of wood for building and construction in the form of both traditional (e.g., lumber, structural panels) and engineered wood products can act as a significant carbon sink for long-term storage [78], while bioenergy also has a role in many studies that demonstrate how the Paris Agreement’s emissions targets can be achieved [19,79]. Our model demonstrates that carbon pricing and the CF Standard could change feedstock availability for long-lived wood products, specifically composite panels, while supporting increased uptake of bioenergy. Assuming equal substitution benefits, it is preferable from a climate perspective to store carbon for a longer period of time in buildings as composite panels and value-added wood products rather than to release it rapidly to the atmosphere through combustion. Hence, there is a risk of increased carbon emissions if industries that produce long-lived wood products are outcompeted for feedstock by bioenergy producers.
On the other hand, synergies can also exist between wood products and biofuels, as increased revenues from residues used for energy applications increases the competitiveness of sawmills, especially in a context where chip demand for some paper products is declining [80]. The production cost of emission-intensive materials such as cement, iron and plastic resins is also expected to increase as carbon price rise [81], making wood product alternatives more competitive for structural or non-structural applications. This could in turn have positive impacts on the composite panel sector, whether direct (e.g., substitution of plastic for cabinetry or siding) on indirect (e.g., higher availability of sawmill residues because of increased use of wood in construction). However, these benefits will probably be limited in the foreseeable future given the fact that emission-intensive and trade-exposed (EITE) industries are only subject to carbon pricing for a small portion of their total GHG emissions under the federal output-based pricing systems (OPBS) and because of the competition from foreign material producers subject to either low or no carbon pricing (e.g., United States, China). These potential consequences of carbon pricing and the CF Standard are important to highlight for Canada, a country rich in natural resources and a large forest sector coupled with its sustainable forest management practices. It will be important to design policies and regulations that optimize the use of both long-lived wood products and bioenergy to maximize overall carbon emission reductions.
Additional variables that impact fiber supply include natural disturbances such as pests and forests fires, but also market drivers, including U.S housing starts, which directly influence Canadian lumber production and the volume of residues produced. The US–Canadian dollar exchange rate also has a major influence on the revenues for forest product manufacturers. A potential mitigation strategy to reduce the impact of increased competition for fiber and bioenergy feedstocks would be to leverage new feedstock sources. This is especially important as the growing bio-economy generates an increasing demand for bioproducts and biomaterials beyond biofuels in the future. Additionally, structural changes in the pulp and paper market could make more residues available for other uses as demand decreases for paper and newsprint, but remains strong for pulp and packaging. Some pellet producers in British Columbia have noted difficulty in securing reliable fiber sources as fires, pests and changing harvest limits in the province are impacting fiber flows, forcing pellet producers to find new sources of fiber, including increased use of non-sawmill residues and forest residuals [8,9,10,82].

4.3. Model Considerations and Future Research

The model developed here is not a standard economic equilibrium model, and does not account for the effects of price elasticities on the consumer groups identified (heat consumers and biomass consumers). If an equilibrium model including price elasticities were to be developed, we would anticipate that the heat consumer demand for fossil fuels and electricity to be relatively inelastic in the short run, especially for those consumers using natural gas and electricity as a heating source [83,84,85]. As such, an increase in fossil fuel prices as a result of carbon pricing and the CF Standard would likely have a very small impact on heat consumer demand for bioenergy, resulting in a low risk rating for the composite panel industry. An economic equilibrium model developed to address the effects of climate policies would most likely produce a similar result as the model developed here: the risk to the Canadian composite panel industry is likely to be low overall as a result of the increases in fuel prices, with a higher risk from industrial energy applications. For the purposes of this model, we have assumed that both bioenergy producers and the panel industry solely use sawmill residues and chips, and would therefore have a very inelastic demand for their feedstock. Other bioenergy feedstocks do exist however, (harvest residues, agricultural feedstocks, purpose grown biomass, etc.) possibly making the demand from bioenergy producers for sawmill residues more elastic [73], reducing the feedstock accessibility risk for the composite panel industry.
Further competition for forest feedstocks is possible when second generation biofuels are considered [86,87]. Given that the GoC is developing a Clean Fuel Standard for liquid, gaseous and solid fuels, potential competition between biofuels and traditional forest products is a consideration as previous models have demonstrated negative impacts on the composite panel industry [86,87]. Other models have included or considered additional factors to determine the best policy, such as trade balance and budgetary costs [17] and changes in the make-up of electricity capacity [18]. Although it is important to note that the best policies depend on the ultimate goal of the policy, e.g., short or long-term contribution to climate change mitigation from the land sector vs. increased wood use for bioenergy [17,18]
The analysis presented here evaluates the effects of the GoC’s carbon pricing policy and CF Standard credits on the Canadian composite panel industry. Although the analysis examines the indirect impacts of the climate policies on the panel industry ceteris paribus, this approach allows for a concise analysis of the possible implications of an increase in consumer demand for bioenergy. Without careful consideration of the potential externalities associated with such policies, wood-product industries that rely on the same biomass feedstocks that supply the bioenergy industry may be faced with feedstock supply uncertainty as the effects of these policies increase over time.

Supplementary Materials

The following are available online at https://www.mdpi.com/2071-1050/12/5/1787/s1, Table S1: Provincial fuel costs.

Author Contributions

Conceptualization, B.G. and E.H.; methodology, B.G. and E.H.; validation, B.G.; formal analysis, B.G. and E.H.; data curation, B.G., V.A.; writing—original draft preparation, B.G., V.A. and E.H.; writing—review and editing, B.G., V.A., and E.H. All authors have read and agreed to the published version of the manuscript.

Funding

This research received no external funding.

Acknowledgments

The authors acknowledge the support provided by Donald Bisson of the Composite Panel Association, Daniel McKenney and Anne-Hélène-Mathey, both of Natural Resources Canada for their valuable comments on an early draft of this manuscript, and Meghan Sloane, also of Natural Resources Canada, for her assistance in gathering literature materials.

Conflicts of Interest

The authors declare no conflict of interest.

References

  1. Environment and Climate Change Canada. Pan-Canadian Framework on Clean Growth and Climate Change. Available online: https://www.canada.ca/en/services/environment/weather/climatechange/pan-canadian-framework.html (accessed on 28 November 2019).
  2. Environment and Climate Change Canada. Clean Fuel Standard. Available online: https://www.canada.ca/en/environment-climate-change/services/managing-pollution/energy-production/fuel-regulations/clean-fuel-standard.html (accessed on 26 November 2019).
  3. Delacote, P.; Lecocq, F. Fuelwood, Timber and Climate Change: Insights from Forest Sector modeling–An Introduction. J. For. Econ. 2011, 17, 107–109. [Google Scholar] [CrossRef]
  4. Ghafghazi, S.; Lochhead, K.; Mathey, A.; Forsell, N.; Leduc, S.; Mabee, W.; Bull, G. Estimating Mill Residue Surplus in Canada: A Spatial Forest Fiber Cascade Modeling Approach. For. Prod. J. 2017, 67, 205–218. [Google Scholar] [CrossRef]
  5. Mansuy, N.; Thiffault, E.; Lemieux, S.; Manka, F.; Paré, D.; Lebel, L. Sustainable Biomass Supply Chains from Salvage Logging of Fire-Killed Stands: A Case Study for Wood Pellet Production in Eastern Canada. Appl. Energy 2015, 154, 62–73. [Google Scholar] [CrossRef]
  6. Yemshanov, D.; McKenney, D.W.; Fraleigh, S.; McConkey, B.; Huffman, T.; Smith, S. Cost Estimates of Post Harvest Forest Biomass Supply for Canada. Biomass Bioenergy 2014, 69, 80–94. [Google Scholar] [CrossRef]
  7. Barrette, J.; Paré, D.; Manka, F.; Guindon, L.; Bernier, P.; Titus, B. Forecasting the Spatial Distribution of Logging Residues Across the Canadian Managed Forest. Can. J. For. Res. 2018, 48, 1470–1481. [Google Scholar] [CrossRef]
  8. Church, M. Cleaner Fibre: Pacific BioEnergy Reduces Machine Wear with ClassiCleaner. Available online: https://www.canadianbiomassmagazine.ca/cleaner-fibre-6841/ (accessed on 20 December 2019).
  9. Pinnacle Renewable Energy. Q3 2019 a ‘challenging Period’ for Pinnacle due to BC Sawmill Curtailments. Available online: https://www.canadianbiomassmagazine.ca/q3-2019-a-challenging-period-for-pinnacle-due-to-bc-sawmill-curtailments/ (accessed on 20 December 2019).
  10. Cools, E. Pinnacle’s Houston Plant using More Harvest Residuals. Available online: https://www.canadianbiomassmagazine.ca/pinnacles-houston-plant-using-more-harvest-residuals/ (accessed on 20 December 2019).
  11. Ince, P.J.; Kramp, A.D.; Skog, K.E.; Yoo, D.; Sample, V.A. Modeling Future U.S. Forest Sector Market and Trade Impacts of Expansion in Wood Energy Consumption. J. For. Econ. 2011, 17, 142–156. [Google Scholar] [CrossRef]
  12. Johnston, C.; van Kooten, G.C. Economic Consequences of Increased Bioenergy Demand. For. Chron. 2014, 90, 636–642. [Google Scholar] [CrossRef] [Green Version]
  13. Peter, B.; Niquidet, K. Estimates of Residual Fibre Supply and the Impacts of New Bioenergy Capacity from a Forest Sector Transportation Model of the Canadian Prairie Provinces. For. Policy Econ. 2016, 69, 62–72. [Google Scholar] [CrossRef]
  14. Trømborg, E.; Solberg, B. Forest Sector Impacts of the Increased use of Wood in Energy Production in Norway. For. Policy Econ. 2010, 12, 39–47. [Google Scholar] [CrossRef]
  15. Folsland Bolkesjø, T.; Trømborg, E.; Solberg, B. Bioenergy from the Forest Sector: Economic Potential and Interactions with Timber and Forest Products Markets in Norway. Scand. J. For. Res. 2006, 21, 175–185. [Google Scholar] [CrossRef]
  16. Moiseyev, A.; Solberg, B.; Kallio, A.M.I. The Impact of Subsidies and Carbon Pricing on the Wood Biomass use for Energy in the EU. Energy 2014, 76, 161–167. [Google Scholar] [CrossRef]
  17. Caurla, S.; Delacote, P.; Lecocq, F.; Barkaoui, A. Energy Policy. Energy Policy 2013, 63, 338–347. [Google Scholar] [CrossRef]
  18. Caurla, S. Heat Or Power. Energy Econ. 2018, 75, 85–103. [Google Scholar] [CrossRef]
  19. Smyth, C.E.; Stinson, G.; Neilson, E.; Lemprière, T.C.; Hafer, M.; Rampley, G.J.; Kurz, W.A. Quantifying the Biophysical Climate Change Mitigation Potential of Canada’s Forest Sector. Biogeosciences 2014, 11, 3515–3529. [Google Scholar] [CrossRef] [Green Version]
  20. Smyth, C.; Rampley, G.; Lemprière, T.C.; Schwab, O.; Kurz, W.A. Estimating Product and Energy Substitution Benefits in National-scale Mitigation Analyses for Canada. GCB Bioenergy 2017, 9, 1071–1084. [Google Scholar] [CrossRef] [Green Version]
  21. Birdsey, R.; Duffy, P.; Smyth, C.; Kurz, W.A.; Dugan, A.J.; Houghton, R. Climate, Economic, and Environmental Impacts of Producing Wood for Bioenergy. Environmental Research Letters 2018, 13, 50201. [Google Scholar] [CrossRef] [Green Version]
  22. Stennes, B.; Niquidet, K.; van Kooten, G.C. Implications of Expanding Bioenergy Production from Wood in British Columbia: An Application of a Regional Wood Fibre Allocation Model. For. Sci. 2010, 56, 366–378. [Google Scholar]
  23. Composite Panel Association. 2018 Canadian Capacity Report; Composite Panel Association: Leesburg, VA, USA, 2018. [Google Scholar]
  24. Statistics Canada (via the Gobal Trade Atlas). Merchandise Trade Data. Available online: https://connect.ihs.com/home (accessed on 12 December 2019).
  25. Natural Resources Canada. Bioenergy in Canada. Available online: https://cfs.nrcan.gc.ca/pubwarehouse/pdfs/39140.pdf (accessed on 26 November 2019).
  26. Natural Resources Canada. Energy and Greenhouse Gas Emissions (GHGs)—Canada’s Energy Consumption. Available online: https://www.nrcan.gc.ca/science-data/data-analysis/energy-data-analysis/energy-facts/energy-and-greenhouse-gas-emissions-ghgs/20063#L5 (accessed on 26 November 2019).
  27. Natural Resources Canada. Renewable Energy Facts—Biomass. Available online: https://www.nrcan.gc.ca/science-data/data-analysis/energy-data-analysis/energy-facts/renewable-energy-facts/20069#L5 (accessed on 26 November 2019).
  28. Natural Resources Canada. Comprehensive Energy use Database—Industrial Sector—Canada. Available online: http://oee.nrcan.gc.ca/corporate/statistics/neud/dpa/menus/trends/comprehensive/trends_agg_ca.cfm (accessed on 26 November 2019).
  29. Natural Resources Canada. State of Canada’s Forests Report - Indicator: Forest Industry Carbon Emissions. Available online: https://www.nrcan.gc.ca/our-natural-resources/forests-forestry/state-canadas-forests-report/how-forest-industry-changing/indicator-forest-industry-carbon-emissions/16590 (accessed on 26 November 2019).
  30. Natural Resources Canada. Comprehensive Energy use Database—Residential Sector—Canada. Available online: http://oee.nrcan.gc.ca/corporate/statistics/neud/dpa/menus/trends/comprehensive/trends_res_ca.cfm (accessed on 26 November 2019).
  31. Canadian Forest Service. 2018 Bioenergy Survey; Natural Resources Canada: Ottawa, ON, Canada, 2018. [Google Scholar]
  32. Short, W.; Packey, D.J.; Holt, T. A Manual for the Economic Evaluation of Energy Efficiency and Renewable Energy Technologies; National Renewable Energy Laboratory: Golden, CO, USA, 1995. [Google Scholar]
  33. Bank of Canada. Interest Rates Posted for Selected Products by the Major Chartered Banks. Available online: https://www.bankofcanada.ca/rates/banking-and-financial-statistics/posted-interest-rates-offered-by-chartered-banks/ (accessed on 4 February 2020).
  34. Fortis, B.C. Natural Gas Rates. Available online: https://www.fortisbc.com/accounts-billing/billing-rates/natural-gas-rates (accessed on 27 November 2019).
  35. ATCO. Current Rates—For Home. Available online: https://www.atco.com/en-ca/for-home/natural-gas/rates-billing/current-rates.html (accessed on 27 November 2019).
  36. Enbridge Gas. Current Business Rates—Rate M2—Union South. Available online: https://www.uniongas.com/business/account-services/myaccount/rates/rate-m2 (accessed on 27 November 2019).
  37. Enbridge Gas. Current Residential Rates—Rate M1—Union South. Available online: https://www.uniongas.com/residential/rates/current-rates/rate-m1 (accessed on 27 November 2019).
  38. Énergir. Affaires—Tarification. Available online: https://www.energir.com/fr/affaires/prix/tarification/ (accessed on 27 November 2019).
  39. Énergir. Résidentiel—Tarification. Available online: https://www.energir.com/fr/residentiel/espace-client/facturation-et-tarification/tarification/ (accessed on 27 November 2019).
  40. Liberty Utilities. Current Natural Gas Distribution Rates and Charges. Available online: https://staging.naturalgasnb.com/en/for-home/accounts-billing/customer-rate-classes/#current-natural-gas-distribution-rates-charges (accessed on 28 November 2019).
  41. Canada Energy Regulator. Canada’s Energy Future 2019: Energy Supply and Demand Projections to 2040—Crude Oil and Natural Gas Markets and Infrastructure. Available online: https://www.cer-rec.gc.ca/nrg/ntgrtd/ftr/2019/ssmptns/index-eng.html (accessed on 15 December 2019).
  42. Natural Resources Canada. Furnace Oil Prices. Available online: https://www.nrcan.gc.ca/energy/fuel-prices/4799 (accessed on 28 November 2019).
  43. Fortis, B.C. Residential Natural Gas Rates—Revelstoke (for Propane Customers). Available online: https://www.fortisbc.com/accounts-billing/billing-rates/natural-gas-rates/residential-rates#revelstoke (accessed on 28 November 2019).
  44. EDPRO. Residential Propane Pricing (Zone 4). Available online: http://www.edproenergy.com/customers/index.php?mod=zone4 (accessed on 28 November 2019).
  45. New Brunswick Energy and Utilities Board. Past Petroleum Prices. Available online: http://www.nbeub.ca/past-petroleum-prices (accessed on 29 November 2019).
  46. Conference Board of Canada. Fuelled Up. an Updated Overview and Outlook of Canada’s Propane Market and Industry. Available online: https://www.conferenceboard.ca/e-Library/document.aspx?did=10001 (accessed on 29 November 2019).
  47. Hydro-Québec. 2019—Comparaison Des Prix De L’Électricité Dans Les Grandes Villes Nord-Américaines. Available online: http://www.hydroquebec.com/data/documents-donnees/pdf/comparaison-prix-electricite.pdf (accessed on 2 December 2019).
  48. Hydro-Québec. 2011—Comparaison Des Prix De L’Électricité Dans Les Grandes Villes Nord-Américaines. Available online: http://www.hydroquebec.com/data/documents-donnees/pdf/comparaison-prix-electricite-2011.pdf (accessed on 2 December 2019).
  49. US Energy Information Agency. Electricity Data Browser—Average Cost of Fossil Fuels for Electricity Generation (Per Btu) for all Sectors. Available online: https://www.eia.gov/electricity/data/browser/#/topic/15?agg=2,0,1&fuel=8006&geo=g&sec=g&freq=A&start=2010&end=2017&ctype=linechart&ltype=pin&rtype=s&maptype=0&rse=0&pin= (accessed on 28 November 2019).
  50. Navigant Consulting. Technology Forecast Updates Residential and Commercial Building Technologies. Available online: https://www.eia.gov/analysis/studies/buildings/equipcosts/pdf/full.pdf (accessed on 28 November 2019).
  51. US Environmental Protection Agency. EPA-Certified Wood Stove Database. Available online: https://cfpub.epa.gov/oarweb/woodstove/index.cfm?fuseaction=app.about (accessed on 2 December 2019).
  52. McKechnie, J.; Saville, B.; MacLean, H.L. Steam-Treated Wood Pellets: Environmental and Financial Implications Relative to Fossil Fuels and Conventional Pellets for Electricity Generation. Appl. Energy 2016, 180, 637–649. [Google Scholar] [CrossRef]
  53. Zhang, Y.; McKechnie, J.; Cormier, D.; Lyng, R.; Mabee, W.; Ogino, A.; MacLean, H.L. Life Cycle Emissions and Cost of Producing Electricity from Coal, Natural Gas, and Wood Pellets in Ontario, Canada. Environ. Sci. Technol. 2010, 44, 538–544. [Google Scholar] [CrossRef]
  54. US Department of Energy. Improve Your Boiler’s Combustion Efficiency. Available online: https://www.energy.gov/sites/prod/files/2014/05/f16/steam4_boiler_efficiency.pdf (accessed on 3 December 2019).
  55. IEA ETSAP. Industrial Combustion Boilers. Available online: https://iea-etsap.org/E-TechDS/HIGHLIGHTS%20PDF/I01-ind_boilers-GS-AD-gct%201.pdf (accessed on 3 December 2019).
  56. (S&T) Squared Consultants. GHGenius 5.0e. Available online: https://www.ghgenius.ca/index.php/downloads/45-ghgenius-5-0e (accessed on 3 December 2019).
  57. Forest Economic Advisors. Particleboard & MDF Quarterly Forecast. Available online: https://home.getfea.com/publications/particleboard-mdf-quarterly-forecast (accessed on 27 November 2019).
  58. Thrän, D.; Peetz, D.; Schaubach, K. Global Wood Pellet Industry and Trade Study 2017. IEA Bioenergy. 2017. [Google Scholar]
  59. Mobini, M.; Sowlati, T.; Sokhansanj, S. A Simulation Model for the Design and Analysis of Wood Pellet Supply Chains. Appl. Energy 2013, 111, 1239–1249. [Google Scholar] [CrossRef]
  60. Sahoo, K.; Bilek, E.M.; Mani, S. Techno-Economic and Environmental Assessments of Storing Woodchips and Pellets for Bioenergy Applications. Renew. Sustain. Energy Rev. 2018, 98, 27–39. [Google Scholar] [CrossRef]
  61. Statistics Canada. Table 33-10-0007-01 Quarterly balance sheet and income statement, by industry (x 1,000,000). Available online: https://doi.org/10.25318/3310000701-eng (accessed on 3 December 2019).
  62. Government of Canada. Greenhouse Gas Pollution Pricing Act (S.C. 2018, C. 12, s. 186). Available online: https://laws-lois.justice.gc.ca/eng/acts/G-11.55/ (accessed on 3 December 2019).
  63. Finances Québec. Impacts Économiques Du Système De Plafonnement Et D’échange De Droits D’émission De Gaz À Effet De Serre Du Québec. Available online: http://www.finances.gouv.qc.ca/documents/autres/fr/AUTFR_impact-econo201708.pdf (accessed on 3 December 2019).
  64. Environment and Climate Change Canada. Proposed Regulatory Approach—Clean Fuel Standard. Available online: https://drive.google.com/file/d/1EnLsLwAxMPymMDPMnbFP5riLpMbZjgSm/view (accessed on 4 December 2019).
  65. Gouvernement du Québec. Règlement Sur La Déclaration Obligatoire De Certaines Émissions De Contaminants Dans L’atmosphère (Chapitre Q-2, R. 15). Available online: http://legisquebec.gouv.qc.ca/fr/ShowDoc/cr/Q-2,%20r.%2015 (accessed on 4 December 2019).
  66. Magelli, F.; Boucher, K.; Bi, H.T.; Melin, S.; Bonoli, A. An Environmental Impact Assessment of Exported Wood Pellets from Canada to Europe. Biomass Bioenergy 2009, 33, 434–441. [Google Scholar] [CrossRef]
  67. McKechnie, J.; Colombo, S.; Chen, J.; Mabee, W.; MacLean, H.L. Forest Bioenergy Or Forest Carbon? Assessing Trade-Offs in Greenhouse Gas Mitigation with Wood-Based Fuels. Environ. Sci. Technol. 2011, 45, 789–795. [Google Scholar] [CrossRef] [PubMed]
  68. European Parliament and Council of the European Union. Directive (EU) 2018/2001 on the Promotion of the use of Energy from Renewable Sources. Available online: https://eur-lex.europa.eu/legal-content/EN/TXT/HTML/?uri=CELEX:32018L2001&from=EN#d1e40-82-1 (accessed on 4 December 2019).
  69. Røyne, F.; Peñaloza, D.; Sandin, G.; Berlin, J.; Svanström, M. Climate Impact Assessment in Life Cycle Assessments of Forest Products: Implications of Method Choice for Results and Decision-Making. J. Clean. Prod. 2016, 116, 90–99. [Google Scholar] [CrossRef]
  70. Berndes, G.; Abt, B.; Asikainen, A.; Cowie, A.; Dale, V.; Egnell, G.; Lindner, M.; Marelli, L.; Paré, D.; Pingoud, K.; et al. Forest Biomass, Carbon Neutrality and Climate Change Mitigation; From Science to Policy 3; European Forest Institute: Joensuu, Finland, 2016. [Google Scholar]
  71. Liu, W.; Yu, Z.; Xie, X.; von Gadow, K.; Peng, C. A Critical Analysis of the Carbon Neutrality Assumption in Life Cycle Assessment of Forest Bioenergy Systems. Environ. Rev. 2018, 26, 93–101. [Google Scholar] [CrossRef] [Green Version]
  72. Breton, C.; Blanchet, P.; Amor, B.; Beauregard, R.; Chang, W. Assessing the Climate Change Impacts of Biogenic Carbon in Buildings: A Critical Review of Two Main Dynamic Approaches. Sustainability 2018, 10, 20. [Google Scholar] [CrossRef] [Green Version]
  73. Yemshanov, D.; McKenney, D.W.; Hope, E.S. Comparing Alternative Biomass Supply Options for Canada: What Story do Cost Curves Tell? BioResources 2018, 13, 3157–3164. [Google Scholar] [CrossRef] [Green Version]
  74. IRENA. Renewable Power Generation Costs in 2018; International Renewable Energy Agency: Abu Dhabi, United Arab Emirates, 2019. [Google Scholar]
  75. IRENA. The Power to Change: Solar and Wind Cost Reduction Potential to 2025; International Renewable Energy Agency: Abu Dhabi, United Arab Emirates, 2016. [Google Scholar]
  76. Natural Resources Canada. Comprehensive Energy use Database - Commercial/Institutional Sector—Canada. Available online: http://oee.nrcan.gc.ca/corporate/statistics/neud/dpa/menus/trends/comprehensive/trends_com_ca.cfm (accessed on 10 February 2020).
  77. Smyth, C.; Smiley, B.; Magnan, M.; Birdsey, R.; Dugan, A.; Olguin, M.; Mascorro, V.; Kurz, W. Climate Change Mitigation in Canada’s Forest Sector: A Spatially Explicit Case Study for Two Regions. Carbon Balance Manag. 2018, 13, 1–12. [Google Scholar] [CrossRef]
  78. Leskinen, P.; Cardellini, G.; González-García, S.; Hurmekoski, E.; Sathre, R.; Seppälä, J.; Smyth, C.; Stern, T.; Johannes Verkerk, P. Substitution Effects of Wood-Based Products in Climate Change Mitigation; European Forest Institute: Joensuu, Finland, 2018. [Google Scholar]
  79. United Nations Environment Programme. Emissions Gap Report 2017; United Nations Environment Programme (UNEP): Nairobi, Kenya, 2017. [Google Scholar]
  80. Natural Resources Canada. The State of Canada’s Forests 2018; Natural Resources Canada: Ottawa, ON, Canada, 2019. [Google Scholar]
  81. Rivers, N. Impacts of Climate Policy on the Competitiveness of Canadian Industry: How Big and how to Mitigate? Energy Econ. 2010, 32, 1092–1104. [Google Scholar] [CrossRef]
  82. Pinnacle Renewable Energy. BC Sawmill Curtailments Affecting Pinnacle’s 2019 Margins. Available online: https://www.canadianbiomassmagazine.ca/bc-sawmill-curtailments-affecting-pinnacles-2019-margins/ (accessed on 20 December 2019).
  83. Auffhammer, M.; Rubin, E. Natural Gas Price Elasticities and Optimal Recovery Under Consumer Heterogeneity: Evidence from 300 Million Natural Gas Bills; National Bureau of Economic Research: Cambridge, MA, USA, 2018. [Google Scholar]
  84. Douthitt, R.A. An Economic Analysis of the Demand for Residential Space Heating Fuel in Canada. Energy 1989, 14, 187–197. [Google Scholar] [CrossRef]
  85. Fan, S.; Hyndman, R.J. The Price Elasticity of Electricity Demand in South Australia. Energy Policy 2011, 39, 3709–3719. [Google Scholar] [CrossRef] [Green Version]
  86. Lauri, P.; Forsell, N.; Korosuo, A.; Havlík, P.; Obersteiner, M.; Nordin, A. Impact of the 2 °C Target on Global Woody Biomass Use. For. Policy Econ. 2017, 83, 121–130. [Google Scholar] [CrossRef] [Green Version]
  87. Bryngemark, E. Second Generation Biofuels and the Competition for Forest Raw Materials: A Partial Equilibrium Analysis of Sweden. For. Policy Econ. 2019, 109, 102022. [Google Scholar] [CrossRef]
Figure 1. Canadian medium-density fiberboard (MDF) and particle board manufacturers, and sawmills located within a 200 km radius. Data provided by the Canadian Forest Service.
Sustainability 12 01787 g001
Figure 2. Flowchart illustrating key model processes.
Sustainability 12 01787 g002
Figure 3. A representative example of a shift in pellet producer/chip supplier price-points for feedstock caused by the Pan-Canadian Framework (PCF) climate policies. The original curve, in green, shifts to the right to become the orange curve, which generates a mid-level risk for composite panel producers, shown in blue. An additional shift to the right, represented by the red curve, generates a high-level risk for composite panel producers.
Sustainability 12 01787 g003
Table 1. Bioenergy applications included in the study.
ResidentialCommercial and Institutional Electric UtilitiesIndustry
DescriptionSpace heating in family homesSpace and water heating for buildingsCo-firing or conversion of coal power plantsFuel switching in kilns or boilers
Fossil fuels and current use in CanadaNatural gas (614 PJ) Fuel oil (64 PJ) Propane (17 PJ)Natural gas (514 PJ) Fuel oil (24 PJ) Propane (39 PJ)Coal (60 PJ)Natural gas (1348 PJ) Coal (36 PJ) Pet coke (not available)
Alternate energy sourcesWood pellets ElectricityWood chips ElectricityWood pelletsWood chips
Table 2. Parameters for the calculation of capital cost.
ResidentialCommercial and Institutional Electric UtilitiesIndustry
Capacity factor (%)13.116.37080
Interest rate5%5%5%5%
Number of annuities5102020
Table 3. Costing assumptions for energy systems.
Fuel Cost ($/GJ)Efficiency (%)O&M Costs ($/kW.yr)Capital ($/kW)
Residential
Natural gas furnace2–16922.5161
Fuel oil furnace21–36833.7162
Propane furnace15–40833.7162
Wood pellet boilerCalculated809.3471
Electrical heat pump22–402523.5256
Commercial and Institutional
Natural gas boiler1.5–108512.0217
Fuel oil boiler21–368515.4211
Wood chip boilerCalculated7515.41000
Electrical boiler22–40980.9146
Electric Utilities
Coal2.8–4.334Similar for coal and pellets
Wood pelletsCalculated31390 (incremental)
Industrial
Natural gas1.5–680Similar for all fuels
Coal2.8–4.380
Pet coke2.5–3.580
Wood chipsCalculated70390 (incremental)
Table 4. Revenues and expenses for wood products.
ParticleboardMDFWood Pellets (Residential)Wood Pellets (Electricity)Wood Chips
Selling price 1280–320 $/m3380–440 $/m3CalculatedCalculatedCalculated
Wood costCalculatedCalculatedCalculatedCalculatedCalculated
Variable costs 130–175 $/m3185–255 $/m350–60 $/t40–50 $/t5–15 $/ODT
Fixed costs25 $/m325 $/m3
Distribution costsNot applicableNot applicable50–80 $/t20 $/t15 $/ODT
Operating profit margin15%15%15%15%15%
1 Selling prices for composite panels are f.o.b. mill (exclude transportation costs at customer).
Table 5. Carbon price and value of Clean Fuel (CF) Standard credit.
Short-Term (2019)Mid-Term (2023)Long-Term (2030)
Carbon pricing ($/tCO2e)2050100
CF Standard credit ($/tCO2e)050100
Table 6. Fuel carbon intensities.
FuelCarbon IntensityFuelCarbon IntensityFuelCarbon Intensity
Natural gas59 kgCO2e/GJCoal94 kgCO2e/GJWood pellets15 kgCO2e/GJ
Fuel oil84 kgCO2e/GJPet coke96 kgCO2e/GJWood chips10 kgCO2e/GJ
Propane75 kgCO2e/GJ
Table 7. Base case panel manufacturer risk results (without/with CF Standard credits).
ConsumerResidentialCommercial and InstitutionalElectric UtilitiesIndustry
RegionN.G.No N.G.N.G.No N.G.
Short-termNationalLowLowLowLowLowLow
BCLowLowLowLow Low
ABLowLowLowMid Low
ONLowLowLowMid Low
QCLowLowLowLow Low
NBLowLowLowLow Low
Mid-termNationalLowLowLowMidLowLow
BCLowLowLowLow Low
ABLowLowLowHigh Low
ONLowLowLowHigh Low
QCLowLowLowLow Low
NBLowLowLowLow Low
Long-termNationalLowLowLowMidLowLow/High
BCLowLowLowLow Low/High
ABLowLowLowHigh Low/Mid
ONLowLowLowHigh Low/High
QCLowLowLowLow Low/High
NBLowLowLowMid Low/High
Table 8. Sensitivity analysis results for a 50% reduction, the additional capital expenditure required for a bioenergy system.
ConsumerResidentialCommercial and InstitutionalElectric UtilitiesIndustry
RegionN.G.No N.G.N.G.No N.G.
Short-termNationalLowLowLowMidLowLow
Mid-termNationalLowLowLowMidLowLow
Long-termNationalLowLowLowHighLowLow
Table 9. Sensitivity analysis results for reduction in panel producer price-points by 25%; sensitivity analysis results for reduction in panel producer price-points (without/with CF Standard credits).
ConsumerResidentialCommercial and InstitutionalElectric UtilitiesIndustry
RegionN.G.No N.G.N.G.No N.G.
Short-termNationalLowLowLowLowLowLow
Mid-termNationalLowLowLowMidLowLow
Long-termNationalLowLowLowMidLowLow/High
Table 10. Biomass required for panel manufacturing and energy use in long-term mid and high risk applications.
Fiber Demand (ODT/yr)BCABONQCAtlantic (Incl. NB)
Panel manufacturing (ODT/yr)130,000200,000590,0001,380,000280,000
Commercial and institutional buildings (mid and high risk)None (low risk)440,0001,070,000None (low risk)810,000
Industrial energy (mid and high risk)4,900,00039,370,00013,960,0008,120,000950,000