Article

Environmental Performance Evaluation and Analysis Using ISO 14031 Guidelines in Construction Sector Industries

1
Civil Engineering Department, College of Engineering, King Khalid University, Abha 394, Saudi Arabia
2
Architecture and Planning Engineering Department, College of Engineering, King Khalid University, Abha 394, Saudi Arabia
3
Industrial Engineering Department, College of Engineering, Zagazig University, Zagazig 44519, Egypt
4
Industrial Engineering Department, College of Engineering, King Khalid University, Abha 394, Saudi Arabia
*
Author to whom correspondence should be addressed.
Sustainability 2020, 12(5), 1774; https://doi.org/10.3390/su12051774
Submission received: 23 January 2020 / Revised: 22 February 2020 / Accepted: 26 February 2020 / Published: 27 February 2020
(This article belongs to the Section Economic and Business Aspects of Sustainability)

Abstract

:
The construction sector is garnering increasing concern as an industry that generates significant pollution while suffering from a lack of adequate environmental performance evaluations. The purpose of this study is to evaluate the environmental performance of construction sector industries using the ISO 14031 standard in three dimensions: planning, using data and information, and reviewing and improving environmental performance evaluations. Using a descriptive and correlational approach, this study described and analyzed the level of implementation using a 7-point Likert scale questionnaire distributed to 1000 organizations in Saudi Arabia. The questionnaires were completed between May and December of 2018 and the results were measured against similar studies. The mean positive percentage responses were 31.36 and expressed the implementation levels of the three dimensions of environmental performance. The corresponding values for the three dimensions’ items were 33.36, 29.83, and 30.95 respectively. The minimum Kendall correlation coefficients for each item in a dimension were 0.79, 0.79, and 0.83, respectively. The maximum correlation values between an item and a dimension to which the item did not belong were 0.25. This study answers a fundamental question regarding the implementation level values of environmental performance in construction organizations based on the ISO 14031 standard model and analyzes the pairwise correlation among the descriptor variables of the model. Further studies are needed to investigate the model structure using the principle component, factor analysis, and cluster analysis.

1. Introduction

The construction industry generates a fairly large amount of pollutants compared to other industries [1], and occupies the first position in the number of ISO 14001 certificated organizations with 53,978 certificates (16.98%) [2]. These statistics reflect a significant effort by the construction industry to follow international standards that evaluate environmental and social performance. ISO 14001 is a management tool that enables an organization of any size or type to continually improve its environmental performance (EP) [3]. While it certifies that an organization has a certain type of environmental management system (EMS), it does not say anything about how the system is performing [4] and does not provide detailed performance assessment procedures. In 1999, ISO 14031 was issued to help industrial organizations evaluate their EP without giving benchmarks for acceptable levels of performance [5].
The motivation for this study and its importance stems from several existing studies. Firstly, Psomas, Fotopoulos, and Kafetzopoulos [6] argued that the actual contribution of EMSs to improving EP remains uncertain, even in the organizations that use EMSs to manage their business. Secondly, prior studies examining the association between adaptations of an EMS and EP resulted in mixed findings that included a positive impact association in the work of [7,8], no association between EMSs and EP [9], and no agreement on what EP is or how to measure it as concluded by [10]. This last contribution is particularly important as many authors have called for further research into EP measurement [11,12]. While other studies have assessed EP using a single performance index ranked by external parties or by the environmental impact of a single business activity, this study attempts to provide a first step to assess the performance of an organization, with or without EMSs, in implementing the guidelines given in ISO 14031 to evaluate EP. Accordingly, there is a need to investigate whether or not the organizations use the environmental performance evaluation (EPE) guidelines given in in the international standard to evaluate their EP.
Previous research has focused on management practices that prevent negative environmental aspects and impacts, such as cleaner production, eco-efficiency, EMSs, and life cycle assessment [13]. Some research has focused on motivations for the standard’s implementation [14]. Other studies have concentrated on the effects that these systems have on a firms’ environmental, operational, and financial performance [15]. Some studies have also found that improvements in an organization’s environmental performance are beneficial to the company’s overall performance [16]. The application of ISO 14001 is one particular area of research that has received a great deal of attention [17], and there has been a substantial body of literature on this research area, providing insights into how ISO 14001 diffuses at a country level [18], regional level [19] and global level [20]. Various approaches have been proposed to incorporate techniques and tools that support EMS decision making, such as multi-criteria techniques [21], hybrid models combining mathematical programming, and other methods [22]. Although extensive literature on EMSs exists, there is still a lack of in-depth investigation on maintaining ISO 14001’s EMS [23]. The implementation of an EMS does not guarantee its effectiveness [24]. Additionally, there is a need for continuous monitoring of an EMS’s critical points. While researchers advocate that EPEs are not directly linked to the maintenance of EMSs [25], others advocate that companies that do not use a set of EMS performance indicators may not be managing their own environmental system [26]. Therefore, EP must be continually monitored to ensure success in either developed or developing countries. Consequently, it is important to fill this gap in the literature by developing measurement models to assess the performance of management systems in EPEs regardless of the size and type of the industry.
EPE guidelines are an important resource for organizations that allow them to compare their EP in context and perspective with others and across industry sectors. EPEs consider operational indicators, management decisions, the wider impact on the environment, and the relevance, completeness, consistency, accuracy, and transparency of the data that is being reported. ISO 14031 defines EPEs as a process by which environmental indicators are selected to measure, analyze, assess, report, and communicate an organization’s EP against certain criteria. Moreover, the standard describes three types of indicators that may be used for an EP assessment: environmental condition indicators, for presenting achievements in context; operational performance indicators, used to demonstrate changes in resource use; and management performance indicators, for showing cost savings and improvements in training [27]. Moreover, the USA’s Environmental Protection Agency (EPA) has organized environmental indicators into two main categories and six levels that correspond to the type of activity measured. The two categories of indicators are administrative and environmental. The administrative category includes two levels. Level 1 represents actions taken by the EPA, while level 2 corresponds to steps taken by entities to reduce pollutants entering the air, water, or land in response to level 1 actions. The environmental category includes four levels. Level 3 represents indicators for measuring the actual amount of pollutants emitted by a source, and level 4 measures the levels of pollutants detected in local communities. Level 5 represents the chemical or biological changes that occur in some pollutants (e.g., the concentration of a toxin as it moves up the food chain). Level 6 represents the true indicator or condition the firm seeks to attain [28]. Hence, ISO 14031 and the EPA agree on the importance of measuring environmental management performance in terms of indicators related to the management activities, processes, and procedures concerning environmental assessment.
Currently, no studies have examined whether or not industrial organizations follow the guidelines given in international standard ISO 14031 to evaluate their EP. Additionally, no work has proposed a measurement tool for the EPE management process. Ejdys and Matuszak-Flejszman [29] confirmed that one of the ways of realizing sustainable development principles at the level of an organizational unit is implementation of normalized systems elaborated by ISO. Based on the findings of Ejdys, et al. [30], guidelines can be offered to both scholars and practitioners regarding the factors crucial for the improvement of the EMS. Aiming to add value to the existing literature, the structural analysis was adapted to classification and identification of the key factors. In this case, the ISO 14031 model maintains that the gap in measuring the management performance is maintaining the EP and developing a new measurement model based on statistical analysis and design. The lack of EPE models for the economic activities of the construction sector according to the guidelines given in international standard ISO 14031 have led to the inability to benchmark an organization’s EP and compare it with others in the same field. The standardization of measuring models and indicators that would enable consumers and stakeholders to assess and compare their EP is a necessity, and development of a descriptive and correlational study to evaluate the commitment of a construction sector organization to EPEs by considering the guidelines given in international standard ISO 14031 is an urgent need.
To assess the procedures, processes, and activities adopted by an organization’s management to evaluate the EP of their business, a measurement model based of the guidelines given in international standard ISO 14031 was designed. A descriptive correlation study was also implemented in order to determine the measurement model items and evaluate the implementation level of the environmental guidelines in the construction industry in Saudi Arabia. According to the ISO 14031 guidelines, evaluations were conducted in three main dimensions: planning, using data and information, and review and improvement of EPEs. In this case, ISO 14031 could be used independently or to support ISO 14001 requirements and ISO 14004 guidance for all organizations, regardless of type, size, location, or complexity [27]. It gives guidelines for the design and use of EPEs within an organization. It is important to note that it is not intended to be used as a specification standard for certification, registration purposes, or the establishment of any other environmental management system conformance requirements.
Implementation of the research methodology could be applied by organizations working not only in the construction sector, but also in any economic activity. The results presented are limited to organizations that work in the construction sector in Saudi Arabia. This sector includes 29 construction activities according to the Saudi Contractor Classification Agency located in 13 regions of Saudi Arabia [31]. EPE activities will be assessed according to the guidelines given in ISO 14031’s model dimensions. This study will benefit construction industry organizations, industrial organizations in general, and society at large. Construction industry organizations will be benefit by increasing their understanding of their EP, and will be able to use that information as a marketing and development tool. The performance evaluation methodology shown in this study will serve as an example to local and global organizations, as well as society in general. Furthermore, customers and various environmental authorities will find it easier to assess organizations. The following benefits are available to any organization that follows the research methodology adopted in this study for EPEs: understanding an organization’s impacts on the environment, providing a basis for EPE benchmarking, determining whether environmental objectives and targets are being met, demonstrating compliance with regulations, increasing the awareness of employees, and improving community and customer relations.
In summary, the objectives of this study are to examine the implementation levels of the ISO 14031 guidelines in Saudi construction sector organizations. In this context, this research was guided by the theoretical studies on the management and evaluation of environmental performance, as well as the types of performance indicators. This led to the following research question: what are the ISO 14031 guidelines governing the EPE implementation level in the Saudi construction sector? In addition, does a relationship exist between the ISO 14031 main and sub-dimensions? To address those questions, the next section describes the research procedures employed in this study.
This article is composed of five sections. The adopted measurement model is illustrated in the second section, Methodology. The third section, Results, applies the solution methodology to evaluate the level of EP based on the opinion and judgment of industrial experts. Section 4, Discussion, provides a discussion of the results. Finally, Section 5, Conclusions, gives the conclusion and a description of future work.

2. Materials and Methods

The methodology used supports the purpose of this study in terms of measuring the level of implementation of the ISO 14031 guidelines in the Saudi construction industry. In order to cover the objectives of ISO 14031, a qualitative design was chosen. A descriptive statistical analysis and Kendall correlation analysis were chosen because qualitative research is concerned with experiences, and understanding these experiences is more important than achieving an outcome [32]. The target population was construction companies working in Saudi Arabia. Data collection via a survey was chosen because qualitative research allows a lot of flexibility in terms of data sources [33]. The survey was emailed to the construction organizations, and then a select group was filtered through a data cleaning process and used in the statistical analysis. A total of 1258 construction companies (79% private, 21% governmental) were included in the study. Table 1 lists the 29 construction industry categories and the number of companies that responded with a valid and complete questionnaire [31]. The stratified sampling technique under nonprobability sampling was used in this paper. The study was conducted between May and December of 2018 in 13 regions of Saudi Arabia [34]. Participation in the survey was completely voluntary and included four categories (25.60% main contractors, 23.50% private departments, 26.80% governmental departments, and 24.10% subcontractors). Their responses were subjected to statistical analysis.
The ISO 14031 guidelines were used to scale EPEs in the Saudi construction industry. A 7-point Likert-scale scaled questionnaire, shown in Table 2, was designed and emailed to the corresponding companies’ mangers. The questionnaire’s model included 13 items categorized by three descriptor variables: planning for EPEs, using data and information, and reviewing and improving EPEs. Each descriptor variable included five, six, and two items, respectively. The items in dimension I were assigned codes P1 to P5, the items in dimension II were assigned codes D1 to D6, and the items in dimension III were assigned codes R1 and I1. Participants rated the statements of the ISO 14031 implementation level on a 7-point Likert-scale, with a rating of 7 indicating total agreement with the statement. This method illuminated the participants’ own perception of their implementation level [35,36].
A descriptive statistics and correlation analysis approach was adopted to describe and analyze the collected data [32]. The description was done in terms of the number of observations (n), the percentage (%), and the cumulative percentage (Cum.%). Cohen’s standard was used to evaluate the strength of the relationships, where coefficients between 0.10 and 0.29 indicated a small effect size, coefficients between 0.30 and 0.49 indicated a moderate effect size, and coefficients above 0.50 indicated a large effect size [37]. The correlations were examined using Holm corrections to adjust for multiple comparisons based on an alpha value of 0.05 [38] for ordinal data. The R language and environment for statistical computing was used to describe and analyze the collected data and implement the article’s statistical procedures [39].

3. Results

A descriptive and correlational study was performed to evaluate the commitment of a construction sector organization to EPEs and to measure if a relationship exist between the ISO 14031 main and sub-dimensions. The analysis based on a survey (a 7-point Likert scale questionnaire) conducted across 29 construction sector categories located in 13 regions in Saudi Arabia including 1000 organizations’ mangers. The implementation levels was estimated by frequencies and cumulative percentages of respondents while correlation was evaluated by Kendall correlation coefficient.

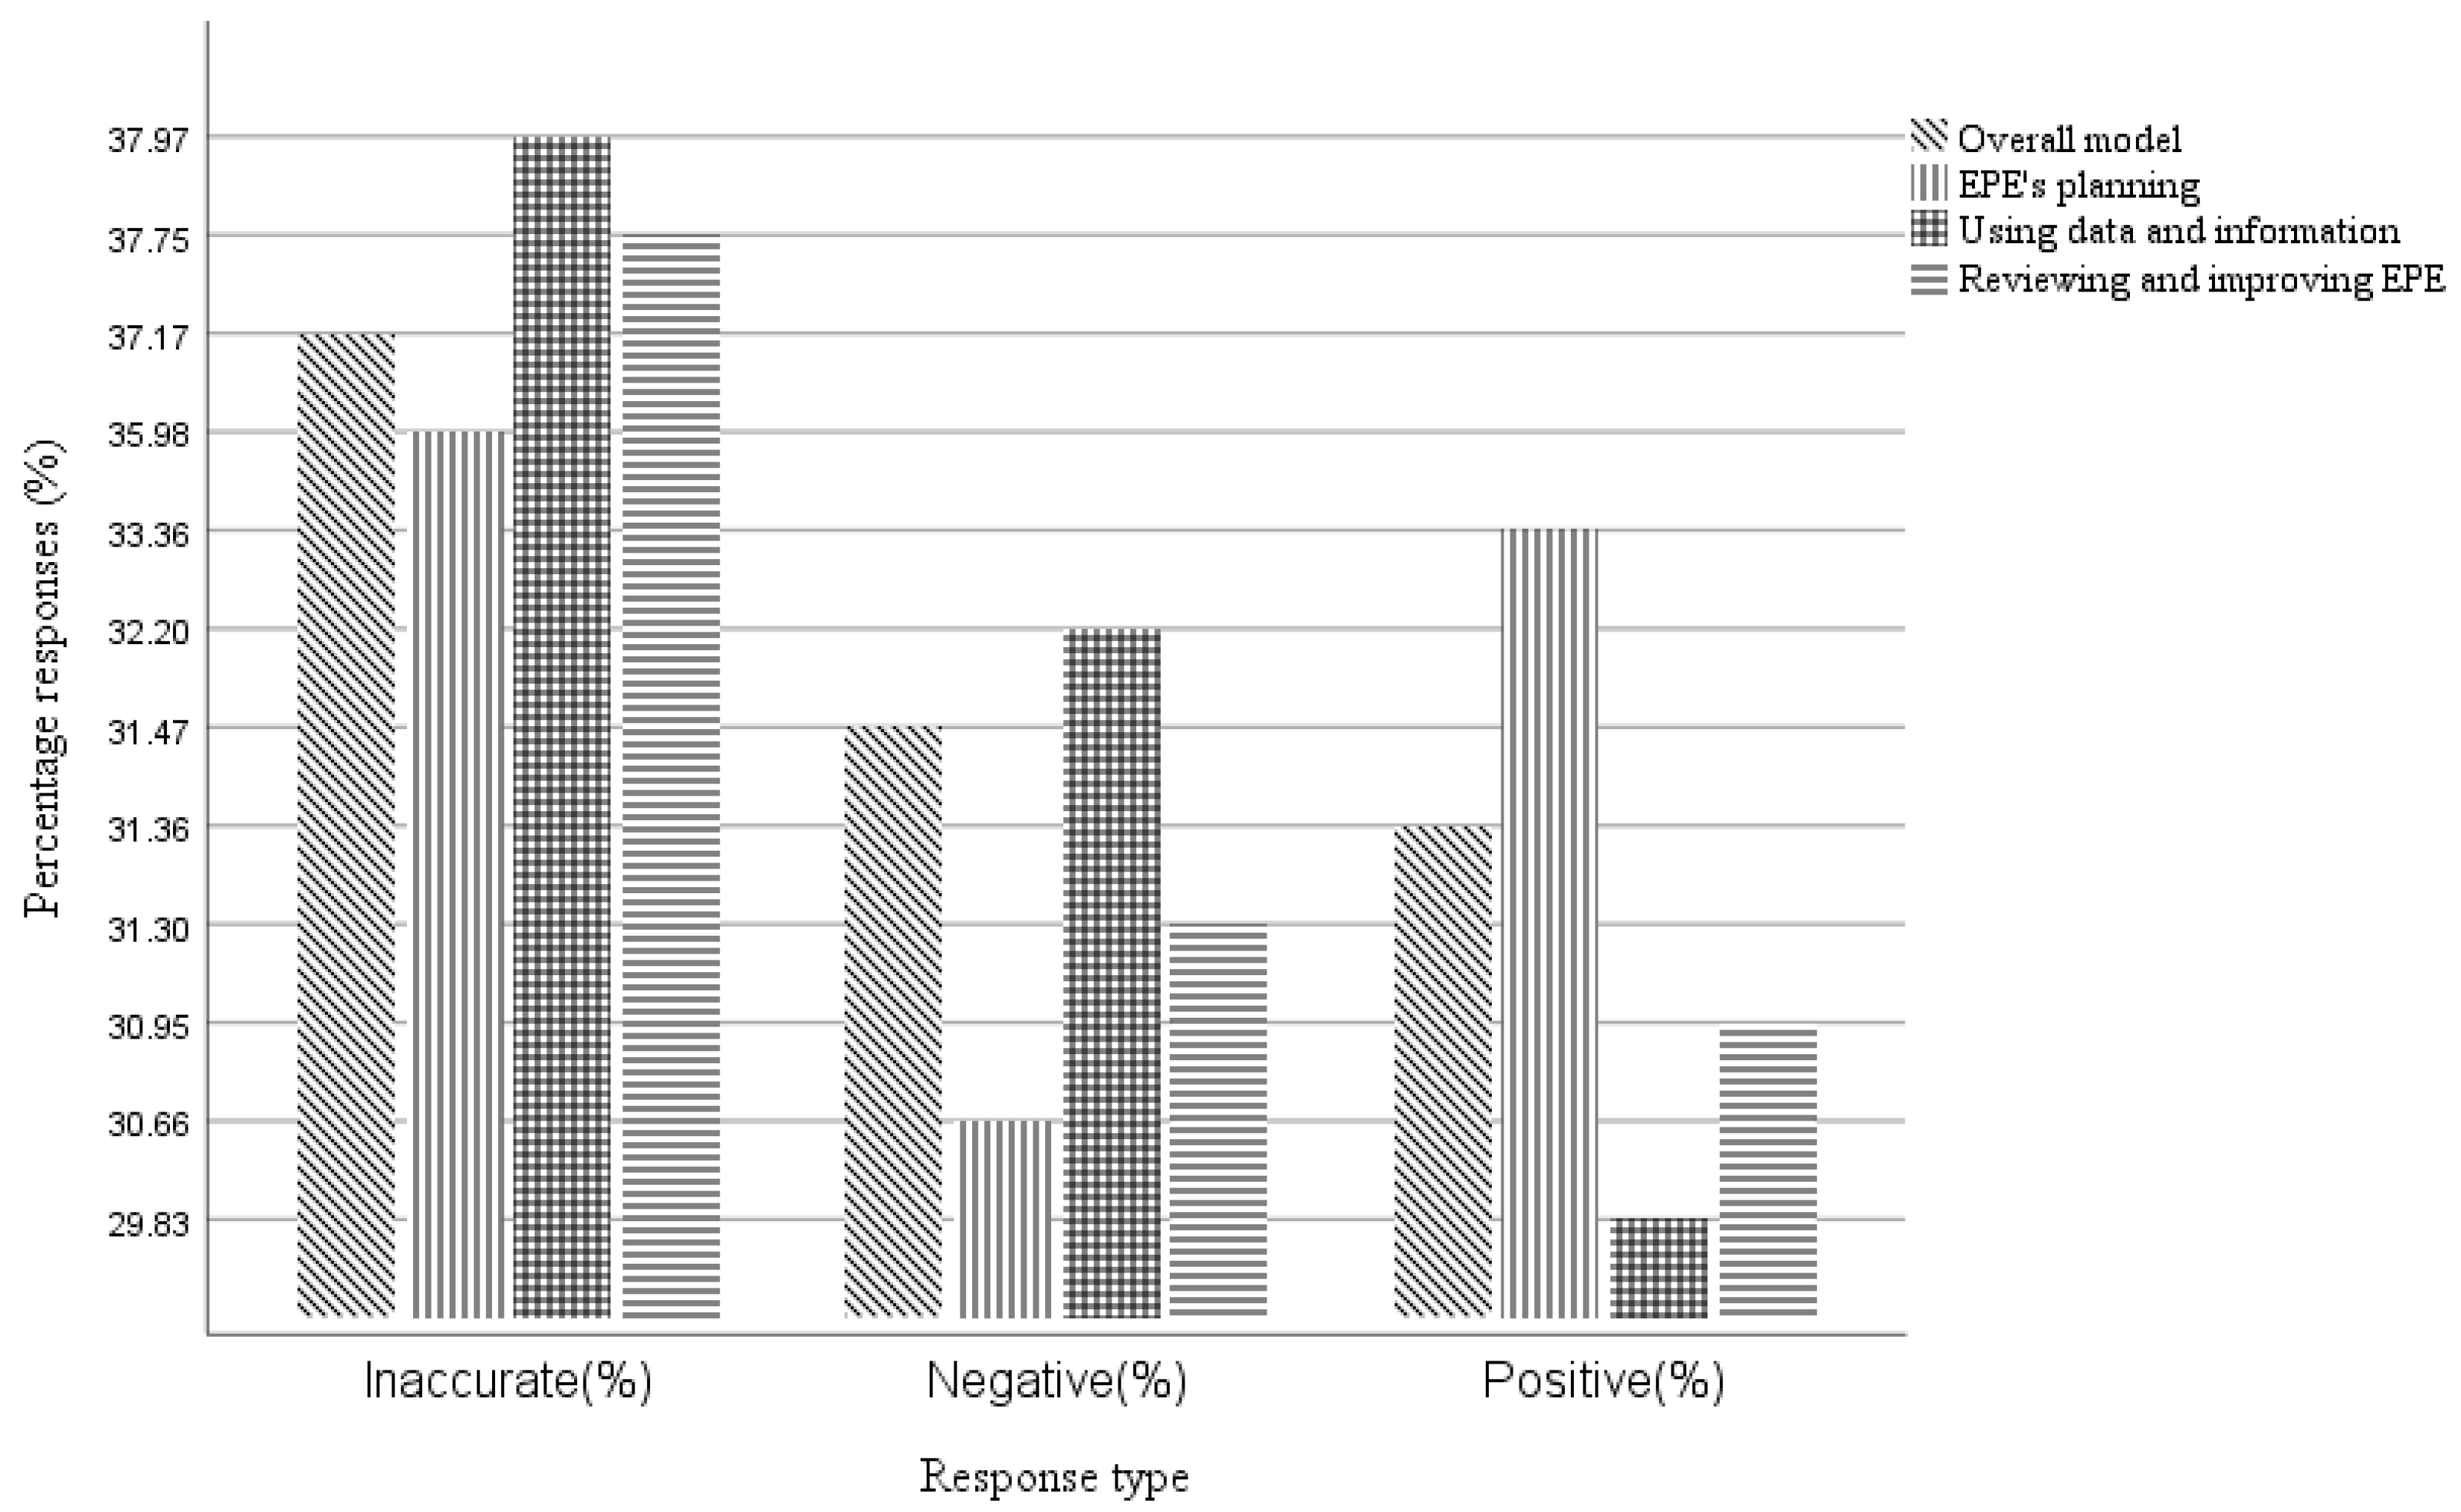
3.1. The Overall ISO 14031 Guidelines Implementation Levels in Saudi Construction Sector

The overall percentages were calculated for the implementation levels of ISO 14031 model in terms of negative, inaccurate, and positive responses. The most frequently observed percentage was 37.17% for inaccurate evaluations, then negative overall evaluation with a percentage of 31.47%, and hence positive evaluation with a percentage of 31.36% as shown in Figure 1. The negative, inaccurate, and positive percentages for the three dimensions were estimated as 30.66, 35.98, 33.36 for dimension I; 32.20, 37.97, 29.83 for dimension II; 31.30, 37.75, 30.95 for dimension III. The evaluation percentages for these dimensions were illustrated in the subsections.

3.1.1. Planning for the EPE’s Items Descriptive Statistics

Frequencies and percentages were calculated for P1, P2, P3, P4, and P5. The most frequently observed category of P1 was 4 (n = 357, 36%). The most frequently observed category of P2 was 4 (n = 356, 36%). The most frequently observed category of P3 was 4 (n = 375, 38%). The most frequently observed category of P4 was 4 (n = 360, 36%). The most frequently observed category of P5 was 4 (n = 351, 35%). The frequencies and percentages for the planning items are presented in Table 3.

3.1.2. Descriptive Statistics for the Items Related to Using Data and Information Variables

Frequencies and percentages were calculated for D1, D2, D3, D4, D5, and D6. The most frequently observed category of D1 was 4 (n = 368, 37%). The most frequently observed category of D2 was 4 (n = 392, 39%). The most frequently observed category of D3 was 4 (n = 373, 37%). The most frequently observed category of D4 was 4 (n = 385, 38%). The most frequently observed category of D5 was 4 (n = 381, 38%). The most frequently observed category of D6 was 4 (n = 379, 38%). The frequencies and percentages for the data usage and information items are presented in Table 4.

3.1.3. Descriptive Statistics for the Items Related to Reviewing and Improving EPEs

Frequencies and percentages were calculated for R1 and I1. The most frequently observed category of R1 was 4 (n = 381, 38%). The most frequently observed category of I1 was 4 (n = 374, 37%). The frequencies and percentages for the reviewing and improving EPEs items are presented in Table 5.

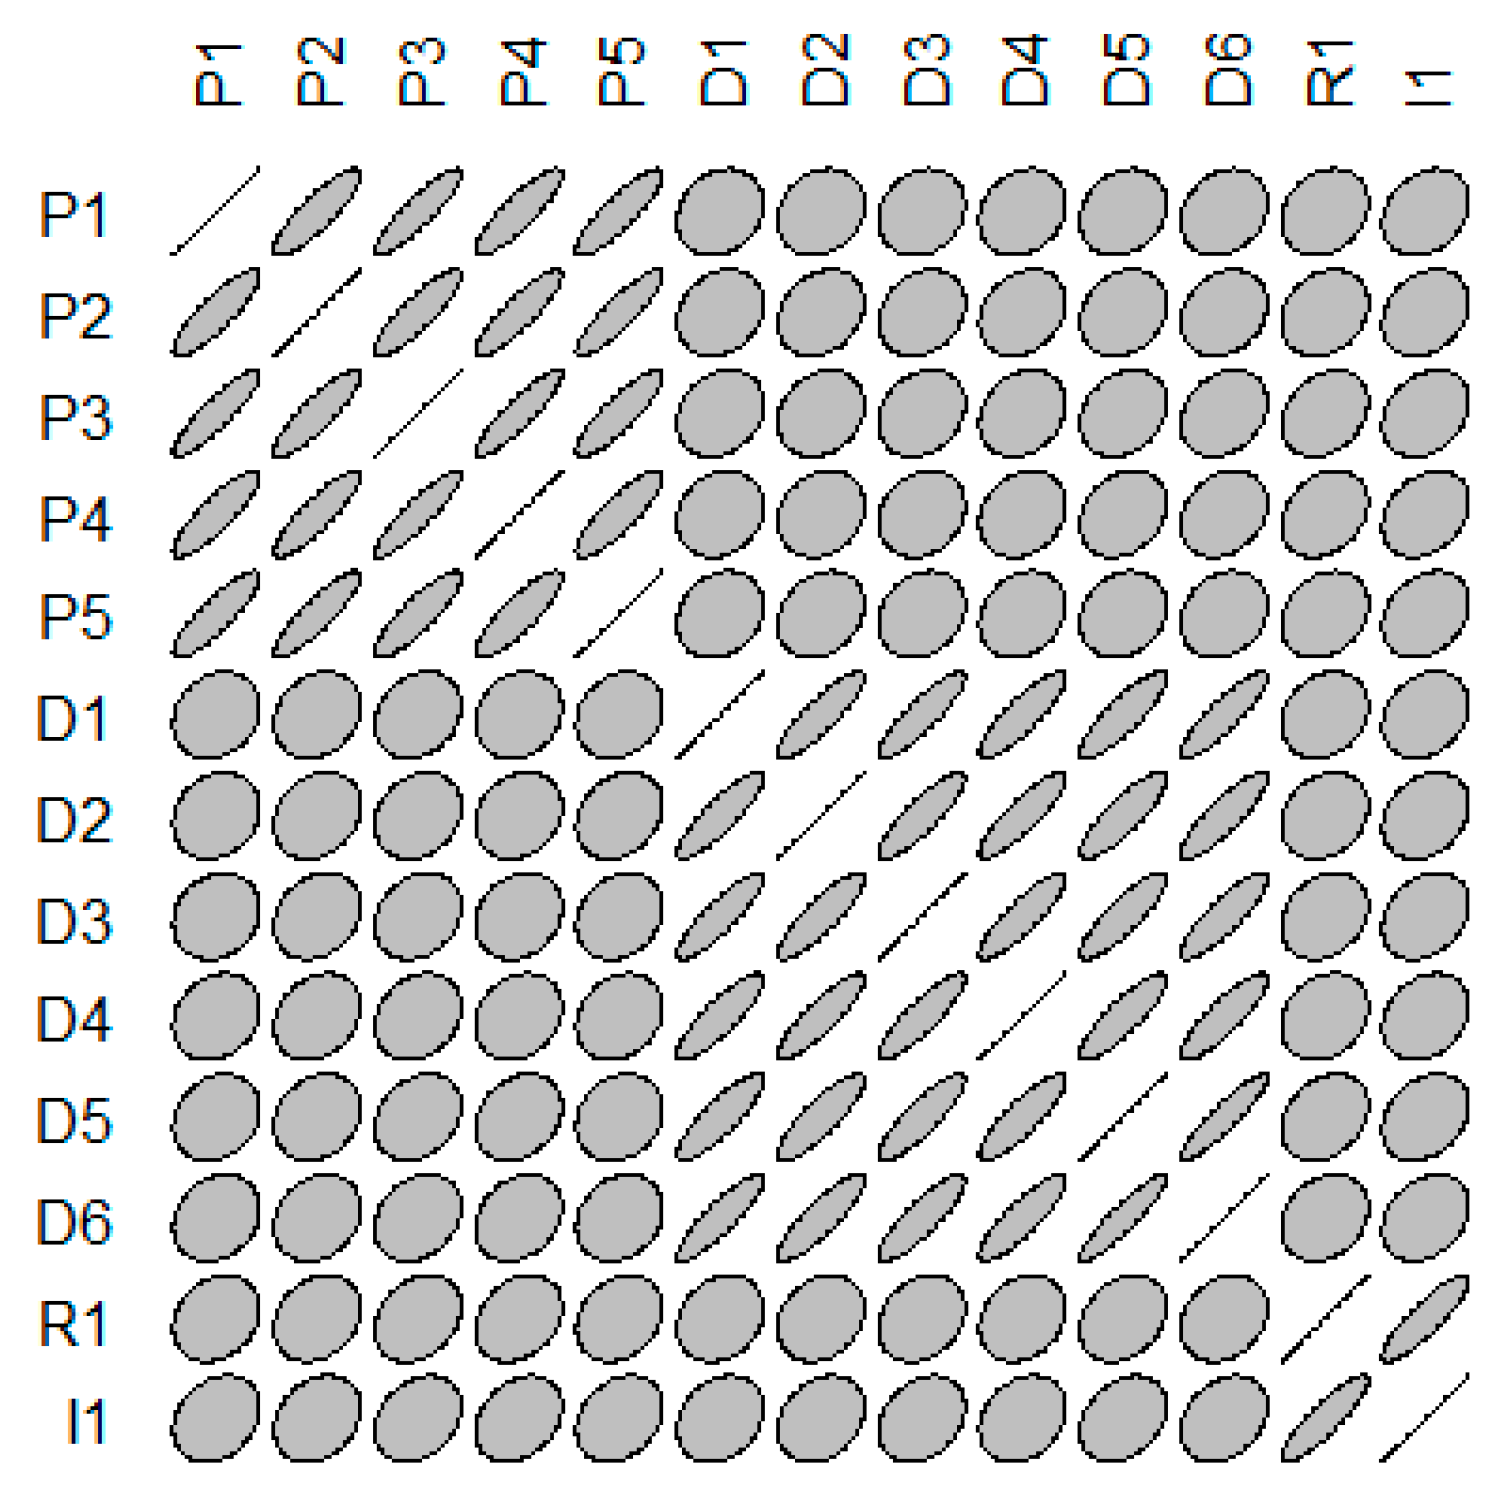
3.2. Kendall Coreelation Cofficients

A Kendall correlation coefficient (rk) estimated among the ordinal model variables at 0.05 level of significance (α) shown in Figure 2. The Figure shows the ellipse-shaped correlogram for model’s variables. It indicates a significance correlation among Ps variables, Ds variables, and between I and R variables with a large effect size. The rk among the P variables with a minimum value of rk = 0.79, indicating a large effect size. The rk among the D variables with a minimum value of rk = 0.79, indicating a large effect size. The rk = 0.83 between R1 and I1 also indicated a large effect size. The rk among the P and D variables had a maximum value of 0.20, indicating a small effect size. The rk between the P variables, R1, and I1 had a maximum value of 0.25, indicating a small effect size. The rk between the D variables, R1, and I1 had maximum value of 0.25, indicating a small effect size.

3.2.1. Planning for the EPE’s Item Correlation Analysis

A Kendall correlation analysis was conducted among variables P1, P2, P3, P4, and P5. Cohen’s standard was used to evaluate the strength of the relationships, where coefficients between 0.10 and 0.29 indicated a small effect size, coefficients between 0.30 and 0.49 indicated a moderate effect size, and coefficients above 0.50 indicated a large effect size [37]. The correlations were examined using Holm corrections to adjust for multiple comparisons based on an alpha value of 0.05. A significant positive correlation was observed between P1 and P2 (rk = 0.80, p < 0.001). The correlation coefficient between P1 and P2 was 0.80, indicating a large effect size. This correlation indicated that as P1 increased, P2 tended to increase. A significant positive correlation was observed between P1 and P3 (rk = 0.85, p < 0.001). The correlation coefficient between P1 and P3 was 0.85, indicating a large effect size. This correlation indicated that as P1 increased, P3 tended to increase. A significant positive correlation was observed between P1 and P4 (rk = 0.81, p < 0.001). The correlation coefficient between P1 and P4 was 0.81, indicating a large effect size. This correlation indicated that as P1 increased, P4 tended to increase. A significant positive correlation was observed between P1 and P5 (rk = 0.82, p < 0.001). The correlation coefficient between P1 and P5 was 0.82, indicating a large effect size. This correlation indicated that as P1 increased, P5 tended to increase. A significant positive correlation was observed between P2 and P3 (rk = 0.82, p < 0.001). The correlation coefficient between P2 and P3 was 0.82, indicating a large effect size. This correlation indicated that as P2 increased, P3 tended to increase. A significant positive correlation was observed between P2 and P4 (rk = 0.83, p < 0.001). The correlation coefficient between P2 and P4 was 0.83, indicating a large effect size. This correlation indicated that as P2 increased, P4 tended to increase. A significant positive correlation was observed between P2 and P5 (rk = 0.84, p < 0.001). The correlation coefficient between P2 and P5 was 0.84, indicating a large effect size. This correlation indicated that as P2 increased, P5 tended to increase. A significant positive correlation was observed between P3 and P4 (rk = 0.86, p < 0.001). The correlation coefficient between P3 and P4 was 0.86, indicating a large effect size. This correlation indicated that as P3 increased, P4 tended to increase. A significant positive correlation was observed between P3 and P5 (rk = 0.81, p < 0.001). The correlation coefficient between P3 and P5 was 0.81, indicating a large effect size. This correlation indicated that as P3 increased, P5 tended to increase. A significant positive correlation was observed between P4 and P5 (rk = 0.79, p < 0.001). The correlation coefficient between P4 and P5 was 0.79, indicating a large effect size. This correlation indicated that as P4 increased, P5 tended to increase. Table 6 presents the results of the correlations.

3.2.2. Using Data and Information’s Item Correlation Analysis

A significant positive correlation was observed between D1 and D2 (rk = 0.81, p < 0.001). The correlation coefficient between D1 and D2 was 0.81, indicating a large effect size. This correlation indicated that as D1 increased, D2 tended to increase. A significant positive correlation was observed between D1 and D3 (rk = 0.83, p < 0.001). The correlation coefficient between D1 and D3 was 0.83, indicating a large effect size. This correlation indicated that as D1 increased, D3 tended to increase. A significant positive correlation was observed between D1 and D4 (rk = 0.80, p < 0.001). The correlation coefficient between D1 and D4 was 0.80, indicating a large effect size. This correlation indicated that as D1 increased, D4 tended to increase. A significant positive correlation was observed between D1 and D5 (rk = 0.79, p < 0.001). The correlation coefficient between D1 and D5 was 0.79, indicating a large effect size. This correlation indicated that as D1 increased, D5 tended to increase. A significant positive correlation was observed between D1 and D6 (rk = 0.83, p < 0.001). The correlation coefficient between D1 and D6 was 0.83, indicating a large effect size. This correlation indicated that as D1 increased, D6 tended to increase. A significant positive correlation was observed between D2 and D3 (rk = 0.81, p < 0.001). The correlation coefficient between D2 and D3 was 0.81, indicating a large effect size. This correlation indicated that as D2 increased, D3 tended to increase. A significant positive correlation was observed between D2 and D4 (rk = 0.83, p < 0.001). The correlation coefficient between D2 and D4 was 0.83, indicating a large effect size. This correlation indicated that as D2 increased, D4 tended to increase.
A significant positive correlation was observed between D2 and D5 (rk = 0.79, p < 0.001). The correlation coefficient between D2 and D5 was 0.79, indicating a large effect size. This correlation indicated that as D2 increased, D5 tended to increase. A significant positive correlation was observed between D2 and D6 (rk = 0.81, p < 0.001). The correlation coefficient between D2 and D6 was 0.81, indicating a large effect size. This correlation indicated that as D2 increased, D6 tended to increase. A significant positive correlation was observed between D3 and D4 (rk = 0.82, p < 0.001). The correlation coefficient between D3 and D4 was 0.82, indicating a large effect size. This correlation indicated that as D3 increased, D4 tended to increase. A significant positive correlation was observed between D3 and D5 (rk = 0.80, p < 0.001). The correlation coefficient between D3 and D5 was 0.80, indicating a large effect size. This correlation indicated that as D3 increased, D5 tended to increase. A significant positive correlation was observed between D3 and D6 (rk = 0.81, p < 0.001). The correlation coefficient between D3 and D6 was 0.81, indicating a large effect size. This correlation indicated that as D3 increased, D6 tended to increase. A significant positive correlation was observed between D4 and D5 (rk = 0.80, p < 0.001). The correlation coefficient between D4 and D5 was 0.80, indicating a large effect size. This correlation indicated that as D4 increased, D5 tended to increase. A significant positive correlation was observed between D4 and D6 (rk = 0.80, p < 0.001). The correlation coefficient between D4 and D6 was 0.80, indicating a large effect size. This correlation indicated that as D4 increased, D6 tended to increase. A significant positive correlation was observed between D5 and D6 (rk = 0.88, p < 0.001). The correlation coefficient between D5 and D6 was 0.88, indicating a large effect size. This correlation indicated that as D5 increased, D6 tended to increase. Table 7 lists Kendall correlation results for variables D1, D2, D3, D4, D5, and D6.

3.2.3. Reviewing and Improving EPEs Item Correlation Analysis

The correlations were examined based on an alpha value of 0.05. A significant positive correlation was observed between R1 and I1 (rk = 0.83, p < 0.001). The correlation coefficient between R1 and I1 was 0.83, indicating a large effect size. This correlation indicated that as R1 increased, I1 tended to increase. Table 8 presents the Kendall correlation results between variables R1 and I1.

3.2.4. Planning, Using Data and Information, and Reviewing and Improving EPEs Item Correlation Analysis

The correlations were examined based on an alpha value of 0.05. A significant positive correlation was observed between P1 and D1 (rk = 0.15, p < 0.001). The correlation coefficient between P1 and D1 was 0.15, indicating a small effect size. This correlation indicated that as P1 increased, D1 tended to increase. A significant positive correlation was observed between P1 and D2 (rk = 0.14, p < 0.001). The correlation coefficient between P1 and D2 was 0.14, indicating a small effect size. This correlation indicated that as P1 increased, D2 tended to increase. A significant positive correlation was observed between P1 and D3 (rk = 0.13, p < 0.001). The correlation coefficient between P1 and D3 was 0.13, indicating a small effect size. This correlation indicated that as P1 increased, D3 tended to increase. A significant positive correlation was observed between P1 and D4 (rk = 0.15, p < 0.001). The correlation coefficient between P1 and D4 was 0.15, indicating a small effect size. This correlation indicated that as P1 increased, D4 tended to increase. A significant positive correlation was observed between P1 and D5 (rk = 0.15, p < 0.001). The correlation coefficient between P1 and D5 was 0.15, indicating a small effect size. This correlation indicated that as P1 increased, D5 tended to increase. A significant positive correlation was observed between P1 and D6 (rk = 0.16, p < 0.001). The correlation coefficient between P1 and D6 was 0.16, indicating a small effect size. This correlation indicated that as P1 increased, D6 tended to increase.
A significant positive correlation was observed between P2 and D1 (rk = 0.16, p < 0.001). The correlation coefficient between P2 and D1 was 0.16, indicating a small effect size. This correlation indicated that as P2 increased, D1 tended to increase. A significant positive correlation was observed between P2 and D2 (rk = 0.18, p < 0.001). The correlation coefficient between P2 and D2 was 0.18, indicating a small effect size. This correlation indicated that as P2 increased, D2 tended to increase. A significant positive correlation was observed between P2 and D3 (rk = 0.18, p < 0.001). The correlation coefficient between P2 and D3 was 0.18, indicating a small effect size. This correlation indicated that as P2 increased, D3 tended to increase. A significant positive correlation was observed between P2 and D4 (rk = 0.19, p < 0.001). The correlation coefficient between P2 and D4 was 0.19, indicating a small effect size. This correlation indicated that as P2 increased, D4 tended to increase. A significant positive correlation was observed between P2 and D5 (rk = 0.16, p < 0.001). The correlation coefficient between P2 and D5 was 0.16, indicating a small effect size. This correlation indicated that as P2 increased, D5 tended to increase. A significant positive correlation was observed between P2 and D6 (rk = 0.17, p < 0.001). The correlation coefficient between P2 and D6 was 0.17, indicating a small effect size. This correlation indicated that as P2 increased, D6 tended to increase.
A significant positive correlation was observed between P3 and D1 (rk = 0.18, p < 0.001). The correlation coefficient between P3 and D1 was 0.18, indicating a small effect size. This correlation indicated that as P3 increased, D1 tended to increase. A significant positive correlation was observed between P3 and D2 (rk = 0.16, p < 0.001). The correlation coefficient between P3 and D2 was 0.16, indicating a small effect size. This correlation indicated that as P3 increased, D2 tended to increase. A significant positive correlation was observed between P3 and D3 (rk = 0.18, p < 0.001). The correlation coefficient between P3 and D3 was 0.18, indicating a small effect size. This correlation indicated that as P3 increased, D3 tended to increase. A significant positive correlation was observed between P3 and D4 (rk = 0.18, p < 0.001). The correlation coefficient between P3 and D4 was 0.18, indicating a small effect size. This correlation indicated that as P3 increased, D4 tended to increase. A significant positive correlation was observed between P3 and D5 (rk = 0.20, p < 0.001). The correlation coefficient between P3 and D5 was 0.20, indicating a small effect size. This correlation indicated that as P3 increased, D5 tended to increase. A significant positive correlation was observed between P3 and D6 (rk = 0.20, p < 0.001). The correlation coefficient between P3 and D6 was 0.20, indicating a small effect size. This correlation indicated that as P3 increased, D6 tended to increase.
A significant positive correlation was observed between P4 and D1 (rk = 0.13, p < 0.001). The correlation coefficient between P4 and D1 was 0.13, indicating a small effect size. This correlation indicated that as P4 increased, D1 tended to increase. A significant positive correlation was observed between P4 and D2 (rk = 0.15, p < 0.001). The correlation coefficient between P4 and D2 was 0.15, indicating a small effect size. This correlation indicated that as P4 increased, D2 tended to increase. A significant positive correlation was observed between P4 and D3 (rk = 0.15, p < 0.001). The correlation coefficient between P4 and D3 was 0.15, indicating a small effect size. This correlation indicated that as P4 increased, D3 tended to increase. A significant positive correlation was observed between P4 and D4 (rk = 0.16, p < 0.001). The correlation coefficient between P4 and D4 was 0.16, indicating a small effect size. This correlation indicated that as P4 increased, D4 tended to increase. A significant positive correlation was observed between P4 and D5 (rk = 0.20, p < 0.001). The correlation coefficient between P4 and D5 was 0.20, indicating a small effect size. This correlation indicated that as P4 increased, D5 tended to increase. A significant positive correlation was observed between P4 and D6 (rk = 0.19, p < 0.001). The correlation coefficient between P4 and D6 was 0.19, indicating a small effect size. This correlation indicated that as P4 increased, D6 tended to increase.
A significant positive correlation was observed between P5 and D1 (rk = 0.16, p < 0.001). The correlation coefficient between P5 and D1 was 0.16, indicating a small effect size. This correlation indicated that as P5 increased, D1 tended to increase. A significant positive correlation was observed between P5 and D2 (rk = 0.19, p < 0.001). The correlation coefficient between P5 and D2 was 0.19, indicating a small effect size. This correlation indicated that as P5 increased, D2 tended to increase. A significant positive correlation was observed between P5 and D3 (rk = 0.17, p < 0.001). The correlation coefficient between P5 and D3 was 0.17, indicating a small effect size. This correlation indicated that as P5 increased, D3 tended to increase. A significant positive correlation was observed between P5 and D4 (rk = 0.17, p < 0.001). The correlation coefficient between P5 and D4 was 0.17, indicating a small effect size. This correlation indicated that as P5 increased, D4 tended to increase. A significant positive correlation was observed between P5 and D5 (rk = 0.15, p < 0.001). The correlation coefficient between P5 and D5 was 0.15, indicating a small effect size. This correlation indicated that as P5 increased, D5 tended to increase. A significant positive correlation was observed between P5 and D6 (rk = 0.16, p < 0.001). The correlation coefficient between P5 and D6 was 0.16, indicating a small effect size. This correlation indicated that as P5 increased, D6 tended to increase.
A significant positive correlation was observed between P1 and R1 (rk = 0.19, p < 0.001). The correlation coefficient between P1 and R1 was 0.19, indicating a small effect size. This correlation indicated that as P1 increased, R1 tended to increase. A significant positive correlation was observed between P1 and I1 (rk = 0.22, p < 0.001). The correlation coefficient between P1 and I1 was 0.22, indicating a small effect size. This correlation indicated that as P1 increased, I1 tended to increase. A significant positive correlation was observed between P2 and R1 (rk = 0.20, p < 0.001). The correlation coefficient between P2 and R1 was 0.20, indicating a small effect size. This correlation indicated that as P2 increased, R1 tended to increase. A significant positive correlation was observed between P2 and I1 (rk = 0.22, p < 0.001). The correlation coefficient between P2 and I1 was 0.22, indicating a small effect size. This correlation indicated that as P2 increased, I1 tended to increase. A significant positive correlation was observed between P3 and R1 (rk = 0.23, p < 0.001). The correlation coefficient between P3 and R1 was 0.23, indicating a small effect size. This correlation indicated that as P3 increased, R1 tended to increase. A significant positive correlation was observed between P3 and I1 (rk = 0.25, p < 0.001). The correlation coefficient between P3 and I1 was 0.25, indicating a small effect size. This correlation indicated that as P3 increased, I1 tended to increase. A significant positive correlation was observed between P4 and R1 (rk = 0.23, p < 0.001). The correlation coefficient between P4 and R1 was 0.23, indicating a small effect size. This correlation indicated that as P4 increased, R1 tended to increase. A significant positive correlation was observed between P4 and I1 (rk = 0.25, p < 0.001). The correlation coefficient between P4 and I1 was 0.25, indicating a small effect size. This correlation indicated that as P4 increased, I1 tended to increase.
A significant positive correlation was observed between P5 and R1 (rk = 0.20, p < 0.001). The correlation coefficient between P5 and R1 was 0.20, indicating a small effect size. This correlation indicated that as P5 increased, R1 tended to increase. A significant positive correlation was observed between P5 and I1 (rk = 0.23, p < 0.001). The correlation coefficient between P5 and I1 was 0.23, indicating a small effect size. This correlation indicated that as P5 increased, I1 tended to increase. A significant positive correlation was observed between D1 and R1 (rk = 0.19, p < 0.001). The correlation coefficient between D1 and R1 was 0.19, indicating a small effect size. This correlation indicated that as D1 increased, R1 tended to increase. A significant positive correlation was observed between D1 and I1 (rk = 0.21, p < 0.001). The correlation coefficient between D1 and I1 was 0.21, indicating a small effect size. This correlation indicated that as D1 increased, I1 tended to increase. A significant positive correlation was observed between R1 and I1 (rk = 0.83, p < 0.001). A significant positive correlation was observed between D2 and R1 (rk = 0.19, p < 0.001). The correlation coefficient between D2 and R1 was 0.19, indicating a small effect size. This correlation indicated that as D2 increased, R1 tended to increase. A significant positive correlation was observed between D2 and I1 (rk = 0.22, p < 0.001). The correlation coefficient between D2 and I1 was 0.22, indicating a small effect size. This correlation indicated that as D2 increased, I1 tended to increase. A significant positive correlation was observed between D3 and R1 (rk = 0.21, p < 0.001). The correlation coefficient between D3 and R1 was 0.21, indicating a small effect size. This correlation indicated that as D3 increased, R1 tended to increase. A significant positive correlation was observed between D3 and I1 (rk = 0.24, p < 0.001). The correlation coefficient between D3 and I1 was 0.24, indicating a small effect size. This correlation indicated that as D3 increased, I1 tended to increase.
A significant positive correlation was observed between D4 and R1 (rk = 0.20, p < 0.001). The correlation coefficient between D4 and R1 was 0.20, indicating a small effect size. This correlation indicated that as D4 increased, R1 tended to increase. A significant positive correlation was observed between D4 and I1 (rk = 0.21, p < 0.001). The correlation coefficient between D4 and I1 was 0.21, indicating a small effect size. This correlation indicated that as D4 increased, I1 tended to increase. A significant positive correlation was observed between D5 and R1 (rk = 0.24, p < 0.001). The correlation coefficient between D5 and R1 was 0.24, indicating a small effect size. This correlation indicated that as D5 increased, R1 tended to increase. A significant positive correlation was observed between D5 and I1 (rk = 0.25, p < 0.001). The correlation coefficient between D5 and I1 was 0.25, indicating a small effect size. This correlation indicated that as D5 increased, I1 tended to increase. A significant positive correlation was observed between D6 and R1 (rk = 0.20, p < 0.001). The correlation coefficient between D6 and R1 was 0.20, indicating a small effect size. This correlation indicated that as D6 increased, R1 tended to increase. A significant positive correlation was observed between D6 and I1 (rk = 0.25, p < 0.001). The correlation coefficient between D6 and I1 was 0.25, indicating a small effect size. This correlation indicated that as D6 increased, I1 tended to increase. Table 9 presents Kendall correlation results among the ISO 14031 dimensions.

4. Discussion

An evaluation and statistical analysis of the implementation level of the ISO 14031 guidelines was performed based on a survey conducted across 29 construction sector categories. The survey was submitted to more than 1000 companies in 13 Saudi Arabian regions. The developed survey questionnaire utilized the following three dimensions: planning, using data and information, and reviewing and improving EPEs. The dimensions contained five, six, and two items, respectively. The descriptive statistics for the surveyed items represented the evaluation of the implementation level and the correlation analysis. The Kendall correlation coefficients of the items represent the validity and strong structure of the survey questions. The most frequently observed category of the items was 4 out of a 7-point Likert-scale, which indicated that the participants generally felt that their organization was implementing the EPE principles provided in ISO 14031. This can be explained by the absence of environmental evaluation departments in most industrial organizations in the Saudi Arabian construction sector, and the presence of very few ISO 14001 certified organizations. In addition to these percentages, the cumulative percentage of respondents that somewhat agree, agreed or strongly agreed with their organization’s implementation of the guidelines for the dimension I variables (planning for EPEs) was 33.40, 33.30, 32.40, 33.20, and 34.50, respectively. Regarding the implementation level of the dimension II variables (using data and information), the cumulative percentage of respondents that agreed or strongly agreed was 30.10, 29.20, 30.60, 30.50, 29.20, and 29.40, respectively. The cumulative percentage for the dimension III variables was 30.70 and 31.20 for R1 and I1, respectively. These cumulative percentages for the items in the three dimensions indicated that the level of the questionnaire items assessing the level of EP implementation in accordance with the guidelines of ISO 14031 was convergent for all regions and all construction sector categories. This can be explained by the unified environmental culture of all workers in the construction sector in the Kingdom, despite the absence of independent environmental departments in the organizational structures of most institutions. In addition, limited attention is given to environmental impact assessments in the form of training programs in these institutions.
A Kendall correlation analysis performed on the ordinal model variables indicated a significant positive correlation among the P variables with a minimum value of rk = 0.79 and a maximum value of rk = 0.86 (p < 0.001), indicating a large effect size. The Kendall correlation indicated a significant positive correlation among the D variables with a minimum value of rk = 0.79 and a maximum value of rk = 0.83 (p < 0.001), indicating a large effect size. The rk = 0.83 between R1 and I1 also indicated a large effect size. The Kendall correlation coefficients among the P and D variables had a minimum value of 0.13 and a maximum value of 0.20 (p < 0.001), indicating a small effect size. This indicated that each item among the P variables could not be included in the D variables and maintain a good structure for the developed survey questionnaire. The Kendall correlation coefficients between the P variables, R1, and I1 had a minimum value of 0.19 and a maximum value of 0.25 (p < 0.001), indicating a small effect size. This indicated that each item in the P variables could not be included in the position of R1 or I1 and maintain a good structure for the developed survey questionnaire. The Kendall correlation coefficients between the D variables, R1, and I1 had minimum value of 0.19 and a maximum value of 0.25 (p < 0.001), indicating a small effect size. This indicated that each item among the D variables could not be included in the position of R1 or I1 and maintain a good structure for the developed survey questionnaire. These small correlation coefficients support the ISO 14031 model applicability in the construction industry, satisfy the factor loading threshold value of 0.03, and represent a good sign and possible clustering [40]. In general, the results indicated that the ISO 14031 model had a consistent dimensional structure and was a dependable instrument for the exploration of EPE assessments in the Saudi construction industry.

5. Conclusions

The objective of this study was to evaluate and analyze the implementation level of environmental performance in the construction industry following the ISO 14031 guidelines using a designed questionnaire as the measurement instrument. The overall picture that emerged from the study was that one-third of the respondents from the construction sector agreed or strongly agreed that EPEs were performed in their organizations. The questionnaire items were correlated and classified in three main dimensions: planning, using data and information, and reviewing and improving EPEs. However, descriptive statistics showed slight score differences in the implementation levels of the EPEs. The maximum category cumulative percentage was 34.5% for selecting and using ECI data in a useful form, and the corresponding minimum values were 29.2% for both systematic data collection and data communication. The Kendall correlation analysis indicated a significant positive correlation range from 0.79 and 0.83 among the model’s three dimensions. However, the maximum correlation between an item and a dimension that it did not belong to was 0.25. The minimum value was 0.19, which confirmed the consistency of the developed measurement instrument. It is worth noting that there was a strong correlation between the time-based information communication item and environmental reporting in the organization item. Only a few Saudi organizations belonging to the construction sector have implemented EMS ISO 14001 or received certification, and there is a significant lack of a gauge or standard to facilitate comparison, monitoring, and review of environmental performance. The ISO 14031 EPE model can be used for checking, reviewing, monitoring, and evaluating an organization’s environmental performance.
This study has potential limitations. The implementation levels estimates in the model were based on data gathered from construction sector organizations in Saudi Arabia. They are therefore subject to biases and confounding that may have influenced our conclusions. The participants were limited only to the organization’s managers who participated at the time of the study. However, the levels of ISO 14031 guidelines were estimated from 1000 organization regardless if they were certified for an EMS such as ISO 14001 or not. Our evaluation for levels neglects (1) changing respondents’ professions such as executive engineers, contractors, and subcontractors; (2) varying evaluations among construction sector categories; (3) Due to the ordinal nature of the collected data, additional findings could not be included into the statistical analysis, which limited the results; and (4) the questionnaire elements were included general statements and did not consider the details of evaluating EP in each dimensions. This shortcoming could be treated as extension of the current research. Consequently, further research is required to examine the structure of the developed model with respect to the variation that exists among descriptor variables.
Based on our findings, we have contributed to the development of a first measurement statistical model based on the ISO 14031 guidelines for EPEs. The management activities, processes, and procedures are the only common efforts of all organizations working in the same economic field or in different industries. Therefore, comparing or benchmarking the environmental quality of organizations can be done based on the developed model. A natural expansion of the current research could be using the principle component analysis technique to explore the validity of the ISO 14031 model to gauge environmental performance in addition to using the explanatory and confirmatory factor analysis. A clustering analysis could be helpful in future studies to cluster construction industry organization with respect to EPEs. The adaptation of the responsible research and innovation concept and future-oriented technology assessment in the construction industry as a strategy towards sustainability are possible expansions for the study. Important implications can be derived from the findings of this study. Construction organizations can adopt the developed ISO 14031 model as a useful tool to measure their environmental performance even though it does not implement ISO 14001.

Author Contributions

Conceptualization, M.M. and I.F.; methodology, M.M.; software, S.A.; validation, M.M. and S.A.; formal analysis, I.F.; investigation, M.M.; resources, S.A.; data curation, I.F.; writing—original draft preparation, S.A. and M.M.; writing—review and editing, M.M., I.F. and S.A.; visualization, M.M.; supervision, M.M. and I.F.; project administration, M.M.; All authors have read and agreed to the published version of the manuscript.

Funding

This research received no external funding.

Acknowledgments

The authors are grateful to anonymous reviewers and editors for their comments and suggestions on this article.

Conflicts of Interest

The authors declare no conflict of interest.

References

  1. Ball, J. Can ISO 14000 and eco-labelling turn the construction industry green? Build. Environ. 2002, 37, 421–428. [Google Scholar] [CrossRef]
  2. ISO-Survey. The ISO Survey of Mangement System Standard Certifications. 2018. Available online: https://www.iso.org/the-iso-survey.html (accessed on 4 November 2019).
  3. Environmental Management Systems -Requirements with Guidance for Use; ISO 14001; ISO: Geneva, Switzerland, 2015.
  4. Bansal, P.; Hunter, T. Strategic Explanations for the Early Adoption of ISO 14001. J. Bus. Ethics 2003, 46, 289–299. [Google Scholar] [CrossRef]
  5. Dowell, G.; Hart, S.; Yeung, B. Do Corporate Global Environmental Standards Create or Destroy Market Value? Manag. Sci. 2000, 46, 1059–1074. [Google Scholar] [CrossRef] [Green Version]
  6. Psomas, E.; Fotopoulos, C.; Kafetzopoulos, D. Motives, difficulties and benefits in implementing the ISO 14001 Environmental Management System. Manag. Environ. Qual. Int. J. 2011, 22, 502–521. [Google Scholar] [CrossRef]
  7. Anton, W.R.Q.; Deltas, G.; Khanna, M. Incentives for environmental self-regulation and implications for environmental performance. J. Environ. Econ. Manag. 2004, 48, 632–654. [Google Scholar] [CrossRef]
  8. Yüksel, H. An empirical evaluation of cleaner production practices in Turkey. J. Clean. Prod. 2008, 16, S50–S57. [Google Scholar] [CrossRef]
  9. Montabon, F.; Melnyk, S.; Sroufe, R.; Calantone, R. ISO 14000: Assessing Its Perceived Impact on Corporate Performance. J. Supply Chain Manag. 2006, 36, 4–16. [Google Scholar] [CrossRef]
  10. Nawrocka, D.; Parker, T. Finding the connection: Environmental management systems and environmental performance. J. Clean. Prod. 2009, 17, 601–607. [Google Scholar] [CrossRef]
  11. Weber, M. The business case for corporate social responsibility: A company-level measurement approach for CSR. Eur. Manag. J. 2008, 26, 247–261. [Google Scholar] [CrossRef]
  12. Orlitzky, M.; Siegel, D.S.; Waldman, D.A. Strategic Corporate Social Responsibility and Environmental Sustainability. Bus. Soc. 2011, 50, 6–27. [Google Scholar] [CrossRef]
  13. Mestre, A.; Vogtlander, J. Eco-efficient value creation of cork products: An LCA-based method for design intervention. J. Clean. Prod. 2013, 57, 101–114. [Google Scholar] [CrossRef]
  14. Prajogo, D.; Tang, A.K.Y.; Lai, K.-H. Do firms get what they want from ISO 14001 adoption?: An Australian perspective. J. Clean. Prod. 2012, 33, 117–126. [Google Scholar] [CrossRef]
  15. Melnyk, S.; Sroufe, R.; Calantone, R. A Model of Site Specific Antecedents of ISO 14001 Certification. Prod. Oper. Manag. 2003, 12, 369–385. [Google Scholar] [CrossRef]
  16. López-Gamero, M.D.; Molina-Azorín, J.F.; Claver-Cortés, E. The potential of environmental regulation to change managerial perception, environmental management, competitiveness and financial performance. J. Clean. Prod. 2010, 18, 963–974. [Google Scholar] [CrossRef]
  17. To, W.M.; Lee, P.K.C. Diffusion of ISO 14001 environmental management system: Global, regional and country-level analyses. J. Clean. Prod. 2014, 66, 489–498. [Google Scholar] [CrossRef]
  18. Trierweiller, A.C.; Severo Peixe, B.C.; Tezza, R.; Bornia, A.C.; Campos, L.M.S. Measuring environmental management disclosure in industries in Brazil with Item Response Theory. J. Clean. Prod. 2013, 47, 298–305. [Google Scholar] [CrossRef]
  19. Delmas, M.A. The diffusion of environmental management standards in Europe and in the United States: An institutional perspective. Policy Sci. 2002, 35, 91–119. [Google Scholar] [CrossRef]
  20. Nishitani, K. Demand for ISO 14001 adoption in the global supply chain: An empirical analysis focusing on environmentally conscious markets. Resour. Energy Econ. 2010, 32, 395–407. [Google Scholar] [CrossRef]
  21. Sambasivan, M.; Fei, N.Y. Evaluation of critical success factors of implementation of ISO 14001 using analytic hierarchy process (AHP): A case study from Malaysia. J. Clean. Prod. 2008, 16, 1424–1433. [Google Scholar] [CrossRef]
  22. Celik, M. A hybrid design methodology for structuring an Integrated Environmental Management System (IEMS) for shipping business. J. Environ. Manag. 2009, 90, 1469–1475. [Google Scholar] [CrossRef]
  23. Balzarova, M.A.; Castka, P. Underlying mechanisms in the maintenance of ISO 14001 environmental management system. J. Clean. Prod. 2008, 16, 1949–1957. [Google Scholar] [CrossRef]
  24. Rondinelli, D.; Vastag, G. Panacea, common sense, or just a label?: The value of ISO 14001 environmental management systems. Eur. Manag. J. 2000, 18, 499–510. [Google Scholar] [CrossRef]
  25. Poksinska, B. Implementing ISO 14000 in Sweden: Motives, benefits and comparisons with ISO 9000. Int. J. Qual. Reliab. Manag. 2003, 20, 585–606. [Google Scholar] [CrossRef]
  26. Henri, J.-F.; Journeault, M. Environmental performance indicators: An empirical study of Canadian manufacturing firms. J. Environ. Manag. 2008, 87, 165–176. [Google Scholar] [CrossRef]
  27. Environmental Management—Environmental Performance Evaluation—Guidelines; ISO-14031; International Organization for Standardization: Geneva, Switzerland, 2013.
  28. EPA. Bridging the Gap: EPA’s Report on the Environment Provides a Tool for Communicating Health and Environmental Trends. Available online: https://blog.epa.gov/tag/environmental-indicators/ (accessed on 9 December 2019).
  29. Ejdys, J.; Matuszak-Flejszman, A. New Management Systems as an Instrument of Implementation Sustainable Development Concept at Organizational Level/Naujos Valdymo Sistemos Kaip Instrumentai Įgyvendinant Darnios Plėtros Koncepciją Organizaciniu Lygmeniu. Technol. Econ. Dev. Econ. 2010, 16, 202–218. [Google Scholar] [CrossRef]
  30. Ejdys, J.; Matuszak-Flejszman, A.; Szymanski, M.; Ustinovichius, L.; Shevchenko, G.; Lulewicz-Sas, A. Crucial Factors for Improving the ISO 14001 Environmental Management System. J. Bus. Econ. Manag. 2016, 17, 52–73. [Google Scholar] [CrossRef] [Green Version]
  31. Contractor Classification Agency. Number of Contarctors Classified by Field; k. o. A., Ed.; Ministry of Municipal and Rural Affairs: Riyadh, Saudi Arabia, 2018. [Google Scholar]
  32. Merriam, S.B. Qualitative Research: A Guide to Design and Implementation, 4th ed.; John Wiley & Sons: Hoboken, NJ, USA, 2015; p. 368. [Google Scholar]
  33. Ravitch, S.M.; Carl, N.C.M. Qualitative Research: Bridging the Conceptual, Theoretical, and Methodological; SAGE Publications Inc.: Thousand Oaks, CA, USA, 2015; p. 600. [Google Scholar]
  34. KSA. Statistical Yearbook of 2018 Kingdom of Saudi Arabia; General Authority for Statistics (GASTAT): Riyadh, Saudi Arabia, 2018; Volume 2018. [Google Scholar]
  35. Simula, B.L. Book Review: The Coding Manual for Qualitative Researchers, 3rd ed. Teach. Sociol. 2018, 46, 173–175. [Google Scholar] [CrossRef]
  36. Wicks, D. The Coding Manual for Qualitative Researchers. Qual. Res. Org. Manag. Int. J. 2017, 12, 169–170. [Google Scholar] [CrossRef]
  37. Cohen, J. Statistical Power Analysis for the Behavioral Sciences; Academic Press: New York, NY, USA, 2013. [Google Scholar] [CrossRef]
  38. Holm, S. A Simple Sequentially Rejective Multiple Test Procedure. Scand. J. Stat. 1979, 6, 65–70. [Google Scholar] [CrossRef]
  39. R Core Team. R: A Language and Environment for Statistical Computing; R Foundation for Statistical Computing: Vienna, Austria, 2018. [Google Scholar]
  40. Tabachnick, B.G.; Fidell, L.S. Using Multivariate Statistics; Pearson Education: Boston, MA, USA, 2013. [Google Scholar]
Figure 1. Clustered Bar chart of Percentage responses by response type for ISO_14031_dimension.
Sustainability 12 01774 g001
Figure 2. Ellipse-shaped correlogram for questionnaire correlation matrix.
Sustainability 12 01774 g002
Table 1. Frequencies and percentages of responded companies by construction field.
Construction fieldNumber of Responded CompaniesPercentage (%)
Water and sanitation works404.00
Electronic works282.80
Marine works363.60
Industrial works454.50
Electrical works333.30
Mechanical works343.40
Dams313.10
Roads404.00
Buildings414.10
Slaughterhouses323.20
Catering for individuals555.50
Maintenance health centers353.50
Landscaping333.30
Communication technology494.90
Well drilling262.60
Maintenance of Landscaping393.90
Maintenance and operation dams121.20
Maintenance roads333.30
Maintenance buildings464.60
Catering for medical centers454.50
Maintenance and operation of water and sanitation works181.80
Maintenance and operation of electronic works292.90
Maintenance and operation of marine works171.70
Maintenance and operation of industrial works191.90
Maintenance and operation of electrical works515.10
Maintenance and operation of mechanical works171.70
Maintenance and operation of slaughterhouses292.90
Maintenance and operation of communication technology313.10
City cleaning and wastes disposal565.60
Total1000100.00
Table 2. Questionnaire items on the implementation of the ISO 14031 in the construction industry.
StageCodeDefinition
Planning for EPE
(Dimension I)
P1EPE planning is based on the significant/controlling environmental aspects
P2EPE planning is based on environmental performance criteria and on the views of interested parties
P3The organization selects and uses MPIs data in a useful form
P4The organization selects and uses OPIs data in a useful form
P5The organization selects and uses ECIs data in a useful form
Using data and information
(Dimension II)
D1Using data and information to do EP is based on documented procedures.
D2The organization collect data from sources consistent with EPE planning
D3The organization analyze and convert the collected data into information describing EPE
D4The EPE’s analyzed data compared with the organization’s EP criteria indicating progress in EP
D5Management ensure that appropriate and necessary information describing the organization’s environmental performance is communicated throughout the organization on a timely basis
D6The organization issues environmental EP’ reports to external interested parties
Reviewing and improving EPE
(Dimension III)
R1The organization’s EPE is reviewed periodically to identify opportunities for improvement
I1The review contributes to management actions to improve the performance of the management and operations of the organization, and result in improvements to the condition of the environment
Table 3. Frequency table for the Planning for the EPE’s variables.
P1n%Cum.%P2n%Cum.%P3n%Cum.%P4n%Cum.%P5n%Cum.%
150.500.50130.300.30150.500.50140.400.40130.300.30
2626.206.702595.906.202666.607.102575.706.102656.506.80
324224.2030.90324924.9031.10323023.0030.10324724.7030.80323623.6030.40
435735.7066.60435635.6066.70437537.5067.60436036.0066.80435135.1065.50
525725.7092.30524924.9091.60525225.2092.80525725.7092.50525725.7091.20
6717.1099.406797.9099.506646.4099.206686.8099.306808.0099.20
760.60100.00750.50100.00780.80100.00770.70100.00780.80100.00
Table 4. Frequency table for the D1, D2, D3, D4, D5, and D6 variables.
D1n%Cum.%D2n%Cum.%D3n%Cum.%D4n%Cum.%D5n%Cum.%D6n%Cum.%
190.900.9011011180.800.80190.900.901111.101.101111.101.10
2595.906.80260672646.407.202626.207.102525.206.302565.606.70
326326.3033.10324624.6031.60324924.9032.10323923.9031.00326426.4032.7032602632.70
436836.8069.90439239.2070.80437337.3069.40438538.5069.50438138.1070.80437937.9070.60
523923.9093.80522522.5093.30524324.3093.70523423.4092.90523523.5094.30522922.9093.50
6565.6099.406626.2099.506575.7099.406676.7099.606535.3099.606606.0099.50
760.60100.00750.50100.00760.60100.00740.40100.00740.40100.00750.50100.00
Table 5. Frequency table for the R1 and I1 variables.
R1n%Cum.%I1n%Cum.%
180.800.80180.800.80
2686.807.602585.806.60
323623.6031.20324824.8031.40
438138.1069.30437437.4068.80
523323.3092.60524024.0092.80
6666.6099.206666.6099.40
780.80100760.60100.00
Table 6. Kendall correlation results for variables P1, P2, P3, P4, and P5.
CombinationrkLowerUpperp
P1-P20.800.780.82< 0.001
P1-P30.850.830.86< 0.001
P1-P40.810.790.83< 0.001
P1-P50.820.800.84< 0.001
P2-P30.820.800.84< 0.001
P2-P40.830.810.84< 0.001
P2-P50.840.820.85< 0.001
P3-P40.860.840.87< 0.001
P3-P50.810.790.83< 0.001
P4-P50.790.770.82< 0.001
Table 7. Kendall correlation results for variables D1, D2, D3, D4, D5, and D6.
CombinationrkLowerUpperp
D1-D20.810.790.83< 0.001
D1-D30.830.800.84< 0.001
D1-D40.800.770.82< 0.001
D1-D50.790.760.81< 0.001
D1-D60.830.810.85< 0.001
D2-D30.810.790.83< 0.001
D2-D40.830.810.85< 0.001
D2-D50.790.760.81< 0.001
D2-D60.810.790.83< 0.001
D3-D40.820.800.84< 0.001
D3-D50.800.780.82< 0.001
D3-D60.810.780.83< 0.001
D4-D50.800.780.82< 0.001
D4-D60.800.780.82< 0.001
D5-D60.880.870.89< 0.001
Table 8. Kendall correlation results between variables R1 and I1.
CombinationrkLowerUpperp
R1-I10.830.810.85< 0.001
Table 9. Kendall correlation results among the ISO 14031 dimensions.
CombinationrkLowerUpperp CombinationrkLowerUpperp
P1-D10.150.090.21< 0.001 P5-D30.170.100.23< 0.001
P1-D20.140.080.20< 0.001 P5-D40.170.110.23< 0.001
P1-D30.130.070.19< 0.001 P5-D50.150.080.21< 0.001
P1-D40.150.090.21< 0.001 P5-D60.160.100.22< 0.001
P1-D50.150.090.21< 0.001 P1-R10.190.130.25< 0.001
P1-D60.160.100.22< 0.001 P1-I10.220.160.28< 0.001
P2-D10.160.100.22< 0.001 P2-R10.200.140.26< 0.001
P2-D20.180.120.24< 0.001 P2-I10.220.160.28< 0.001
P2-D30.180.120.24< 0.001 P3-R10.230.170.29< 0.001
P2-D40.190.130.25< 0.001 P3-I10.250.190.30< 0.001
P2-D50.160.100.22< 0.001 P4-R10.230.170.29< 0.001
P2-D60.170.110.23< 0.001 P4-I10.250.190.31< 0.001
P3-D10.180.120.24< 0.001 P5-R10.200.140.26< 0.001
P3-D20.160.100.22< 0.001 P5-I10.230.170.29< 0.001
P3-D30.180.120.24< 0.001 D1-R10.190.130.25< 0.001
P3-D40.180.120.24< 0.001 D1-I10.210.150.27< 0.001
P3-D50.200.140.26< 0.001 D2-R10.190.130.25< 0.001
P3-D60.200.140.26< 0.001 D2-I10.220.160.28< 0.001
P4-D10.130.070.19< 0.001 D3-R10.210.150.27< 0.001
P4-D20.150.090.21< 0.001 D3-I10.240.180.30< 0.001
P4-D30.150.080.21< 0.001 D4-R10.200.140.26< 0.001
P4-D40.160.100.22< 0.001 D4-I10.210.150.27< 0.001
P4-D50.200.140.26< 0.001 D5-R10.240.180.30< 0.001
P4-D60.190.130.25< 0.001 D5-I10.250.190.31< 0.001
P5-D10.160.100.22< 0.001 D6-R10.200.140.26< 0.001
P5-D20.190.130.25< 0.001 D6-I10.250.190.30< 0.001

