Decelerations of Passenger Vehicles on Gravel Arrester Beds


Faculty of Mechanical Engineering, University of Ljubljana, SI-1000 Ljubljana, Slovenia
*
Author to whom correspondence should be addressed.
Sustainability 2020, 12(5), 1761; https://doi.org/10.3390/su12051761
Submission received: 17 January 2020
/
Revised: 24 February 2020
/
Accepted: 25 February 2020
/
Published: 27 February 2020
(This article belongs to the Special Issue Road Traffic Engineering and Sustainable Transportation)
Abstract
:Gravel-filled arrester beds, also called safety-escape ramps or vehicle run-out areas, have long been a road-safety feature for safely stopping heavy road vehicles from running off the road. In the recent past, there has been consideration given to installing these features on highway access ramps to provide safe areas to stop passenger cars driving at highway speeds. The work presented in this article was performed to investigate the behaviour of standard-size passenger cars on gravel-filled arrester beds, with a particular focus on the achievable vehicle decelerations and the ability of the arrester beds to safely stop a passenger car coasting in an uncontrolled manner. The findings show that the achievable average decelerations are in the range of 0.3 g for coasting vehicles and up to 0.9 g when the vehicles are braking. The results prove that more research is required to quantify the influence of the gravel parameters on the achievable decelerations.
Keywords:
gravel; arrester bed; escape ramp; run-out area; deceleration; traffic safety; measurement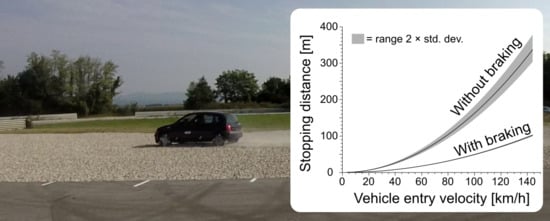
1. Introduction
Road traffic safety is one of the fundamental requirements to achieve the sustainable development goals. This is outlined in several strategic documents issued by global and regional organizations such as the World Health Organization [1], the United Nations Conference on Trade and Development [2] and the European Commission [3], as well as in national strategies [4]. These documents emphasise the importance of planning and design of safe road infrastructure and its role in the efforts of achieving sustainable development. Some of the design measures have found the way into national best practice guidelines [5].
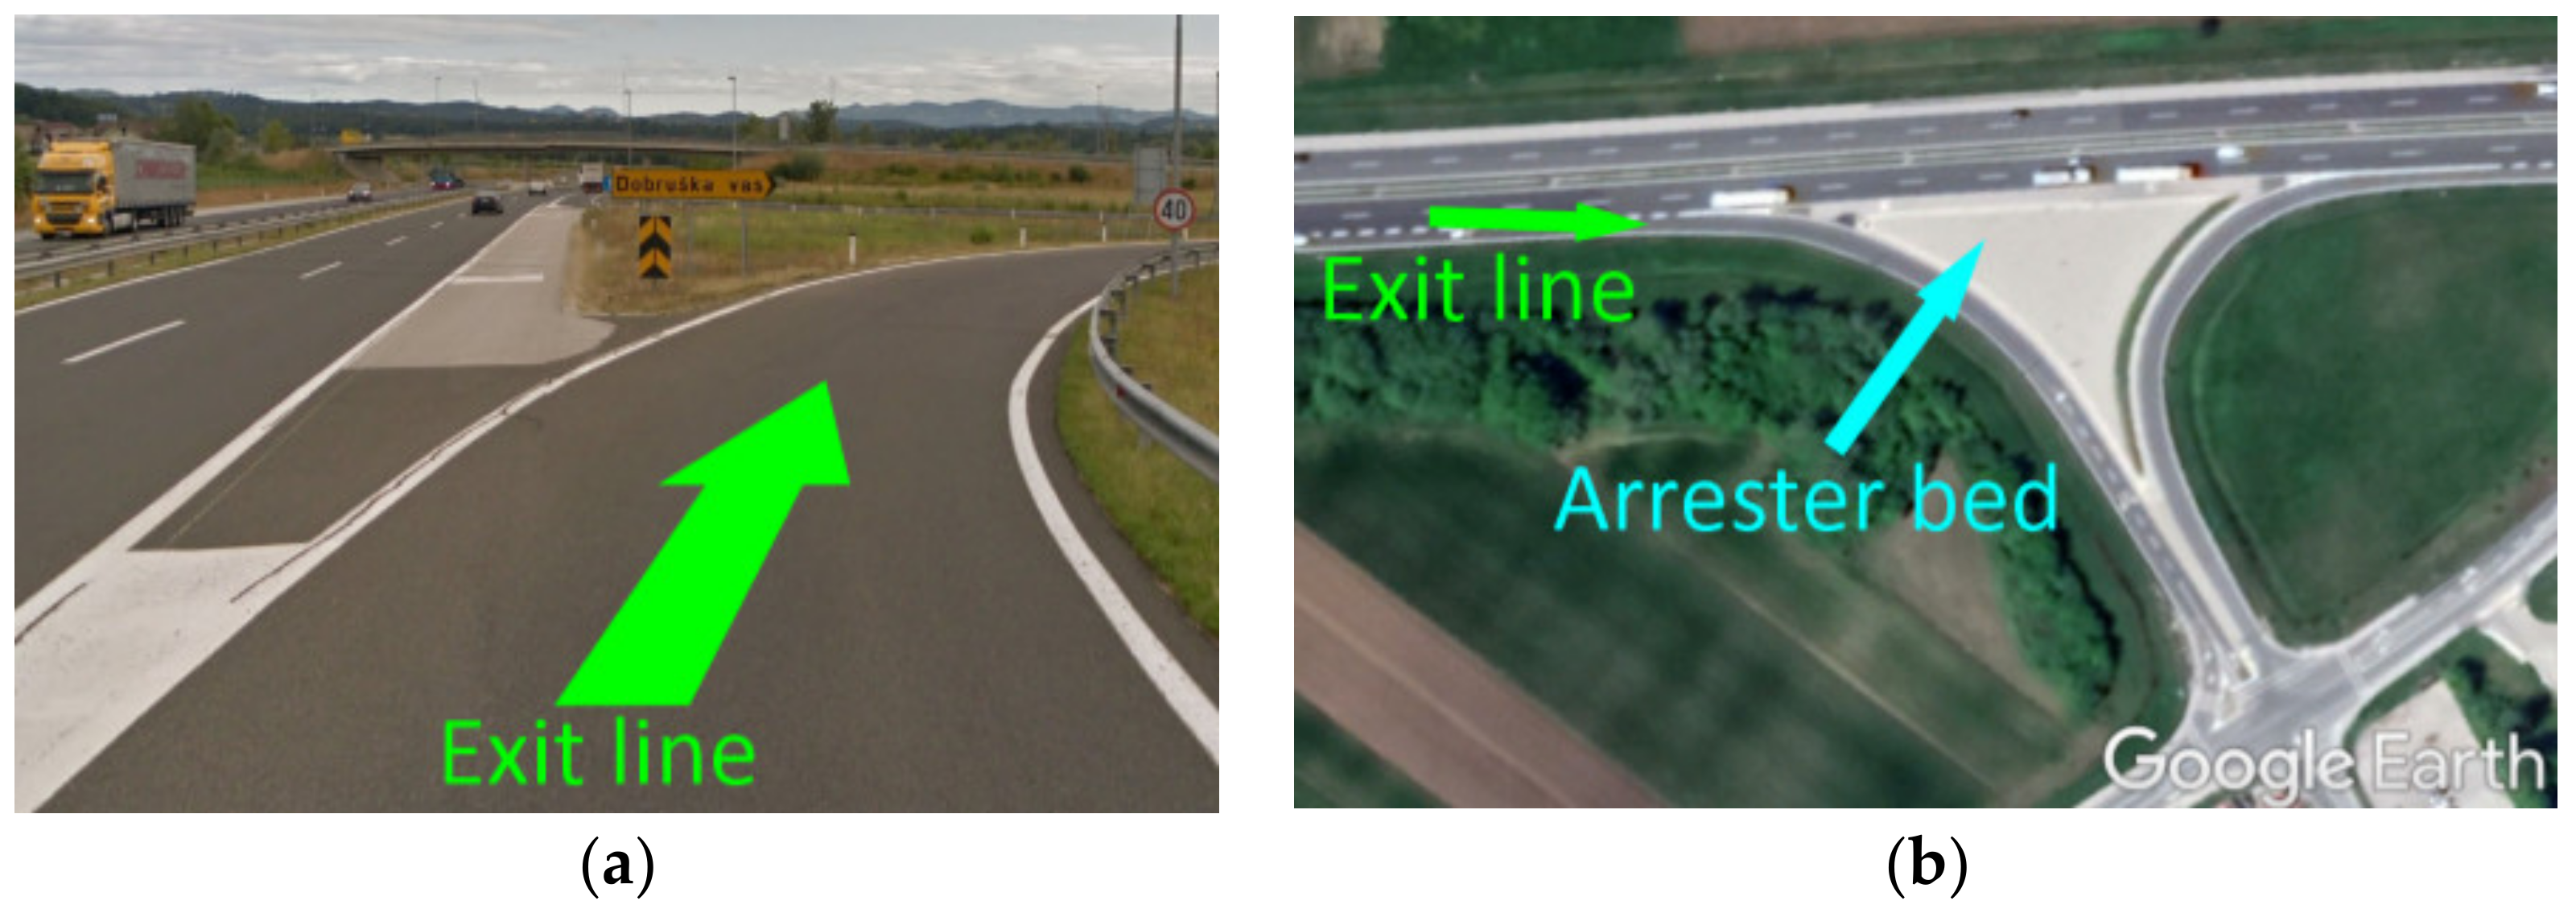
According to an EU traffic safety report [6], in most countries 40%–60% of all accidents occur at road junctions, which implies that special attention should be paid to increase the safety at these intersections. The existing infrastructure of safety barriers has proved to be inadequate, since sharp angles are present at the exit line of motorways and vehicles can hit the barrier at its corner or impact on it at higher angles, which can have fatal consequences. Gravel-filled arrester beds are currently being investigated as a potential response that can further improve the safety of the exit lines of highways. An example is shown in Figure 1.
Stopping a vehicle without it colliding with objects such as a steel or concrete barrier is an attractive and sustainable option for heavy-goods vehicles as well as for lighter passenger vehicles. In order to increase highway safety, various designs of safety escape ramps are used as a measure to control the behaviour of errant vehicles, decelerating them, in the case of running off the road, as rapidly as possible, but within acceptable limits and without causing injuries to the occupants. The commonly used escape ramps can be divided into three categories: gravity escape ramps, sand or gravel ramps, and arrester-bed escape ramps [7]. Apart from the most commonly used sand and gravel arrester beds, closed-cell foamed-concrete arresters are used as an alternative and effective material for roads and airstrips [7,8].
Gravel-filled arrester beds are a proven safety measure for stopping heavy road vehicles in the case of brake-system failures. Several studies and reports [9,10,11,12,13,14,15,16,17] have confirmed they are an efficient measure for this purpose. Their designs have been unified and accepted as part of design manuals, such as the one issued by the Pennsylvania Department of Transportation [18]. Gravel zones have also long been a standard measure for stopping runaway vehicles in various categories of closed-circuit motor racing [19]. Due to their low cost and efficiency, gravel-filled arrester beds also lend themselves to being safety measures on public highways. The efficiency of arrester beds in terms of reducing the speed of lighter vehicles, however, has not yet been thoroughly investigated. The only publicly available study that deals with experimental measurements of the deceleration of light passenger vehicles in gravel-filled arrester beds is the study of Cocks and Goodram [11], which dates back to the early 1980s. Some recent studies [20,21,22,23] have dealt with numerical modelling and the simulation of vehicle motion on various forms of gravel areas and obtained results that differ from those acquired experimentally. Therefore, the purpose of the work presented in this article was to experimentally test the suitability of gravel-filled arrester beds for reducing the speed of passenger cars if they leave the roadway on a highway and to apply this knowledge to building arresting beds and increasing the safety of exit lines on highways.
2. Materials and Methods
The experiments were designed to measure the deceleration-time curves of two types of passenger vehicles as they were driven into a gravel-filled arrester bed under different driving regimes, according to the regulations for road-safety barriers in the relevant parts of the EN 1317 standard [24,25,26,27]: a lighter passenger car (900 ± 40 kg) and a heavier passenger car (1500 ± 75 kg), as shown in Figure 2. The actual weight of the vehicles, including the driver and the in-vehicle equipment, was measured on a certified weighing device to the nearest 25 kg and was 925 kg for the lighter vehicle and 1475 kg for the heavier vehicle. Both vehicles were technically inspected before testing and complied with the national roadworthiness regulations. The vehicle parameters such as tyre dimensions and pressures were set according to the manufacturers’ specifications.
The arrester bed for the tests was built on a curve on a closed road of a racing circuit and consisted of a 0.5 m-deep cavity filled with 16–32 mm round gravel according to the requirements for unbound materials for civil engineering work and road construction [28]. This granularity of gravel is generally recommended for truck escape ramps in most reports and design guidelines [15,16,17,18]. The test arrester bed was of trapezoidal shape, measuring just over 55 m in length and 9 to 26 m in width. The minimum depth of the non-bound aggregate was 0.5 m. The gravel was brought to the test arrester bed as several loads of a tipper truck. It was spread and levelled using an earthmover. Once the gravel was spread it was not processed any further, either by fluffing or compacting. This procedure closely resembles the procedure used for building arrester beds on public roads. Figure 3 shows the shape of the planned arrester bed as the hatched area on an orthophotographic image of the location.
2.1. Testing Protocol
The testing protocol included tests with two different modes of the vehicle entering the arrester bed. One set of tests was carried out with the vehicle entering at a right angle, the other set was carried out with the vehicle entering the arrester bed at an acute angle of 20 degrees. Both sets of tests were performed with the two vehicles. During all the tests the vehicles were driven by a professional, licensed racing driver with long-term practical experience of gravel-track racing. The assessment of the expected loads on the driver during the tests did not require the use of special safety equipment, beyond the safety belts and airbags already installed in the vehicles.
In each test, the vehicle was accelerated in an approximately straight line towards the arrester bed in a way that it reached the target entry velocity just before entering the gravel of the arrester bed with one or both of its front wheels. The desired target entry velocities were communicated to the driver, who adjusted the actual vehicle velocity according to the Global Navigation Satellite System (GNSS) velocity reading on the measurement computer. Upon entering the arrester bed, the vehicle was allowed to coast to a complete stop without braking or steering. The entry velocity of the vehicle was gradually increased for each consecutive test from approximately 40 km/h to approximately 78 km/h, the latter being determined as the maximum achievable speed for the given vehicle-roadway combination. Besides the regular tests with the vehicle coasting without braking as per [24], some additional tests were performed with the vehicle braking upon entering the arrester bed and some tests with the vehicle mass increased by one-third. A summary of the tests performed is presented in Table 1.
2.2. Measurement Equipment
The following equipment was used to measure the relevant quantities during each test:
- Vericom VC4000 DAQ measurement computer [29] with built-in tri-axial accelerometer (measuring range ±2 g) and angular-velocity sensor (position 1 in Figure 4). The device was set up to continuously record the sensor data with a rate of 100 samples per second from the vehicle start to its complete stop during each test.
- GNSS (Global Navigation Satellite System) receiver for vehicle geolocation and velocity acquisition (mounted on the outside of the vehicle roof). The reading from this sensor was displayed in real time on the VC4000 display and was used as the control value for the driver to match the required target velocity.
- Two external tri-axial accelerometers with a ±25 g measuring range, mounted on the driver’s head (position 2 in Figure 4) and thorax (position 3 in Figure 4). These devices were attached directly to the driver’s body with adhesive tape. Their acceleration readings were used to evaluate the load on the human body with standardised injury criteria.
- Two separate measuring devices for measuring the acceleration control values, mounted near the vehicle’s centre of gravity and on its rear window (positions 4 and 5 in Figure 4). The readings from these devices were used to control the correctness of the other vehicle-mounted accelerometer data and were not directly used in the evaluation of the results.
- One external tri-axial accelerometer with a ±25 g measuring range, mounted on the unsprung part of the vehicle’s front suspension (position 6 in Figure 5). The data from this sensor was used as a control and was not directly used in the evaluation of the results.
- Wide-angle digital video camera for recording the driver’s motion during the tests (mounted on the inside of the passenger-side door window).
An aerial view of the equipment setup with measurement-post annotations is shown in Figure 6. On the wider testing area, the following measurement equipment was placed and used:
- High-speed camera for recording and tracking the vehicle velocity immediately on entering the arrester bed area (position 1 in Figure 6).
- High-speed camera for recording the experiment in gross-plan (position 2 in Figure 6).
- Remote-controlled unmanned aerial vehicle (UAV) with a digital video camera for recording the aerial view of the experiment (as shown in Figure 6).
- Several high-definition digital video cameras for recording the experiment from different viewing angles (positions 2, 4, 5 and 6 in Figure 6).
Sample video recordings from the cameras are available as supplemental material to this article (Please see Supplementary Materials).
2.3. Determining the Inital Velocity of the Vehicle
The velocity of the vehicle entering the arrester-bed area is used as the initial condition in the simulations and thus has to be measured as accurately as possible. Although the entry velocity was measured with the GNSS receiver, these values cannot be considered reliable and accurate due to the limitations of velocity measurements with GNSS systems [30].
To measure the entry velocity with a higher degree of accuracy, a high-speed camera system was employed. Vehicles were recorded on the video just before entering the arrester bed by means of a FASTCAM Ultima 512 high-speed camera placed perpendicular to the vehicle’s trajectory and the recording was made with a frame rate of 2000 fps and the highest available resolution of 512 × 512 pixels. The video files were then analyzed by tracking the template sample (Marker 1 in Figure 7) through the frames using the Tracker Video Analysis and Modeling Tool [31].
To ensure the best quality match between the template sample defined on the key frame and its evolution samples, only a 5% evolution rate was allowed, while the match score level was set to a maximum value of 10. The distance of 1.1 m between the two markers on the side of the vehicle was used as the calibration distance for defining the length of a pixel. The entry velocity was extracted at the moment when the sampling marker (Marker 1) passed through the origin location, which was placed centrally in the frame, representing the vehicle just before entering the arrester bed with its front wheels. The results for the entry velocity for all the tests, along with other measured and calculated values, are presented in Table 2 in the Results section.
2.4. Processing of Measured Data
The data recorded using the VC4000DAQ measurement computer was transferred to a PC and imported into OriginLab software for processing. From the time series of the measured quantities, the following parameters were extracted and calculated:
- GNSS velocity of the vehicle entering the arrester bed.
- Maximum deceleration of the vehicle body during its movement over the arrester bed.
- Maximum deceleration of the driver’s head and thorax during the vehicle’s movement over the arrester bed.
- Average deceleration of the vehicle body during its movement over the arrester bed, calculated as per Equation (1),where t0,1 is the time when the deceleration first exceeds 0.1 g, t0 the time when the deceleration reaches a zero value after the vehicle had stopped, and ns is the number of measurement samples between those two times.
- The head-injury criterion (HIC) curve for each test, calculated from the measured accelerations of the driver’s head, as per Equation (2), as defined in [32],where the time difference between the interval end time t2 and interval start time t1 for integrating the acceleration curve a(t) was 20 ms. The maximum value was calculated for the entire duration of the vehicle driving over the arrester bed.
Other relevant quantities were measured after each test using hand measuring tools and techniques. These quantities included the following:
- The vehicle’s stopping distance (Figure 8a,b). This was measured from the gravel bed entrance to the axle of the front wheels of the stopped vehicle. In the tests at 20°, the distances for the left and right front wheels were measured separately.
- The depth of the vehicle wheel trail in the gravel (Figure 8c). This was measured twice for each test, once in the first one-third of the stopping distance and once in the last one-third of the stopping distance. The measurements for the left and right tracks were not significantly different and were therefore averaged to obtain the final result.
An example chart of the recorded and calculated quantities is shown in Figure 9.
3. Results
The results of the experiments consist of measured quantities and general observations derived from the acquired video material. After processing the acquired data, we compiled a summary of the results, which is presented in Table 2. The tests with braking and/or an increased vehicle load (#s 5-10, 19 and 21), not required by EN 1317, are included for reference.
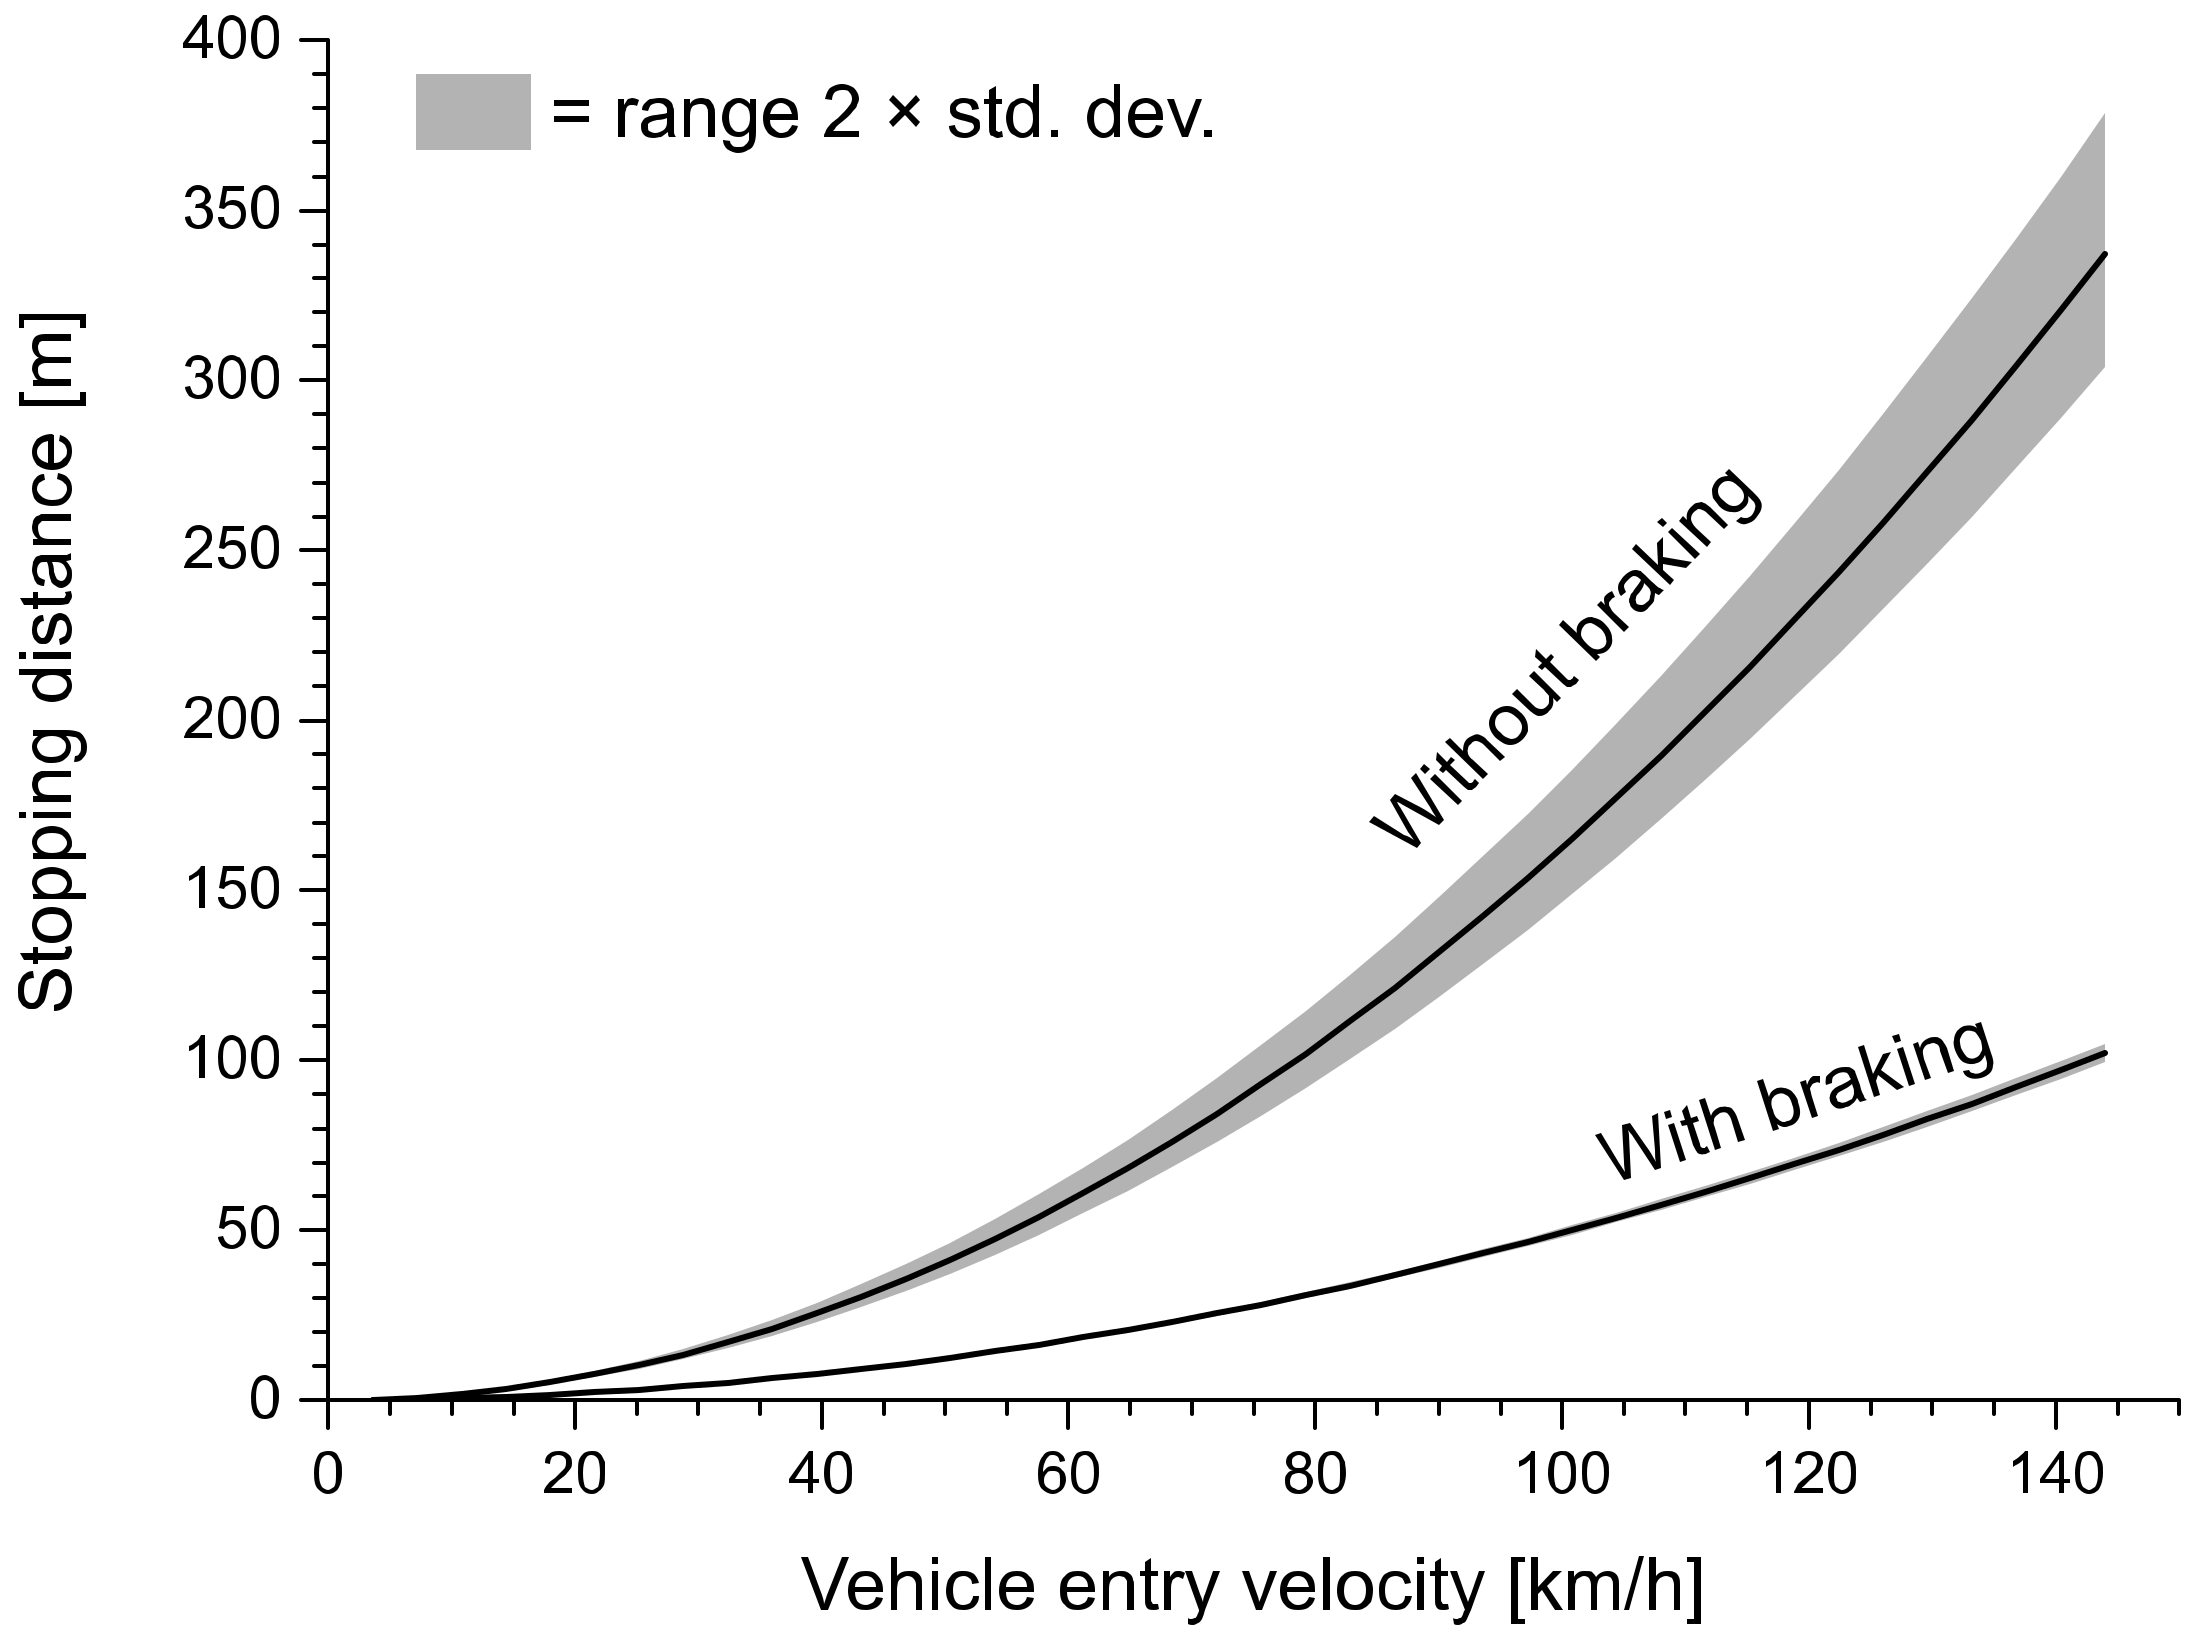
To verify the repeatability of the tests the basic statistics were calculated for the populations of the measured average decelerations in relevant groups of tests. The data in the groups is partially overlapping to analyse the influence of the parameters. The tests with partial braking (#s 11, 15 and 18–21) have been excluded from the statistical analysis. Nevertheless, their results are valuable for observations of the influence of braking on the vehicle motion. The statistics are presented in Table 3. From these values the theoretical stopping distances were calculated and the ranges are presented in Figure 10 as functions of the vehicle’s entry velocity for the average measured average decelerations for tests with and without braking. These data are essential for evaluating the suitability of the gravel arrester beds for stopping the vehicles.
4. Discussion
Striving to contribute to achieving the sustainable development goals by improving traffic safety, the road authorities in some European countries have recently started searching for safer and more sustainable solutions for stopping runaway vehicles and building gravel arrester beds as pilot projects. From the literature review presented in the Introduction it is obvious that very few high-quality measurements of the achievable decelerations for passenger cars on gravel arrester beds have been published to date. This lack of reliable measurement results is making the selection of the parameters for new arrester beds difficult. Designing and performing a full-scale test to obtain the missing data was thus a necessity.
The initial visual observation made right after the first test was that the gravel arrester bed does not stop a coasting vehicle as efficiently as expected. This was confirmed by the measurements, where the average deceleration never exceeded 0.294 g, with peak values only up to 0.506 g. As the EN 1317 prescribes testing with vehicles without braking, this puts the efficiency of gravel arrester beds in question—at least those filled with gravel sized 16–32 mm. From the statistics on the entire set of tests without braking (cf. Table 3) it is also obvious that the parameter variation (such as the vehicle weight, entry angle, or entry velocity) has very little influence on the achievable average decelerations.
The average deceleration values become significantly higher if the vehicle brakes in the gravel, but even then the average deceleration values only marginally exceed those achieved during braking measured on dry tarmac, as published in [33,34]. Furthermore, from test #21 in Table 2 it can be observed that braking with an anti-lock brake system (ABS), which is standard equipment in all new vehicles, does not significantly increase the average deceleration values.
The tests of the vehicle with added weight also show that a heavier vehicle does not necessarily achieve a greater deceleration compared to a lighter one.
The loads on the vehicle occupant are far below the injury values according to the measured head accelerations and computed head-injury criterion (HIC) values.
The high costs and demanding logistics of full-scale testing prevented the parameter variation in the study from including different granularities for the gravel used in the arrester bed. The initial experimental work was made only with the arrester bed filled with the 16–32 mm gravel, which is the granularity prescribed by the current regulations and guidelines. This is the main limitation of the study, which the authors plan to address in further research into the influence of the gravel’s properties on the forces they exert on vehicles driving on them.
5. Conclusions
The obtained data, consisting primarily of measured kinematic values but also several hundred photographs and several hours of recorded video material, provides an insight into the behavior of passenger cars on gravel arrester beds and presents a foundation for all future research. The test results show that a gravel-filled arrester bed with a gravel granularity of 16–32 mm can decelerate a free-coasting passenger car with an average deceleration of up to 0.294 g (2.88 m/s2). This means that to bring such a car running off the road with a highway speed of 130 km/h to a complete stop would require a 226 m-long arrester bed. The average deceleration on the arrester bed can be significantly increased by braking the vehicle. In this case, the highest average deceleration values of 0.812 g (7.97 m/s2) were measured, requiring an 82 m-long arrester bed to stop the vehicle from 130 km/h. These distances, even when assuming braking, are often longer than the available space on the motorway exit ramps, where the arrester beds are planned to be located.
Indications show that different gravel granularities and grain shapes may result in different average decelerations of vehicles driving over an arrester bed. Preliminary tests indicate that in general the achievable decelerations are higher when the gravel grains are rounder and have a smaller diameter. An investigation of this phenomenon requires further testing, which will yield a mathematical model of the relationship between those parameters. Prior to testing on a full-scale arrester bed with different gravel types, the authors intend to perform a set of laboratory tests on a falling-ball test stand in order to determine the differences in the response of different material types in a controlled and repeatable manner. If the differences between these different gravel types prove significant, more full-scale testing is planned. The findings of those tests will significantly contribute to the input data, based on which the authorities will decide how (and if at all) to implement the gravel-filled arrester beds as a routine measure on the public road network. The other factors contributing to the decision will be the parameters related to economics and ease of maintenance.
The work presented in this article and the results of further research will help in devising the best practices in safe road infrastructure design for achieving the sustainable development goals.
Supplementary Materials
The following are available online at https://www.mdpi.com/2071-1050/12/5/1761/s1, Video S1: Sample test with 900-kg vehicle at 45 km/h without braking, Video S2: Sample test with 900-kg vehicle at 50 km/h with braking, Video S3: Sample test with 1500-kg vehicle at 50 km/h without braking, Video S4: Sample test with 1500-kg vehicle at 78 km/h with braking.
Author Contributions
M.A. designed the experiment, led the experimental work and the analysis of the results, and wrote the initial version of the manuscript; J.T. analyzed the vehicle entry velocities using video analyses, R.K. was the research project leader and responsible for the project management. All three authors have participated in equal shares in the field testing, analysis of the results and preparation of the final manuscript. All authors have read and agreed to the published version of the manuscript.
Funding
The work presented in this article was funded by DARS (the Slovenian Motorway Company) from the contract 879/2019 and by the Slovenian Research Agency as part of the “Modelling in technics and medicine” (code P2-0109) research programme.
Acknowledgments
The authors wish to acknowledge the help of members and students of the Department of Modelling in Engineering Sciences and Medicine at the Faculty of Mechanical Engineering, University of Ljubljana, for their help in the field testing. Without it, the realisation of the project would not be possible.
Conflicts of Interest
The authors declare no conflict of interest.
References
- World Health Organization. Fact Sheets on Sustainable Development Goals: Health Targets, Road Safety; WHO: Copenhagen, Denmark, 2017. [Google Scholar]
- United Nations Conference on Trade and Development. Road Safety Considerations in Support of the 2030 Agenda for Sustainable Development; United Nations: New York, NY, USA, 2017. [Google Scholar]
- European Comission. Towards a Sustainable Europe by 2030; European Comission: Brussels, Belgium, 2019. [Google Scholar]
- Wegman, F.; Dijkstra, A.; Schermers, G.; van Vliet, P. Sustainable Safety in the Netherlands: The Vision, the Implementation and the Safety Effects; SWOW: Leidschendam, The Netherlands, 2005. [Google Scholar]
- Dupré, G.; Bisson, O.; CETE, FR.; The RISER Consortium. Roadside Infrastructure for Safer European Roads: D05: Summary of European Design Guidelines for Roadside Infrastructure; Chalmers University of Technology: Gothenburg, Sweden, 2006. [Google Scholar]
- European Commission, Junctions | Mobility and Transport. Available online: https://ec.europa.eu/transport/road_safety/specialist/knowledge/road/getting_initial_safety_design_principles_right/junctions_en (accessed on 11 February 2020).
- Capuano, F.A.; Heymsfield, E.; Li, N. Alternative arresting system design for truck escape ramps. Int. J. Crashworthiness 2018, 23, 618–626. [Google Scholar] [CrossRef]
- San Filippo, W.K.; DeLong, H. Engineered materials arresting system (EMAS): An alternative solution to runway overruns. In Designing, Constructing, Maintaining, and Financing Today’s Airport Projects; ASCE: Reston, VA, USA, 2002; pp. 1–12. [Google Scholar] [CrossRef]
- Jehu, V.J.; Laker, I.B. Vehicle Decelerations in Beds of Natural and Artificial Gravel; Road Research Laboratory: Crowthorne, UK, 1969. [Google Scholar]
- Allison, J.R.; Hahn, K.C.; Bryden, J.E. Performance of a Gravel-Bed Truck-Arrester System. Transp. Res. Record 1979, 736, 43–47. [Google Scholar]
- Cocks, G.C.; Goodram, L.W. The design of Vehicle Arrester Beds. In Proceedings of the Eleventh Australian Road Research Board Conference, Melbourne, Australia, 23–27 August 1982. [Google Scholar]
- Pigman, J.G.; Agent, K.R. Evaluation of Truck Escape Ramps; Technical report No. UKTRP-85-3; Kentucky Transportation Cabinet: Lexington, KY, USA, 1985. [Google Scholar]
- Wang, M.C. Aggregate Testing for Construction of Arrester Beds. In Transportation Research Record 1250; Transportation Research Board, National Research Council: Washington, DC, USA, 1989; pp. 1–7. [Google Scholar]
- Sitkei, G.Y. Sinkage and Rolling Resistance of Wheels, Some new results on an old problem. Prog. Agric. Eng. Sci. 2015, 11, 85–94. [Google Scholar] [CrossRef] [Green Version]
- Outcalt, W. Evaluation of Truck Arrester Beds in Colorado; Technical report No. CDOT-2008-1; Colorado Department of Transportation, Research Branch: Denver, CO, USA, 2008. [Google Scholar]
- Valdes Vasquez, R.; Strong, K.; Shuler, S. Emergency Escape Ramps (EER) Improvements; Technical Report No. CDOT-2018-20; Colorado Department of Transportation, Applied Research and Innovation Branch: Denver, CO, USA, 2018. [Google Scholar]
- Apronti, D.T.; Saha, P.; Moomen, M.; Ksaibati, K. Truck safety evaluation on Wyoming mountain passes. Accid. Anal. Prev. 2019, 122, 342–349. [Google Scholar] [CrossRef] [PubMed]
- Pennsylvania Department of Transportation. Design Manual, Part 2, Highway Design; Pennsylvania Department of Transportation: Harrisburg, PA, USA, 2016. [Google Scholar]
- Fédération Internationale de Motocyclisme. FIM Standards for Track Racing Circuits (STRC); Fédération Internationale de Motocyclisme: Mies, Switzerland, 2018. [Google Scholar]
- Hambleton, J.P.; Drescher, A. Modeling wheel-induced rutting in soils: Rolling. J. Terramechanics 2009, 46, 35–47. [Google Scholar] [CrossRef]
- Mohamed, A.; Gutierrez, M. Comprehensive study of the effects of rolling resistance on the stress–strain and strain localization behavior of granular materials. Granular Matter. 2010, 12, 527–541. [Google Scholar] [CrossRef]
- Greto, K.A. Reliability Analysis of Truck Escape Ramp Design; University of Toronto: Scarborough, TO, Canada, 2015. [Google Scholar]
- Qin, P.; Wang, J.; Qin, G.; Chen, M.; Meng, Q. Numerical study of the stopping distance for runaway vehicle on truck escape ramp by using the improved equation of car driving. IOP Conf. Series Mater. Sci. Eng. 2019, 542. [Google Scholar] [CrossRef]
- EN 1317-1:2010: E: Terminology and General Criteria for Test Methods; European Committee for Standardization: Brussels, Belgium, 2010.
- EN 1317-2: 2010: E: Performance Classes, Impact Test Acceptance Criteria and Test Methods for Safety Barriers Including Vehicle Parapets; European Committee for Standardization: Brussels, Belgium, 2010.
- EN 1317-5: 2007+A2:2012/AC: Product Requirements and Evaluation of Conformity for Vehicle Restraint Systems; European Committee for Standardization: Brussels, Belgium, 2012.
- EN 1317-7: 2012: Performance Classes, Impact Test Acceptance Criteria and Test Methods for Terminals of Safety Barriers; European Committee for Standardization: Brussels, Belgium, 2012.
- EN 13242: Aggregates for Unbound and Hydraulically Bound Materials for Use in Civil Engineering Work and Road Construction; European Committee for Standardization: Brussels, Belgium, 2013.
- Vericom LLC. Vericom VC4000 DAQ—Accelerometer Computer + Software + GPS. Available online: https://www.vericomcomputers.com/products/performance-computers/vc4000daq (accessed on 13 January 2020).
- Dyukov, A.; Choy, S.; Silcock, D. Accuracy of Speed Measurements using GNSS in Challenging Environments. Asian J. Appl. Sci. 2015, 3, 794–810. [Google Scholar]
- Tracker Video Analysis and Modeling Tool for Physics Education. Available online: https://physlets.org/tracker/ (accessed on 13 January 2020).
- National Highway Traffic Safety Administration. Occupant Crash Protection—Head Injury Criterion S6.2 of MVSS 571.208, Docket 69-7, Notice 17; NHTSA: Washington, DC, USA, 1972. [Google Scholar]
- Vangi, D.; Virga, A. Evaluation of emergency braking deceleration for accident reconstruction. Veh. Syst. Dyn. 2007, 45, 895–910. [Google Scholar] [CrossRef]
- Greibe, P. Braking Distance, Friction and Behaviour. Findings, Analyses and Recommendations Based on Braking Trials; Trafitec: Lyngby, Denmark, 2007. [Google Scholar]
Figure 1.
Arrester bed built as a pilot project on the E70 motorway near Dobruška vas, Slovenia: (a) situation before building the arrester bed, (b) orthophotography of the completed arrester bed (source of both images: Google Earth).
Figure 1.
Arrester bed built as a pilot project on the E70 motorway near Dobruška vas, Slovenia: (a) situation before building the arrester bed, (b) orthophotography of the completed arrester bed (source of both images: Google Earth).

Figure 2.
Vehicles used in the tests: (a) 900 kg vehicle (Renault Clio), (b) 1500 kg vehicle (Renault Laguna Break).
Figure 2.
Vehicles used in the tests: (a) 900 kg vehicle (Renault Clio), (b) 1500 kg vehicle (Renault Laguna Break).
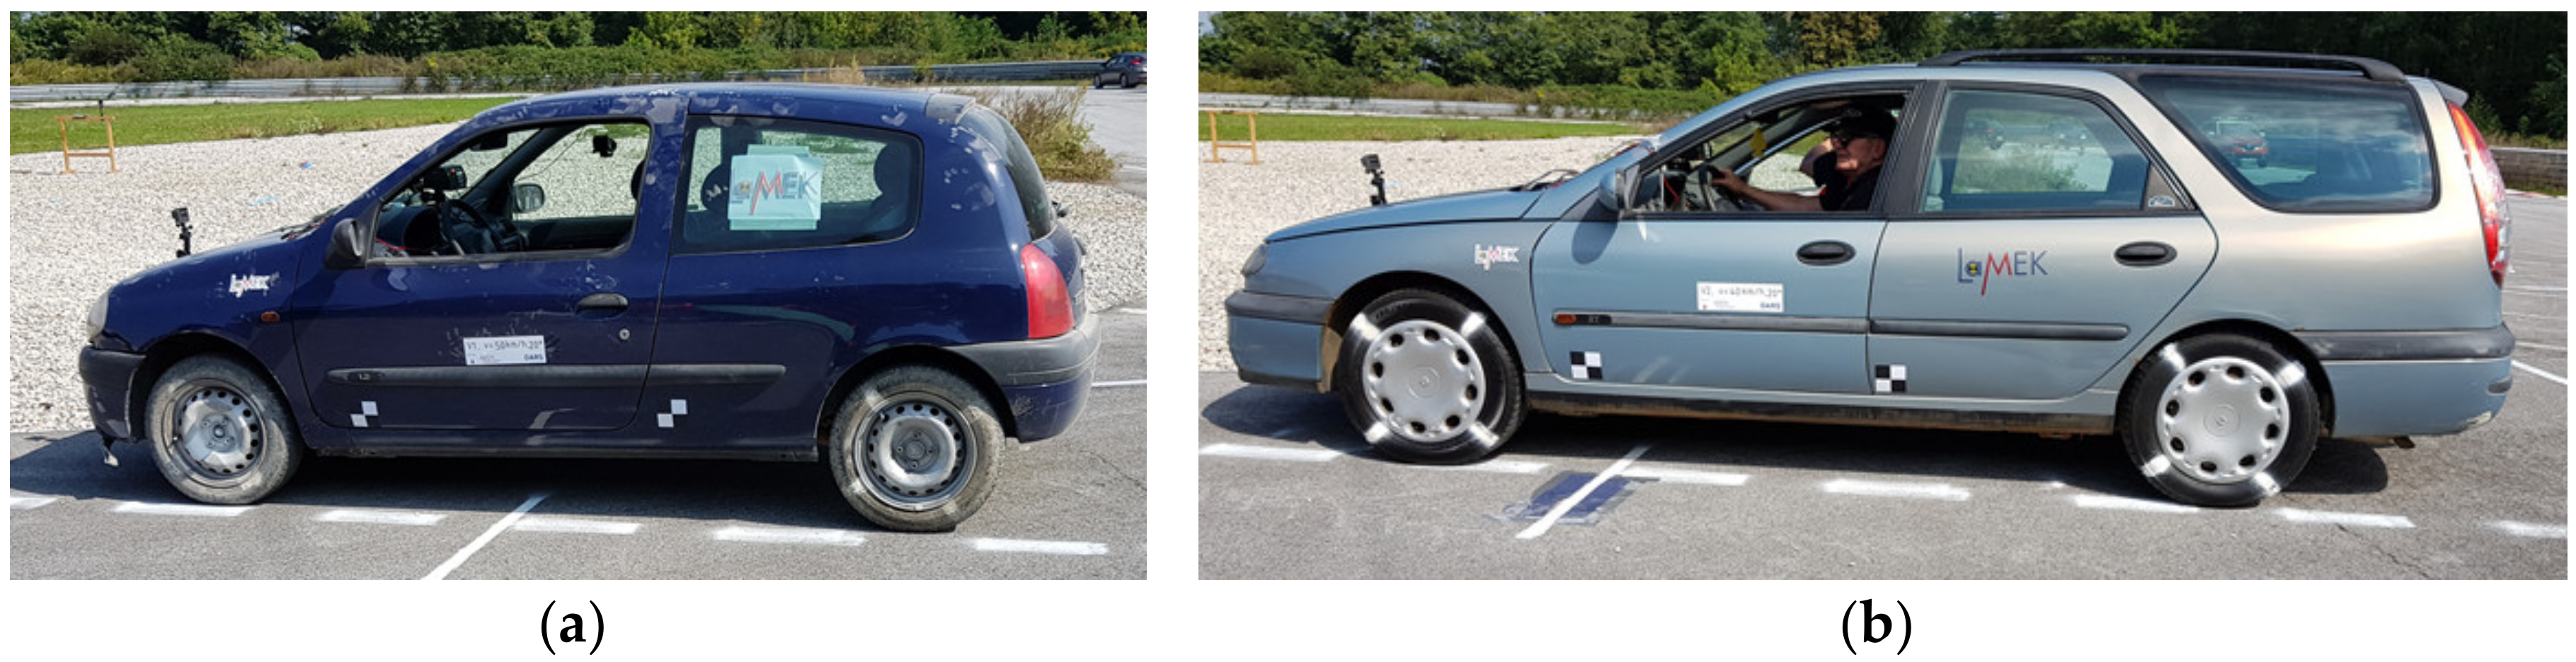
Figure 3.
Shape of the arrester bed on an ortophotographic image (image source: Google Earth).
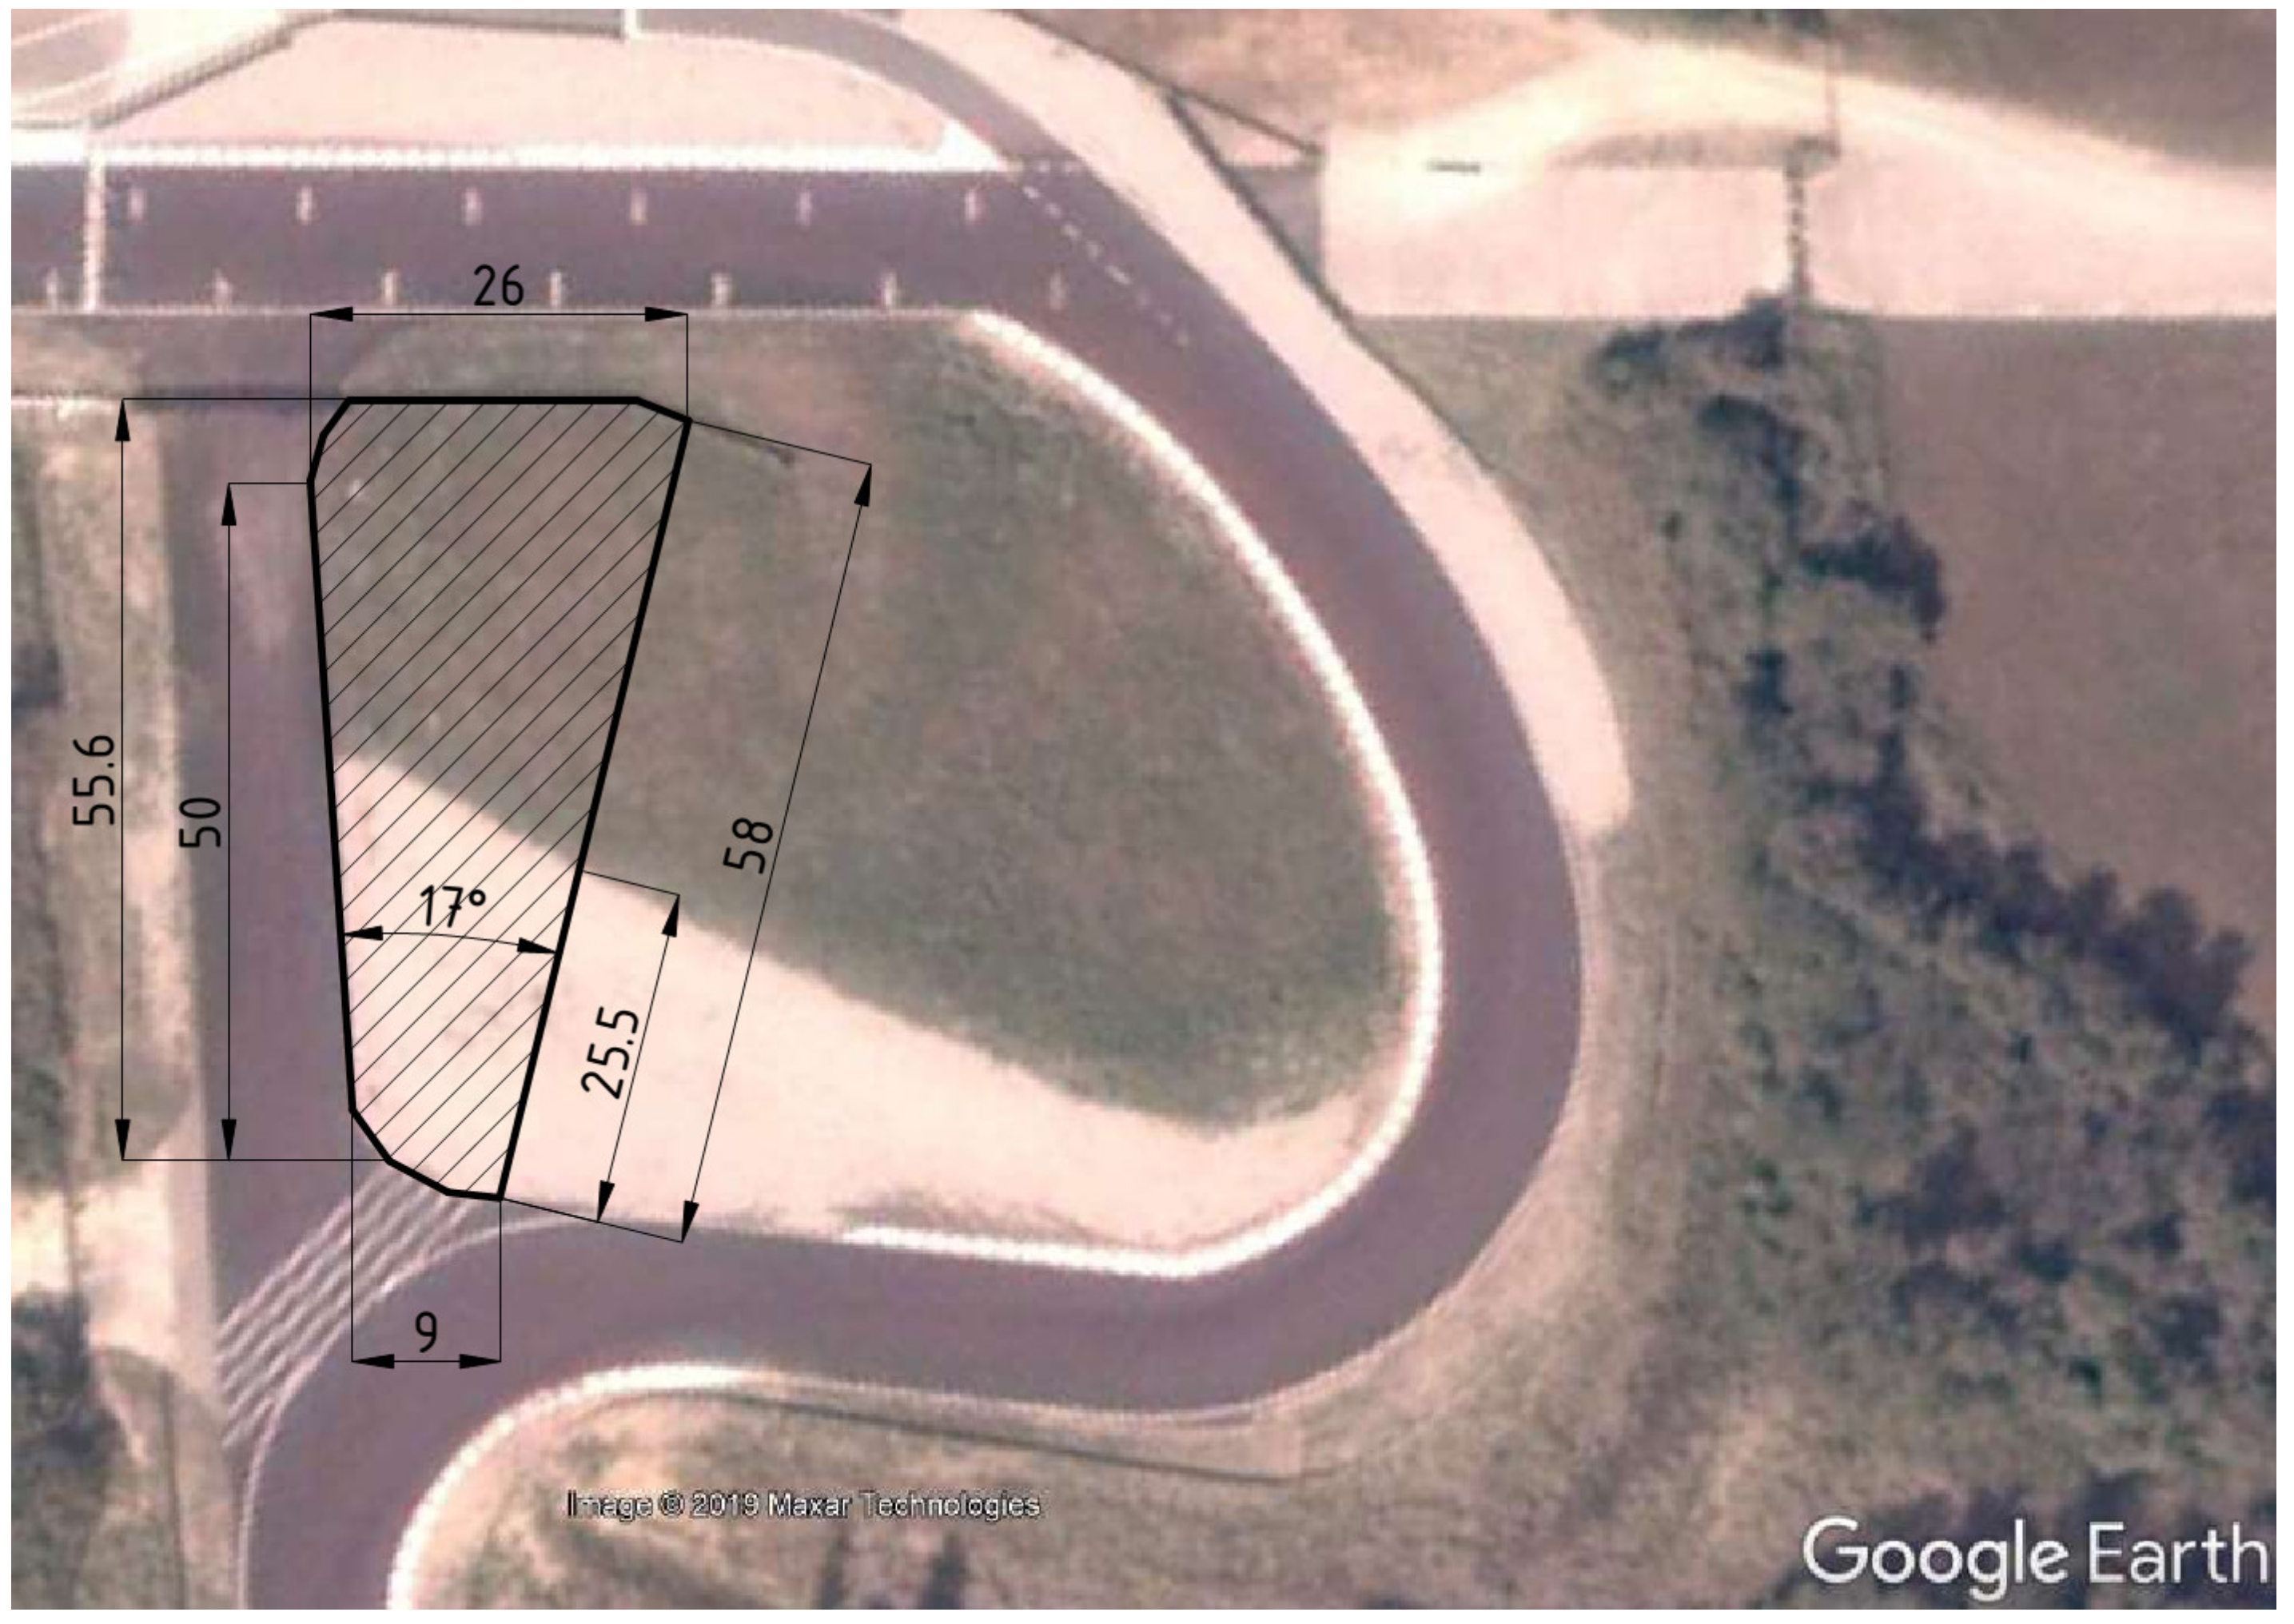
Figure 4.
Components of the measurement system in the test vehicle.
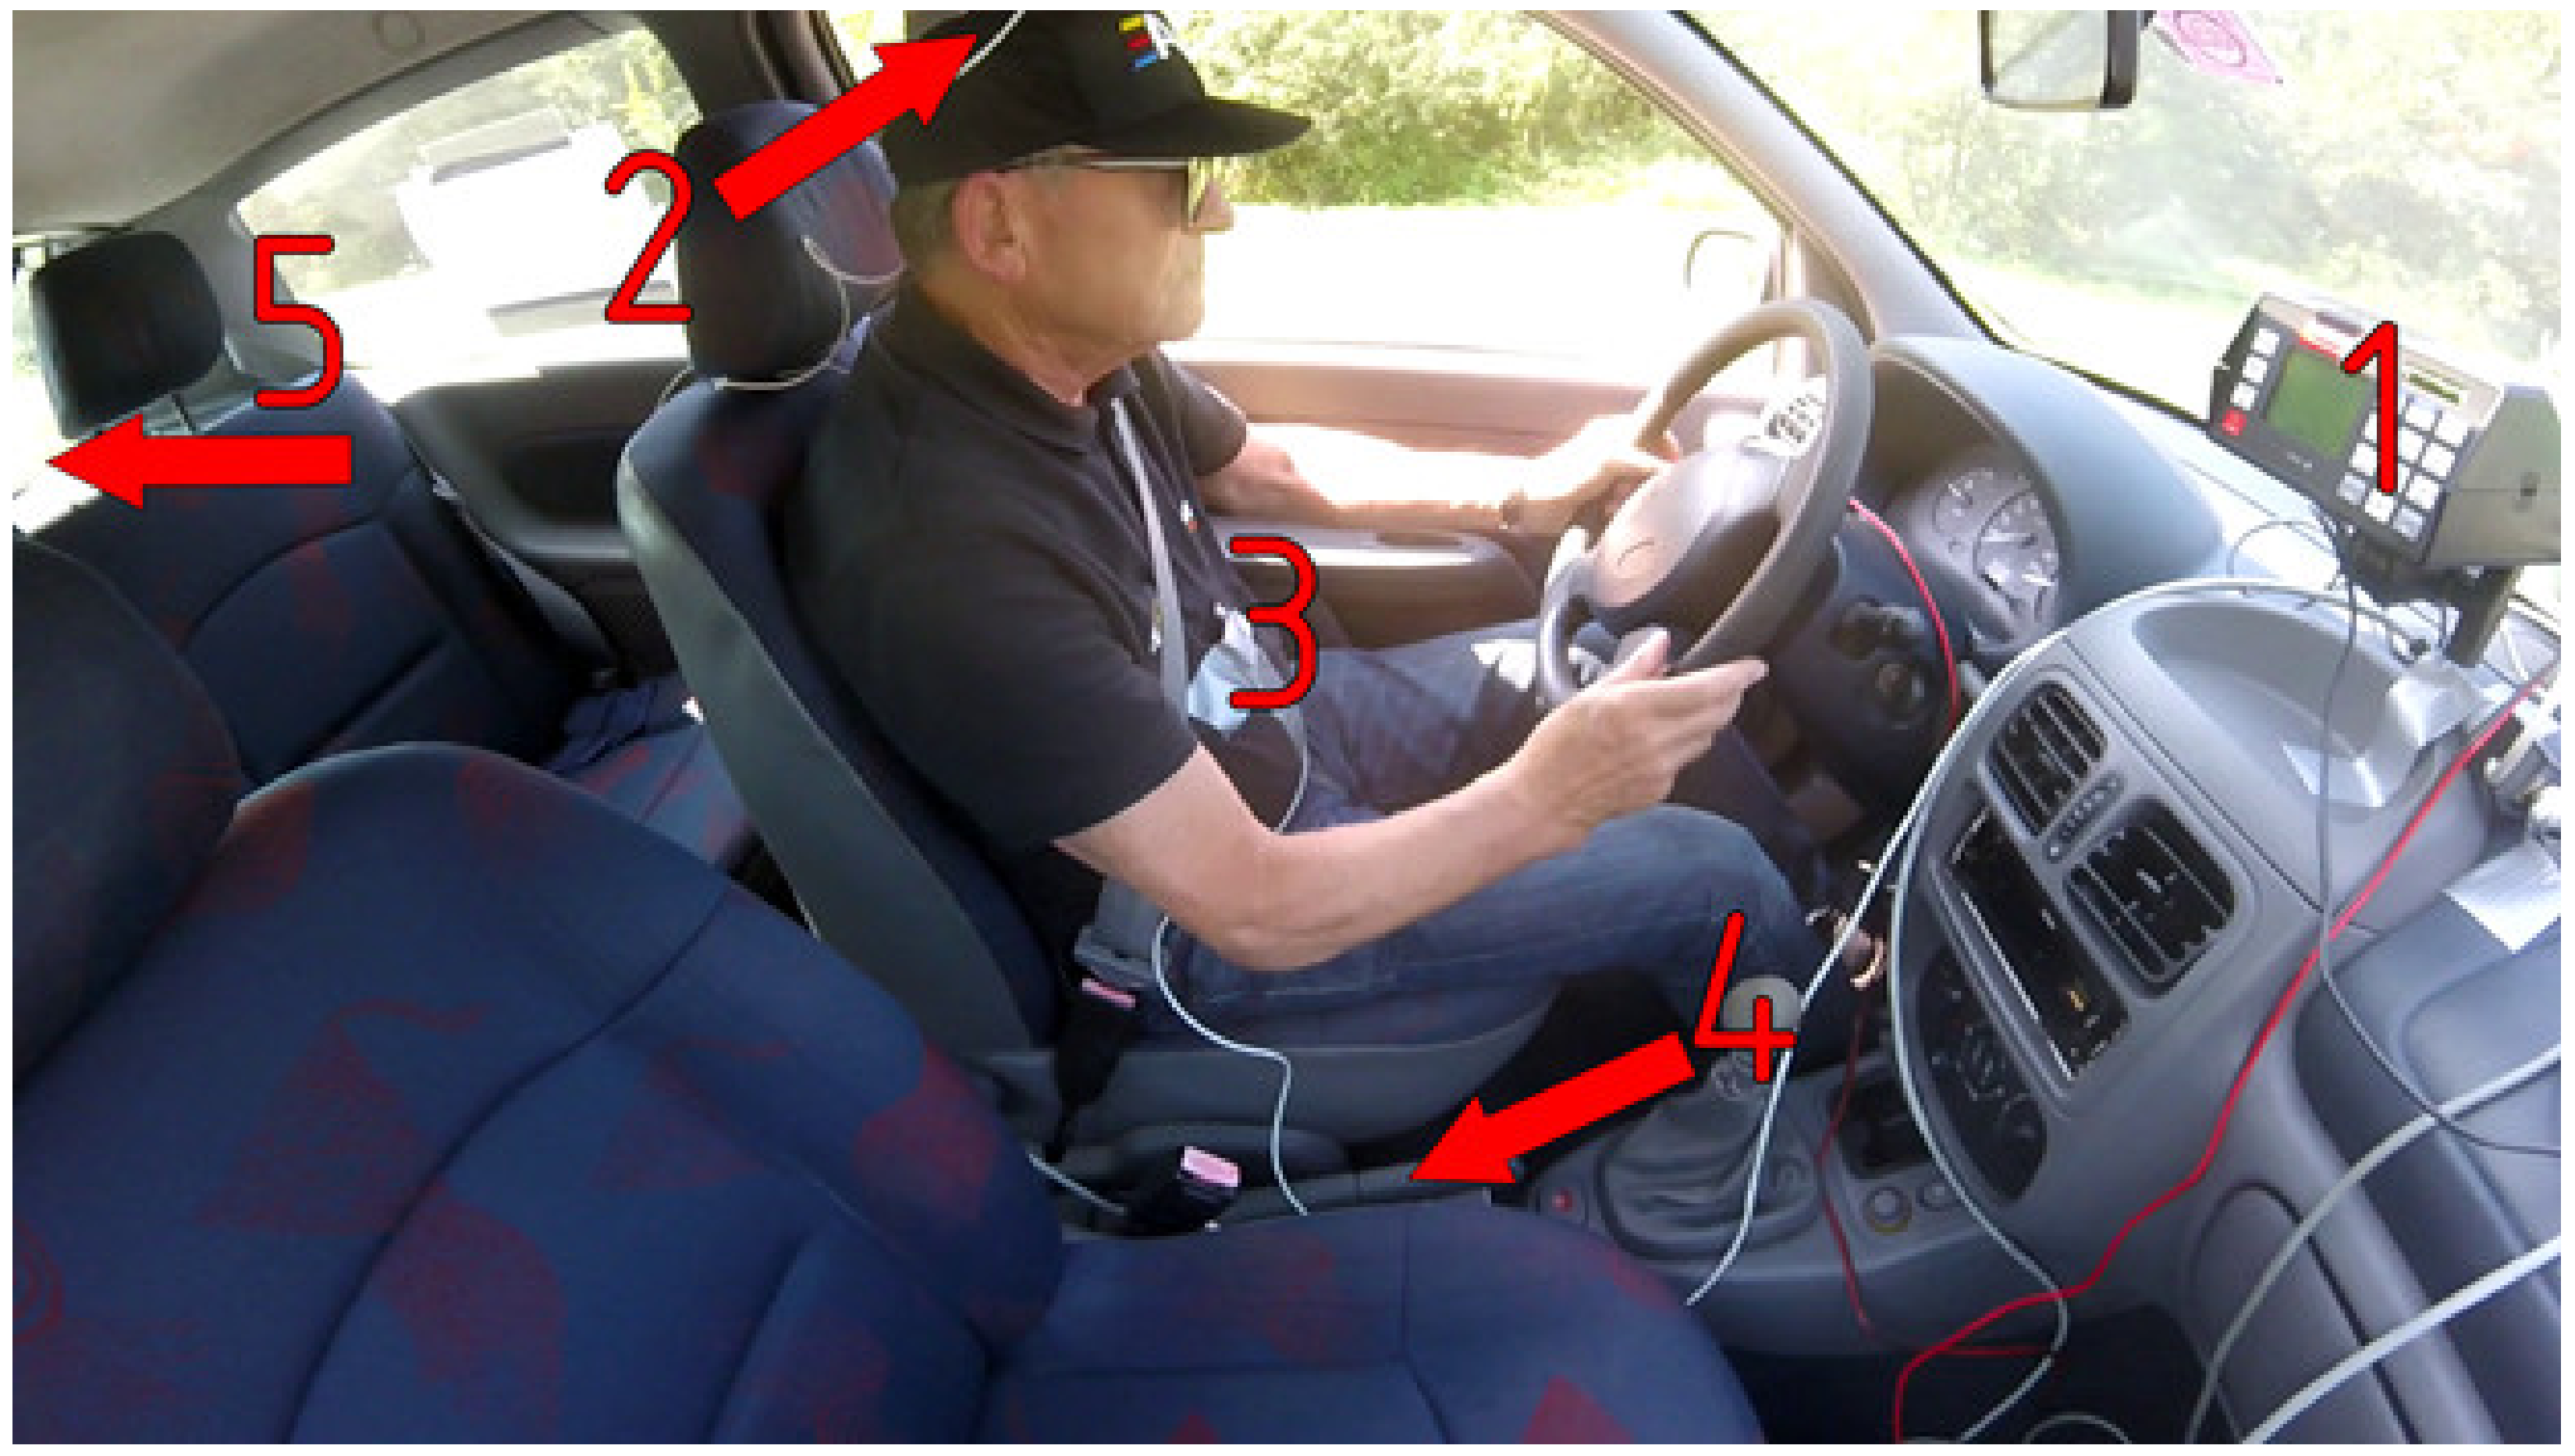
Figure 5.
Accelerometer on the unsprung part of the front suspension of the vehicle.
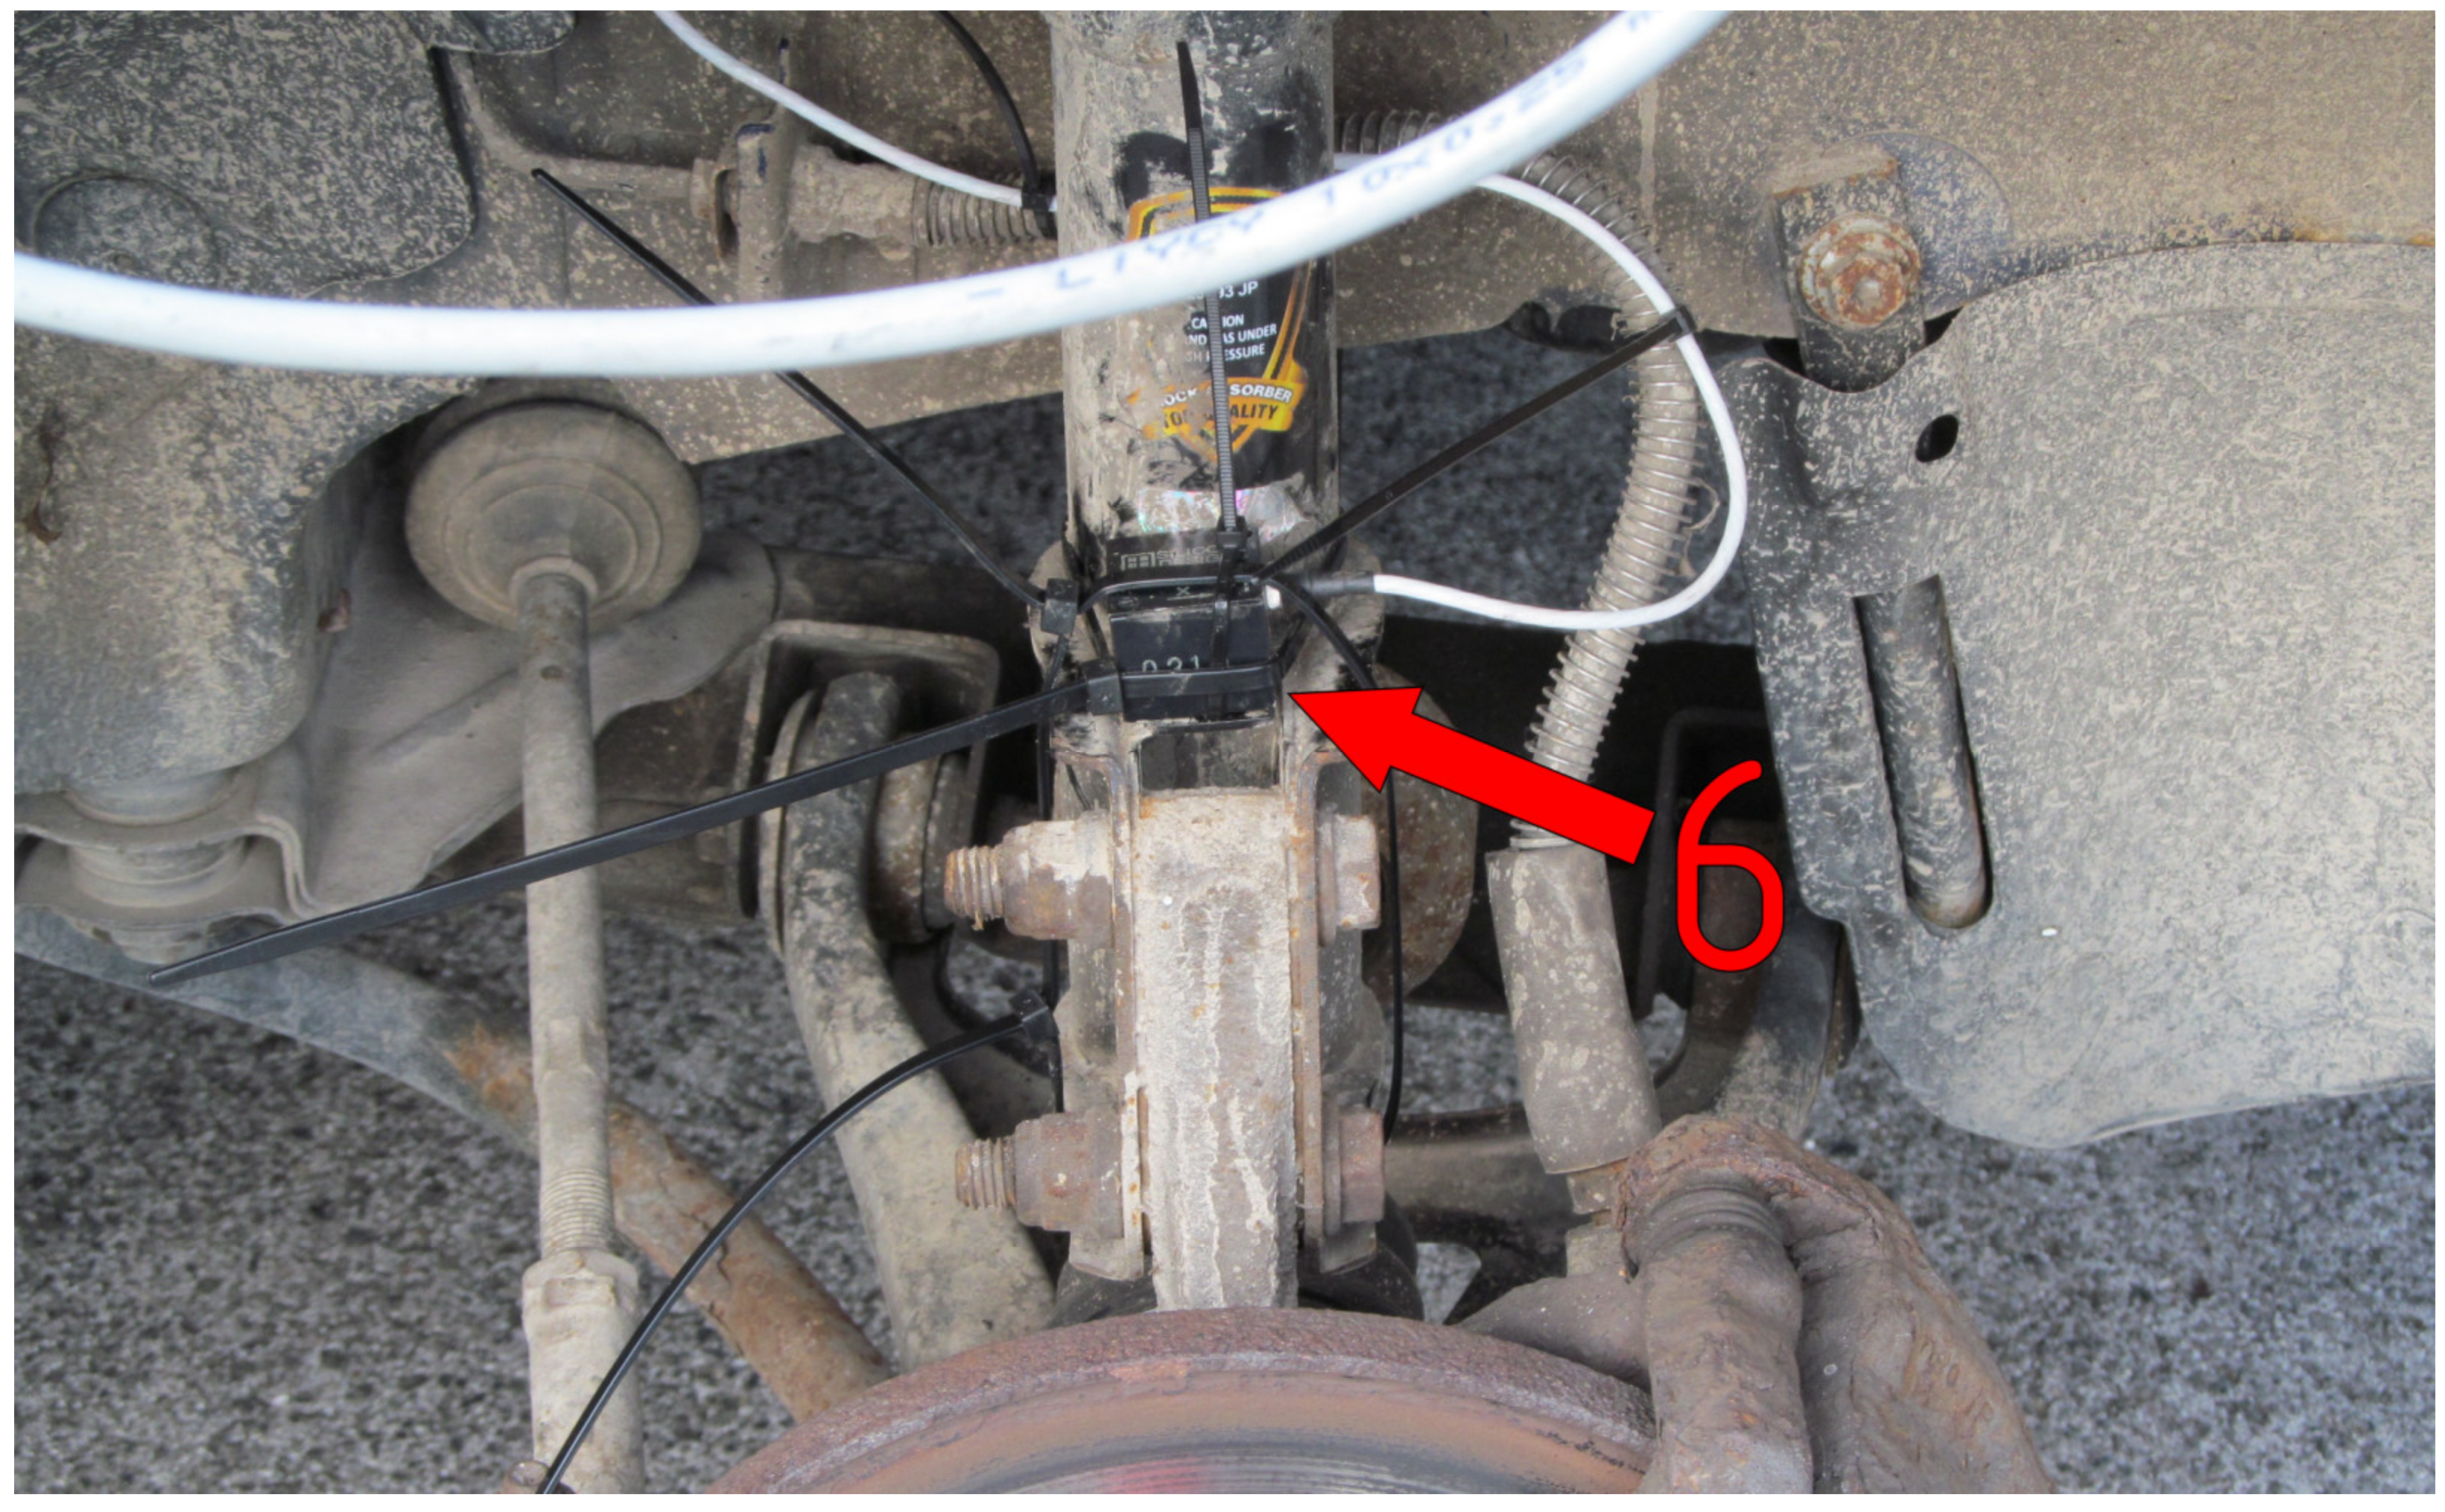
Figure 6.
Aerial view of the arrester bed with measurement equipment.
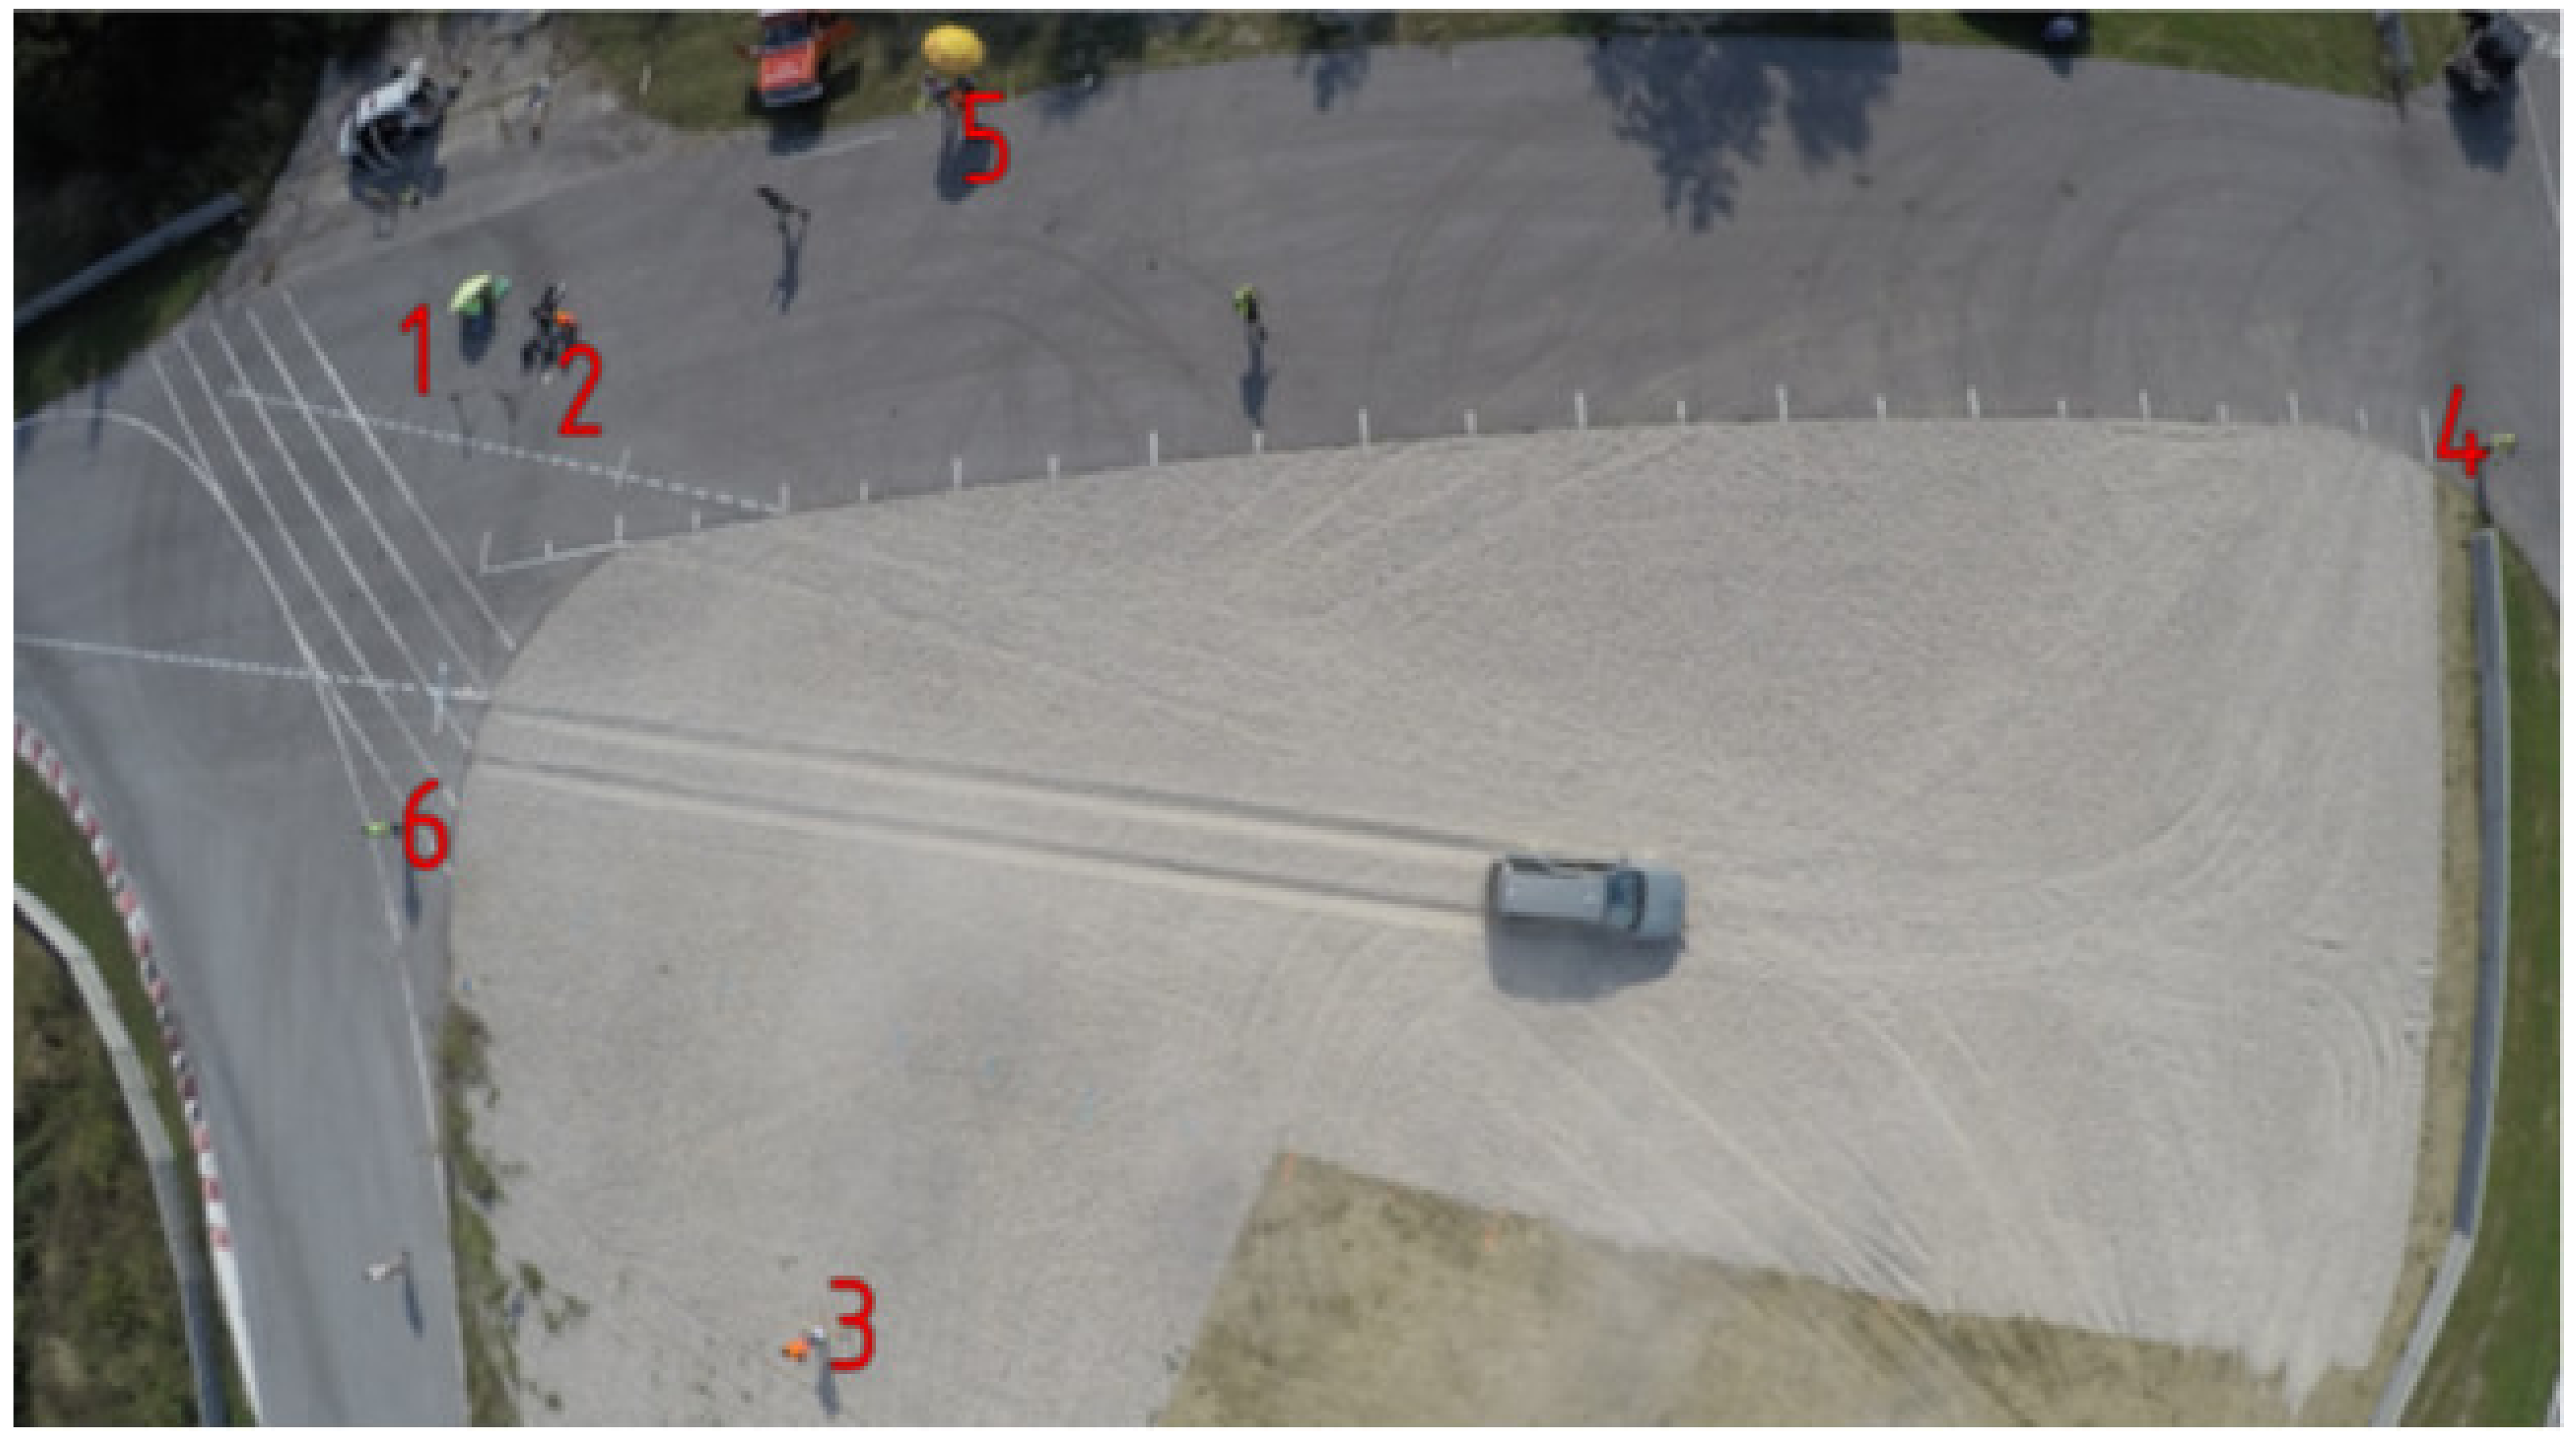
Figure 7.
Video tracking for measuring the vehicle’s entry velocity.
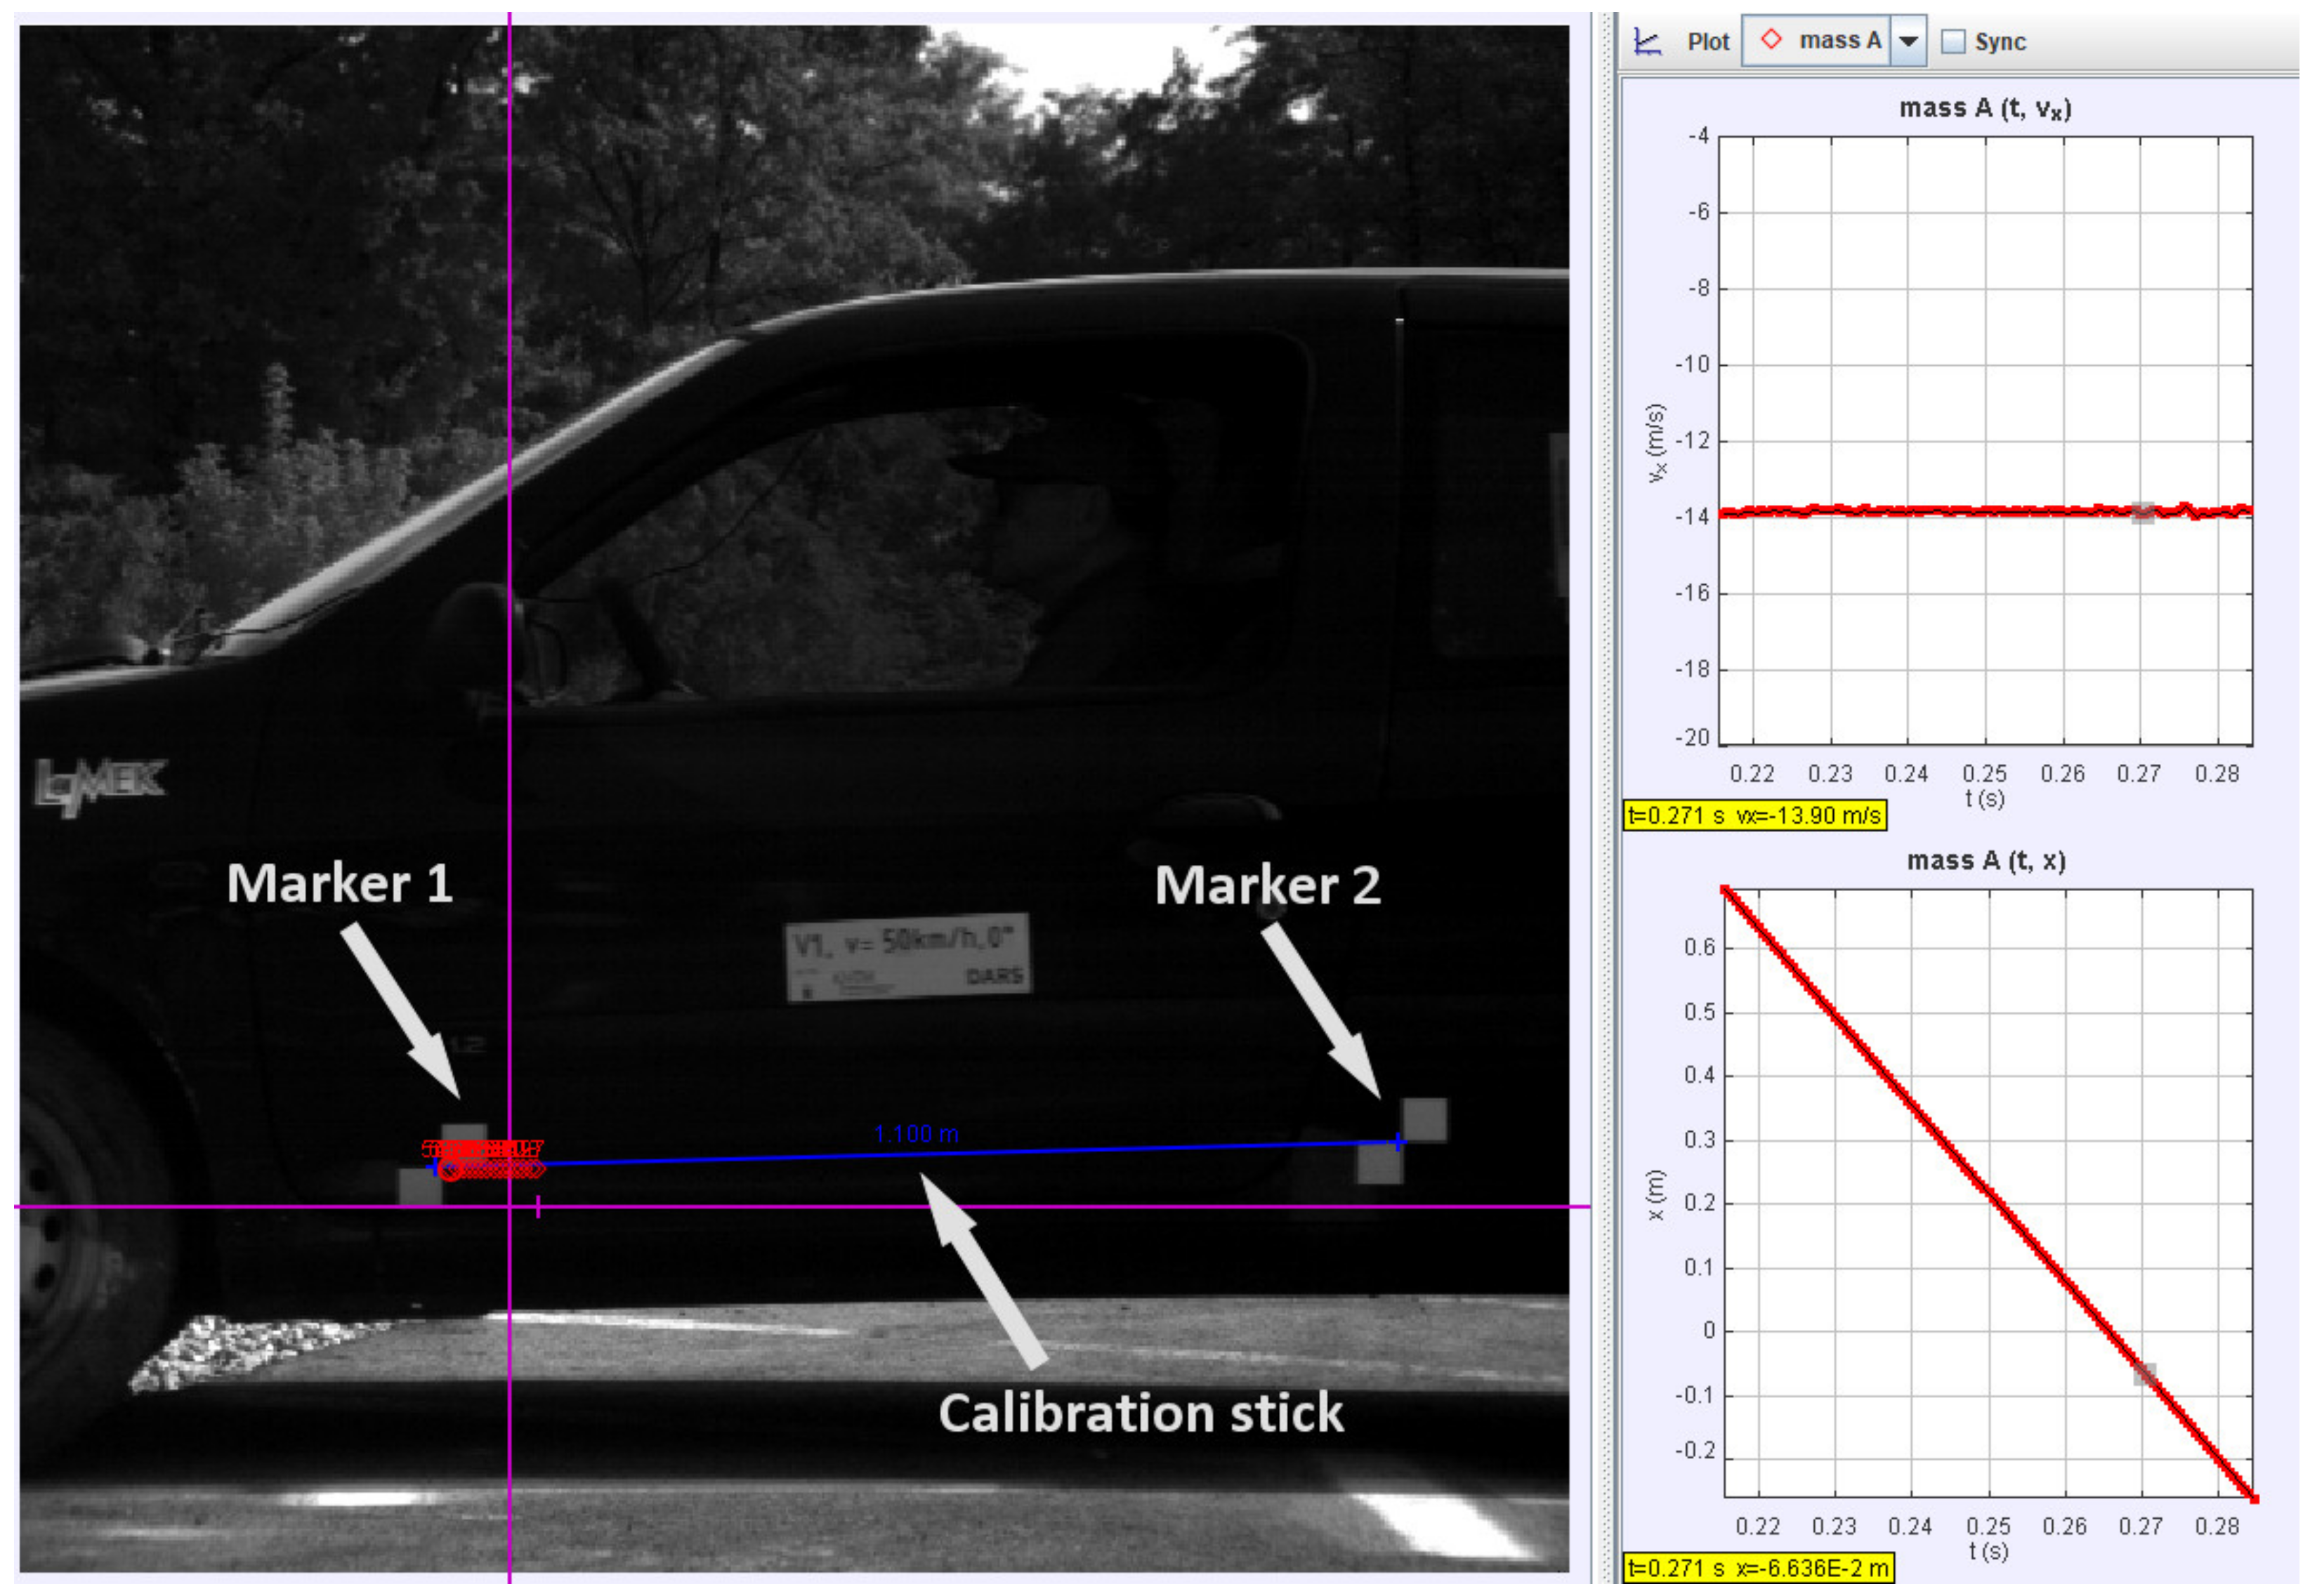
Figure 8.
Measuring the stopping distance (a,b) and the depth of the vehicle trail (c).
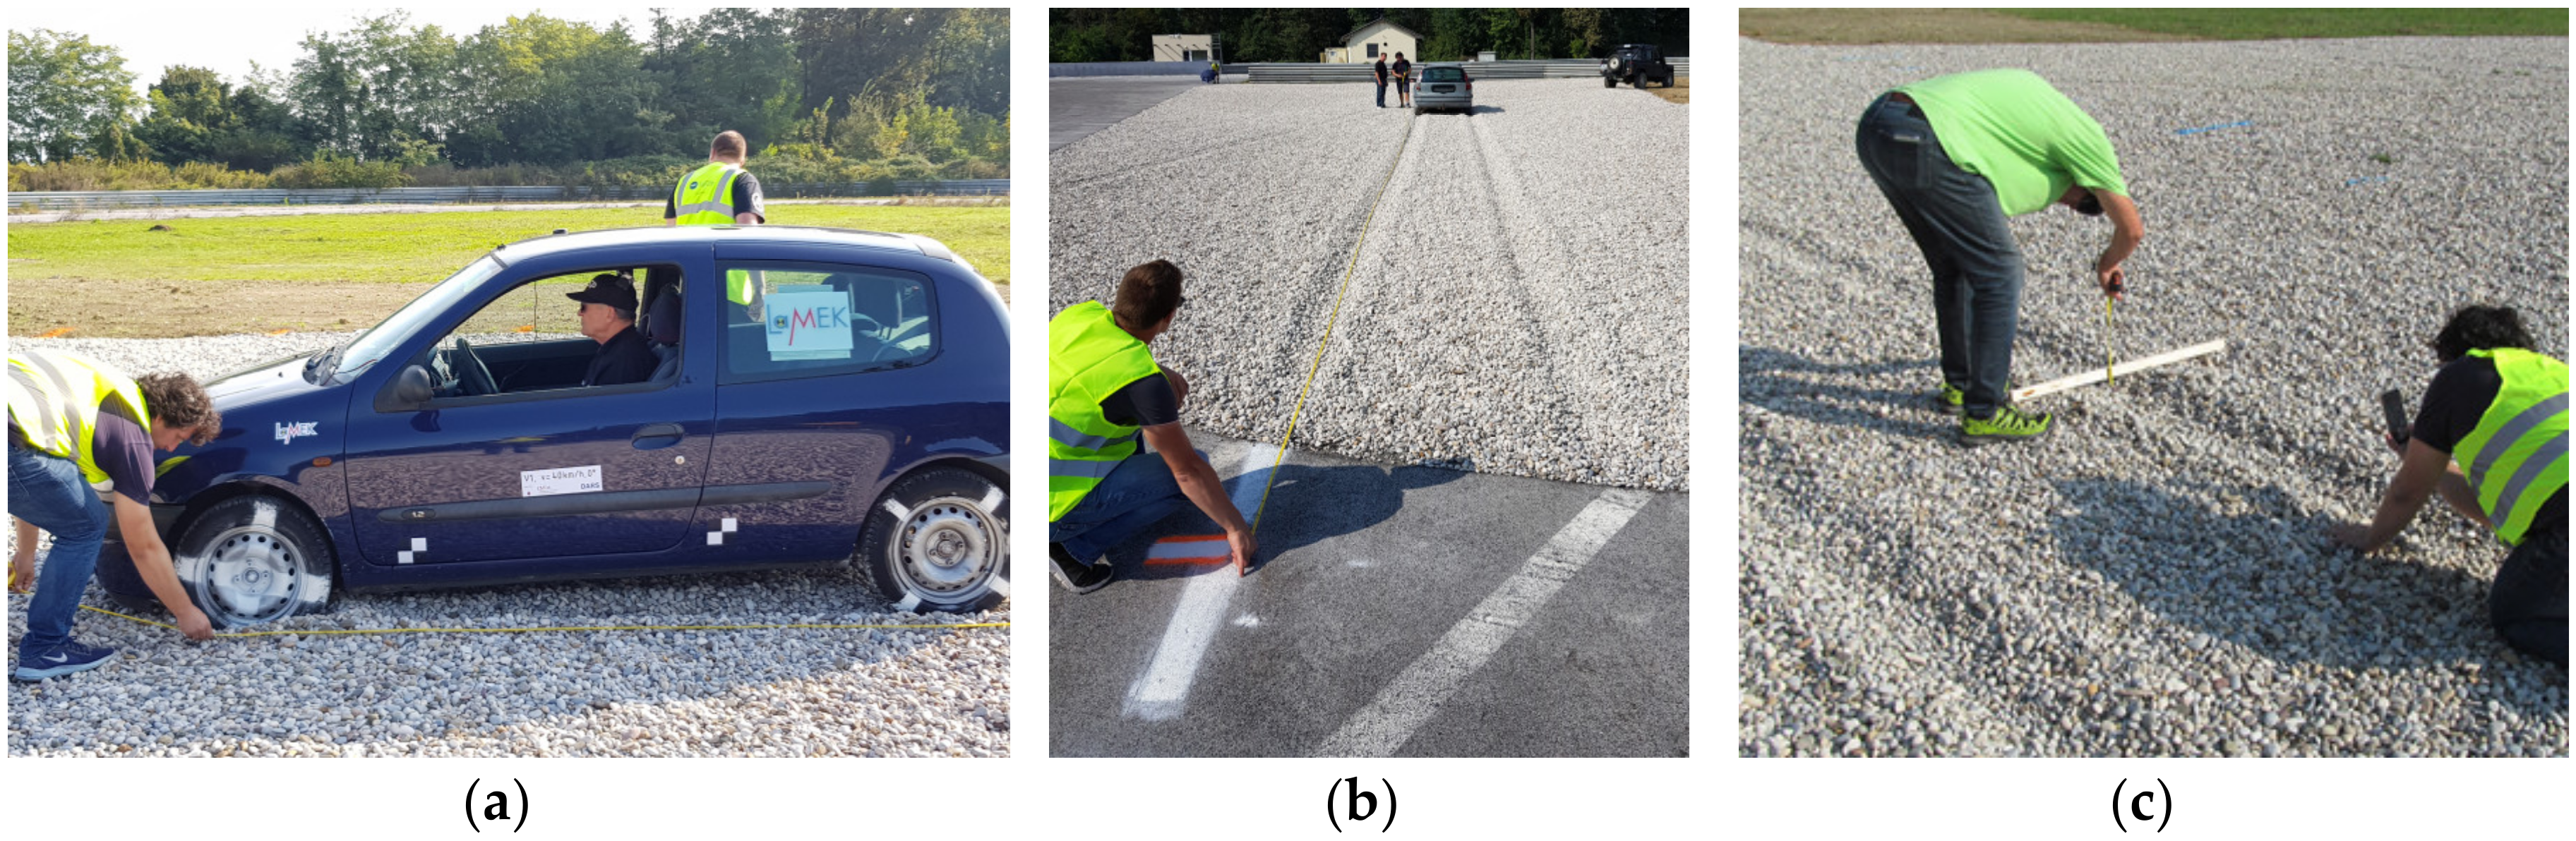
Figure 9.
Example chart of measured and calculated quantities during test #3 (900 kg vehicle, right angle without braking, 45 km/h).
Figure 9.
Example chart of measured and calculated quantities during test #3 (900 kg vehicle, right angle without braking, 45 km/h).
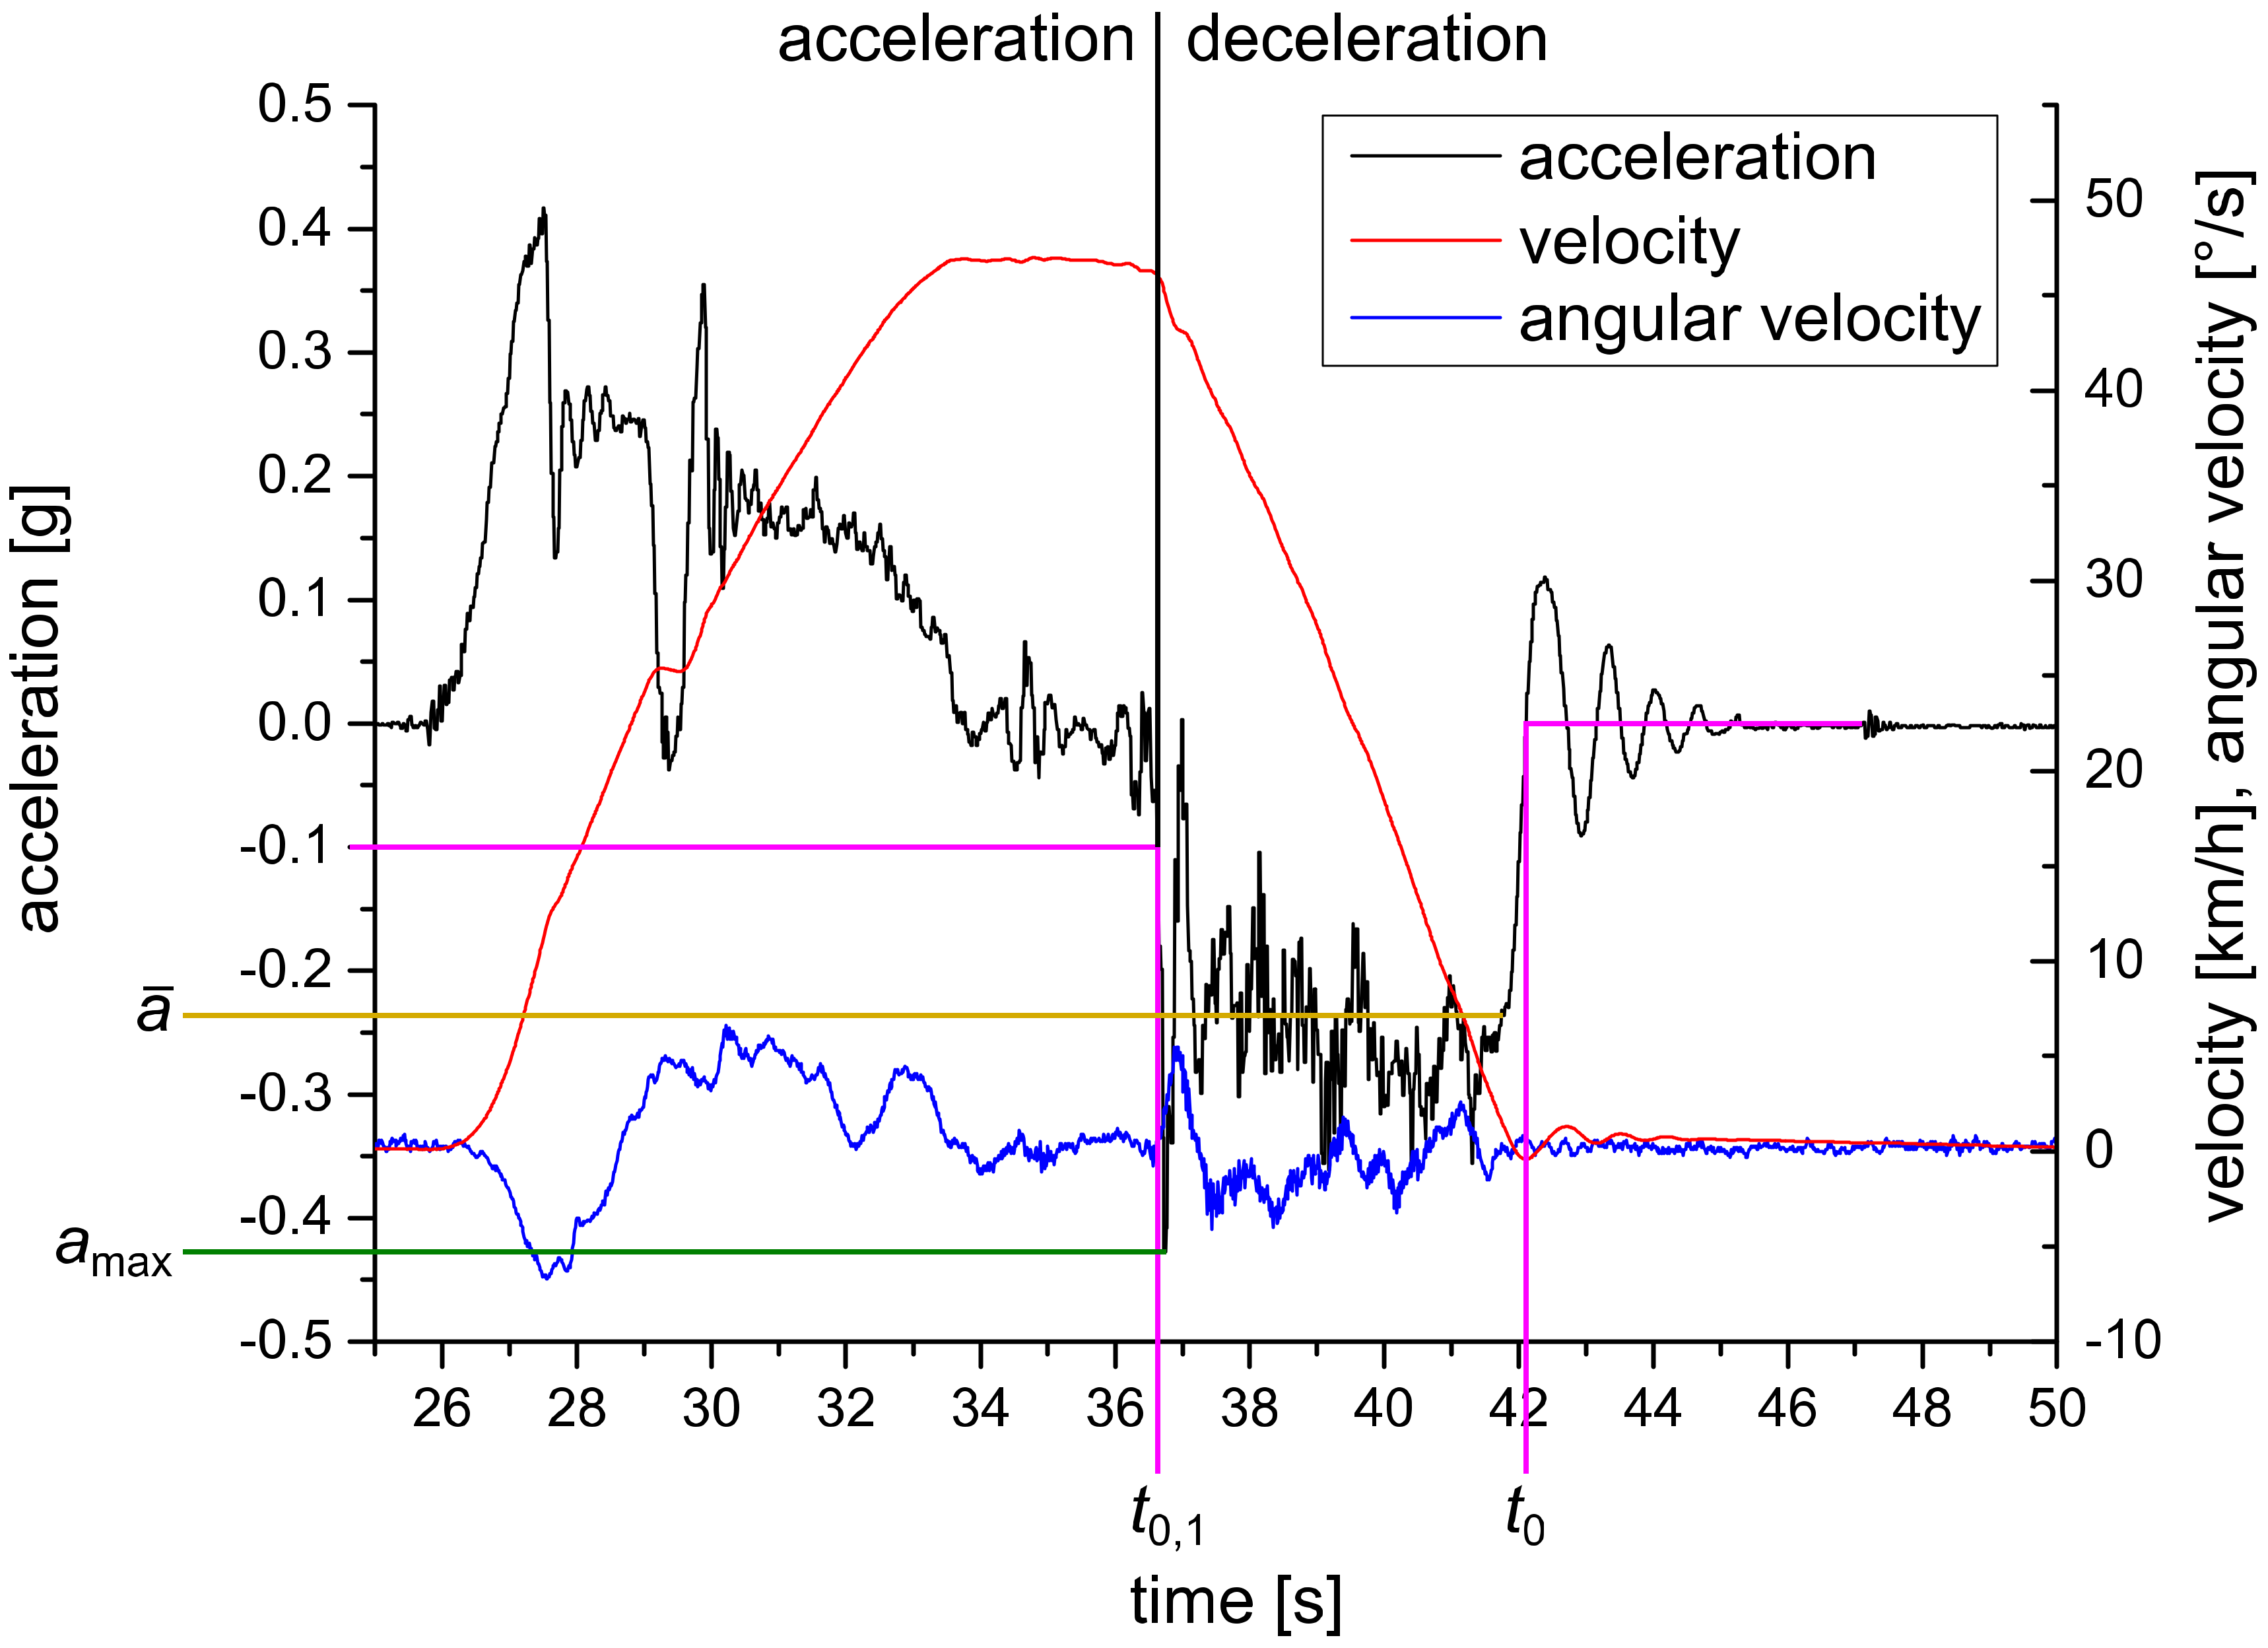
Figure 10.
Theoretical stopping distances calculated from measured average vehicle decelerations.

Table 1.
Summary of the performed tests.
| Type of Test | Vehicle | Number of Performed Tests |
|---|---|---|
| Right angle without braking | 900 kg | 4 |
| Right angle with braking | 900 kg | 3 |
| Right angle without braking, additional load | 900 kg + 300 kg | 2 |
| Right angle with braking, additional load | 900 kg + 300 kg | 1 |
| 20° without braking | 900 kg | 3 |
| Right angle without braking | 1500 kg | 3 |
| Right angle with braking | 1500 kg | 3 |
| 20° without braking | 1500 kg | 2 |
| Total | 21 |
Table 2.
The results summary.
| # | Vehicle | Angle | Test Type | Target Velocity [km/h] | Actual Velocity [km/h] | Avg. Decel. [g] | Max. Decel. [g] | Stopping Distance 1 [m] | Trail Depth 2 [mm] |
|---|---|---|---|---|---|---|---|---|---|
| 1 | 900 kg | 0° | no braking | 40 | 343.67 | 0.217 | 0.342 | 35.9 | 35/38 |
| 2 | 900 kg | 0° | no braking | 50 | 52.40 | 0.215 | 0.401 | 51.1 | 35/39 |
| 3 | 900 kg | 0° | no braking | 45 | 45.74 | 0.240 | 0.427 | 36.4 | 38/40 |
| 4 | 900 kg | 0° | no braking | 50 | 50.72 | 0.205 | 0.399 | 47.8 | 40/42 |
| 5 | 900 kg | 0° | braking | 50 | 50.72 | 0.797 | 1.158 | 15.5 | 70/140 |
| 6 | 900 kg | 0° | no braking, +300 kg load | 50 | 51.55 | 0.253 | 0.506 | 42.9 | 58/89 |
| 7 | 900 kg | 0° | braking, +300 kg load | 50 | 50.08 | 0.818 | 1.159 | 14.3 | 80/130 |
| 8 | 900 kg | 0° | no braking, +300 kg load | 40 | 39.66 | 0.294 | 0.476 | 21.8 | 70/90 |
| 9 | 900 kg | 0° | braking | 70 | 64.07 | 0.770 | 1.214 | 20.7 | 68/123 |
| 10 | 900 kg | 0° | braking | max. safe | 74.30 | 0.812 | 1.243 | 25.6 | 80/95 |
| 11 | 900 kg | 20° | partial braking after 28 m | 50 | 57.76 | 0.312 | 0.803 | 41.937.6 | 50/80 |
| 12 | 900 kg | 20° | no braking | 40 | 41.87 | 0.257 | 0.463 | 27.924.0 | 50/60 |
| 13 | 900 kg | 20° | no braking | 50 | 50.89 | 0.254 | 0.446 | 39.836.2 | 50/40 |
| 14 | 1500 kg | 20° | no braking | 40 | 45.29 | 0.217 | 0.353 | 40.635.1 | 62/65 |
| 15 | 1500 kg | 20° | partial braking4 | 50 | 55.16 | 0.272 | 0.907 | 49.545.6 | 55/50 |
| 16 | 1500 kg | 0° | no braking | 40 | 40.31 | 0.261 | 0.475 | 24.7 | 60/75 |
| 17 | 1500 kg | 0° | no braking | 50 | 49.41 | 0.254 | 0.454 | 37.7 | 68/60 |
| 18 | 1500 kg | 0° | partial braking4 | 60 | 62.71 | 0.263 | 0.708 | 55.1 | 50/65 |
| 19 | 1500 kg | 0° | partial braking4 | max. safe | 73.74 | 0.462 | 0.850 | 48.6 | 65/72 |
| 20 | 1500 kg | 0° | partial braking4 | max. safe | 68.25 | 0.372 | 0.944 | 42.2 | not measured |
| 21 | 1500 kg | 0° | partial braking with ABS off | max. safe | 74.11 | 0.494 | 1.05 | 32.1 | 80/123 |
1 In tests at 20° angle: the upper number = left, the lower number = right. 2 Left number = depth in the first one-third of the track, right number = depth in the last one-third of the track. 3 Measured only with GNSS due to failed triggering of the high-speed camera. 4 Braking only at the very end of the motion to prevent the vehicle from leaving the arrester bed.
Table 3.
Statistics on the relevant groups of tests.
| Group of Tests | Number of Tests in Group | Avg. Avg. Decel. [g] | Min. Avg. Decel. [g] | Max. Avg. Decel. [g] | Avg. Decel. Std. Dev. [g] |
|---|---|---|---|---|---|
| 900 kg vehicle without braking and without additional load | 6 | 0.231 | 0.205 | 0.257 | 0.02197 |
| 900 kg vehicle with braking | 3 | 0.793 | 0.770 | 0.812 | 0.02128 |
| 1500 kg vehicle without braking | 3 | 0.244 | 0.217 | 0.254 | 0.02364 |
| All tests without braking, including tests with additional load on 900 kg vehicle | 11 | 0.242 | 0.205 | 0.294 | 0.02655 |
| All tests with braking from entry | 4 | 0.799 | 0.770 | 0.818 | 0.02141 |
© 2020 by the authors. Licensee MDPI, Basel, Switzerland. This article is an open access article distributed under the terms and conditions of the Creative Commons Attribution (CC BY) license (http://creativecommons.org/licenses/by/4.0/).
Share and Cite
MDPI and ACS Style
Ambrož, M.; Trajkovski, J.; Kunc, R. Decelerations of Passenger Vehicles on Gravel Arrester Beds. Sustainability 2020, 12, 1761. https://doi.org/10.3390/su12051761
AMA Style
Ambrož M, Trajkovski J, Kunc R. Decelerations of Passenger Vehicles on Gravel Arrester Beds. Sustainability. 2020; 12(5):1761. https://doi.org/10.3390/su12051761
Chicago/Turabian StyleAmbrož, Miha, Jovan Trajkovski, and Robert Kunc. 2020. "Decelerations of Passenger Vehicles on Gravel Arrester Beds" Sustainability 12, no. 5: 1761. https://doi.org/10.3390/su12051761
Note that from the first issue of 2016, this journal uses article numbers instead of page numbers. See further details here.