Green Brand of Companies and Greenwashing under Sustainable Development Goals


Abstract
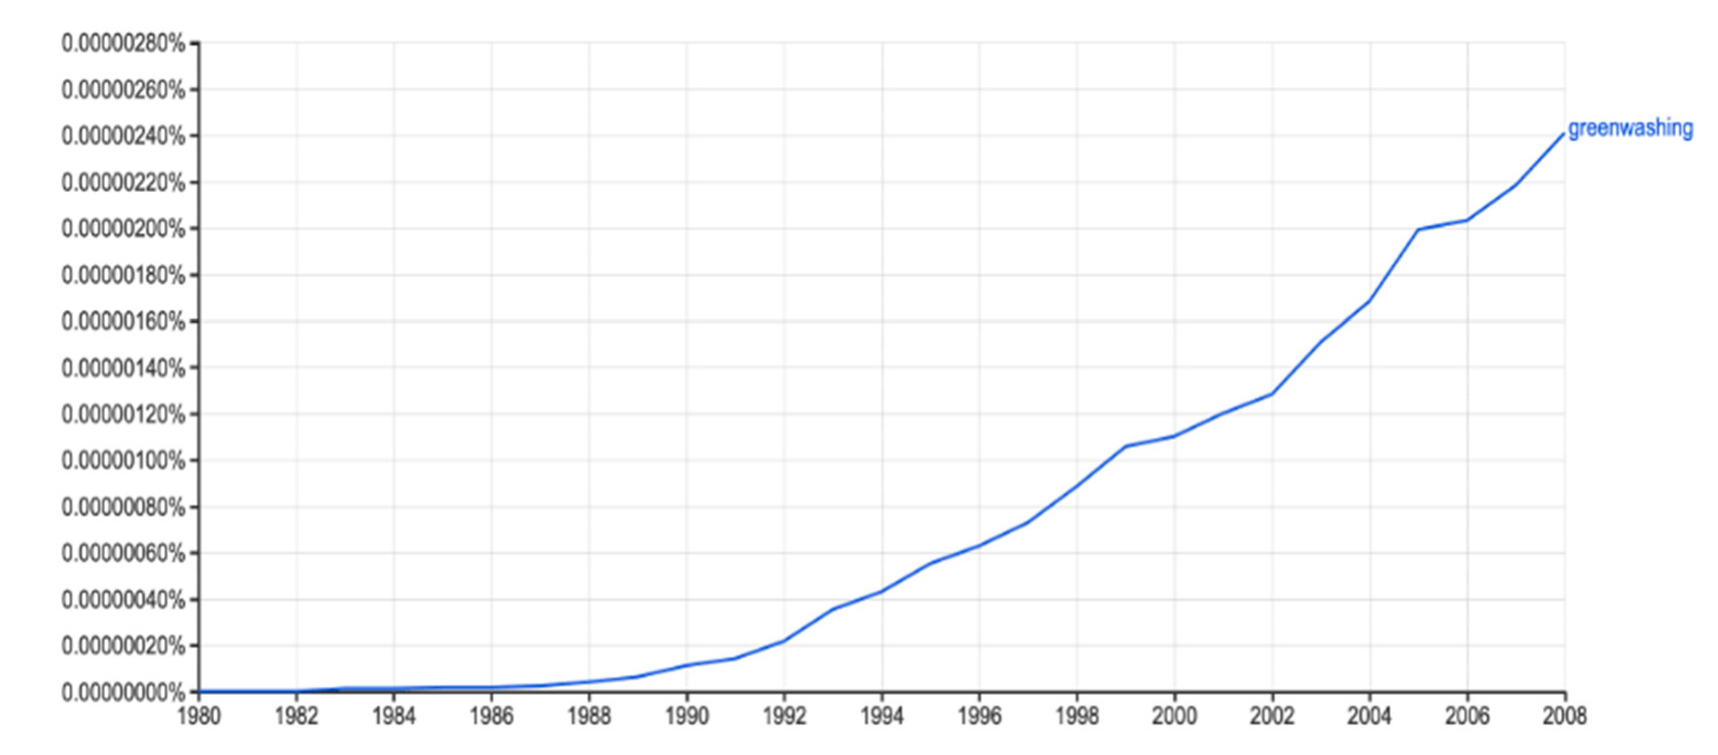
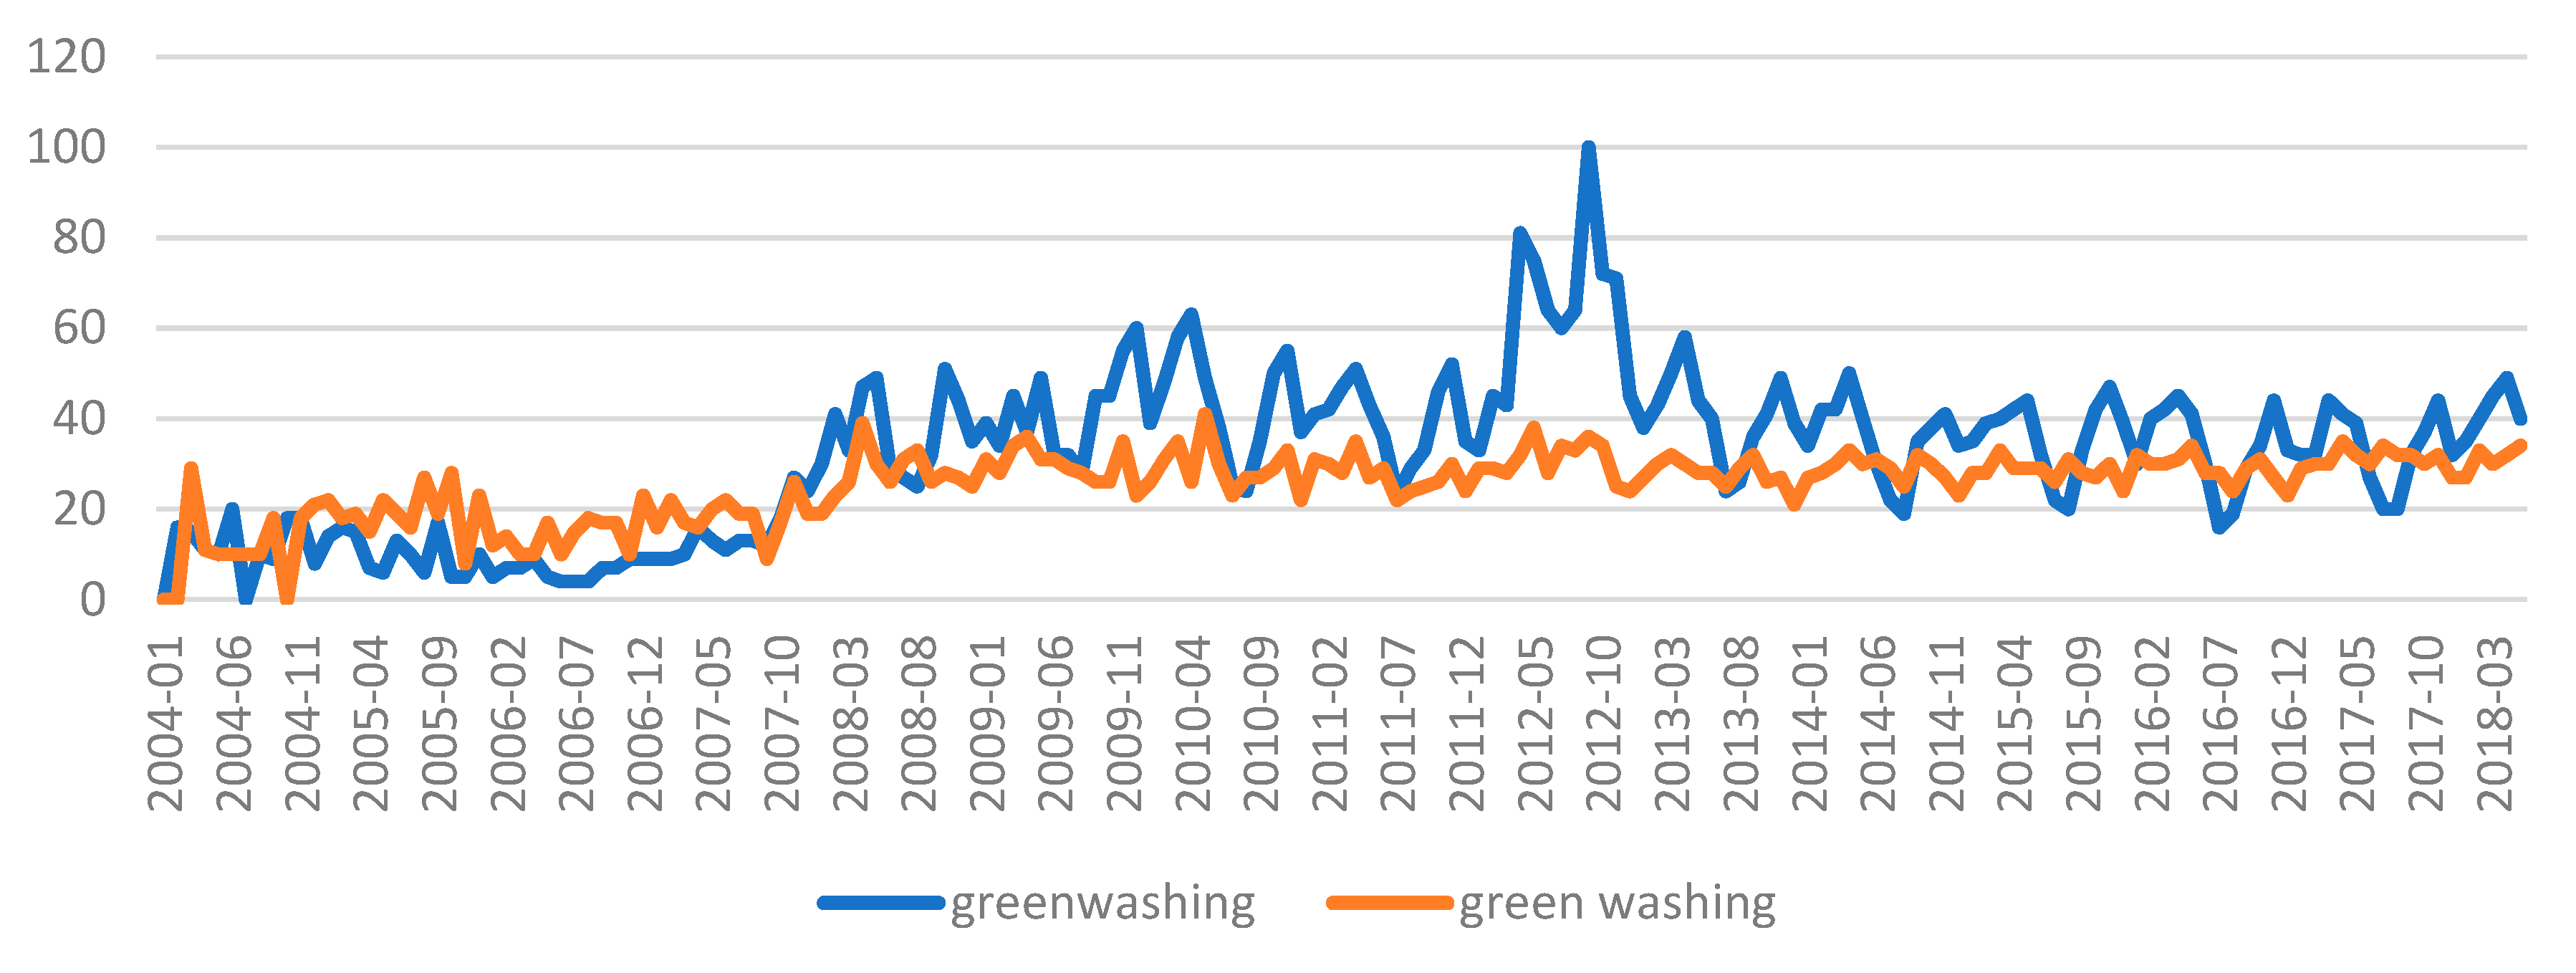
1. Introduction
2. Materials and Methods
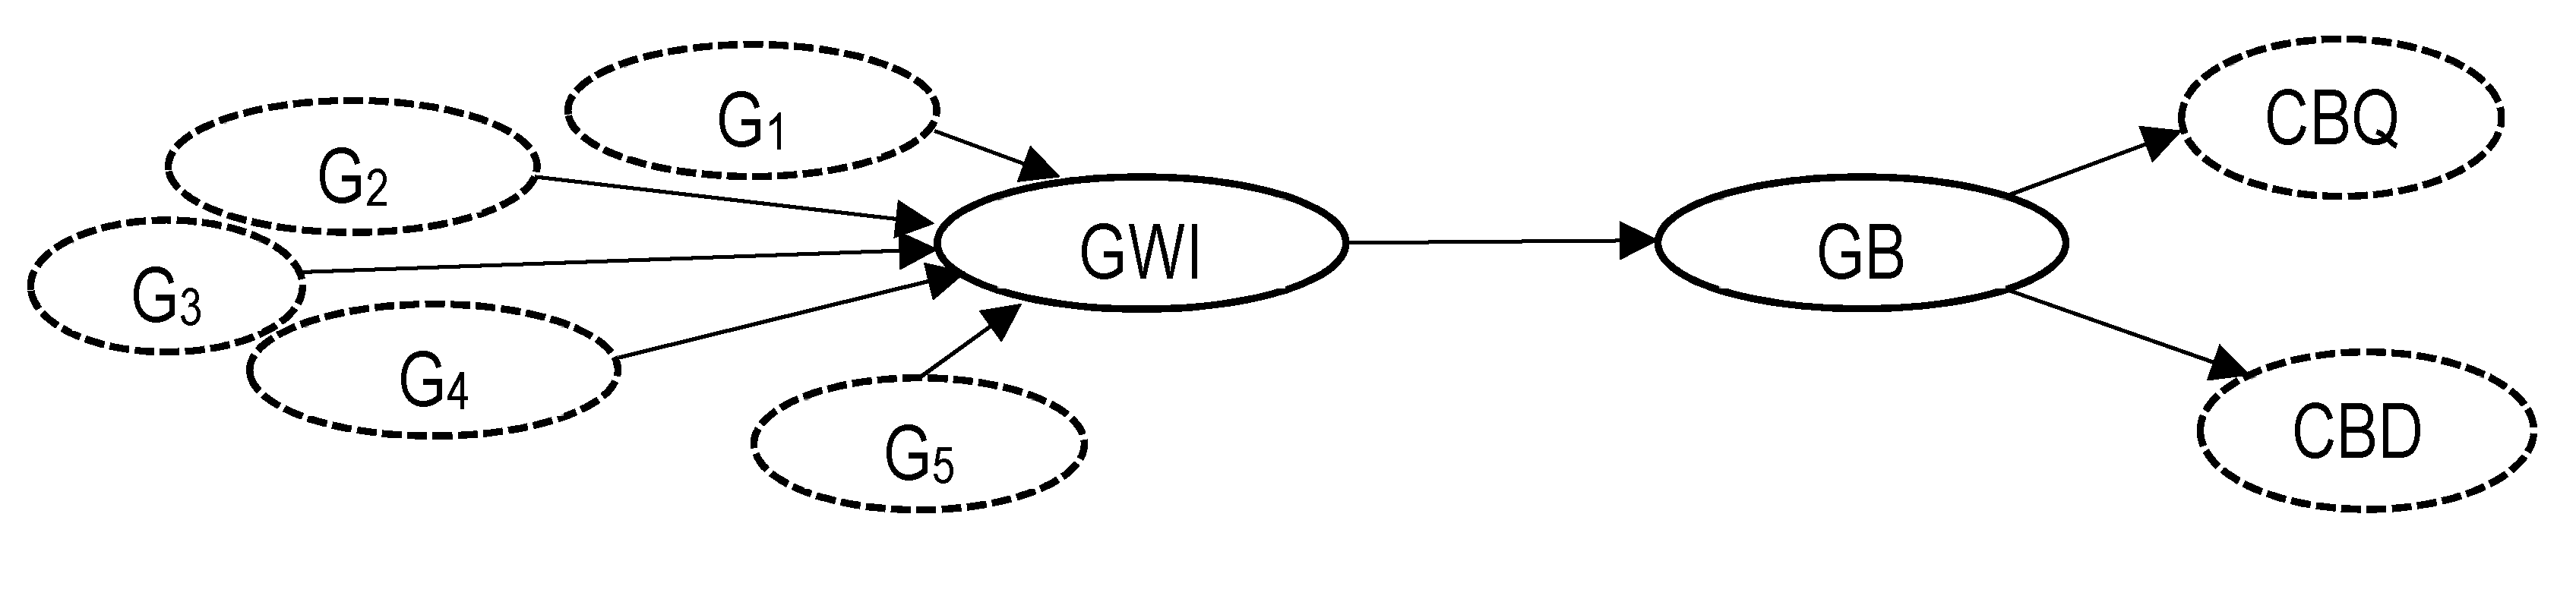
- The information about the company’s green activities on the official website was not right (G1);
- A report on corporate social responsibilities was not presented at the company’s website (G2);
- The information on the official website could not be proven by real data (G3);
- The information about the green achievement on the company’s website was exaggerated (G4);
- The information on the official website masked the company’s real economic goals (G5).
3. Results
4. Discussion
- The information on the website has to be reliable and characterize the green activity of the company;
- Full-text non-financial statements of the company;
- The information available on the website must be supported by specific figures, press releases and relevant activity and environmental audit reports;
- Mandatory information on the company’s official website about the environmental performance of the company.
- Present a transparent scheme of the shareholders of the company;
- Publish information about listing in green stock indices and the stock price of the company;
- Publish reports on using green investments with verified data on green assets to which they have been directed at each life cycle of the investment project;
- Publish information about data on the issue of green securities and information on the direction of funds raised as a result of this issue.
5. Conclusions
Author Contributions
Funding
Conflicts of Interest
References
- Motavalli, J. A History of Greenwashing: How Dirty Towels Impacted the Green Movement. 2011. Available online: https://www.aol.com/2011/02/12/the-history-of-greenwashing-how-dirty-towels-impacted-the-green/ (accessed on 5 May 2019).
- Siano, A.; Vollero, A.; Conte, F.; Amabile, S. “More than words”: Expanding the taxonomy of greenwashing after the Volkswagen scandal. J. Bus. Res. 2017, 71, 27–37. [Google Scholar] [CrossRef]
- Du, X. How the Market Values Greenwashing? Evidence from China. J. Bus. Ethic 2014, 128, 547–574. [Google Scholar] [CrossRef]
- Du, X.; Chang, Y.; Zeng, Q.; Du, Y.; Pei, H. Corporate environmental responsibility (CER) weakness, media coverage, and corporate philanthropy: Evidence from China. Asia Pac. J. Manag. 2015, 33, 551–581. [Google Scholar] [CrossRef]
- Kim, E.-H.; Lyon, T.P. Greenwash vs. Brownwash: Exaggeration and Undue Modesty in Corporate Sustainability Disclosure. Organ. Sci. 2015, 26, 705–723. [Google Scholar] [CrossRef]
- Vos, L. What Is Green Marketing? (+5 Sustainable Examples in 2019). Available online: https://learn.g2crowd.com/green-marketing (accessed on 10 December 2019).
- The Domino Effect of Volkswagen’s Emissions Scandal. 2015. Available online: https://www.forbes.com/sites/greatspeculations/2015/09/28/the-domino-effect-of-volkswagens-emissions-scandal/#3258544d282b (accessed on 20 September 2019).
- Chan, E.S. Managing green marketing: Hong Kong hotel managers’ perspective. Int. J. Hosp. Manag. 2013, 34, 442–461. [Google Scholar] [CrossRef]
- Wahba, G.H. Latest Trends in Environmental Advertising Design “Application Study of Egyptian Society”. Procedia Soc. Behav. Sci. 2012, 51, 901–907. [Google Scholar] [CrossRef][Green Version]
- Langen, N.; Grebitus, C.; Hartmann, M. Is Cause-related Marketing greenwashing. In Proceedings of the 11th Biennial ISEE Conference Advancing Sustainability in a Time of Crisis, Oldenburg and Bremen, Germany, 22–25 August 2010. [Google Scholar]
- Camprubí, R.; Coromina, L. Content analysis in tourism research. Tour. Manag. Perspect. 2016, 18, 134–140. [Google Scholar] [CrossRef]
- Shelley, M.; Krippendorff, K. Content Analysis: An Introduction to its Methodology. J. Am. Stat. Assoc. 1984, 79, 240. [Google Scholar] [CrossRef]
- Nur-Al-Ahad, M.; Nusrat, S. New Trends in Behavioral Economics: A Content Analysis of Social Communications of Youth. Bus. Ethic Lead. 2019, 3, 107–115. [Google Scholar] [CrossRef]
- Kolbe, R.H.; Burnett, M.S. Content-Analysis Research: An Examination of Applications with Directives for Improving Research Reliability and Objectivity. J. Consum. Res. 1991, 18, 243. [Google Scholar] [CrossRef]
- Berg, B.L. An Introduction to Content Analysis. Qualitative Research Methods for the Social Sciences, 7th ed.; Allyn & Bacon: Boston, MA, USA, 2009; pp. 338–377. Available online: https://mpra.ub.uni-muenchen.de/85654/ (accessed on 5 May 2019).
- Levin, J.; Gerbner, G.; Holsti, O.R.; Krippendorff, K.; Paisley, W.J.; Stone, P.J. The Analysis of Communication Content: Developments in Scientific Theories and Computer Techniques. Am. Sociol. Rev. 1970, 35, 1144. [Google Scholar] [CrossRef]
- Guthrie, J.; Petty, R.; Yongvanich, K.; Ricceri, F. Using content analysis as a research method to inquire into intellectual capital reporting. J. Intellect. Cap. 2004, 5, 282–293. [Google Scholar] [CrossRef]
- Soldatenko, D.; Backer, E. A content analysis of cross-cultural motivational studies in tourism relating to nationalities. J. Hosp. Tour. Manag. 2019, 38, 122–139. [Google Scholar] [CrossRef]
- Testa, F.; Boiral, O.; Iraldo, F. Internalization of Environmental Practices and Institutional Complexity: Can Stakeholders Pressures Encourage Greenwashing? J. Bus. Ethic 2015, 147, 287–307. [Google Scholar] [CrossRef]
- Jones, M.J.; Shoemaker, P.A. Accounting narratives: A review of empirical studies of content and readability. J. Acct. Lit. 1994, 13, 142–184. [Google Scholar]
- Yevdokimov, Y.; Chygryn, O.; Pimonenko, T.; Lyulyov, O. Biogas as an alternative energy resource for Ukrainian companies: EU experience. Innov. Mark. 2018, 14, 7–15. [Google Scholar] [CrossRef]
- Chygryn, O.; Pimonenko, T.; Luylyov, O.; Goncharova, A. Green Bonds like the Incentive Instrument for Cleaner Production at the Government and Corporate Levels: Experience from EU to Ukraine. J. Environ. Manag. Tour. 2019, 9, 1443–1456. [Google Scholar] [CrossRef]
- Sotnyk, I.M.; Dehtyarova, I.B.; Kovalenko, Y.V. Current threats to energy and resource efficient development of Ukrainian economy. Actual Probl. Econ. 2015, 173, 137–145. [Google Scholar]
- Štreimikiene, D.; Vilnius University; Mikalauskiene, A. Comparative Assessment of Sustainable Energy Development in the Czech Republic, Lithuania and Slovakia. J. Compet. 2016, 8, 31–41. [Google Scholar]
- Sotnyk, I.; Kulyk, L. Decoupling analysis of economic growth and environmental impact in the regions of Ukraine. Econ. Ann. XXI 2014, 7–8, 60–64. [Google Scholar]
- Tvaronaviciene, M.; Prakapienė, D.; Garškaitė-Milvydienė, K.; Prakapas, R.; Nawrot, Ł. Energy Efficiency in the Long-Run in the Selected European Countries. Econ. Sociol. 2018, 11, 245–254. [Google Scholar] [CrossRef] [PubMed]
- Tyo, A.; Jazykbayeva, B.; Ten, T.; Kogay, G.; Spanova, B. Development tendencies of heat and energy resources: Evidence of Kazakhstan. Entrep. Sustain. Issues 2019, 7, 1514–1524. [Google Scholar] [CrossRef]
- Sotnyk, I.M.; Volk, O.M.; Chortok, Y.V. Increasing ecological & economic efficienICTof ict introduction as an innovative direction in resource saving. Actual Probl. Econ. 2013, 147, 229–235. [Google Scholar]
- Bhowmik, D. Decoupling CO2 Emissions in Nordic countries: Panel Data Analysis. Socioecon. Chall. 2019, 3, 15–30. [Google Scholar] [CrossRef]
- Lyeonov, S.; Pimonenko, T.; Bilan, Y.; Štreimikiene, D.; Mentel, G. Assessment of Green Investments’ Impact on Sustainable Development: Linking Gross Domestic Product Per Capita, Greenhouse Gas Emissions and Renewable Energy. Energies 2019, 12, 3891. [Google Scholar] [CrossRef]
- Vafaei, S.A.; Azmoon, I.; Fekete-Farkas, M. The Impact of Perceived Sustainable Marketing Policies on Green Customer Satisfaction. Pol. J. Manag. Stud. 2019, 19, 475–491. [Google Scholar] [CrossRef]
- Mercado, M.D.P.S.R.; Vargas-Hernández, J.G. Analysis of the Determinants of Social Capital in Organizations. Bus. Ethic Lead. 2019, 3, 124–133. [Google Scholar] [CrossRef]
- Song, Y.; Yao, S.; Yu, D.; Shen, Y. RISKY MULTI-CRITERIA GROUP DECISION MAKING ON GREEN CAPACITY INVESTMENT PROJECTS BASED ON SUPPLY CHAIN. J. Bus. Econ. Manag. 2017, 18, 355–372. [Google Scholar] [CrossRef]
- Maziriri, E.T.; Mapuranga, M.; Maramura, T.C.; Nzewi, O. Navigating on the key drivers for a transition to a green economy: Evidence from women entrepreneurs in South Africa. Entrep. Sustain. Issues 2019, 7, 1686–1703. [Google Scholar] [CrossRef]
- Mačerinskienė, I.; Survilaitė, S. Company’s intellectual capital impact on market value of Baltic countries listed enterprises. Oeconomia Copernic. 2019, 10, 309–339. [Google Scholar] [CrossRef]
- Hadinugroho, B.; Haryono, T.; Payamta; Trinugroho, I. Leverage, firm value and competitive strategy: Evidence from Indonesia. Int. J. Econ. Policy Emerg. Econ. 2018, 11, 487–508. [Google Scholar] [CrossRef]
- Rahman, M. The Relationship between Macro-Economic Variables and Stock Exchange Prices: A Case Study in Dhaka Stock Exchange (DSE) in Bangladesh. Financ. Mark. Inst. Risks 2019, 3, 122–130. [Google Scholar] [CrossRef]
- Djoemadi, F.R.; Setiawan, M.; Noermijati, N.; Irawanto, D.W. The effect of work satisfaction on employee engagement. [Wpływ satysfakcji z pracy na zaangażowanie pracowników]. Polish J. Manag. Stud. 2019, 19, 101–111. [Google Scholar] [CrossRef]
- Szyja, P. The role of the state in creating green economy. Oeconomia Copernic. 2016, 7, 207. [Google Scholar] [CrossRef]
- Boyarko, I.M.; Samusevych, Y.V. Role of intangible assets in company’s value creation. Actual Probl. Econ. 2011, 117, 86–94. [Google Scholar]
- Tresna, P.W.; Chan, A.; Alexandri, M.B. PLACE BRANDING AS BANDUNG CITY’S COMPETITIVE ADVANTAGE. Int. J. Econ. Policy Emerg. Econ. 2019, 12, 182–189. [Google Scholar] [CrossRef]
- Haninun, N.; Lindrianasari, N.; Denziana, A. The effect of environmental performance and disclosure on financial performance. Int. J. Trade Glob. Mark. 2018, 11, 138. [Google Scholar] [CrossRef]
- Abaas, M.S.M.; Chygryn, O.; Kubatko, O.; Pimonenko, T. Social and economic drivers of national economic development: The case of OPEC countries. Probl. Perspect. Manag. 2018, 16, 155–168. [Google Scholar]
- Zacarías, M.A.V.; Aguiñaga, E.; Lagunas, E.A. Sustainable entrepreneurship in industrial ecology: The cheese case in Mexico. Int. J. Trade Glob. Mark. 2017, 10, 19–27. [Google Scholar] [CrossRef]
- Vasylieva, T.; Lyulyov, O.; Bilan, Y.; Štreimikiene, D. Sustainable Economic Development and Greenhouse Gas Emissions: The Dynamic Impact of Renewable Energy Consumption, GDP, and Corruption. Energies 2019, 12, 3289. [Google Scholar] [CrossRef]
- Vasileva, T.A.; Lasukova, A.S. EMPIRICAL STUDY ON THE CORRELATION OF CORPORATE SOCIAL RESPONSIBILITY WITH THE BANKS EFFICIENCY AND STABILITY. Corp. Own. Control. 2013, 10, 86–93. [Google Scholar] [CrossRef][Green Version]
- Ganushchak-Efimenko, L.; Shcherbak, V.; Nifatova, O. Assessing the effects of socially responsible strategic partnerships on building brand equity of integrated business structures in Ukraine. Oeconomia Copernic. 2018, 9, 715–730. [Google Scholar] [CrossRef]
- Janoskova, K.; Krizanova, A. Comparison of selected internationally recognized brand valuation methods. Oeconomia Copernic. 2017, 8, 99. [Google Scholar] [CrossRef]
- Handayani, R.; Wahyudi, S.; Suharnomo, S. THE EFFECTS OF CORPORATE SOCIAL RESPONSIBILITY ON MANUFACTURING INDUSTRY PERFORMANCE: THE MEDIATING ROLE OF SOCIAL COLLABORATION AND GREEN INNOVATION. Versl- Teor. Ir Prakt. 2017, 18, 152–159. [Google Scholar] [CrossRef]
- Vasylieva, T.; Leonov, S.; Lasukova, A. Evaluation of the banks corporate social responsibility concept implementation level. Econ. Ann. XXI 2014, 1–2, 89–93. [Google Scholar]
- Vasilyeva, T.A.; Leonov, S.V.; Lunyakov, O.V. Analysis of internal and external imbalances in the financial sector of ukraine’s economy. Actual Probl. Econ. 2013, 150, 176–184. [Google Scholar]
- Marcel, D.T.A. Impact of the Foreign Direct Investment on Economic growth in the Republic of Benin. Financ. Mark. Inst. Risks 2019, 3, 69–78. [Google Scholar] [CrossRef]
- Leonov, S.V.; Vasylieva, T.A.; Tsyganyuk, D.L. Formalization of functional limitations in functioning of co-investment funds basing on comparative analysis of financial markets within FM CEEC. Actual Probl. Econ. 2012, 134, 75–85. [Google Scholar]
- Vasylyeva, T.A.; Leonov, S.V.; Lunyakov, O.V. Countercyclical capital buffer as a macroprudential tool for regulation of the financial sector. Actual Probl. Econ. 2014, 158, 278–283. [Google Scholar]
- Skare, M.; Porada-Rochoń, M. Tracking financial cycles in ten transitional economies 2005–2018 using singular spectrum analysis (SSA) techniques. Equilibrium 2019, 14, 7–29. [Google Scholar] [CrossRef]
- Djalilov, K.; Lyeonov, S.; Buriak, A. COMPARATIVE STUDIES OF RISK, CONCENTRATION AND EFFICIENCY IN TRANSITION ECONOMIES. Risk Gov. Control. Financ. Mark. Inst. 2015, 5, 178–187. [Google Scholar] [CrossRef]
- Kendiukhov, I.; Tvaronavičienė, M. Managing innovations in sustainable economic growth. Mark. Manag. Innov. 2017, 3, 33–42. [Google Scholar] [CrossRef]
- Štreimikiene, D. Impact of environmental taxes on sustainable energy development in baltic states, Czech republic and Slovakia. E+M Èkon. A Manag. 2015, 18, 4–23. [Google Scholar]
- Dkhili, H. Environmental performance and institutions quality: Evidence from developed and developing countries. Mark. Manag. Innov. 2018, 3, 333–344. [Google Scholar] [CrossRef]
- Masharsky, A.; Azarenkova, G.; Oryekhova, K.; Yavorsky, S. Anti-crisis financial management on energy enterprises as a precondition of innovative conversion of the energy industry: Case of Ukraine. Mark. Manag. Innov. 2018, 3, 345–354. [Google Scholar] [CrossRef]
- Alam, J.; Rashid, B. Influential Factors of Green Consciousness in Bangladesh: A Pragmatic Study on General Public in Dhaka City. Socioecon. Chall. 2019, 3, 98–107. [Google Scholar] [CrossRef]
- Vysochyna, A.V.; Samusevych, I.V.; Tykhenko, V.S. The effect of tax tools in environmental management on region’s financial potential. Actual Probl. Econ. 2015, 171, 263–269. [Google Scholar]
- Hlaváček, P.; Janáček, J. The Influence of Foreign Direct Investment and Public Incentives on the Socio-Economic Development of Regions: An Empirical Study from the Czech Republic. E+M Èkon. A Manag. 2019, 22, 4–19. [Google Scholar]
- Akhtar, P. Warsaw School of Economics Drivers of Green Supply Chain Initiatives and their Impact on Economic Performance of Firms: Evidence from Pakistan’s Manufacturing Sector. J. Compet. 2019, 11, 5–18. [Google Scholar]
- Dabija, D.; Bejan, B.M.; Dinu, V. How sustainability oriented is generationz in retail? A literature review. [Kiek mažmeninėje prekyboje į darną orientuota z karta? Literatūros apžvalga] Transform. Bus. Econ. 2019, 18, 140–155. [Google Scholar]
- Sjaifuddin, S. Environmental management prospects of industrial area: A case study on Mcie, Indonesia. Versl- Teor. Ir Prakt. 2018, 19, 208–216. [Google Scholar] [CrossRef]
- Bilan, Y.; Кuzmenko, Ð.; Boiko, A. Research on the impact of industry 4.0 on entrepreneurship in various countries worldwide. In Proceedings of the 33rd International Business Information Management Association Conference, IBIMA 2019: Education Excellence and Innovation Management through Vision 2020, Granada, Spain, 10–11 April 2019; pp. 2373–2384. [Google Scholar]
- Bilan, Y.; Lyeonov, S.; Vasylieva, T.; Samusevych, Y. Does Tax Competition for Capital Define Entrepreneurship Trends in Eastern Europe? Line J. Model. New Eur. 2018, 2018, 34–66. [Google Scholar] [CrossRef]
- Bilan, Y.; Vasylieva, T.; Lyeonov, S.; Tiutiunyk, I. Shadow Economy and its Impact on Demand at the Investment Market of the Country. Entrep. Bus. Econ. Rev. 2019, 7, 27–43. [Google Scholar] [CrossRef]
- Kostyuchenko, N.; Starinskyi, M.; Tiutiunyk, I.; Kobushko, I. Methodical Approach to the Assessment of Risks Connected with the Legalization of the Proceeds of Crime. Montenegrin J. Econ. 2018, 14, 23–43. [Google Scholar] [CrossRef]
- Çerae, G.; Meço, M.; Çera, E.; Maloku, S. The effect of institutional constraints and business network on trust in government: An institutional perspective. Adm. Si Manag. Public 2019, 1, 6–19. [Google Scholar] [CrossRef]
- Ivančiks, J.; Trofimovs, I.; Teivāns-Treinovskis, J. EVALUATIONS OF SECURITY MEASURES AND IMPACT OF GLOBALIZATION ON CHARACTERISTICS OF PARTICULAR PROPERTY CRIMES. J. Secur. Sustain. Issues 2019, 8, 569–579. [Google Scholar] [CrossRef]
- Levchenko, V.; Boyko, A.; Bozhenko, V.; Mynenko, S. MONEY LAUNDERING RISK IN DEVELOPING AND TRANSITIVE ECONOMIES: ANALYSIS OF CYCLIC COMPONENT OF TIME SERIES. Versl- Teor. Ir Prakt. 2019, 20, 492–508. [Google Scholar] [CrossRef]
- Ślusarczyk, B. The Management Faculty, Czestochowa University of Technology, Czestochowa, Poland and North-West University, Faculty of Economic Sciences and IT, Vaal Triangle, South Africa Tax incentives as a main factor to attract foreign direct investments in Poland. Adm. Si Manag. Public 2018, 30, 67–81. [Google Scholar]
- Leonov, S.; Yarovenko, H.; Boiko, A.; Dotsenko, T. Prototyping of information system for monitoring banking transactions related to money laundering. Edp Sci. 2019, 65, 04013. [Google Scholar] [CrossRef][Green Version]
- Oliinyk, V.; Kozmenko, S.; Wiebe, I.; Kozmenko, S. Optimal Control over the Process of Innovative Product Diffusion: The Case of Sony Corporation. Econ. Sociol. 2018, 11, 265–285. [Google Scholar] [CrossRef]
- Kwiliński, A. Mechanism of modernization of industrial sphere of industrial enterprise in accordance with requirements of the information economy. Mark. Manag. Innov. 2018, 4, 116–128. [Google Scholar]
- Dharfizi, A.D. The energy sector and the internet of things – sustainable consumption and enhanced security through industrial revolution 4.0. J. Int. Stud. 2018, 14, 99–117. [Google Scholar]
- Xiong, Z.; Ye, J.; Wang, P. Does the institutional environment affect the failed technological innovation in firms? evidence from listed companies in china’s pharmaceutical manufacturing industry. Transform. Bus. Econ. 2019, 18, 1. [Google Scholar]
- Yazdani, M.; Zolfani, S.H.; Zavadskas, E.K. NEW INTEGRATION OF MCDM METHODS AND QFD IN THE SELECTION OF GREEN SUPPLIERS. J. Bus. Econ. Manag. 2016, 17, 1097–1113. [Google Scholar] [CrossRef]
- Atkočiūnienė, Z.O.; Miroshnychenko, O. TOWARDS SUSTAINABLE DEVELOPMENT: THE ROLE OF R&D SPILLOVERS IN INNOVATION DEVELOPMENT. J. Secur. Sustain. Issues 2019, 9, 409–419. [Google Scholar]
- Maciejewski, M.; Wach, K. What determines export structure in the EU countries? The use of gravity model in international trade based on the panel data for the years 1995–2015. J. Int. Stud. 2019, 12, 151–167. [Google Scholar] [CrossRef]
- Lewandowska, A.; Stopa, M. Do SME’s innovation strategies influence their effectiveness of innovation? Some evidence from the case of Podkarpackie as peripheral region in Poland. Equilibrium 2019, 14, 521–536. [Google Scholar] [CrossRef]
- Tung, L.T. Does Foreign Direct Investment Really Support Private Investment in an Emerging Economy? An Empirical Evidence in Vietnam. Montenegrin J. Econ. 2019, 15, 7–20. [Google Scholar] [CrossRef]
- Kozmenko, O.; Poluliakhova, O.; Iastremska, O. Analysis of countries’ investment attractiveness in the field of tourism industry. Investig. Manag. Financ. Innov. 2015, 12, 56–63. [Google Scholar] [CrossRef]
- Fetscherin, M. The determinants and measurement of a country brand: The country brand strength index. Int. Mark. Rev. 2010, 27, 466–479. [Google Scholar] [CrossRef]
- Lyulyov, O.; Chygryn, O.; Pimonenko, T. National brand as a marketing determinant of macroeconomic stability. Mark. Manag. Innov. 2018, 3, 142–152. [Google Scholar] [CrossRef]
- Bilan, Y.; Lyeonov, S.; Lyulyov, O.; Pimonenko, T. Brand management and macroeconomic stability of the country. [Zarządzanie marką i stabilność makroekonomiczna kraju]. Pol. J. Manag. Stud. 2019, 19, 61–74. [Google Scholar] [CrossRef]
- Lenart-Gansiniec, R.; Sułkowski, Ł. Crowdsourcing—A New Paradigm of Organizational Learning of Public Organizations. Sustainability 2018, 10, 3359. [Google Scholar] [CrossRef]
- Sułkowski, Ł.; Seliga, R.; Wozniak, A. Image and Brand Awareness in Universities in Consolidation Processes; Springer Science and Business Media LLC: Berlin, Germany, 2019; pp. 608–615. [Google Scholar]
- Moriarty, P.; Honnery, D. Energy Efficiency or Conservation for Mitigating Climate Change? Energies 2019, 12, 3543. [Google Scholar] [CrossRef]
- Magda, R.; Vasa, L. Economic aspects of natural resources and land usage. Folia Pomeranae Universitatis Technologiae Stetinensis. Oeconomica 2012, 69, 49–58. [Google Scholar]


| Variables | Indicators | Formula of Assessment |
|---|---|---|
| Composite index of environmental operation of a company’s activity (C) | ||
| Reduction of natural resources consumption and increase of the efficiency of their use | C1 | |
| Use of recycling technology | C2 | |
| Conducting environmental campaigns | C3 | |
| Innovation equipment for controlling emissions and discharges | C4 | |
| Using energy-efficient technologies | C5 | |
| Composite index of investment for ecological modernization (I) | ||
| Innovation technology to produce products with the purpose of minimizing environmental damage | I1 | |
| Eco-packaging for existing and new products | I2 | |
| Innovation design and technology of production to improve resource efficiency and environmental sustainability during all stages of a product’s life circle | I3 | |
| Certificates of quality and environmental management and audit | I4 | |
| Composite index of relevance to the indicative green goals of the company (Im) | ||
| Compliance with environmental standards and awareness of environmental risks | Im1 | |
| Promotion of the company’s green activities | Im2 | |
| Promotion of activity on implementation of green projects | Im3 | |
| Listing in the index basket (green stock indices) | Im4 | |
| Corporate Social Responsibility Report | Im5 | |
| Variables | VIF | |
|---|---|---|
| The information about the company’s green activities on the company’s website was not true (G1) | 1.55 | 0.78 |
| The non-financial report was not presented on the company’s website (G2) | 1.47 | 0.75 |
| The information on the official website could not be proven by real data (G3) | 1.29 | 0.70 |
| The information about the green achievement on the company’s website was exaggerated (G4) | 1.56 | 0.71 |
| The information on the company’s website masked the company’s real economic goals (G5) | 1.53 | 0.82 |
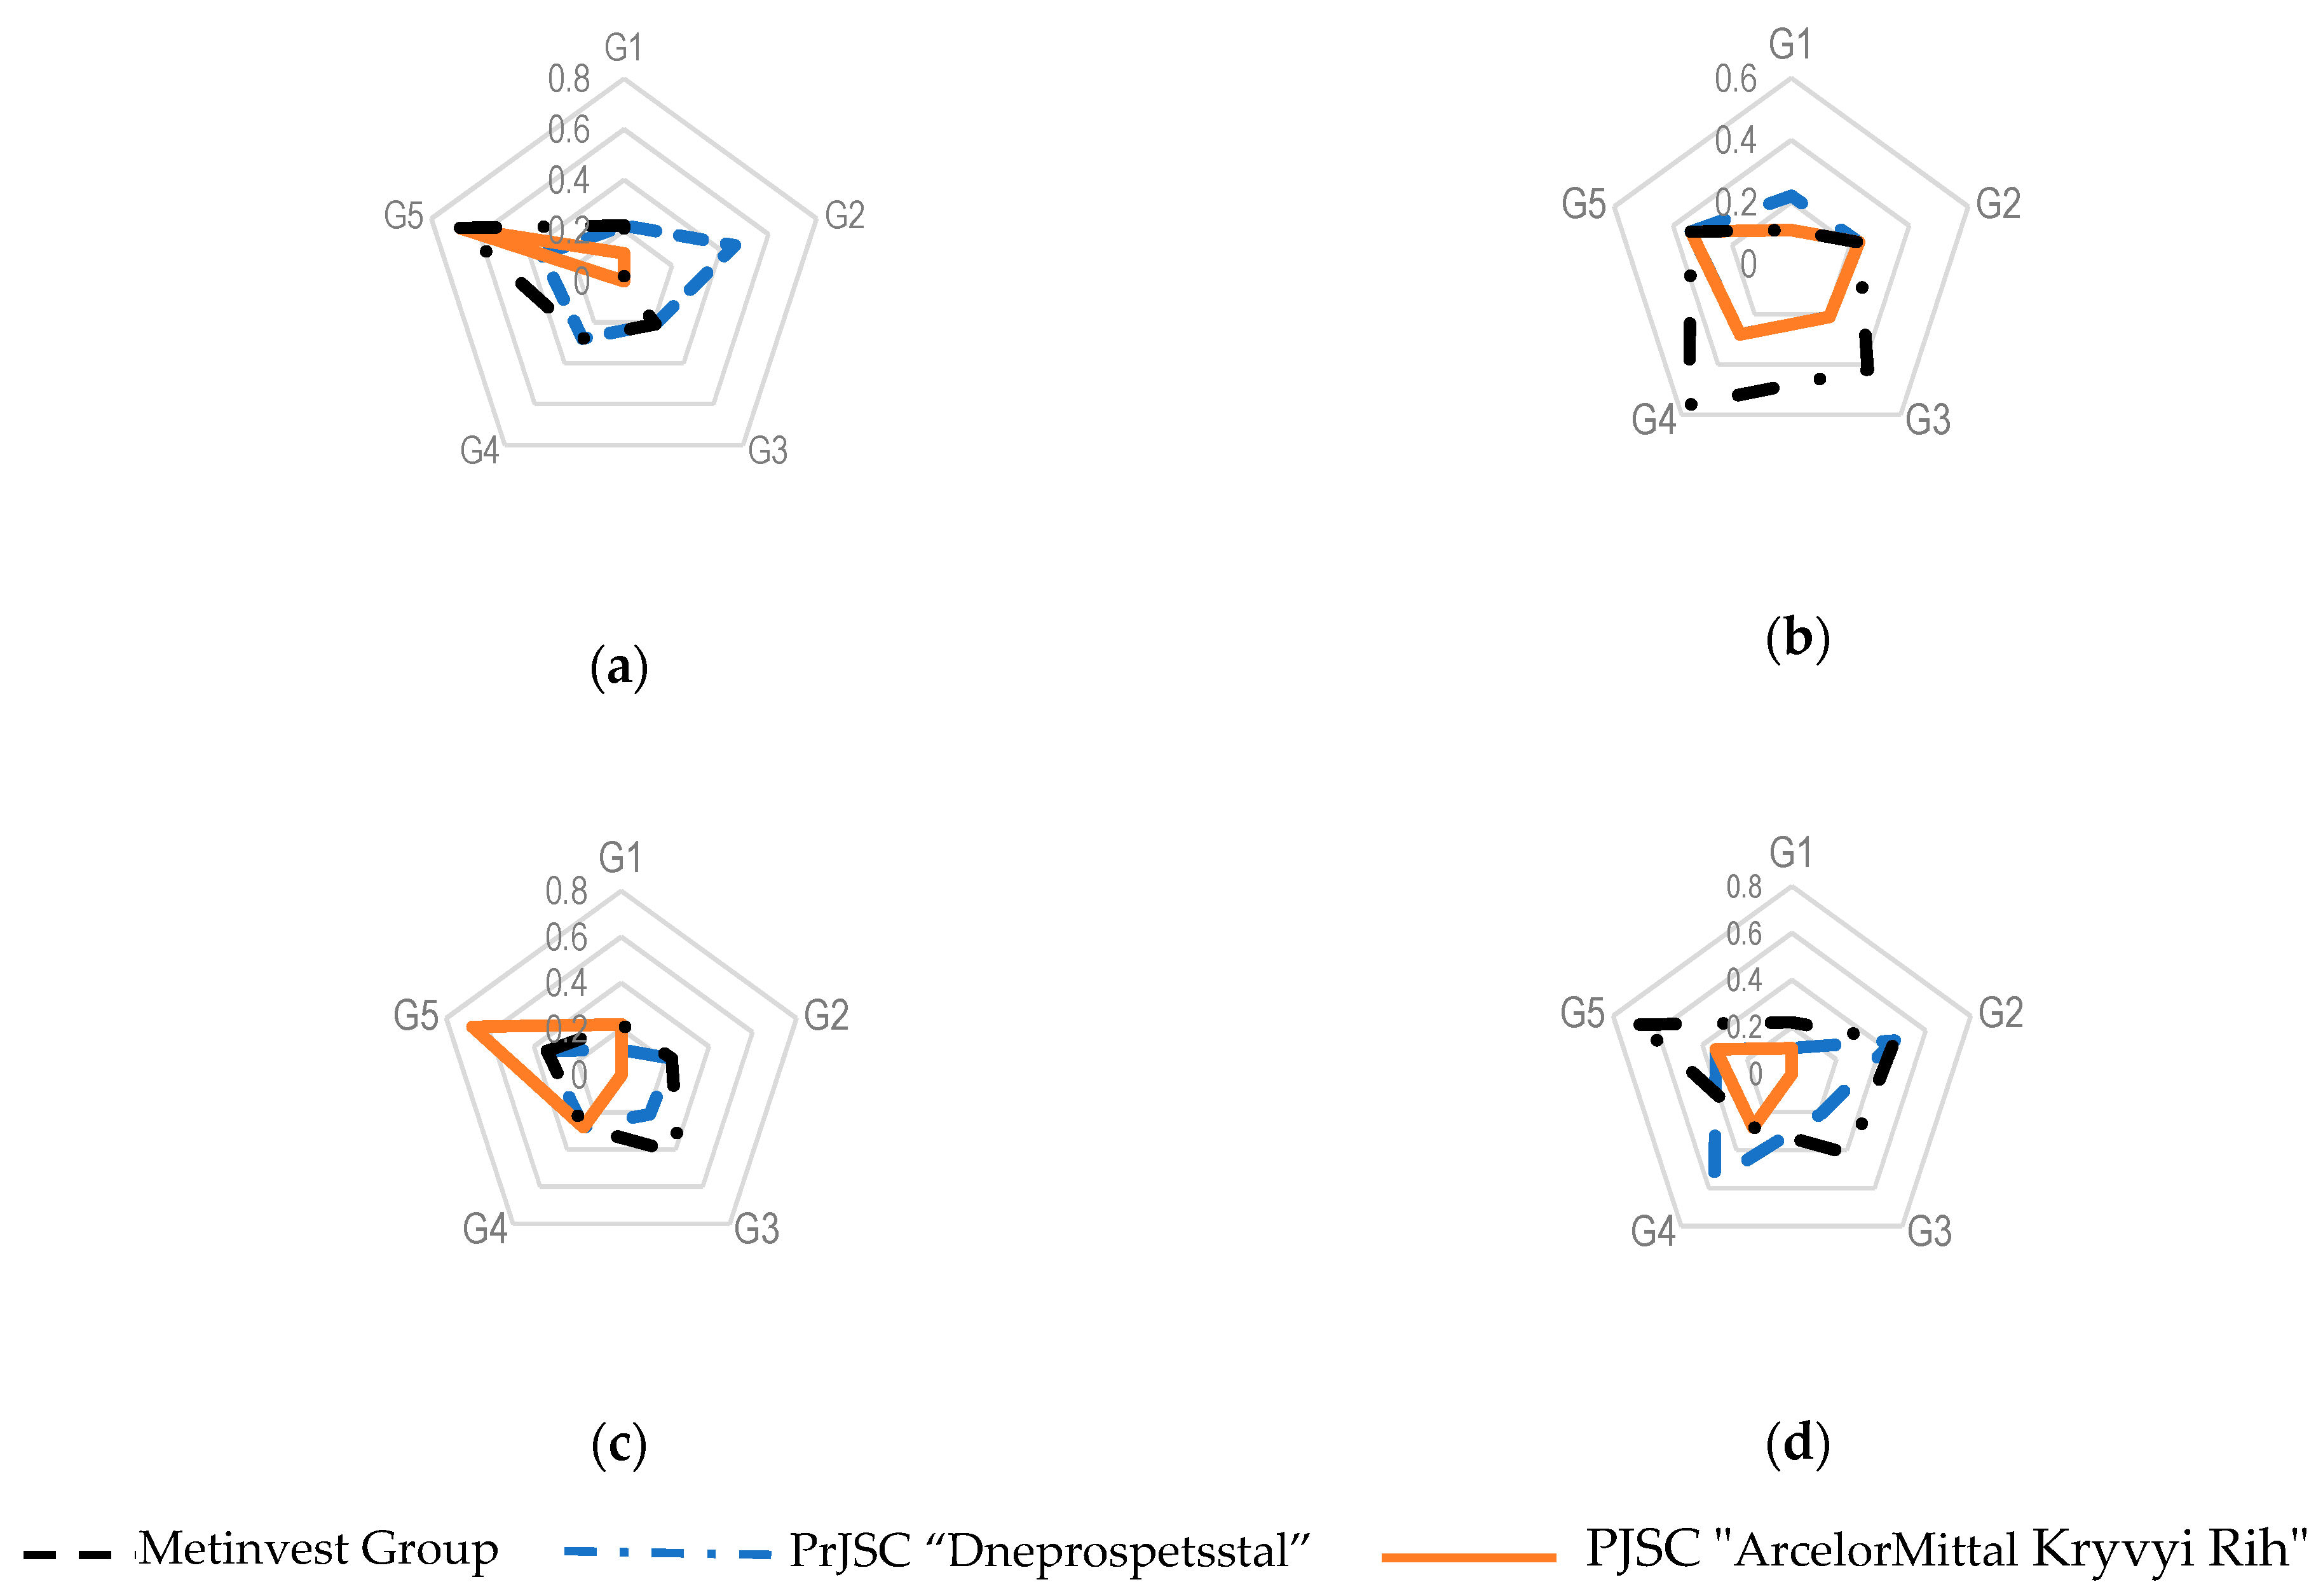
| Company | 2014 | 2015 | 2016 | 2017 |
|---|---|---|---|---|
| PrJSC “Dneprospetsstal” | 1.51 | 1.10 | 1.00 | 0.70 |
| PJSC “ArcelorMittal Kryvyi Rih” | 0.79 | 0.80 | 1.18 | 0.65 |
| Metinvest Group | 1.39 | 0.87 | 1.10 | 1.40 |
| Year | PrJSC “Dneprospetsstal” | PJSC “ArcelorMittal Kryviy Rih” | Metinvest Group |
|---|---|---|---|
| Comparative index (GBD—comparative index) | |||
| 2014 | 0.77 | 0.80 | 0.60 |
| 2015 | 0.76 | 0.90 | 0.70 |
| 2016 | 0.7 | 0.94 | 0.66 |
| 2017 | 0.5 | 1.01 | 0.97 |
| Target index (GBQ—target index) | |||
| 2014 | 1.55 | 1.75 | 1.68 |
| 2015 | 0.85 | 1.12 | 0.75 |
| 2016 | 0.83 | 1.20 | 1.02 |
| 2017 | 0.85 | 1.30 | 0.83 |
| Latent Variables | Variables | ||
|---|---|---|---|
| 0.87 (0.76) * | 0.90 (0.77) * | −0.56 (0.78) * | |
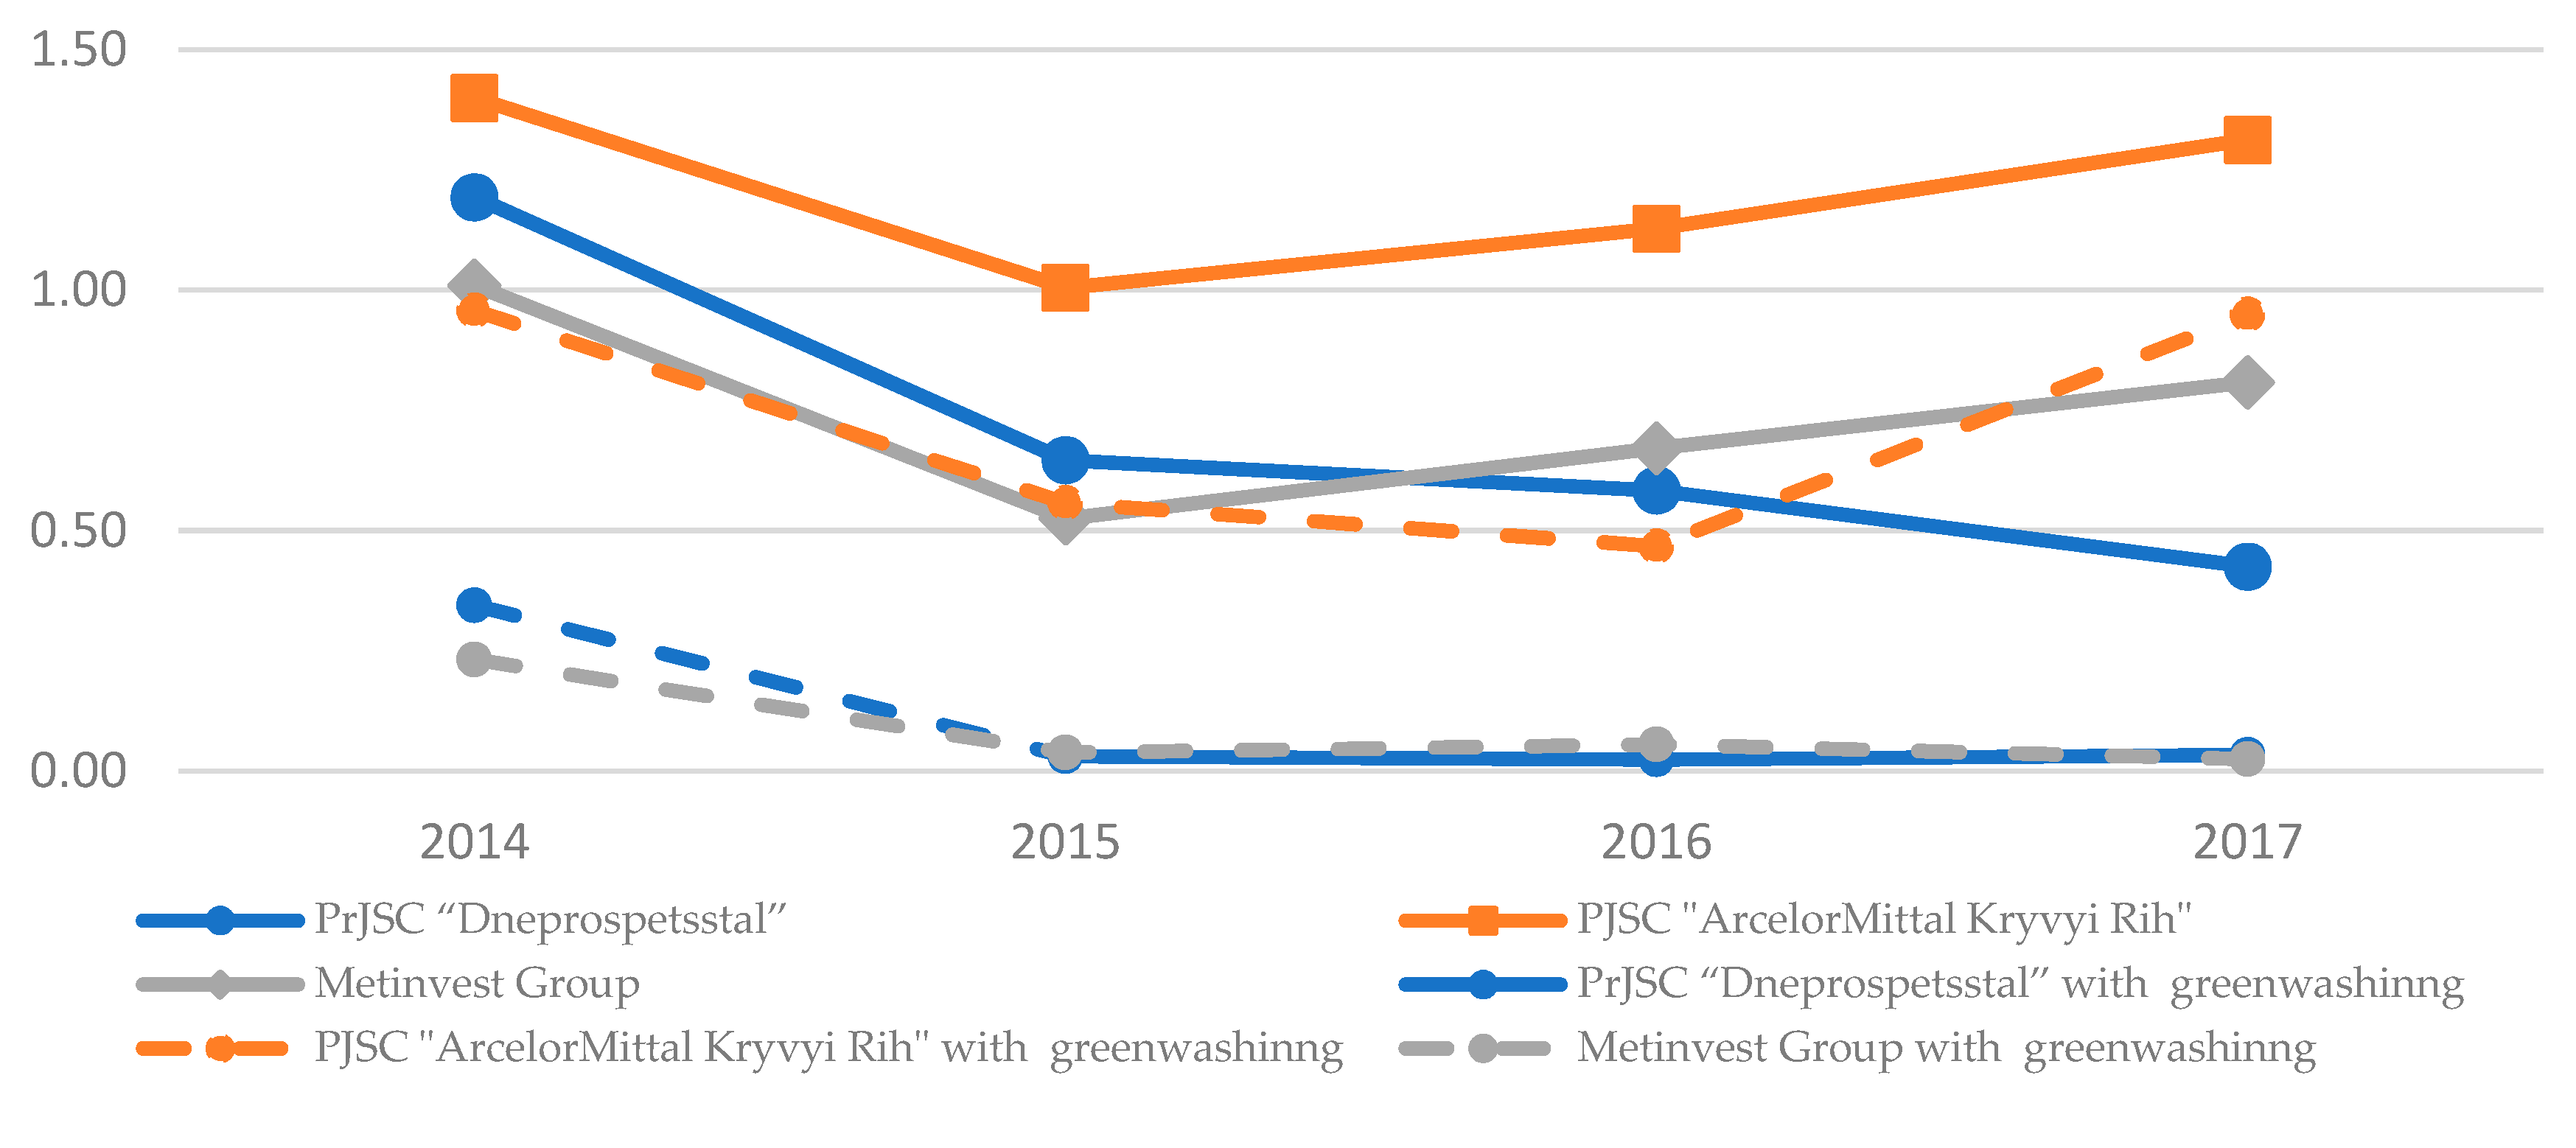
| Companies | 2014 | 2015 | 2016 | 2017 |
|---|---|---|---|---|
| PrJSC “Dneprospetsstal” | 0.34 | 0.03 | 0.02 | 0.03 |
| PJSC “ArcelorMittal Kryvyi Rih” | 0.96 | 0.56 | 0.47 | 0.95 |
| Metinvest Group | 0.23 | 0.04 | 0.06 | 0.02 |
© 2020 by the authors. Licensee MDPI, Basel, Switzerland. This article is an open access article distributed under the terms and conditions of the Creative Commons Attribution (CC BY) license (http://creativecommons.org/licenses/by/4.0/).
Share and Cite
Pimonenko, T.; Bilan, Y.; Horák, J.; Starchenko, L.; Gajda, W. Green Brand of Companies and Greenwashing under Sustainable Development Goals. Sustainability 2020, 12, 1679. https://doi.org/10.3390/su12041679
Pimonenko T, Bilan Y, Horák J, Starchenko L, Gajda W. Green Brand of Companies and Greenwashing under Sustainable Development Goals. Sustainability. 2020; 12(4):1679. https://doi.org/10.3390/su12041679
Chicago/Turabian StylePimonenko, Tetyana, Yuriy Bilan, Jakub Horák, Liudmyla Starchenko, and Waldemar Gajda. 2020. "Green Brand of Companies and Greenwashing under Sustainable Development Goals" Sustainability 12, no. 4: 1679. https://doi.org/10.3390/su12041679
APA StylePimonenko, T., Bilan, Y., Horák, J., Starchenko, L., & Gajda, W. (2020). Green Brand of Companies and Greenwashing under Sustainable Development Goals. Sustainability, 12(4), 1679. https://doi.org/10.3390/su12041679