Article

The Willingness to Pay for Beach Scenery and Its Preservation in Italy

by
Ilaria Rodella
1,*,
Fabio Albino Madau
2 and
Donatella Carboni
3
1
International Research Office, University of Padova, via Martiri della libertà 8, 35122 Padova, Italy
2
Department of Agriaria, Sassari University, via Enrico de Nicola 1, 07100 Sassari, Italy
3
Department of Human and Social Sciences, Sassari University, via Roma151, 07100 Sassari, Italy
*
Author to whom correspondence should be addressed.
Sustainability 2020, 12(4), 1604; https://doi.org/10.3390/su12041604
Submission received: 18 January 2020 / Revised: 15 February 2020 / Accepted: 16 February 2020 / Published: 20 February 2020

Abstract

:
In order to understand the multiple values of landscape, this paper suggests an evaluative methodology that takes into account a quantitative approach, public opinion, and an economic estimation. This study analyzes the coastal scenery of 40 Italian beaches using a fuzzy logic and a Contingent Valuation (CV). Each site was classified into five categories: Class I beaches were littorals with high natural settings; Class II sites were natural and semiurban beaches having low influences by anthropic structures; Classes III, IV, and V had lower evaluations due to poor physical and human condition. A questionnaire survey analyzed beach users’ preferences, judgment, and Willingness to Pay (WTP). Results suggest that landscape judgment is directly correlated to scenery assessment; therefore, beaches of Class I and II were judged beautiful while beaches of Class IV and V had poor judgments. Similarly, the importance given to the landscape was highest in Class I and II than in the others. WTP for the conservation of the selected beaches was about €16 per season. Our findings suggest that people are disposed to pay more for a beach with the top-grade of scenery (Class I and II) and low grade of urbanization. Moreover, WTP would rise for females and for nonresident users with an academic degree, which appreciated the coastal landscape.

1. Introduction

Landscape is defined as “a specific part of the territory, as perceived by the populations, whose character derives from the action of natural and/or human factors and their interrelations” [1]. Therefore, it is considered a complex system of relations among the human/social, natural/manufactured, and historical/cultural values. Its characteristics are the result of these factor interactions, crucial to individual and collective well-being, as well as to the sustainable development of a territory [2]. Landscape is also defined as the result of three components: natural, cultural/social, and perceptual and aesthetical [3,4,5]. Aesthetic and perceptual elements include sight (extent, scale, continuity, color, diversity, views, forms, patterns, etc.), besides the other components and senses, such as joy, comfort, amazement, associations, and memories. A study about the aesthetic judgment of a touristic destination [5], instead, individuates nine dimensions that define the landscape: the landscape scale (spatial characteristics, physical proportion, degree of crowdedness, color visual cues), time (modern or historic perception of a destination), condition (hygienic and physical attributes), sound (source and volume), balance (authentic vs. artificial integrity), diversity (variety of visual aspects), novelty (contrast between familiar and new environment), shape, and unique features. Many of these parameters are temporary (e.g., the smell of salt air) and difficult to measure; on the other hand, the visual impression of a coastal landscape remains the main one of the senses. Moreover, the visual feature of a landscape, i.e., its scenery, has a great value as a tourist attraction and can be translated into a resource or a public good, also because it is a part of the existing resource management programs [6]. In fact, coastal urbanization has always been intensely related to the exploitation of natural resources like scenery [7]. On the other hand, the coastal scenery assessment is functional for coastal preservation, protection, and improvements, and provides scientific instruments for coastal policy-makers [8]. Furthermore, coastal landscape and scenery offer many environmental functions supporting human life and economic activity, closely related to a range of physical, chemical, and biological processes besides recreation and scientific education functions [9].
The main aims of coastal landscape management are numerous as reported by [10], including (i) preserving remaining landscapes and constructing new ones with required attributes; (ii) promoting the sites growth employing landscape values; (iii) integration of landscape policy and other management policies; (iv) elaboration of methodologies and tools to achieve high quality of landscape parameters; (v) using the economic, natural, and heritage characteristics of landscape to promote areas with different values; and (vi) establishing consensus by public engagement on landscape. These goals demonstrate that the management of coastal landscape commonly involves the objective and subjective assessment of landscape and their economic values [7]. Several methods and techniques have been developed for the evaluation of landscape values, like questionnaires, photograph analysis [7], statistical techniques, and economic estimations [11,12,13] (Table 1).
These approaches, based on multidimensional evaluation methods [30,31], estimate the landscape quality by interpreting people’s perception of environmental characteristics [32,33,34] through investigations or interviews [35,36]. Several multidisciplinary studies, conducted in Europe and America since 1960, have evaluated the landscape through the perception tool, differing from each other for divergent theoretical and philosophical bases and the importance given by the individuals. Therefore, beauty perception could potentially vary and be related to the criteria used to evaluate environments [5]. On the contrary, some evaluation techniques were developed to moderate subjectivity and achieve a quantitative estimation. Among these quantitative and objective landscape tools, Coastal Scenic Evaluation System (CSES) is one of the most applied techniques. Its popularity is due to its double use, both for landscape preservation and protection, and as a tool for creating new perspectives and improving the policies for better landscape management [22,37]. This evidence-based approach was carried out in several countries around the world [25,38], e.g., in Portugal, Croatia, Malta, Fiji, Australia, USA, Japan, China, Colombia, etc. [22,26,39,40,41]. Furthermore, CSES has been applied to some recent studies in Italy [7], Brazil [28,29], and Spain [42].
Coastal scenery is an important resource for tourism, but its value is difficult to calculate since the market recognizes only some ecosystem services; thus, it is estimated using non-market valuation techniques [43]. Therefore, valuing environmental goods and ecosystem services like the scenery is often challenging [44] and requires an interdisciplinary perspective from economics and other complement disciplines [45]. The principal approaches strive to deduce the landscape value in monetary terms based on the willingness to pay (WTP) as a concrete tool to express the value in a context that considers both supply and demand [44,46]. These approaches are divided into direct methods, in which a sample of subjects declared willingness to pay for the benefits derived from an environmental condition in a simulated market, such as contingency analysis [47]; and indirect methods, wherein availability to pay is detected by the behaviors exhibited by the interviewees, such as the cost method travel and hedonic price [45]. The direct method of Contingent Valuation (CV) is designed to elicit stated preference [48]. Specifically, the CV has been the most applied approach to assess the economic value of a public good of the beach besides its recreational usages [44,49,50]. This method asks a random sample of the population to state their hypothetical maximum WTP for preserving a good [51,52]. It is the only way (together with the multi-attribute choice modeling method [53]) to get knowledge of economic values when prices are not available or observable [51].
The literature reported above does not settle an important question: What is the willingness to pay to preserve or improve the scenery of the Italian coastal zone? Finding the answer is the purpose of this study. Literature in this field shows a gap precisely regarding the value of physical and human attributes of the beaches that characterize the beach landscape and its scenery. For instance, a previous study on beach scenery conducted in Italy [7] only focused on the comparison of objective and subjective scenic parameters without economic estimations. Moreover, WTP studies are commonly applied in small stretches of coast; therefore, differences and similarities in scenery parameters are not widely considered. To provide new information on these fields, this research develops a scenic evaluation of 40 Italian beaches using a fuzzy logic analysis [8,37,54]. Moreover, the purpose of this study is to assess tourists’ perceptions of coastal scenery in Italy and to evaluate the users’ WTP for landscape preservation.

2. Study Area

The study area encompasses localities in the Adriatic, Ionian, and Mediterranean coast of Italy for 40 beaches. The study sites were Rosolina Mare locates in Veneto region, Lidi di Comacchio in Emilia–Romagna region, Metaponto Lido in Basilicata region, and Alghero-Porto Torres in Sardinia.

2.1. Rosolina Mare

The Rosolina Mare littoral is encompassed between the Adige River mouth in the north and Porto Caleri lagoon mouth in the south, or a length of 8 km (Figure 1a). The littoral, located in the Veneto Regional Park, is divided into three sectors: a semi-urbanized area in the north, a central urbanized area, and a natural area called Giardino Botanico di Porto Caleri in the south (Site of Community Importance S.C.I. IT3270001, S.C.I. IT3270004) characterized by free beaches. This area is located among dunes, pinewood, saltmarshes, and a wetland. The beach width of this sandy littoral varies from 20 to 210 m with a very low beach slope (0.5–3°).
The northern area registered a high erosion rate of about 2 m/y, while a positive trend was observed in central and southern areas (respectively 2.1 and 5.57 m/y) in the period 2000–2014 [55,56]. From 2006, in addition to groins already present in the northern stretch of coast, several nourishment interventions were carried out in the northern area for about 20–30,000 m3/y [57].
From 1955 (after the Second World War) to 2016, the human-driven land rose dramatically. In fact, in 2000, about three-quarters of the territory was affected by negative anthropic activities, i.e., seaside urban development [58].

2.2. Lidi di Comacchio

The examined coast stretch, Lidi di Comacchio, is a well-known Italian seaside resort in the Northern Adriatic Sea. It is about 16 km long and goes from Po di Goro to Porto Garibaldi including five localities: Lido di Volano, Lido di Nazioni, Lido di Pomposa, Lido degli Scacchi and Porto Garibaldi (Figure 1b). It is a microtidal environment and is defined as a low gradient sandy coast [59]. Beaches are about 20 to 60 m in width from Lido di Volano to Lido di Pomposa and from 60 to more than 100 m from Lido degli Scacchi to Porto Garibaldi [60]. The coastal dunes have been largely destroyed for the construction of seaside infrastructures, particularly from Porto Garibaldi to Lido di Nazioni, and present only some small residual dunes.
Most of these beaches are characterized by hard defence systems that are groins, revetments, breakwaters, and the dikes of the Porto Garibaldi touristic harbor that transformed the natural scenic characteristics of the beach. Despite the strong anthropic alteration, this littoral covers several naturalistic protected areas (Lido di Volano and Delta Po Park).

2.3. Metaponto Lido

The Metaponto Lido littoral is encompassed between the Basento River on the west and the Bradano River on the east, covering 7 km along the Gulf of Taranto in the Ionian Sea (Figure 1c). This is a very human-influenced littoral [61], with low sandy beaches and gently sloping off-shore by 1–2% [62]. Along the investigated littoral, beaches are mainly equipped and managed by 32 beach establishments available for tourists in front of Metaponto Lido urban center. In this stretch of coast, coastal erosion is very problematic [63,64]. In fact, sand nourishments are required every year to mitigate the erosion issue and to guarantee the recreational function of the beaches [63,64]. Despite the anthropic features that affect the littoral, such as touristic constructions and coastal defence systems (emerged and submerged breakwaters, groins, dikes, and port facilities), the landscape shows a strong presence of natural elements. Indeed, in this stretch of coast are located [65] natural and seminatural areas of the Natura 2000 Network, including Sites of Community Interest (SIC) for preserving the Mediterranean maquis: Costa jonica Foce Agri (IT9220085, Policoro, Scanzano Jonico); Costa jonica Foce Basento (IT9220080, Bernalda, Pisticci); Costa Ionica Foce Bradano (IT9220090, Bernalda); Costa Ionica Foce Cavone (IT9220095, Pisticci, Scanzano Jonico); and Bosco Pantano di Policoro e Costa jonica Foce Sinni (SIC and Special Protected Zone- SPZ- IT9220055, Policoro, Rotondella).

2.4. Alghero and Porto Torres Beaches

The Alghero littoral is located within the bay of Alghero on the northwest coast of Sardinia (Italy; Figure 1d). The Alghero littoral encompasses successions of rocky stretches, including Capo Caccia—Punta Negra and Pòglina cliffs, sandy pocket beaches (e.g., Maria Pia—Lido di Alghero, Le Bombarde, Torre del Lazzaretto, Torre del Porticciolo)—and the wetlands of Calich Pond powered by the river basins of Rio Barca, Rio Calvia, and the Oruni river.
The areas of Alghero littoral analyzed in this study encompassed the coastal stretches of Alghero city (from Cala Poglina on the south to Maria Pia–Lido San Giovanni beach on the north) and of Porto Conte National Park (from Le Bombarde beach on the south to Porto Ferro beach on the north).
The Alghero littoral is characterized by 4.4 km of sandy shore forming an arc with a NNW–SSE orientation (Lido San Giovanni beach—Maria Pia beach). The bay is bounded by the harbor of Alghero to the south and the small promontory (Fertilia) to the north. Urbanization and the tourism industry boomed in the seventies, bringing new roads and resorts to the active upper part of the beach and dunes, causing their immobilization [66]. As a consequence, the littoral showed shoreline retreat and dune erosion also due to the inner-Alghero-harbor breakwater extensions (1983, 1986, 1988, 1991, 1992) and construction and enlargement of the seawall at Punta del Paru (1983, 2001) [66].
Le Bombarde, Torre del Lazzaretto, Torre del Porticciolo, Porto Conte and Porto Ferro littorals are pocket-beaches included in the context of the Mesozoic carbonate rocks. These beaches are affected by periodic storms that induce a massive loss of the sandy sediment and serious issues difficulties for tour operators [67]. A recent survey [68] observed the movement of the sands, which results in a periodic migration of sediment from emerged to the submerged beach that afflicted the prairie of Oceanic Posidonia. Mainly frequented by tourists and residents counts the presence of several small kiosks, bars, restaurants, and beach establishments. The high environmental value of the Alghero coastal littoral includes Capo Caccia (with Foradada and Piana Islands) and Punta del Giglio area (S.C.I., Special Protected Area—S.P.A. and Marine Protected Area—MPA).
Along the Porto Torres littoral, located in the northern Sardinia coast, the study areas were Scoglio Lungo and Fiume Santo (Figure 1e). Scoglio Lungo beach, on the eastern sector of Porto Torres city, is a short beach (0.6 km long) enclosed to the west by the harbor dike and to the west by the San Gavino promontory and is a very important littoral for the resident frequentation. From the environmental point of view, this beach suffered in the past years of periodical and unauthorized nourishments that have compromised its original nature. On this beach, there are not any beach establishments, but some services are available to the users: free showers and several free parking areas [67]. Fiume Santo beach is located to the west of Porto Torres and constitutes a natural bulwark on a vast area that can be considered totally anthropized by a petrochemical industry of the nearby coast of Marinella. Indeed, the thermoelectric plants are the dominant feature of the landscape. The whole beach is free, so the bathing establishments and bars in this area are entirely absent, except for a walking kiosk that sells only beverages. The high environmental value of this coastal sector presents the S.C.I. areas “Platamona pond and juniper” and “Pilo and Casaraccio pond” and the S.P.A. “Stagno di Pilo, Casaraccio and Saline di Stintino”.

3. Materials and Methods

3.1. Coastal Scenic Evaluation System (CSES)

The CSES was carried out following the [8] method. This method has been further applied in several case study around the world (e.g., Colombia, Japan, USA, the South Pacific and Pakistan, and Cuba) [22,24,25,26,39,40,69].
Coastal scenic evaluation is a technique that makes use of 26 physical and human factors for assessing coastal scenery (Table 2). Before the CSES surveys, we analyzed the Bing aerial images of the selected case studies, quantifying beach sizes in Quantum GIS (QGIS) v. 2.18.11. environment. During the field surveys, researchers filled the checklist over a 100 m range along the sites [54] and under normal weather conditions.
In a first scenery study, carried out in 2016 by [7,70], a total of 25 beach sites located on the Adriatic, Mediterranean and Ionian coastlines were classified. In the following exploration of 2017, 15 additional beaches were classified along the Sardinia coastline.
At every location, the 26 parameters that describe the scenery were classified from 1 (absence/bad quality) to 5 (presence/excellent quality). We applied a Fuzzy Logic Assessment in order to quantify subjective pronouncements in assessment parameters [9]. The fuzzy logic model of CSES was implemented in MATLAB [71] for the assessment of D values, attribute values, and weighted averages. The algorithm is based on weighting parameters and fuzzy logic values obtaining a D value that classify scenic assessment into one of five classes ranging from Class I (extremely attractive natural beaches) to V (very unattractive urban beaches). Therefore, for all investigated beaches, a D value was calculated, statistically describing attribute values in terms of the weighted areas. The total area under the curve (AT) is defined as follows [37]:
D1 = A35/AT
D2 = A35/A13
D3 = (A35 − A13)/AT
D4 = [(−2A12) + (−A23) + (A34) + (2A45)]/AT
AT = A12 + A23+ A34 + A45
where:
  • AT is the total area under the attribute curve, and the area under the curve between attributes 1 and 2 is named A12;
  • the area under the curve between the attributes 2 and 3 is named A23;
  • the area under the curve between the attributes 3 and 4 is named A34;
  • the area under the curve between the attributes 4 and 5 is named A45;
whereas the area under the curve between attributes 1 and 3, i.e., A12 + A23, is named A13; and the area under the curve between the attributes 3 and 5, i.e., A34 + A45, is named A35.
The above calculations were carried out for all evaluated sites using decision parameters D1 to D4 [37].
The system defined five classes of scenery based on the calculated D value [37], i.e.,
  • Class I: Top natural—Extremely attractive natural site with a very high landscape value (D ≥ 0.85);
  • Class II: Natural—Attractive natural site with a very high landscape value (0.85 > D ≥ 0.65);
  • Class III: Natural—Many natural elements with little outstanding landscape features (0.65 > D ≥ 0.40);
  • Class IV: Mainly urban—Poor sites with medium landscape value and light development (0.40 > D ≥ 0.00);
  • Class V: Urban—Very unattractive urban elements, intensive development with a low landscape value (D < 0.00).
Beaches can be classified in many ways (e.g., by shape, use, urbanization level), but for this study, beaches have been classified following [72,73] and take into consideration their physical and recreational features.

3.2. Questionnaire Survey and WTP

During the bathing season (i.e., July–August 2015), several surveys were carried out by the distribution of questionnaires based on those used by [74,75]. The questionnaire also followed the National Oceanic and Atmospheric Administration (NOAA) guidelines, as suggested by [76].
The questionnaire surveyed the following sections:
  • Questions designed to identify socio-demographic and behavioral variables (sex, age, company, economic status, motivations of the users, etc.);
  • Questions aimed to investigate the user’s preference and their assessment considering landscape and users’ knowledge of environmental issues;
  • The WTP main question.
Interviews were carried out face-to-face considering a response of about 15 min (22 questions). All respondents were randomly selected for age, activities, national origin, and preferences. However, all respondents were at least 16 years old. The questionnaires were distributed in both Italian and English languages due to the presence of foreign tourists.
All answers obtained from the surveys were analyzed with Statistical Package for Social Sciences (SPSS) version 20 (Statistics Solutions) and Microsoft Excel version 2019 (Microsoft Office, Redmond, WA, USA).

WTP

A Contingent Valuation (CV) on the entire selected sample was carried out to elicit tourist’s willingness to pay (WTP) for preserving the beach environment. We used a close-ended approach, provided that individual value is elicited by asking the WTP for a certain amount (BID). We applied a dichotomous choice model with Yes/No answer. In other terms, we asked participants if they would be willing to pay the given amount for beach preservation.
The WTP question, as written on the survey, was stated in the following way:
“In case a financial fund is constituted in order to ensure the appropriate management of the beach, would you pay X € (for person) each season in this territory?”
We followed [77] in choosing four offered prices (BID): 2 €, 5 €, 10 €, 20 €. These prices were used in the close-ended dichotomous survey by means of four sorts of questionnaires differing in the offered prices. Each survey contained only one randomly selected amount, which was distributed over the 800 surveys. In our hypothetical market scenario, the voluntary contribution was the individuated mean by way of potentially paying the asked amount. Figure 2 reports the frequency of questionnaire distribution for each scenery class. The prevalent distribution was carried out in Class III (32.18%) followed by Class II (27%). Classes V and IV were less surveyed (18.74% and 17.39% respectively) and Class I covered only 4.68% of the cases.
A Double Bounded (DB) dichotomous choice was used to offer the second amount. This follow-up question depended on the beach users’ reply to the first amount, as applied in [72] and suggested by [78].
From a conceptual perspective, the individual utility comes from both environmental good characteristics and own income [79,80]. It means that the response function reflects a utility function U (j, Y, s), where j is a dichotomous variable associated with use of a given beach (j = 1, use of the good; j = 0, non-use of the good), Y is the individual income, and s is vector of the socio-economic characteristics. Following this approach, we estimated the WTP based on [72] model.
Furthermore, we adopted socio-demographic features and knowledge about environmental issues as independent variables that affected the WTP. Therefore, we settled a multivariate model to estimate the contribution of the individuated variables affecting WTP [81]. The description of the variables is reported in Table 3.
Some beach features are expected to influence WTP. Scenery was analyzed considering the aforementioned ordinal categories aforementioned described in methods (Section 3.1). The available space per person was categorized in 3 classes as reported in Table 3. Three ordinal variables expressed the landscape judgment and the landscape importance: bad, indifferent and beautiful (LJ; Table 3), and low, medium and high (LI; Table 3), respectively. Knowledge of beach erosion was proxied by dummy and binary variables.
The software Gretl® was used to elaborate statistical data for WTP estimation. The Generalized likelihood-ratio test was adopted as a testing procedure for evaluating the more suitable model to the data (with or without the constant term) [82], defined as (6):
⎣ = − 2ln ⊄ = − 2 {ln [L(H0) / L(H1)]}
where L(H1) and L(H0) are the log-likelihood value of the adopted model (with constant) and of the restricted model (without constant), respectively. The statistic test ⎣ has approximately a chi-square (or a mixed-square) distribution with a number of degrees of freedom equal to the number of restrictions, assumed to be zero in the null-hypothesis. When ⎣ is lower than the corresponding critical value (for a given significance level), we cannot reject the null hypothesis.

4. Results

4.1. CSES

Results from the previous investigation [7] have been integrated into this paper (Table 4). Forty Italian bathing areas were assessed and classified using the CSES (Table 4 and Figure 3). Sites were categorized as follow: 7 sites (17.5%) appeared in Class I; 5 (12.5%) in Class II; 10 (25%) in Class III; 10 (25%) in Class IV; and 8 sites (20%) in Class V (Figure 3). Beach type was also categorized into natural (15), semiurban (14), and urban (11). D value of natural beaches varied from −0.26 to 1.21 with a mean value of 0.73 and showing a standard deviation of 0.36. Semiurban beaches were characterized by D value ranges from −0.06 to 1.12 with a mean value of 0.36 and the smallest standard deviation in comparison with the other categories (0.29). Urban beaches showed the greatest variability of D value (−0.61; 0.6; mean value of −0.02; standard deviation 0.41). Figure 4 and Supplementary Materials show all results in percentage and typology.

4.1.1. Class I Sites

D value ≥ 0.85 was recorded at eight sites (Table 5 and Figure 3): Porto Caleri Free Beach 1 and Porto Caleri Free Beach 3 in Rosolina Mare littoral; Lido Marinella—free beach in Metaponto Lido; Torre del Lazzaretto, Torre del Porticciolo, Porto Conte and Porto Ferro beaches in Alghero littoral. All human parameters scored five (excellent) except litter (score four) at Porto Caleri beach (Figure 5a). This beach is located in a natural surrounding free from urban infrastructures, coastal defence systems, and domestic sewage. This environment was encompassed by the presence of incipient foredunes and ancient dunes, pinewood, saltmarsh, the wetland of the natural area called “Giardino Botanico di Porto Caleri”. Lido Marinella beach was defined by high human parameters, in particular, no evidence of sewage and utilities like revetments, pipelines, seawalls and natural skyline (score five). Furthermore, disturbance factor, litter, built environment, and access type gave a high score (score four), because this beach was generally not crowded, far from traffic roads, and free from anthropic infrastructures. This beach also presented an attractive vista, open almost on three sides, and clear blue water color during the survey. Torre del Lazzaretto, Torre del Porticciolo, Porto Conte, and Porto Ferro beaches in Alghero littoral were extremely attractive natural sites with a very high landscape value. These beaches (Figure 5b–f) are located in the natural protected areas of Parco Regionale di Porto Conte (http://www.parcodiportoconte.it/ente-parco.aspx?ver=it) that include the national forest Le Prigionette, a part of the Geomineral Park of Sardinia, the Sites of Community Importance (SCI) Capo Caccia and Punta Giglio, and the Special Protection Area (SPA) of Capo Caccia.

4.1.2. Class II Sites

Natural, semi-natural, and urban beaches with high landscape values and a low anthropogenic impact characterized this scenic class (D value between 0.65 and 0.85; Table 3). We classified five beaches within this category, i.e., Porto Caleri 2, Riva dei Greci, Le Bombarde beach (Figure 6a), Cala Tramariglio, Dragunara (Figure 6b), of which only Cala Tramariglio are located in a semiurban beach. The remaining beaches are instead located in protected areas (e.g., Pollino National Park and Capo Caccia SCI). The human parameters that interfere with the D value of these beaches are one parking lot at Dragunara beach (Figure 6b), which is visible from the beach line; crowding, especially during the summer season; vegetation debris and litter at Porto Caleri 2; and disturbance factors, especially touristic noise at Riva dei Greci beach, which is located in front of a camping village.

4.1.3. Class III Sites

This class includes ten sites (four natural, three semiurban, and three urban beaches). Marina di Porto Caleri (Rosolina), Ipanema Lido di Volano, and Magna Grecia beach, Basento—free beach (Metaponto Lido), Lido San Giovanni, Maria Pia, La Punta Negra, Mugoni beach, Poglina, and Fiume Santo beaches belong to this category (Table 5). D values were particularly affected by the absence of attractive vista and crowding that induced high levels of noise (at Mugoni beach, Figure 7a, Ipanema Lido di Volano, Magna Grecia), litter, and beach pollution in general (Marina di Porto Caleri; Figure 7c), abundant vegetation debris along the Poglina beach (Figure 7d) and Basento—free beach (Figure 7e). Furthermore, two beaches are affected by anthropic developments, i.e., the petrochemical industry at Fiume Santo (Figure 7b) and the Argonauti harbor near the Basento beach.

4.1.4. Class IV Sites

Ten beaches were classified within this class, which included seminatural (8) and urban (2) beaches having low scenic values principally because of anthropogenic activities. In fact, the urbanization level of these littorals is highly connected to utilities, poor skyline quality, litter, noise disturbance, and a loss of natural landscapes. These beaches are Camping Rosapineta—free beach, Tizè beach, Perla beach (RO), Lido di Nazioni and Lido degli Scacchi—free beach (FE; Figure 8c), Blumen Bad, Ermitage (Figure 8a), Mondial beach (Figure 8b), Bagno Le Dune (MT), Cala Bona (SS). Beaches of Lido di Comacchio and Metaponto Lido, in particular, are affected by the presence of several coastal defence structures like emerged and submerged breakwaters and groins. On the other hand, beaches like Camping Rosapineta, Tizè, and Perla (Rosolina Mare) presented low scores not for the presence of defence structures but due to sewage and noise disturbance, especially during the summer season.

4.1.5. Class V Sites

Eight sites were classified as urban beaches (i.e., Aloha beach establishment, Scoglio Lungo), one as a semiurban beach (Casoni—free beach), and one as a natural beach (Lido di Volano South—free beach). Normally, the principal characteristic of these sites is the unattractive urbanization. These sites are very unappealing beaches with intensive touristic and urban development and very low scenic values (Figure 9). The worst characteristics of these beaches were the high amounts of litter, high noise levels, degradation of natural environments, and water pollution.

4.2. Landscape Assessment and WTP

One hundred twenty-three questionnaires were collected in Rosolina, 145 in Lidi di Comacchio, 112 in Metaponto Lido and 431 in Sardinia beaches (which included 41 questionnaires in Scoglio Lungo and 104 in Fiume Santo—Porto Torres, 286 at Alghero littoral) for a total of 811 surveys in 2015.

4.2.1. Beach Users’ Profile

Table 5 highlights the main results of users’ profiles for each scenery class. Users were, on average, 44.6% males and almost 54% females, even if there was a prevalence of males in Class I (60.5%) compared to all other classes. Interviewees were prevalently between 41 to 65 years old (43.4%) and the mean age of females was 37 years (standard deviation 15.5) and 42 years for males (standard deviation 19.6). Tourism was principal of the family type with children (43.4%) in all classes, excepted for Class II beaches, where users were prevalent friends (42%). The predominant educational level was college (48.3%), followed by an academic degree (30.3%) and secondary school (19.7%). Class II showed the maximum percentage of academic degrees (48.9%) in comparison to other beaches. On the contrary, beaches of Class V were prevalently frequented by people with low educational level. The interviewees were not resident in the locality (68.6%), even if beaches of Class I showed an occurrence of resident users (65.8%). The annual income was prevalently lower than 20,000 € (33.3%) or between 20,000 and 31,000 € (24.7%). The highest percentage (about 60%) of low income (<20,000 €) was declared by users of Class I. On the other hand, users with annual income higher than 41,000 € were recorded in beaches of Class II.
Reason for choosing the beach was primarily sea and beach in sites of I, II, and III classes (34.2%, 71.7%, and 46.4% respectively; Table 5), even if an average of 15.4% answered “have a holiday home” and an average of 17.5% answered “proximity to residence”. Specifically, 54.6% of users of Class V had a holiday home or lived near the beach (23% and 29.6% respectively), while 34.2% of users of Class I chose the beach because of their proximity to residence. Other factors, like relax/quiet (8.1%) and play sport/amusement (2.5%), also play a role. Only 2.2% of users choose “nature and landscape”; therefore, they were not considered the principal reasons for choosing the beach.

4.2.2. Landscape Assessment, Physical, Environmental, and Management Factors

The landscape was judged beautiful for 68.4% of users, prevalently of Classes II and I (90.9% and 81.6%, respectively; Table 6). On the other hand, the poorest evaluation was registered at Class V beaches (bad for 19.1% of users). The landscape value followed the landscape judgment; therefore, Class I and II scored the best value (high for 60.5% and 80.8%; Table 6). Users knew the problem of coastal erosion (an average of 87.4%), considering it an important issue (85.8% of beach users; Table 6).
Table 7 reports the relationship between landscape judgment and the importance given by users.

4.2.3. WTP Analysis

About 60% of the interviewees were willing to pay for the preservation of the environmental quality of the landscape. As reported in Table 8, positive answers were prevalently found at Class I and II beaches, followed by Class V, III, and IV beaches.
Figure 10a highlights that there is a positive relationship between the “yes” answer to the initial BID 0 and the landscape value. Therefore, the highest percentage of “yes” responses corresponded to the high value given to the landscape, and the reverse was true for the “no” answer. In the same way, the “yes” answer percentage regularly decreased with the landscape value using BID 1 in the follow-up question (Figure 10b).
The test on regression indicates that the preferred model would include the constant term and signs of estimated parameters are consistent with economic theory; therefore, we are able to estimate the median WTP of 16.59 € (Table 9).
Results from the application of the multivariate model, which is a sort of construct validity equation, are reported in Table 10 and Table 11. The model was statistically significant due to the inclusion of the constant inside the generalized likelihood-ratio test. Some explanatory variables were statistically significant. Concerning beach scenery, we found that WTP tends to increase with the increment of D value; therefore, WTP is expected to decrease from Class I to Class V. The level of education and gender appear statistically significant in the model. In fact, WTP would increase in females with a high educational level. The relationship was found not statistically significant in the case of residence and beach frequentation variables (Table 10). Table 11 highlights the significance of the landscape in WTP assessment. In fact, WTP tends to increase with the increment of landscape importance and its judgment. On the contrary, WTP is affected by the crowding perception (and low available space per person on the beach), even if this parameter is not correlated to the erosion phenomenon from the users’ point of view. On the other hand, adequate space per person tends to increase the WTP (Table 11).

5. Discussion

Scenic beauty has historically played a fundamental role in landscape protection measures and for the conservation of places considered of singular value [83]. The Italian law 1479/1939 (https://www.bosettiegatti.eu/info/norme/statali/1939_1497.htm) (Law 29 June 1939, n.1497, art. 1) which concerns the Protection of Natural Beauties regulates the “panoramic beauties considered as natural and pure vistas, accessible to the public, from which everyone can enjoy the beauties”. The beauty/scenic evaluation method is generally split into activities conducted by experts and activities concentrating on analyzing public perception, differing in the way the relevant elements of the landscape are investigated and in the importance conferred in determining quality levels [2]. In this study, we adopted a multi-dimensional evaluation that combines a quantitative assessment conducted by experts, a social-qualitative analysis by public perception, and an economical estimation.
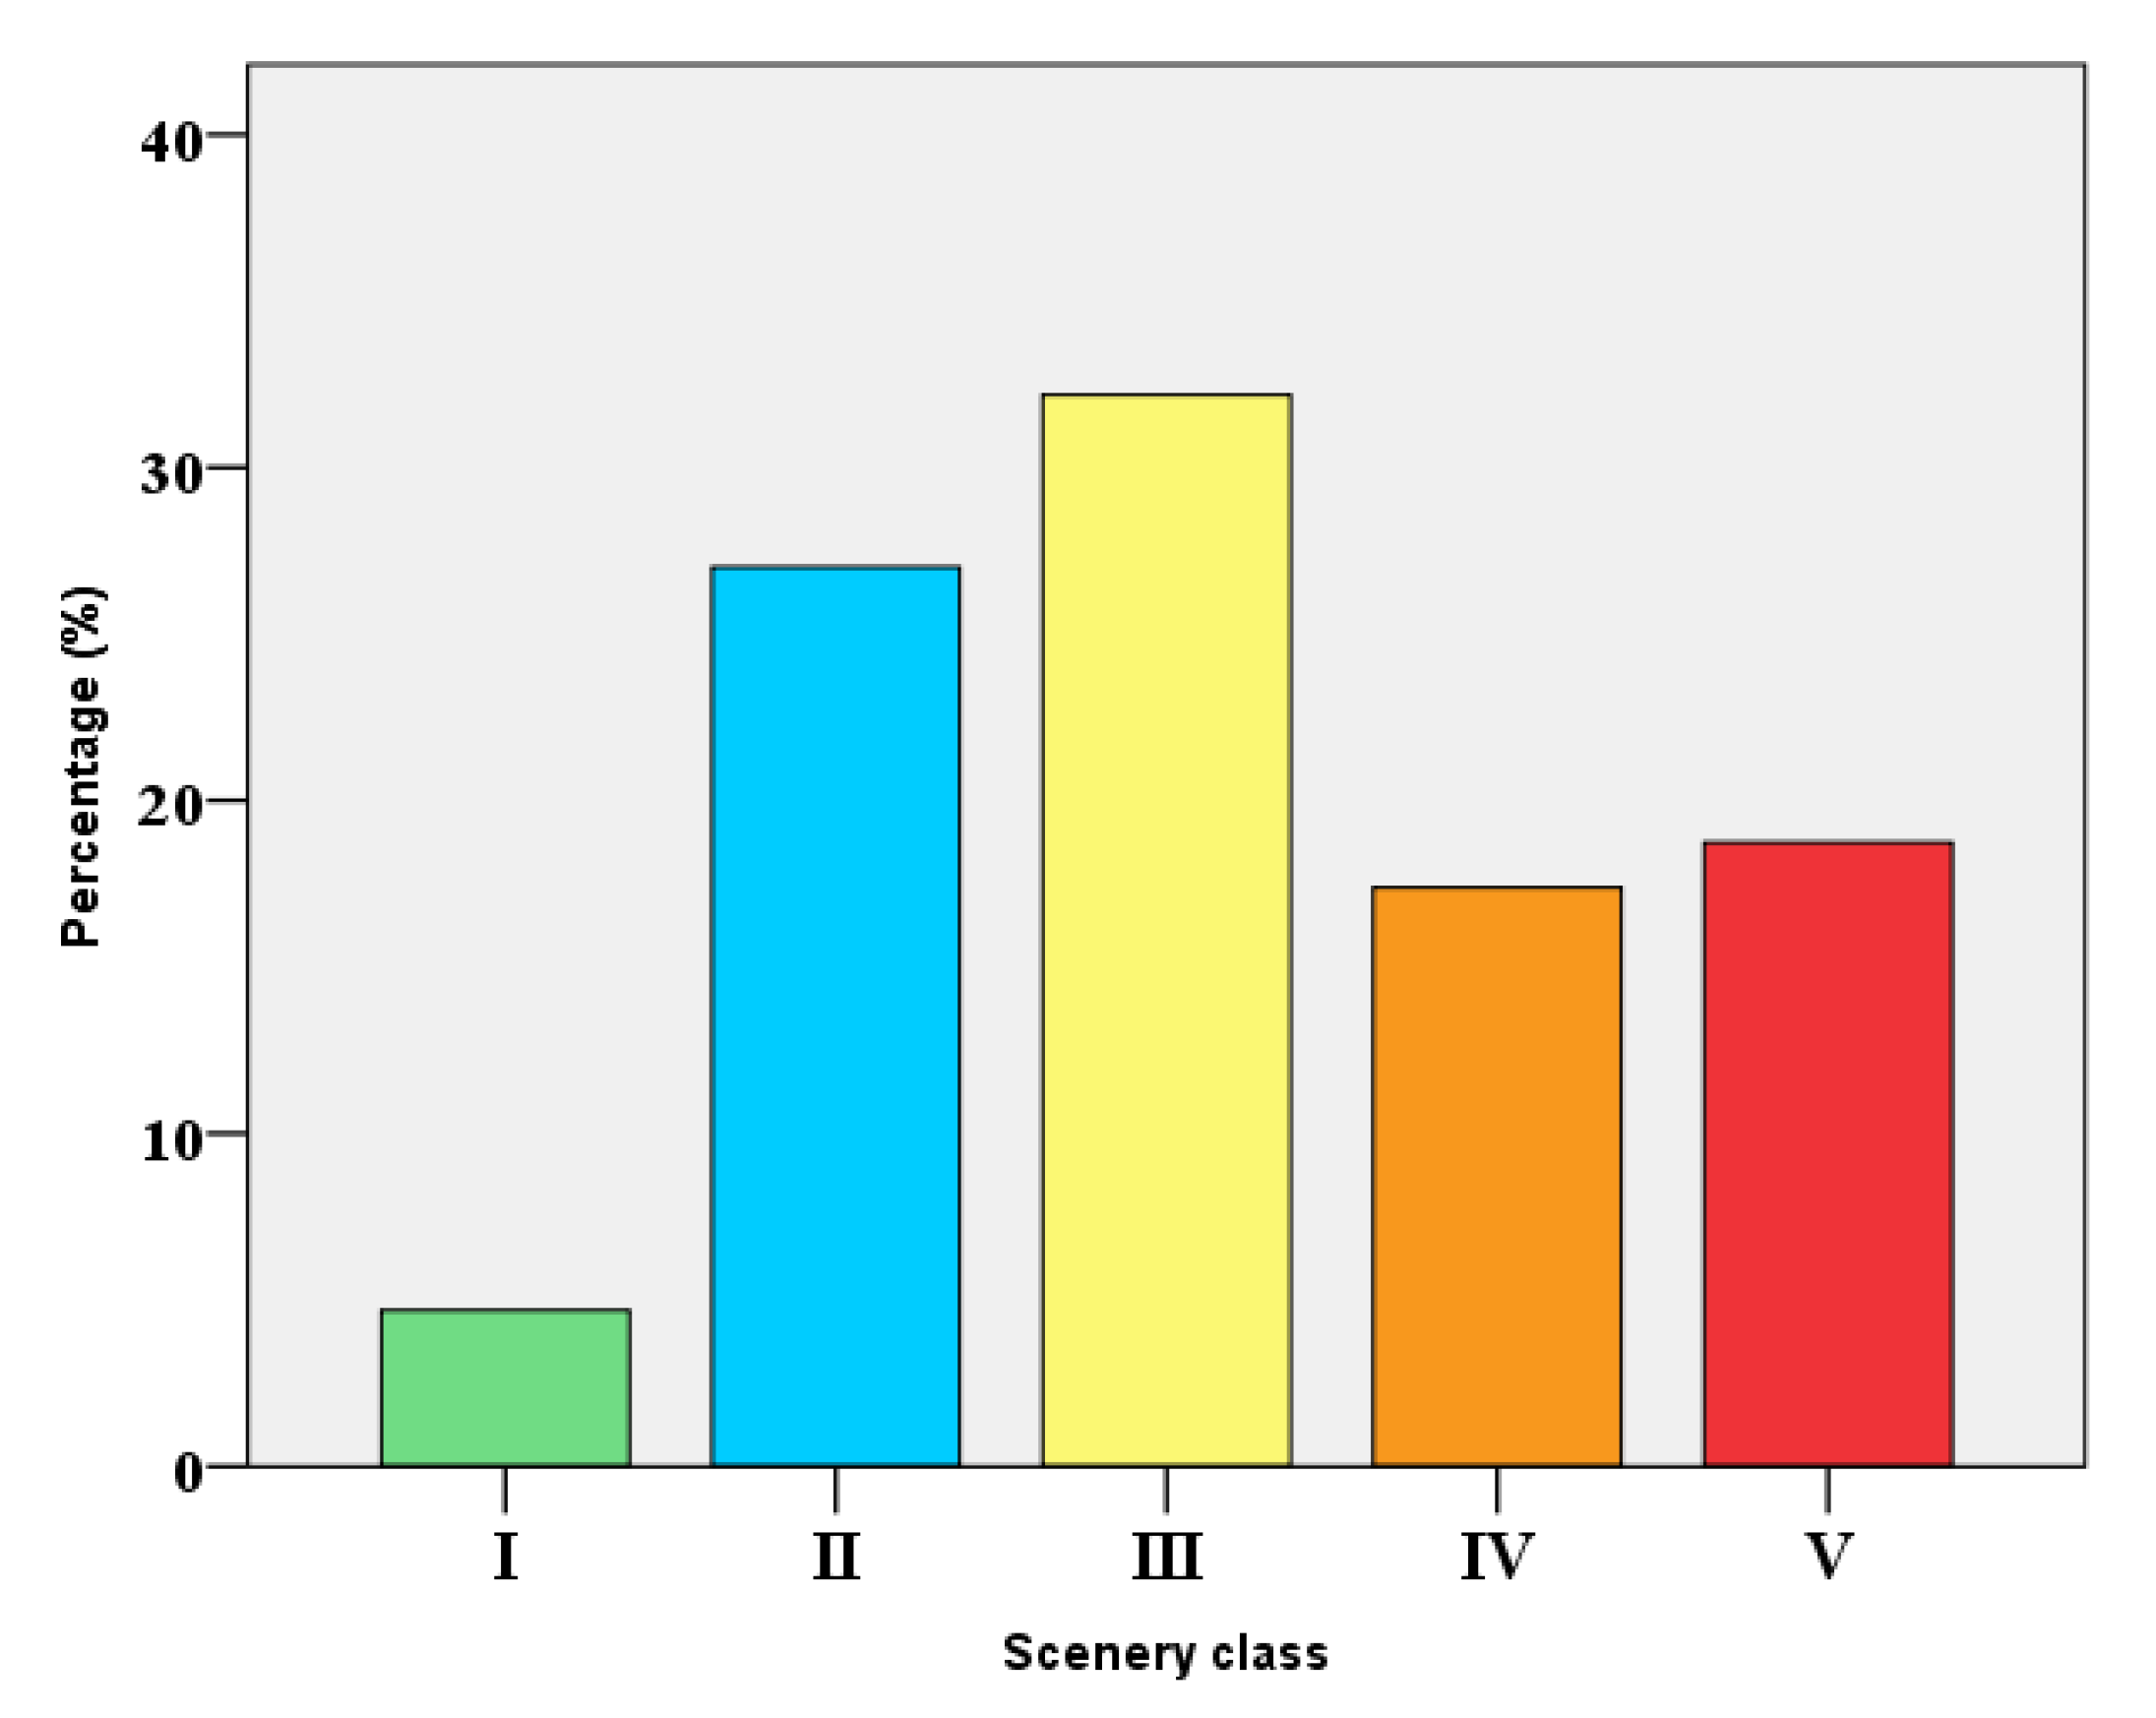
Scenic evaluations of 40 investigated sites were defined according to the methodology mentioned above (Table 2). Thirty percent of the investigated coastal areas were included in Class I and II, 25% fitted to Class III, and 45% of the sites were in the lower classes (Class IV and V). Our results suggest that scenic classification is very correlated to the proposed classification of beach types, following their physical and functional features [67,68]. Actually, most of the natural beaches coincided with beaches having high scenery value (principally Classes I and II), seminatural beaches with medium-scenery values (Classes IV and III, with few exceptions in Class I, II, and IV), while Class V sites prevalently composed urban beaches. These findings are similar to those obtained in Colombia, Cuba, Spain, Brazil, and Malta by previous studies [22,26,28], which confirmed the relationship between scenery, geological setting, and degree of urbanization.
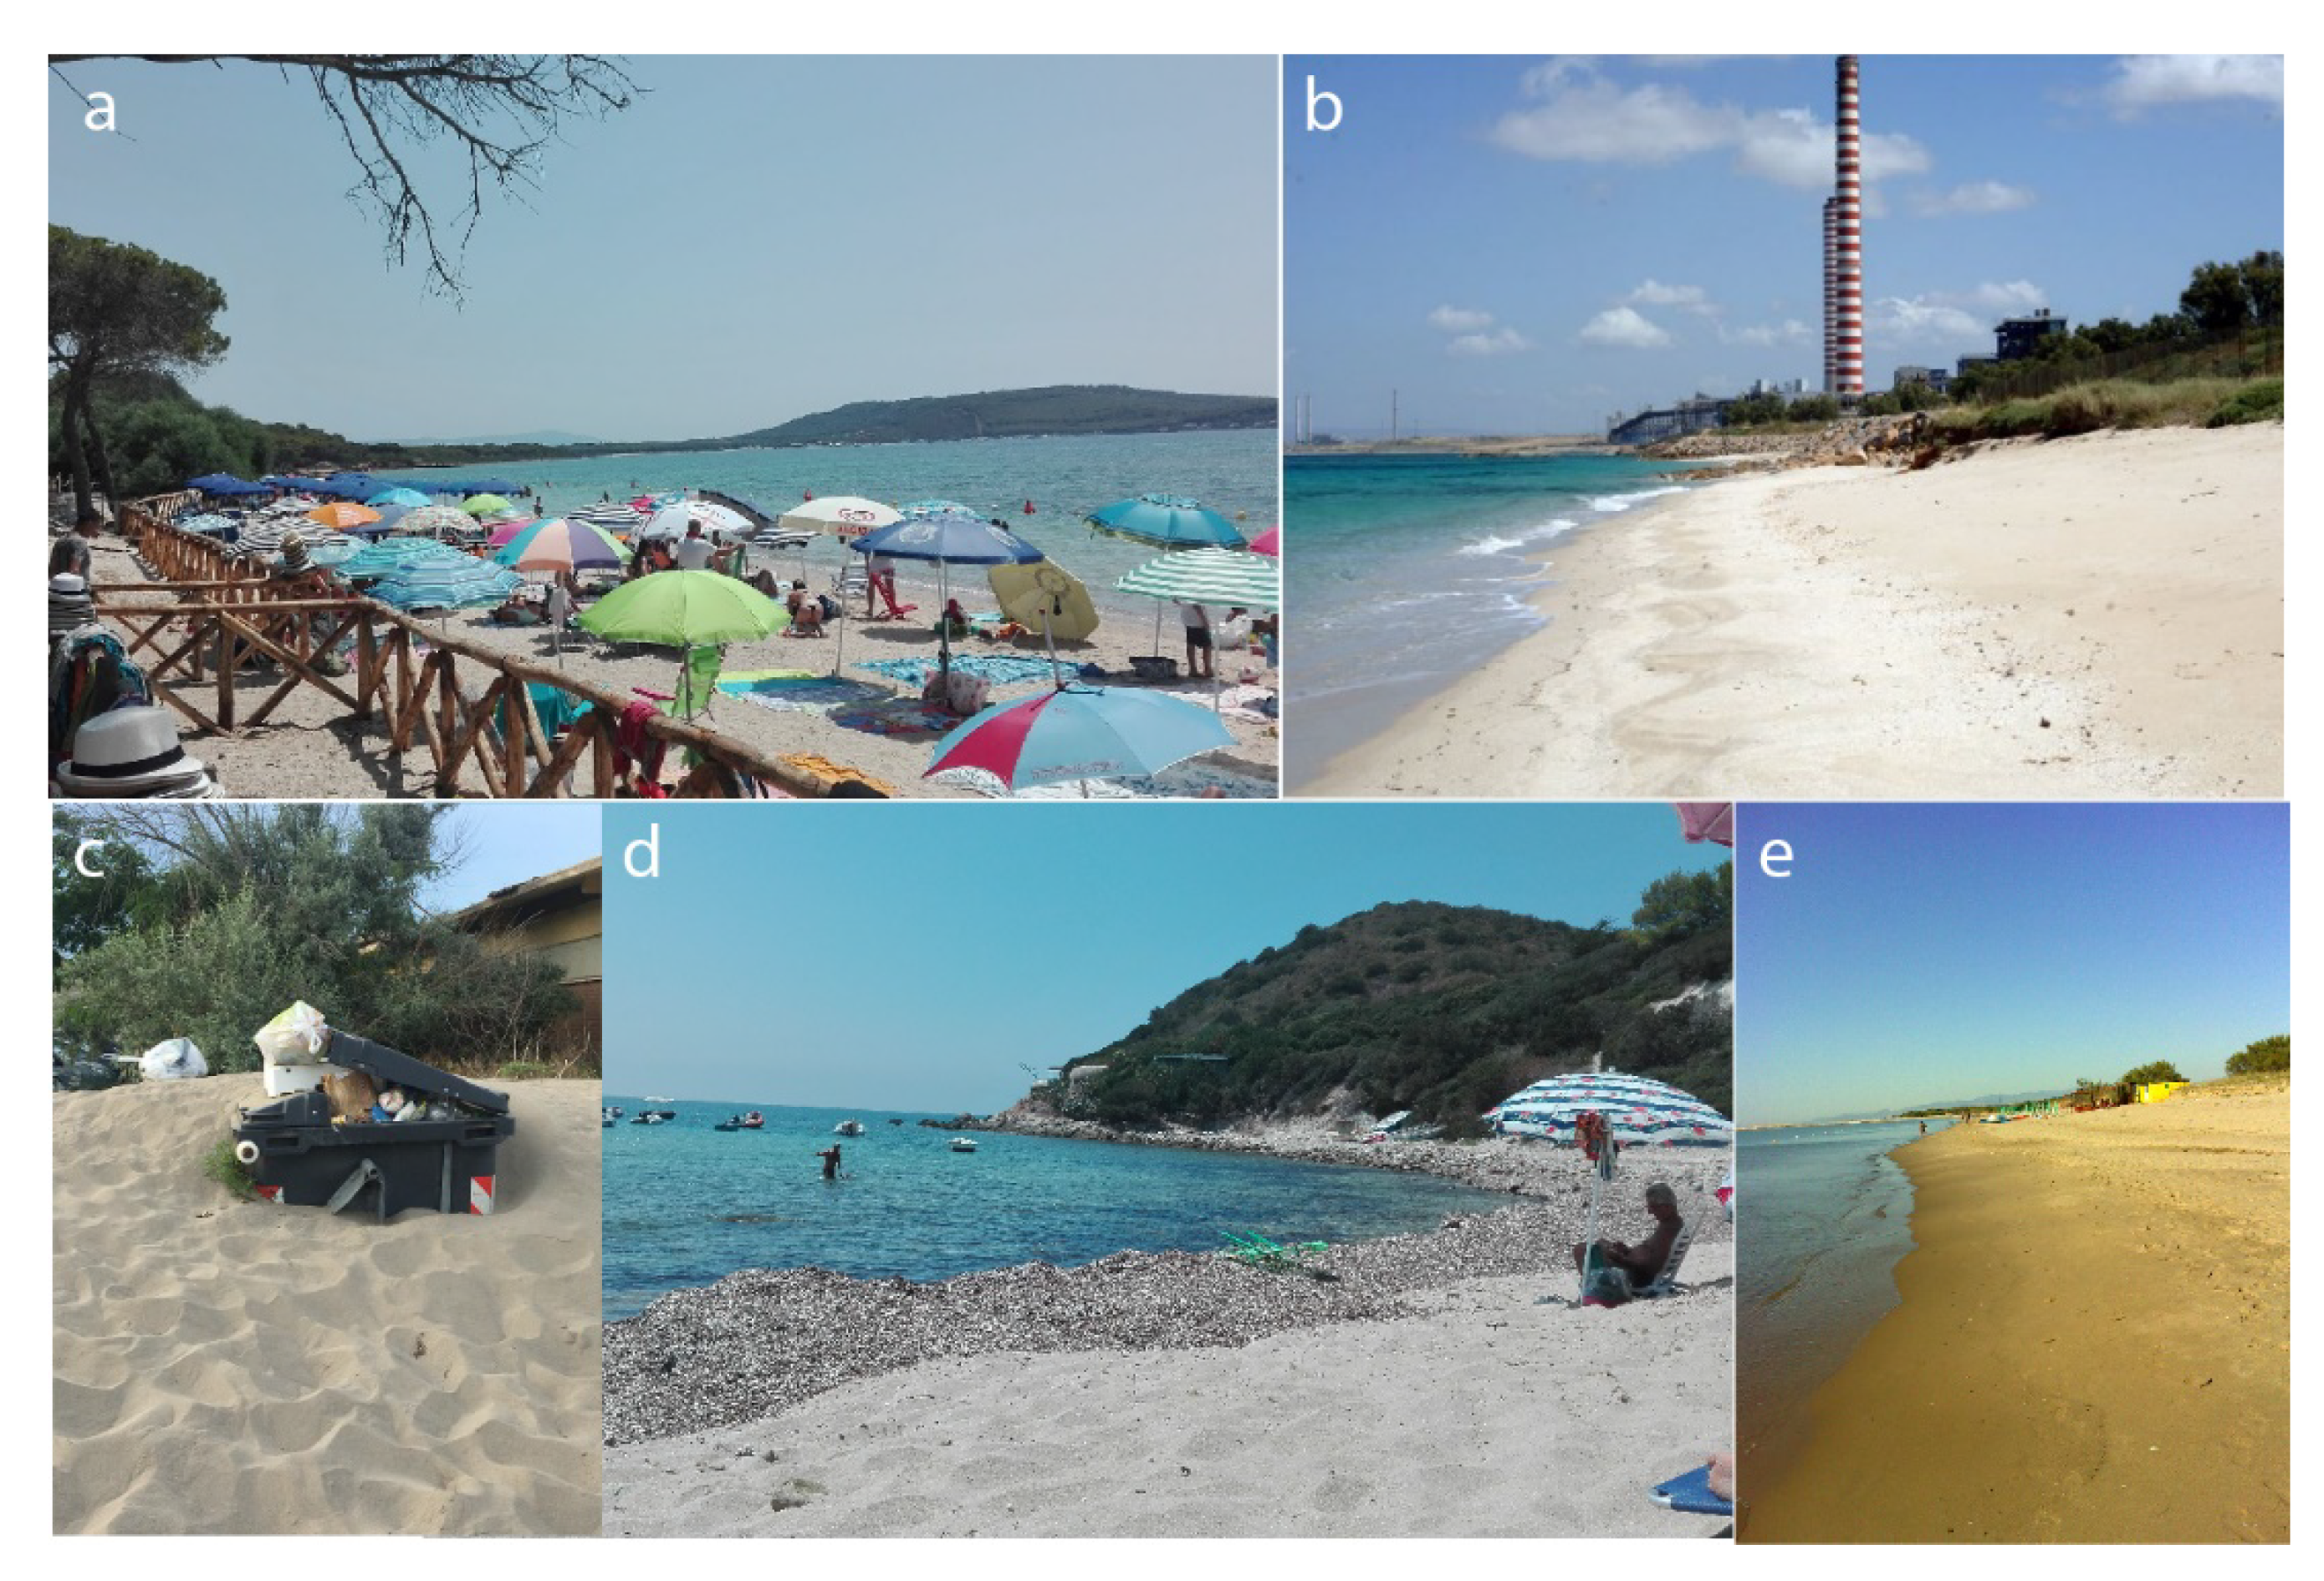
Class I sites are principally observed in the southern stretch of coast of Rosolina Mare and in small-medium pocket beaches of Alghero littoral. These littorals are characterized by the presence of natural protected areas with several features, such as lagoon, valleys, coastal rock sectors, and mountainous skyline landforms, that increase the scenic value.
The Class II sites are located in Rosolina Mare, Metaponto Lido and Alghero coastal sites and rated lower than Class I because of the increase of human occupation. For instance, Le Bombarde beach was characterized by beautiful water and beach color and some landscape features. Nevertheless, it presented some negative aspects, like the presence of litter, noise disturbance, and tourist developments, that affected the natural state of the environment.
A gradual decrease both in natural and human attributes were registered in Class III, IV, and V sites. The increase of human pressure, in some cases, altered the value of a beach that could be evaluated as natural. Magna Grecia (Metaponto Lido) and Fiume Santo (Porto Torres) beaches, for instance, are attractive areas with excellent water and beach color, but have a very insensitive urban-industrial development. Other examples, such as Ipanema—Lido di Volano (Comacchio) and Marina di Porto Caleri (Rosolina Mare), are located near small villages and show sewage discharge evidence into the beach and litter, depleting the scenic quality.
Classes IV and V, in particular, present low scores for all human parameters. In the central and southern sectors of the Lidi di Comacchio littoral, for instance, several natural parameters are affected by the flat landscape, presence of utilities such as groins, breakwaters, and revetments, and negative scores are also observed for sediment beach color, water color, and litter. Specifically concerning this last parameter, [26] has shown that litter presence is a reason to avoid a visit at a certain beach. Consequently, concern for environmental issues, especially related to sun and sand tourism, has become a serious problem [84]. In this context, some management measures could enhance the environmental status of the beaches and consequently their tourism, like the recovery of degraded natural spaces; the maintenance of garbage bins on beaches; a proper collection and treatment of sewage to maintain suitable recreational bathing parameters; the improvements to the existent touristic infrastructure; and the adoption of measures for environmental supervision.
At many places, erosion of coastline corresponded to the lowest ratings, as reported by [22]. Erosion processes reduce beach width, improve the crowding effect, and induce the emplacement of different structures. Examples of this are the beaches as mentioned earlier of Lidi di Comacchio, Casoni beach, and Rosapineta Camping (North) at Rosolina Mare, Blumen Bad, Ermitage, and Mondial beaches at Metaponto Lido, and Scoglio Lungo beach at Porto Torres. In these beaches, considerable work and investments, like the removal of hard protection structures and construction of artificial dunes, would be needed [85]. Furthermore, to reduce the crowding phenomenon, some administrative measures like the decentralization of tourism could be adopted. A recent study of [28] suggests the use of a smartphone app that would allow to each tourist the selection of a beach according to his interests, scenery, crowding, landscape type, touristic services and facilities, bathing conditions, access, and presence of protected areas. In this way, the app gives practical information to be used by beachgoers, which can also choose between natural and urbanized sites [28]. From a social and economic point of view, this study emphasized the users’ propensity to landscape preservation. In fact, about 60% of the interviewees were willing to pay for the preservation of the environmental quality of the landscape, with about 16 € per person each season. These percentages are slightly higher than 58% and 14.84 € reported in the Italian survey (conducted on 4126 records) by [72]. This result is probably due to the particular condition of the selected beaches that are more natural than those reported in [72]. Therefore, users were more willing to respect the case of semiurban and urban beaches.
Consequently, the urbanization degree of the beach has affected the WTP. This result is important because numerous studies also demonstrated that the urbanization level affects beach scenery [7]. Thus, this implication suggests that WTP is positively correlated with scenery level. Our results support these findings, as reported in Table 10. A number of studies have found that landscapes that are perceived as natural, like those observed in Class I, are considered more scenic than clearly human-influenced landscapes [86,87,88,89]. However, in some cases, the difference between natural scenes and human-influenced scenes is not so clear, so it could be difficult to assess by the users [20].
Furthermore, [7] indicates that for each scenic class there exists a related typology of users. Accordingly, the results indicate that beaches and their scenery should be managed considering both environments and specific types of users. Both in scenic and in WTP researchers, parameters were obtained from subjective observations, depending on national/cultural background, age, gender, education, and training. A study by [90] indicated that European nationality groups agreed to a specific preferred landscape type, but cultural traits could give differences [90]. In research for this paper, the parameters shown in Table 2 came out in all surveys, and some differences were found because of gender and education (Table 10). In conclusion, both aesthetic/scenic qualities of a beach and users’ attitudes and perceptions are essential aspects of consumptive experiences, as observed by [91].
The applied methods are not without imitations. In fact, for both CSES and WTP assessment, it is useful to take into consideration some aspects that could influence the research. First of all is the variability of some scenic parameters during the seasons. Water color, for instance, could vary a lot and is more variable than the other parameters, due to the variability of the river flow. Litter is a variable parameter because it depends on the availability of cleaning services of local administrations, which often are more efficient during the bathing season. Beach width, in the case of sandy beaches, naturally varied along the seasons because of its relation to the climate and wave conditions and sand availability.
In the same way, other parameters reflect some variable conditions, like noise, discharge evidence, vegetation cover; thus, scenic surveys should be ideally carried out in different periods of the year. Secondly, although some parameters can be easily quantified (such as beach width, number of utilities, etc.), other parameters are subject to the perception over the coastal site, e.g., water color and built environment [54]. Therefore, the CSES is a semi-quantitative method despite the fuzzy logic calculation, because humans assess the rating of each parameter (even if they are commonly experts in beach and landscape management).
Thirdly, the classification used is strongly dependent on the setting and level of human occupation. In this study, for instance, some littorals have similar coastal settings (e.g., sediment type, width, and slope) and urbanization level; therefore, some beaches could show approximately the same D value, even if their typology (remote beach vs. urban beach) and beach management (free beach vs. private beach) are different. This is because CSES has been principally developed for high rocky coasts having high variability of geomorphological and geological characteristics. For this reason, this method may be further developed to better assess the sandy flat beaches using ad hoc weighted physical parameters.
Concerning the CV, one of the inherent limitations is that this method permits one to evaluate the value of the entire environmental good, but it is less suitable for assessing the value of the single physical or non-physical components of the good (as, for example, the Choice Experiment method). It implies, among other things, that respondents can incur in the so-called yea-saying problem, i.e., the choice is referred to the entire good, whereas the willingness to pay might be only for some attributes of the goods. At the same time, in our case, the choice of adopting the CV is derived from the need of assessing the value of the beach as a whole; therefore, in our opinion, the CV is particularly adequate for this finality.

6. Conclusions

This study, focused on the environmental and scenic parameters and their values, identifies several characteristics that can be upgraded to increase the scenery of coastal sites in Italy. This paper analyzed the coastal characteristics of forty beaches considering scenery with physical and human factors affected the beach, users’ perception, and the WTP. A quantitative and qualitative methodology was carried out for the assessment of the scenery value. The CSES method was applied, evaluating physical and human scenery parameters. Furthermore, the beach users’ perception was identified in terms of personal preferences, knowledge of environmental beach issues, and willingness to pay for landscape preservation. Crowding, erosion phenomena, litter and sewage, poor vistas, and high urbanization levels are among the anthropic impacts that negatively affect the landscape because of the deficient management of the studied beaches. These findings, therefore, could be beneficial to coastal managers who can analyze the score of each specific site and parameter and decide ad hoc management plans to improve negative aspects.
In this study, we adopted a non-market-based approach by investigating the willingness of beach users to pay for landscape preservation. The economic approach developed by a CV introduces a new perspective for the analysis of the potential value of scenery, both in natural, semi-urban, and urban areas. Results show that people express a significant willingness to pay for scenery in Italy, probably because they give high importance to the landscape value and its preservation. In particular, our results suggest that landscape judgment is directly correlated to scenery assessment; therefore, beaches of Classes I and II were judged beautiful, while beaches of Classes IV and V had poor judgments. Similarly, the importance given to the landscape was highest in Class I and II than in the others.

Supplementary Materials

The following are available online at https://www.mdpi.com/2071-1050/12/4/1604/s1, Table S1: Descriptive statistics of each scenery class; Table S2: D value of each beach type.

Author Contributions

Data curation, I.R.; formal analysis, F.A.M.; investigation, F.A.M. and D.C.; methodology, I.R., F.A.M., and D.C.; supervision, D.C.; validation, F.A.M. and D.C.; writing—original draft, I.R.; writing—review and editing, I.R., F.A.M., and D.C. All authors have read and agreed to the published version of the manuscript.

Funding

A part of this research was funded by “Fondo di Ateneo per la ricerca 2019 dell’Università degli Studi di Sassari—Donatella Carboni”.

Acknowledgments

The authors would like to thank the anonymous reviewers for useful comments and suggestions.

Conflicts of Interest

The authors declare no conflict of interest.

References

  1. Council of Europe. European Landscape Convention. Rep. Conv. Florence 2000, 17, 8. [Google Scholar]
  2. Franciosa, A. La valutazione della qualità percepita del paesaggio. BDC Univ. Stud. Napoli 2013, 13. [Google Scholar]
  3. Swanwick, C. Landscape character assessment—Guidance for England and Scotland; Countryside Agency: London, UK, 2002; Volume 90, pp. 161–174.
  4. Tudor, C. An Approach to Landscape Character Assessment. Nat. Engl. 2014, 56. [Google Scholar]
  5. Kirillova, K.; Fu, X.; Lehto, X.; Cai, L. What makes a destination beautiful? Dimensions of tourist aesthetic judgment. Tour. Manag. 2014, 42, 282–293. [Google Scholar] [CrossRef]
  6. Kay, R.C.; Alder, J. Coastal Planning and Management; E&F Spon.: London, UK, 2005. [Google Scholar]
  7. Rodella, I.; Corbau, C. Linking scenery and users’ perception analysis of Italian beaches (case studies in Veneto, Emilia-Romagna and Basilicata regions). Ocean Coast. Manag. 2020, 183, 104992. [Google Scholar] [CrossRef]
  8. Ergin, A.; Karaesmen, E.; Micallef, A.; Williams, A.T. A new methodology for evaluating coastal scenery: Fuzzy logic systems. Area 2004, 36, 367–386. [Google Scholar] [CrossRef]
  9. Micallef, A.; Rangel-Buitrago, N. The Management of Coastal Landscapes. In Coastal Scenery Evaluation and Management; Rangel-Buitrago, N., Ed.; Springer International Publishing: Cham, Switzerland, 2018; pp. 211–248. [Google Scholar]
  10. Busquets Fàbregas J, C.R.A. Management of the territory: Landscape management as a process. In Council of Europe, landscape dimensions. Reflections and proposals for the implementation of the European landscape convention; Council of Europe Publishing: Strasburg, Germany, 2017. [Google Scholar]
  11. Carlson, A.A. On the possibility of quantifying scenic beauty—A response to Ribe. Landsc. Plan. 1984, 11, 49–65. [Google Scholar] [CrossRef]
  12. Gregory, K.J.; Davis, R.J. The perception of riverscape aesthetics: An example from two Hampshire rivers. J. Environ. Manag. 1993, 39, 171–185. [Google Scholar] [CrossRef]
  13. Penning-Rowsell, E.C. A public preference evaluation of landscape quality. Reg. Stud. 1982, 16, 97–112. [Google Scholar] [CrossRef]
  14. Shivlani, M.P.; Letson, D.; Theis, M. Visitor Preferences for Public Beach Amenities and Beach Restoration in South Florida. Coast. Manag. 2003, 31, 367–385. [Google Scholar] [CrossRef]
  15. Pereira, L.C.C.; Jiménez, J.A.; Medeiros, C.; Da Costa, R.M. The influence of the environmental status of Casa Caiada and Rio Doce beaches (NE-Brazil) on beaches users. Ocean Coast. Manag. 2003, 46, 1011–1030. [Google Scholar] [CrossRef]
  16. Micallef, A.; Williams, A.T. Application of a novel approach to beach classification in the Maltese Islands. Ocean Coast. Manag. 2004, 47, 225–242. [Google Scholar] [CrossRef]
  17. Villares, M.; Roca, E.; Serra, J.; Montori, C. Social Perception as a Tool for Beach Planning: A Case Study on the Catalan Coast. J. Coast. Res. Proc. III Spanish Conf. Coast. Geomorphol. 2006, 118–123. [Google Scholar]
  18. Cervantes, O.; Espejel, I.; Arellano, E.; Delhumeau, S. Users’ perception as a tool to improve urban beach planning and management. Environ. Manag. 2008, 42, 249–264. [Google Scholar] [CrossRef] [PubMed]
  19. Roca, E.; Villares, M.M.; Ortego, M.I.I. Assessing public perceptions on beach quality according to beach users’ profile: A case study in the Costa Brava (Spain). Tour. Manag. 2009, 30, 598–607. [Google Scholar] [CrossRef]
  20. Fyhri, A.; Jacobsen, J.K.S.; Tømmervik, H. Tourists’ landscape perceptions and preferences in a Scandinavian coastal region. Landsc. Urban Plan. 2009, 91, 202–211. [Google Scholar] [CrossRef]
  21. Williams, A. Definitions and typologies of coastal tourism destinations. In Disappearing Destinations: Climate change and future challenges for coastal tourism; Jones, A., Phillips, M., Eds.; CABI: Wallingford, UK, 2011; pp. 47–66. ISBN 9781845935481. [Google Scholar]
  22. Rangel-Buitrago, N.G.; Correa, I.D.D.; Anfuso, G.; Ergin, A.; Williams, A.T. Assessing and managing scenery of the Caribbean Coast of Colombia. Tour. Manag. 2013, 35, 41–58. [Google Scholar] [CrossRef]
  23. Botero, C.; Anfuso, G.; Williams, A.T.; Zielinski, S.; Pereira da Silva, C.; Cervantes, O.; Silva, L.; Cabrera, J.A. Reasons for beach choice: European and Caribbean perspectives. J. Coast. Res. 2013, 880–885. [Google Scholar] [CrossRef]
  24. Anfuso, G.; Williams, A.T.; Cabrera Hernández, J.A.; Pranzini, E. Coastal scenic assessment and tourism management in western Cuba. Tour. Manag. 2014, 42, 307–320. [Google Scholar] [CrossRef]
  25. Anfuso, G.; Williams, A.T.; Casas Martínez, G.; Botero, C.M.; Cabrera Hernández, J.A.; Pranzini, E. Evaluation of the scenic value of 100 beaches in Cuba: Implications for coastal tourism management. Ocean Coast. Manag. 2017, 142, 173–185. [Google Scholar] [CrossRef]
  26. Williams, A.T.; Rangel-Buitrago, N.G.; Anfuso, G.; Cervantes, O.; Botero, C.M. Litter impacts on scenery and tourism on the Colombian north Caribbean coast. Tour. Manag. 2016, 55, 209–224. [Google Scholar] [CrossRef]
  27. Reimann, M.; Ehrlich, Ü.; Tõnisson, H. Recreational Preferences of Estonian Coastal Landscapes and Willingness-to-pay in Compari- son—A good tool for creating national beach man- agement strategy. In Beach Management Tools—Concepts, Methodologies and Case Studies; Botero, C.M., Cervantes, O.D., Finkl, C.W., Eds.; Springer: Berlin, Germany, 2018; pp. 895–912. [Google Scholar]
  28. Da Costa Cristiano, S.; Portz, L.C.; Anfuso, G.; Rockett, G.C.; Barboza, E.G. Coastal scenic evaluation at Santa Catarina (Brazil): Implications for coastal management. Ocean Coast. Manag. 2018, 160, 146–157. [Google Scholar] [CrossRef]
  29. Da Costa Cristiano, S.; Rockett, G.C.; Portz, L.C.; Souza Filho, J.R. Beach landscape management as a sustainable tourism resource in Fernando de Noronha Island (Brazil). Mar. Pollut. Bull. 2020, 150, 110621. [Google Scholar] [CrossRef] [PubMed]
  30. Keeney, R.L.; Raiffa, H. Decisions with Multiple Objectives: Preferences and Value Tradeoff. Psychometrika 1977, 42, 451–455. [Google Scholar]
  31. Fusco Girard, L.; Nijkamp, P. Le valutazioni per lo sviluppo sostenibile della città e del territorio; Franco Angeli: Milano, Italy, 1997; ISBN 9788846401823. [Google Scholar]
  32. Kaplan, S. Aesthetics, Affect, and Cognition: Environmental Preference from an Evolutionary Perspective. Environ. Behav. 1987, 19, 3–32. [Google Scholar] [CrossRef] [Green Version]
  33. Ogilvie, D.; Mitchell, R.; Mutrie, N.; Petticrew, M.; Platt, S. Perceived characteristics of the environment associated with active travel: Development and testing of a new scale. Int. J. Behav. Nutr. Phys. Act. 2008, 5, 32. [Google Scholar] [CrossRef] [Green Version]
  34. Rajapaksa, D.; Islam, M.; Managi, S. Pro-Environmental Behavior: The Role of Public Perception in Infrastructure and the Social Factors for Sustainable Development. Sustainability 2018, 10, 937. [Google Scholar] [CrossRef] [Green Version]
  35. Daniel, T.C.; Boster, R.S. Measuring Landscape Esthetics: The Scenic Beauty Estimation Method; Department of Agriculture, Forest Service, Rocky Mountain Forest and Range Experiment Statio: Fort Collins, CO, USA, 1976; p. 75.
  36. Tempesta, T.; Thiene, M. Percezione e valore del paesaggio; Franco Angeli: Milano, Italy, 2006; ISBN 8846479130. [Google Scholar]
  37. Ergin, A. Coastal Scenery Assessment by Means of a Fuzzy Logic Approach. In Coastal Scenery Evaluation and Management; Rangel Buitrago, N., Ed.; Springer: Cham, Switzerland, 2019; pp. 107–141. [Google Scholar]
  38. Rodella, I. Coastal scenery evaluation and management. J. Coast. Conserv. 2019, 23, 501–503. [Google Scholar] [CrossRef]
  39. Ergin, A.; Williams, A.T.; Micallef, A. Coastal Scenery: Appreciation and Evaluation. J. Coast. Res. 2006, 224, 958–964. [Google Scholar] [CrossRef]
  40. Ullah, Z.; Johnson, D.; Micallef, A.; Williams, A.T. Coastal scenic assessment: Unlocking the potential for coastal tourism in rural pakistan via mediterranean developed techniques. J. Coast. Conserv. 2010, 14, 285–293. [Google Scholar] [CrossRef] [Green Version]
  41. Williams, A.T.; Micallef, A.; Anfuso, G.; Gallego-Fernandez, J.B. Andalusia, Spain: An Assessment of Coastal Scenery. Landsc. Res. 2012, 37, 327–349. [Google Scholar] [CrossRef]
  42. Mooser, A.; Anfuso, G.; Mestanza, C.; Williams, A.T. Management Implications for the Most Attractive Scenic Sites along the Andalusia Coast (SW Spain). Sustainability 2018, 10, 1328. [Google Scholar] [CrossRef] [Green Version]
  43. Schaeffer, P.V. Thoughts concerning the economic valuation of landscapes. J. Environ. Manag. 2008, 89, 146–154. [Google Scholar] [CrossRef] [PubMed]
  44. Pearce, D.; Atkinson, G.; Mourato, S. Cost-benefit Analysis and the Environment: Recent Developments; OECD - Organization for Economic Co-Operation and Development Publishing: Paris, France, 2006; ISBN 9264010041. [Google Scholar]
  45. Hanley, N.; Spash, C. Cost-Benefit Analysis and the Environment; Edward Elgar Pub: Cheltenham, UK, 1994. [Google Scholar]
  46. Pearce, D.; Moran, D. The economic value of biodiversity. IUNC World Conserv. Union 1994, 106. [Google Scholar]
  47. Yu, B.; Cai, Y.; Jin, L.; Du, B. Effects on willingness to pay for marine conservation: Evidence from Zhejiang Province, China. Sustainability 2018, 10, 2298. [Google Scholar] [CrossRef] [Green Version]
  48. Adamowicz, V.; Boxall, P.; Williams, M.; Louviere, J. Stated Preference Approaches for Measuring Passive Use Values: Choice Experiments versus Contingent Valuation. Staff Pap. 1995, 03. [Google Scholar] [CrossRef]
  49. Logar, I.; van den Bergh, J.C.J.M. Respondent uncertainty in contingent valuation of preventing beach erosion: An analysis with a polychotomous choice question. J. Environ. Manag. 2012, 113, 184–193. [Google Scholar] [CrossRef] [Green Version]
  50. Peng, M.; Oleson, K.L.L. Beach Recreationalists’ Willingness to Pay and Economic Implications of Coastal Water Quality Problems in Hawaii. Ecol. Econ. 2017, 136, 41–52. [Google Scholar] [CrossRef] [Green Version]
  51. Carson, R.; Flores, N.; Meade, N. Contingent Valuation: Controversies and Evidence, NOAA; US Department of Commerce, Mimeo: San Diego, CA, USA, 2000.
  52. Mitchell, R.C.; Carson, R.T. Using Surveys to Value Public Goods The contingent Valuation Method; Rff Press: Washington, DC, USA, 1989. [Google Scholar]
  53. Mazzanti, M. Tourism Growth and Sustainable Economic Development: A Note on Economic Issues. Tour. Econ. 2002, 8, 457–462. [Google Scholar] [CrossRef]
  54. Pranzini, E.; Williams, A.T.; Rangel-Buitrago, N. Coastal Scenery Assessment: Definitions and Typology. In Coastal Scenery, Coastal Research Library 26; Rangel-Buitrago, N., Ed.; Springer International Publishing AG, part of Springer Nature: Berlin, Germany, 2019; p. 257. [Google Scholar]
  55. Tiengo, A. Variazioni morfologiche e dell’uso del suolo nel tratto di costa compreso tra la foce del fiume Adige e Porto Caleri (RO). Master’s Thesis, University of Ferrara, Ferrara, Italy, 2012. [Google Scholar]
  56. Paganin, S. Caratterizzazione morfologica ed impatto antropico del litorale di Rosolina Mare. Master’s Thesis, University of Ferrara, Ferrara, Italy, 2016. [Google Scholar]
  57. Ruol, P.; Martinelli, L.; Favaretto, C. Gestione integrata della zona costiera. Progetto per lo studio ed il monitoraggio della linea di costa per la definizione degli interventi di difesa dei litorali dall’erosione nella Regione Veneto; Veneto Region: Venice, Italy, 2016. [Google Scholar]
  58. Corbau, C.; Zambello, E.; Rodella, I.; Utizi, K.; Nardin, W.; Simeoni, U. Quantifying the impacts of the human activities on the evolution of Po delta territory during the last 120 years. J. Environ. Manag. 2019, 232, 702–712. [Google Scholar] [CrossRef]
  59. Martinelli, L.; Zanuttigh, B.; De Nigris, N.; Preti, M. Sand bag barriers for coastal protection along the Emilia Romagna littoral, Northern Adriatic Sea, Italy. Geotext. Geomembranes 2011, 29, 370–380. [Google Scholar] [CrossRef] [Green Version]
  60. Martinelli, L.; Zanuttigh, B.; Corbau, C. Assessment of coastal flooding hazard along the Emilia Romagna littoral, IT. Coast. Eng. 2010, 57, 1042–1058. [Google Scholar] [CrossRef]
  61. Tropeano, M.; Cilumbriello, A.; Sabato, L.; Gallicchio, S.; Grippa, A.; Longhitano, S.G.; Bianca, M.; Gallipoli, M.R.; Mucciarelli, M.; Spilotro, G. Surface and subsurface of the Metaponto Coastal Plain (Gulf of Taranto-southern Italy): Present-day- vs LGM-landscape. Geomorphology 2013, 203, 115–131. [Google Scholar] [CrossRef]
  62. Greco, M.; Martino, G. Modelling of coastal infrastructure and delta river interaction on ionic Lucanian littoral. Procedia Eng. 2014, 70, 763–772. [Google Scholar] [CrossRef] [Green Version]
  63. Spilotro, G.; Pizzo, V.; Leandro, G. Evoluzione della Costa Ionica della Basilicata e gestiona della complessità. In Proceedings of the “L’arretramento della costa ionica della Basilicata: Complessità, studi, azioni”, Metaponto, Italy, 26 May 2006; p. 27. [Google Scholar]
  64. Aiello, A.; Canora, F.; Pasquariello, G.; Spilotro, G. Shoreline variations and coastal dynamics: A space-time data analysis of the Jonian littoral, Italy. Estuar. Coast. Shelf Sci. 2013, 129, 124–135. [Google Scholar] [CrossRef]
  65. Sabato, L.; Longhitano, S.G.; Gioia, D.; Cilumbriello, A.; Moro, A. Sedimentological and morpho-evolution maps of the ‘ Bosco Pantano di Policoro ’ coastal system (Gulf of Taranto, southern Italy). J. Maps 2012, 37–41. [Google Scholar] [CrossRef] [Green Version]
  66. Manca, E.; Pascucci, V.; Deluca, M.; Cossu, A.; Andreucci, S. Shoreline evolution related to coastal development of a managed beach in Alghero, Sardinia, Italy. Ocean Coast. Manag. 2013, 85, 65–76. [Google Scholar] [CrossRef]
  67. Carboni, D.; Corbau, C.; Madau, F.; Ginesu, S. Capacità di carico turistica, percezione turistica e disponibilità a pagare in alcune spiagge della Sardegna settentrionale. Stud. Costieri 2017, 25, 129–140. [Google Scholar]
  68. Ginesu, S.; Carboni, D.; Marin, M. Erosion and use of the Coast in the Northern Sardinia (Italy). Procedia Environ. Sci. 2016, 32, 230–243. [Google Scholar] [CrossRef] [Green Version]
  69. Birdir, S.; Ünal, Ö.; Birdir, K.; Williams, A.T. Willingness to pay as an economic instrument for coastal tourism management: Cases from Mersin, Turkey. Tour. Manag. 2013, 36, 279–283. [Google Scholar] [CrossRef]
  70. Corbau, C.; Rodella, I.; Simeoni, U.; Carboni, D. Conflits entre la sauvegarde des paysages côtiers et les activités humaines. Geo Eco Trop. 2019, 43, 519–530. [Google Scholar]
  71. Ergin, A.; Karaesmen, E.; Guler, I.; Guler, H.G. Development of An Open-Source Computational Tool for Coastal Scenic Assessment Based on Fuzzy Logic. In Proceedings of the 9th Coastal Engineering Symposium Proceedings, Turkish Chamber of Civil Engineers, Adana, Turkey, 1–3 November 2018. [Google Scholar]
  72. Rodella, I.; Madau, F.; Mazzanti, M.; Corbau, C.; Carboni, D.; Utizi, K.; Simeoni, U. Willingness to pay for management and preservation of natural, semi-urban and urban beaches in Italy. Ocean Coast. Manag. 2019, 172, 93–104. [Google Scholar] [CrossRef]
  73. Rodella, I.; Madau, F.; Mazzanti, M.; Corbau, C.; Carboni, D.; Utizi, K.; Simeoni, U. Data for the analysis of willingness to pay for Italian beaches. Data Br. 2019, 23, 103815. [Google Scholar] [CrossRef] [PubMed]
  74. Marin, V.; Palmisani, F.; Ivaldi, R.; Dursi, R.; Fabiano, M. Users’ perception analysis for sustainable beach management in Italy. Ocean Coast. Manag. 2009, 52, 268–277. [Google Scholar] [CrossRef]
  75. Rodella, I.; Corbau, C.; Simeoni, U.; Utizi, K. Assessment of the relationship between geomorphological evolution, carrying capacity and users’ perception: Case studies in Emilia-Romagna (Italy). Tour. Manag. 2017, 59. [Google Scholar] [CrossRef]
  76. Arrow, K.; Solow, R.; Portney, P.R.R.; Learner, E.E.; Radner, R.; Shuman, H. Report of the NOAA panel on contingent valuation. Fed. Regist. 1993, 58, 4601–4614. [Google Scholar]
  77. Alberini, A. Efficiency vs bias of willingness-to-pay estimates: Bivariate and interval-data models. J. Environ. Econ. Manag. 1995, 29, 169–180. [Google Scholar] [CrossRef]
  78. Chang, J.-I.; Yoon, S. Assessing the Economic Value of Beach Restoration: Case of Song-do Beach, Korea. J. Coast. Res. 2017, 79, 6–10. [Google Scholar] [CrossRef]
  79. Hanemann, W.M. Welfare Evaluations in Contingent Valuation Experiments with Discrete Responses. Am. J. Agric. Econ. 1984, 66, 332–341. [Google Scholar] [CrossRef]
  80. Hanemann, W.M. Welfare Evaluations in Contingent Valuation Experiments with Discrete Responses: Reply. Am. J. Agric. Econ. 1989, 71, 1057–1061. [Google Scholar] [CrossRef]
  81. Piriyapada, S.; Wang, E. Modeling Willingness to Pay for Coastal Tourism Resource Protection in Ko Chang Marine National Park, Thailand. Asia Pacific J. Tour. Res. 2014, 1665, 1–26. [Google Scholar] [CrossRef]
  82. Bohrnstedt, G.W.; Knoke, D. Statistics for Social Data Analysis; F.E. Peacock Publishers Inc.: Itasca, IL, USA, 1994; ISBN 0875814484. [Google Scholar]
  83. Preece, R.A. Designs on the Landscape: Everyday Landscapes, Values, and Practice; John Wiley & Son Ltd., Ed.; Belhaven Press: Hoboken, NJ, USA, 1991; ISBN 1852931728. [Google Scholar]
  84. Tudor, D.T.; Williams, A.T. A rationale for beach selection by the public on the coast of Wales, UK. Area 2006, 38, 153–164. [Google Scholar] [CrossRef]
  85. Corbau, C.; Simeoni, U.; Melchiorre, M.; Rodella, I.; Utizi, K. Regional variability of coastal dunes observed along the Emilia-Romagna littoral, Italy. Aeolian Res. 2015, 18, 169–183. [Google Scholar] [CrossRef] [Green Version]
  86. Zube, E.H.; Sell, J.L.; Taylor, J.G. Landscape perception: Research, application and theory. Landsc. Plan. 1982, 9, 1–33. [Google Scholar] [CrossRef]
  87. Hull, R.B.; Reveli, G.R.B. Cross-cultural comparison of landscape scenic beauty evaluations: A case study in Bali. J. Environ. Psychol. 1989, 9, 177–191. [Google Scholar] [CrossRef]
  88. Ulrich, R.S.; Simons, R.F.; Losito, B.D.; Fiorito, E.; Miles, M.A.; Zelson, M. Stress recovery during exposure to natural and urban environments. J. Environ. Psychol. 1991, 11, 201–230. [Google Scholar] [CrossRef]
  89. Kent, R.L.; Elliott, C.L. Scenic routes linking and protecting natural and cultural landscape features: A greenway skeleton. Landsc. Urban Plan. 1995, 33, 341–355. [Google Scholar] [CrossRef]
  90. Eleftheriadis, N.; Tsalikidis, I.; Manos, B. Coastal landscape preference evaluation: A comparison among tourists in Greece. Environ. Manag. 1990, 14, 475–487. [Google Scholar] [CrossRef]
  91. Baker, J.; Grewal, D.; Parasuraman, A. The influence of store environment on quality inferences and store image. J. Acad. Mark. Sci. 1994, 22, 328–339. [Google Scholar] [CrossRef]
Figure 1. Location map of investigated sites divided into coastal scenic classes: (a) 1–8 beaches of Rosolina Mare; (b) 9–17 beaches of Lidi di Comacchio; (c) 18–25 beaches of Metaponto Lido; (d) 26–38 Alghero beaches; (e) 39–40 beaches of Porto Torres.
Sustainability 12 01604 g001
Figure 2. Questionnaire distribution for each scenery class.
Sustainability 12 01604 g002
Figure 3. D value of each beach.
Sustainability 12 01604 g003
Figure 4. Correlations between scenery and beach type: (a) D value for each beach type; (b) classification of beach type for each scenery class.
Sustainability 12 01604 g004
Figure 5. Beaches classified in Class I: (a) Porto Caleri Free Beach 3—Rosolina Mare, Veneto; (b) Torre del Porticciolo vista—Alghero, Sardinia; (c) beach establishment at Torre del Porticciolo; (d) Porto Conte vista; (e,f) Porto Ferro) (photos taken in July 2017).
Sustainability 12 01604 g005
Figure 6. Beaches classified in Class II: (a) Le Bombarde beach; (b) Dragunara beach (photos taken in July 2017).
Sustainability 12 01604 g006
Figure 7. Beaches classified in Class III: (a) Mugoni beach (b) Fiume Santo beaches (Google Earth photo), (c) Marina di Porto Caleri (photo taken on July 2018); (d) Poglina beach (photo taken in July 2017) (e) Basento sx.
Sustainability 12 01604 g007
Figure 8. Beaches classified in Class IV: (a) Bagno Ermitage (Google Earth photo https://lh5.googleusercontent.com/p/AF1QipPVEtAuwqbeEY3jwYfPLTIjgBXjZgeII1kaZKyp=h720); (b) Bagno Mondial (Google Earth photo https://lh5.googleusercontent.com/p/AF1QipMQ8mm9-K_LoQR_WjuL_5tZwB0Pw_jMifYy1i2i=h1440); (c) Lido degli Scacchi—free beach (Google Earth photo https://lh5.googleusercontent.com/p/AF1QipOL4MLteRI-yz2cpykpWJoc2LGdnVjSHE4CttEC=h1440).
Sustainability 12 01604 g008
Figure 9. Beaches classified in Class V: (a,b) Rosolina Mare, Casoni—free beaches, (c) Lido degli Scacchi (photos taken on June 2017).
Sustainability 12 01604 g009
Figure 10. Distribution of Willingness to Pay (WTP) response in the Double Bounded DB Contingency Valuation in correlation with landscape importance: (a) BID 0; (b) BID 1.
Sustainability 12 01604 g010
Table 1. Previous studies that have investigated beach scenery assessment and environmental factors that influence users’ perceptions.
Reference YearScenery/Landscape/Environmental Assessment MethodsEnvironmental Factors That Influence Beach Users’ PerceptionsStudy AreaReference
2003CV for beach restoration and landscape preservationSpace, monetary and recreational factorsFlorida (USA)[14]
2003Beach environmental quality. Field surveys of physical and biological parameters. Interviews via questionnaireProximity, beach and sea qualityCasa Caiada and Rio Doce (Brazil)[15]
2004Fuzzy logic (CSES)Safety, water quality, facilities, beach surroundings, litterMalta[16]
2006Users’ perception of landscape changes during the seasons. Beach field surveys of physical parameters. Interviews via questionnaireLandscape, services, quality/price ratio, the number of usersCatalan Coast (Spain)[17]
2008Integrated index (IBVI) using 36 ecological indicators of biophysical features and environmental issues; 38 socioeconomic indicators describing infrastructure and servicesPhysical conditions such as water and climate, litter, absence of infrastructuresUSA[18]
2009Questionnaire survey based on 46 variables: geomorphological, physical, environmental parameters; services and equipment; landscapeEnvironmental degradation, facilities and equipment, overcrowdingSpain[19]
2009Multidimensional scaling analysisVegetation and human influenceNorway[20]
2011CSESSafety, water quality, facilities, beach surroundings, litterTurkey, UK, Malta, Croatia, New Zealand, Portugal, USA[21]
2013CSESLitter, sawage evidence, hard protective structuresColombia[22]
2013Users’ perceptionWater and sand quality, relaxed/friendly atmosphere, facilities, security and safety and family-friendly atmosphereColombia[23]
2014, 2017CSESExcessive urbanization, vegetation debris and litterCuba[24,25]
2016CSES and sector analysis approachScenery and litterColombia[26]
2018WTP to evaluate and preserve different shore types as environmental goodsShore type, sociometric indicatorsEstonia[27]
2019CSES and users’ perceptionSeawater quality, crowdingItaly[7]
2018, 2019CSESSeasonal changesBrazil[28,29]
Table 2. Coastal scenic evaluation system [37].
Num.Physical ParametersRating
12345
1CLIFFHeight (m)Absent (<5 m)5 m ≤ H < 30 m30 m ≤ H < 60 m60 m ≤ H < 90 mH ≥ 90 m
2Slope (°)<45°45–60°60–75°75–85°circa vertical
3Special Features aAbsent123Many (>3)
4BEACH FACE bTypeAbsentMudCobble/BoulderPebble/GravelSand
5Width (m)AbsentW < 5 m or W > 100 m5 m ≤ W < 25 m25 m ≤ W < 50 m50 m ≤ W ≤ 100 m
6ColorDarkDark tanLightLight tan/bleachedWhite/gold
7ROCKY SHORESlope (°)Absent<5°5–10°10–20°>20°
8Extent (m)Absent<5 m5–10 m10–20 m>20 m
9RoughnessAbsentDistinctly jaggedDeeply pitted and/or irregularShallow pittedSmooth
10DUNES AbsentRemnantsFore-duneSecondary ridgeSeveral
11VALLEY c AbsentDry valleyStream (<1 m)Stream (1–4 m)>4 m
12SKYLINE LANDFORM Not visibleFlatUndulatingHighly undulatingMountainous
13TIDES Macro (>4 m) Meso (2–4 m) Micro (<2 m)
14COASTAL LANDSCAPE FEATURE d None123>3
15VISTAS e Open on one sideOpen on two sides Open on three sidesOpen on four sides
16WATER COLOR & CLARITY Muddy brown/greyMilky blue/green/opaqueGreen/grey/blueClear blue/dark blueVery clear turquoise
17VEGETATION COVER Bare (<10% vegetation only)Scrub/garigue (marram/gorse, bramble, etc.)Wetlands/meadowCoppices, maquis (mature trees bushes)Varity of mature trees/mature natural cover
18VEGETATION DEBRIS Continuous
(>50 cm high)
Full strand lineSingle accumulationFew scattered itemsNone
Human parameters
19DISTURBANCE FACTOR (NOISE) f IntolerableTolerable LittleNone
20LITTER Continuous accumulationsFull strand lineSingle accumulationFew scattered itemsVirtually absent
21SEWAGE (DISCHARGE EVIDENCE) g Sewage evidence Same sewage evidence No evidence of sewage
22NON_BUILT ENVIRONMENT h None Hedgerow/terracing/monoculture Field mixed cultivation ± trees/natural
23BUILT ENVIRONMENT i Heavy IndustryHeavy tourism and/or urbanLight tourism and/or urban and/or sensitiveSensitive tourism and/or urbanHistoric and/or none
24ACCESS TYPE j No buffer zone/heavy trafficNo buffer zone/light traffic Parking lot visible from coastal areaParking lot not visible from coastal area
25SKYLINE Very unattractiveUnattractiveSensitively designedVery sensitively designedNatural/historic features
26UTILITIES k >3321None
a Cliff Special Features: indentation, banding, folding, screes, irregular profile, faulting, gullying, indentation, scree/talus, tufa, unconformity, dikes, sill [54]. b Beach Face: a deposit of noncohesive material located at the land/water interface and actively worked by waves, currents, and sometimes wind [54]. c Valley: a V-shaped landscape feature formed by flowing water. If no water is present, it is termed a dry valley. If water is present the valley form can range from a small stream (<1 m) to a large river (<4 m). In fjord areas, glacial activity will have scoured the pre-existing river valley to a U shape [54]. d Coastal Landscape Features: Peninsulas, rock ridges, irregular headlands, arches, windows, caves, waterfalls, deltas, lagoons, islands, stacks, estuaries, reefs, fauna, embayment, tombolo, etc. e Vistas: the line of sight too far off views, as a site could be enclosed on 1, 2, or 3 sides—the 4th side is always open to the sea. A far vista is where the foreground hill has another secondary background feature visible, e.g., a higher hill/mountain [54]. f Disturbance Factor (Noise): Noise that may harm the activities developed at a coastal location, e.g., playing loud radio/CD music, jet skis, heavy traffic, airport noise, etc. [54]. g Sewage (Discharge Evidence): Relates to human/animal waste products, as well as its associated accessories, e.g., sewage pipes draining to beach, condoms, tampon applicators, nappies, etc. [54]. h Nonbuilt environment: there is no agricultural evidence. If the natural vegetation cover parameter (17) has scored a 5, then tick the 5 box. If the natural vegetation cover parameter (17) has scored 2, 3, or 4, then tick the 3 box. i Built Environment: Caravans will come under tourism, grading 2: Large intensive caravan site, grading 3: Light, but still intensive caravan sites, grading 4: Sensitively designed caravan sites. j Access Type: A buffer zone is an area that divides two separate entities; for example, a tree-lined promenade, or a natural grass area that separates a beach from a coastal road. k Utilities: Power lines, pipelines, street lamps, groins, seawalls, revetments.
Table 3. Variables used in the multivariate model.
Variable TypeVariableAbbreviationDescription
Socio-demographicGenderG1 = Male
0 = Female
EducationE1 = Under high school
2 = High school
3 = Degree or upper
ResidenceR1 = Resident
0 = Non-resident
FrequentationF1 = First time in the locality
2 = Sometimes in the locality
3 = Habitually frequentation
EnvironmentalSceneryS1 = Class I
2 = Class II
3 = Class III
4 = Class IV
5 = Class V
Available space per personAS1 = Insufficient
2 = Sufficient
3 = Adequate
Landscape judgmentLJ1 = Bad
2 = Indifferent
3 = Beautiful
Landscape importanceLI1 = Low
2 = Medium
3 = High
Knowledge of erosionBE0 = No
1 = Yes
Table 4. Location, beach type, and CSES.
LocationN.BeachBeach Type [72]D ValueClass
ROSOLINA MARE (RO)1Spiaggia libera CasoniSemiurban−0.06V
2Camping Rosapineta liberaSemiurban0.2IV
3Bagno TizèSemiurban0.15IV
4Bagno PerlaSemiurban0.27IV
5Marina di Porto CaleriSemiurban0.53III
6Porto Caleri free beach 1Natural0.92I
7Porto Caleri free beach 2Natural0.77II
8Porto Caleri free beach 3Natural1.02I
LIDI DI COMACCHIO (FE)9Bagno Ipanema_Lido di VolanoUrban0.43III
10Lido di Volano Sud—free beachNatural−0.26V
11Lido di Nazioni—free beachUrban0.2IV
12Bagno Cristallo_Lido di NazioniUrban−0.61V
13Bagno Aloha_Lido di NazioniUrban−0.36V
14Bagno Pic Nic_Lido PomposaUrban−0.48V
15Bagno Sagano_Lido degli ScacchiUrban−0.19V
16Lido Scacchi—free beachUrban0.11IV
17Bagno Nettuno_Porto GaribaldiUrban−0.24V
METAPONTO LIDO (MT)18Lido Marinella—free beachNatural1.04I
19Riva dei GreciNatural0.69II
20Bagno Magna GreciaSemiurban0.5III
21Bagno Blumen BadSemiurban0.3IV
22Bagno ErmitageSemiurban0.11IV
23Bagno MondialSemiurban0.19IV
24Bagno Le DuneSemiurban0.39IV
25Basento sx—free beachNatural0.55III
ALGHERO-PORTO TORRES (SS)26Lido San GiovanniUrban0.48III
27Maria PiaSemiurban0.48III
28La Punta NegraUrban0.6III
29Cala BonaSemiurban0.19IV
30Le BombardeNatural0.65II
31Torre del LazzarettoNatural0..85I
32Porto ConteSemiurban1.12I
33MugoniNatural0.52III
34Cala TramariglioSemiurban0.71II
35DragunaraNatural0.68II
36Torre del PorticcioloNatural121I
37Porto FerroNatural1.15I
38PoglinaNatural0.49III
39Scoglio LungoUrban−0.24V
40Fiume SantoNatural0.5III
Table 5. Users’ profile among scenic classes.
QUESTIONSScenery ClassAverage (%)
I (%)II (%)III (%)IV (%)V (%)
SEXmale60.542.941.446.147.444.6
female39.555.757.952.549.353.9
no answer0.01.40.81.43.31.5
AGE<2518.416.716.723.631.523.7
26–4031.638.933.322.122.226.1
41–6539.544.445.845.739.843.4
>6510.50.04.28.66.56.9
EDUCATIONAL LEVELsecondary school26.39.121.819.130.319.7
college39.540.654.454.645.448.3
academic degree34.248.921.824.822.430.3
no answer0.01.41.91.42.01.6
RESIDENCEresident65.824.237.224.826.330.8
not resident34.274.962.175.273.068.6
no answer0.00.90.80.00.70.6
COMPANYonly7.92.73.43.59.94.7
in couple13.229.220.311.313.219.5
family (with children)44.720.551.763.842.843.4
friends34.242.022.617.732.929.5
other0.05.51.13.50.72.6
INCOME<20,000 €60.532.036.029.127.633.3
20,000–31,000 €23.728.322.629.119.124.7
31,000–41,000 €2.615.112.611.310.512.2
>41,000 €0.014.28.812.19.910.6
no answer13.210.519.918.432.919.2
MOTIVATION FOR THE VISITSea/beach34.271.746.427.015.843.5
nature and landscape5.33.23.10.70.02.2
cultural heritage (handicraft/folklore/cooking)2.60.00.00.00.7.2
economic reasons0.0.51.51.45.31.8
play sport/amusement0.01.41.13.55.92.5
relax/quiet7.94.69.210.69.28.1
have a holiday home13.28.710.727.023.015.4
proximity to residence34.25.516.919.929.617.5
other0.03.76.50.70.73.3
Table 6. Physical, environmental, and management factors.
QUESTIONSI (%)II (%)III (%)IV (%)V (%)Average (%)
LANDSCAPE JUDGEMENTBeautiful81.690.962.566.045.468.4
Indifferent15.85.923.825.534.220.8
Bad0.01.49.67.019.18.3
No answer2.61.84.21.41.32.5
LANDSCAPE IMPORTANCEHigh60.580.854.041.153.959.3
Medium36.816.440.649.636.834.8
Law0.01.42.34.35.93.0
No answer2.61.43.15.03.33.0
KNOWLEDGE OF BEACH EROSIONYes86.888.184.393.686.287.4
No13.211.013.05.012.511.0
No answer0.00.92.71.41.31.6
BEACH EROSION IMPORTANT ISSUEYes81.688.681.690.186.285.8
No13.24.66.12.85.95.4
No answer5.36.812.37.17.98.8
Table 7. Relationship between landscape judgment and importance given by beach users.
Landscape JudgmentLandscape ImportanceAverage (%)
High (%)Medium (%)Low (%)No Answer (%)
Beautiful (%)79.654.612.562.568.4
Bad (%)7.17.150.04.28.3
Indifferent (%)12.334.433.320.820.8
No answer (%)1.03.94.212.52.5
Total (%)59.334.83.03.0100
Table 8. WTP answer to the initial BID in relation to scenery class.
WTP AnswerScenery ClassAverage (%)
I (%)II (%)III (%)IV (%)V (%)
Yes% in Scenery class63.272.855.150.459.760.3
% of the total3.119.717.88.810.960.3
No% in Scenery class36.827.244.949.640.339.7
% of the total1.87.414.58.77.439.7
Table 9. WTP results by the dichotomous logit model (number of records = 794) (S.E.: Standard Error; z: z-Statistic; D.F.: Degree of Freedom).
VariablesCoeff.S.E.zp-Value
Constantα0.9621.1257.7000.000 ***
BIDβ−0.0580.010−5.4980.000 ***
Test on Regression
LL valueLL’ value *X2D.F.X2 (0.95)p-Value
−517.88−520.75.6813.840.000
MEDIAN WTP = 16.59 €
* p-value less than 0.05; ** p-value less than 0.01; *** p-value less than 0.001. LL value: Log-Likelihood value; LL’ value: Log-Likelihood value for the restricted hypothesis (related to the alternative model, without the constant term); X2: chi-square; X2 (0.95): significative chi-square at 0.05. * Alternative model without the constant term.
Table 10. Dichotomous multinomial logit model using socio-demographic variables (number of records = 794) (S.E.: Standard Error; z: z-Statistic; D.F.: Degree of Freedom).
VariablesCoeff.S.E.zp-Value
Constantα1.0280.4302.3920.017 *
BIDβ−0.0600.011−5.5600.000 ***
Scenery classS−0.1110.067−1.6590.097
GenderG−0.2980.151−1.9670.049 *
EducationE0.3810.1093.4950.050 *
ResidenceR−0.0980.163−0.6020.547
Beach frequentationBF−0.0200.107−0.1880.851
Test on regression
LL valueLL’ value *X2D.F.X2 (0.95)
−494.99−427.13−135.71413.840.000
* p-value less than 0.05; ** p-value less than 0.01; *** p-value less than 0.001. LL value: Log-Likelihood value; LL’ value: Log-Likelihood value for the restricted hypothesis (related to the alternative model, without the constant term); X2: chi-square; X2 (0.95): significative chi-square at 0.05. *Alternative model without the constant term.
Table 11. Dichotomous multinomial logit model using physical and environmental variables (number of records = 794) (S.E.: Standard Error; z: z-Statistic; D.F.: Degree of Freedom).
VariablesCoeff.S.E.zp-Value
Constant −1.4260.743−1.9200.055
BIDβ−0.0660.011−5.8920.000 ***
Available space per personAS0.2240.110−2.0310.042 *
Landascape importanceLI0.2450.1491.6470.100
Landascape judgementLJ0.6280.1324.7410.000 ***
ErosionBE0.3670.2401.5260.127
Test on regression
LL valueLL’ value *X2D.F.X2 (0.95)
−482.19−483.452.5213.840.000
* p-value less than 0.05; ** p-value less than 0.01; *** p-value less than 0.001. LL value: Log-Likelihood value; LL’ value: Log-Likelihood value for the restricted hypothesis (related to the alternative model, without the constant term); X2: chi-square; X2 (0.95): significative chi-square at 0.05. * Alternative model without the constant term.

