Article

An IoT-Based Thermoelectric Air Management Framework for Smart Building Applications: A Case Study for Tropical Climate

1
Center of Research Excellence in Renewable Energy (CoRE-RE), King Fahd University of Petroleum & Minerals, Dhahran 31261, Saudi Arabia
2
Computer Science Department, Faculty of Computing and Information Technology, King Abdulaziz University, Jeddah 21589, Saudi Arabia
3
Department of Electrical & Computer Engineering, Faculty of Engineering, King Abdulaziz University, Jeddah 21589, Saudi Arabia
*
Author to whom correspondence should be addressed.
Sustainability 2020, 12(4), 1564; https://doi.org/10.3390/su12041564
Submission received: 16 January 2020 / Revised: 15 February 2020 / Accepted: 16 February 2020 / Published: 19 February 2020

Abstract

:
This study investigates the performance of the thermoelectric air conditioning (TE-AC) system smartly controlled by the Internet of Things (IoT)-based configuration for real tropical climatic application. Air cooling management was done through thermoelectric coolers, and an Arduino microcontroller with various sensors such as a temperature sensor, simple RF modules, and actuators was used to control the indoor climatic conditions based on outdoor conditions. The result shows that when the input power supply to the IoT-based TE-AC system is increased, the cooling capacity of the framework is also enhanced. Significant power and carbon emission reduction was observed for the IoT-based TE-AC system as compared to the TE-AC system without IoT. The IoT-incorporated system also ensures better microclimatic temperature control. Additionally, the system cooling capacity improves by 14.0%, and the coefficient of performance is increased by 46.3%. Thus, this study provides a smart solution to the two major energy harvesting issues of traditional air conditioners—an increase in energy efficiency by employing a TE-AC system and a further improvement in efficiency by using an IoT-based thermal management system.

1. Introduction

In regions with hot and humid climatic conditions, air conditioning systems are used for space cooling, which results in a large amount of energy consumption [1]. Individuals are constantly searching for an improved way to reduce energy consumption to reduce the electricity bill [2]. As per the data available, 39% of the total energy and 71% of total electrical energy are consumed in buildings [3]. A large amount of energy consumption is wasted due to several undesirable heating and cooling processes. Studies show that the common cause of this energy waste is mainly due to the poor architecture, planning, design, and construction of buildings and their energy control processes [4,5].
This shows that space cooling is one of the leading sources of energy consumption, and it is predicted that its demand will reach 80% by the year 2030. One of the feasible approaches to improve energy efficiency is to optimize electricity utilization [6,7]. Recent studies pay more attention to the development of an air conditioning system that requires lower operational energy and has a minimal impact on the external environment such as a thermoelectric cooling system [8]. There is also a need to build intelligent systems to control energy consumption for improving energy efficiency. Artificial neural networks (ANNs) and Internet of Things (IoT)-based intelligent systems are capable of addressing such requirements, as IoT- and ANN-based systems can sense various environmental parameters and can help regulate energy consumption [9,10]. ANN models are used for forecasting the desired results of the system based on training data for solving complex real experimental problems that involve non-linear variables. IoT-based systems analyze various environmental parameters, such as humidity, temperature, etc., at regular intervals and then control the system. The data generated by IoT-based sensors are used to control the air-conditioner and automate activity such as automatically switching the air-conditioner on/off when the room temperature is high/low [11]. A considerable amount of electricity can be saved if the preset temperature is regulated through a mild process. Conventionally, the preset temperature and electricity consumption is adjusted manually for saving electricity. To overcome the wastage of electric energy due to the manual controlling method, numerous remotely controlled automated systems are built for smart houses to increase power utilization efficiency [12]. The internet is used to remotely communicate with the automated system to manage and optimize the electricity expenditure of cooling systems, which accounts for the largest expenditure of power among commonly used household devices [13].
Furthermore, a normal air conditioner can be replaced with a thermoelectric module (TEM) which is an electronic device that changes electrical energy into temperature gradient [14]. It becomes a good option for cooling systems due to its benefits over conventional A/C systems, such as the absence of auxiliary pipes and moving parts. It is free from Freon and capable to perform under severe environmental conditions. Researchers envisage the potential of TEM, and they started to integrate it into buildings for cooling applications [15]. Gillot et al. [16] investigated a TEC system equipped with eight thermoelectric modules for small building applications. They found that the proposed system was able to provide a maximum cooling capacity of 220 W with a coefficient of performance (COP) of 0.46 at 4.8 A current supply. Seo et al. [17] mathematically calculated the COP of a TEM unit with distinct heat-sink structures. The study concluded that the physical dimensions of heat-sinks remarkably impact the COP of the TEM module. Sun et al. [18] focused on an arrangement that has two major components—a TEM and a heat pipe. In this research, a rectangle-shaped heat sink is used in the colder side of TEM. Furthermore, reference [19] proposed and built a unique prototype consisting of a thermoelectric cooler that uses water flow to control the hot side of the thermoelectric module. It is recorded that the coefficient performance of the cooler significantly impressed as per the input power, air, or water flow and inlet temperature.
Attar et al. [20] experimented with air-to-air TEM units as an air conditioning system for automobiles. They experimented with different parameters to achieve the best design condition. Irshad et al. [21] examined the air cooling processes for energy-efficient buildings employing thermoelectric air ducts. Further, reference [22] investigated the disc-shaped thermoelectric modules from energy and exergy aspects. Yilmazoglu et al. [23] investigated, both experimentally and numerically, the performance of a thermoelectric heating and cooling prototype. The result showed that, for the same input voltage to the TEC (8 V), the cooling duct air temperature decreases by 1.2 °C, while the heating duct air temperature increases by 11 °C. The authors of reference [19] developed a novel air water-based TEC system. The result showed that the water circulation behind the hot side of the TEMs reduces the temperature significantly while increases the cooling performance of the TEMs. The above study was further investigated in reference [24] with different heat sink configuration. Luo et al. [25] also accurately simulated the thermoelectric radiant panel system by using the ANN model and experimentally validated the outcome of the results. The results showed that the optimal thickness of the insulation and aluminum panel should be 0.04–0.05 m and 1–2 mm. Recently, the authors of reference [26] investigated the performance improvement of a thermoelectric air cooler by joining 2–6 thermoelectric modules. The result shows that the COP of the system was significantly enhanced by joining TEMs together, as compared to a single TEM’s operation.
Through an intensive literature review, it was found that the application of TECs for air conditioning purposes was investigated by different researchers for lab-scale models, but their practical implementation is still under investigation. The main challenges faced by different researchers are to make TECs compatible with current air conditioning systems due to the low COP and cooling capacity of TEMs. Therefore, this paper tries to investigate the novel Arduino-based IoT system for developing a smart thermoelectric temperature management system. This IoT system is integrated with the already tested and published TE-AC system [21] for real building cooling applications. The principle of energy saving and COP improvement in this proposed system lies in the automatic reversing of the heating and cooling process of the TEMs based on the external environment temperature and internal room temperature. Further, based on indoor room temperature data input, this system automatically adjusts its cooling capacity by aligning and disassociating TEMs, which leads to energy saving.

2. Methodology

2.1. Experimental Test Room

The investigation and information gathering were directed from 12 August 2018 to 5 September 2018 utilizing the single room chamber of Universiti Teknologi PETRONAS, Perak, Malaysia. The measurements of the test chamber were 2.8 m (width, X) × 2.7 m (length, Y) × 2.5 m (height, Z), as presented in Figure 1, and its thermo-physical properties were displayed in past work [27].
The TE-AC framework is shown in Figure 2. It was composed of an aluminum sheet lodging upheld by a casing and wrapped with a protective sheet. This TE-AC framework was introduced on the north side of the test chamber. A perspex sheet, which was introduced at the focal point of the channel that associates with a house, was composed of 24 (TEC1-12730, Hebei, China) TEMs. It was intended to isolate the air channel into two compartments where the air was cooled in one compartment and warmed in the other by the TEMs. A small opening was made in the perspex sheet to fasten the warmth sink and TEMs together utilizing screws. The aluminum warmth sink was 65 mm × 65 mm × 20 mm, while the aluminum cold plate was 65 mm × 65 mm × 10 mm. Both hot and cold sides of the compartment were fitted with an axial stream fan. The specifications of the cold side axial-flow fan were 30 W, 50~60 Hz, and 300 CFM, while the hot-side duct fan was 56 W, 70~80 Hz, and 600 CFM. These fans helped to improve the performance of the TE-AC framework by controlling the speed of the airflow through the channels. The two fans were associated with a speed controller to control the fan speed. The TE-AC framework dimensions were designed based on aspect ratio criteria, which is the proportion of the elements of the two nearby sides of a rectangular duct. As per ASHRAE Standard 62.2 [28], these measurements were in the proportion of 4:1, as presented in Figure 3.
The TEMs inside the Perspex sheet were arranged in three columns and eight rows (3 × 8). Each of the TEMs were electrically connected in a series with three columns connected in parallel. The peak test chamber thermal load that was 590 W, determined before the establishment of the TE-AC system. It was formerly determined that, at a connected voltage of 5 V and current of 6 A, 25 W cooling capacity was generated by each TEM. Along these lines, for a thermal load of 590 W, the quantity of TEMs required was diminished to 24 units, which can give up to 600 W of cooling capacity at the specified configuration. For every arrangement, the positive wires of the TEMs were associated with the negative wires of the consequent TEM, while the positive wires were finally associated with a Bus bar (positive bar) and the negative wires toward the end were associated with another Bus bar (negative bar). The outside air was passed inside the test chamber through the TE-AC system introduced in the north direction of the chamber with the assistance of a fan as appeared in Figure 2. At the point when the DC power source was on, a current was connected over the TEMs, which made a temperature contrast between the cold and hot sides of the TEMs. Hot side heat sink having fins of dimension (15 × 75 × 1 mm) was installed to improve the heat rejection rate from the hot-side.
The analysis was done with two power supplies, whereby ([24 (TEMs) × 5 (Ampere) × 5 (Voltage) = 600 W and 24 (TEMs) × 6 (Ampere) × 5 (Voltage) = 720 W) were utilized to examine the impact on the primary outcomes—for example, room temperature, room RH%, COP, and capacity of cooling limit. K type thermocouples at 20 different locations in test chamber and the TE-AC system were installed to gather information at regular intervals with the assistance of data loggers. Other measuring sensors such as a Davis Vantage Pro (Davis Instruments, Hayward, CA, USA) or weather data collection, humidity sensors, and Testo 480 (Testo, West Chester, PA, USA) types of equipment were installed inside and outside the test chamber.

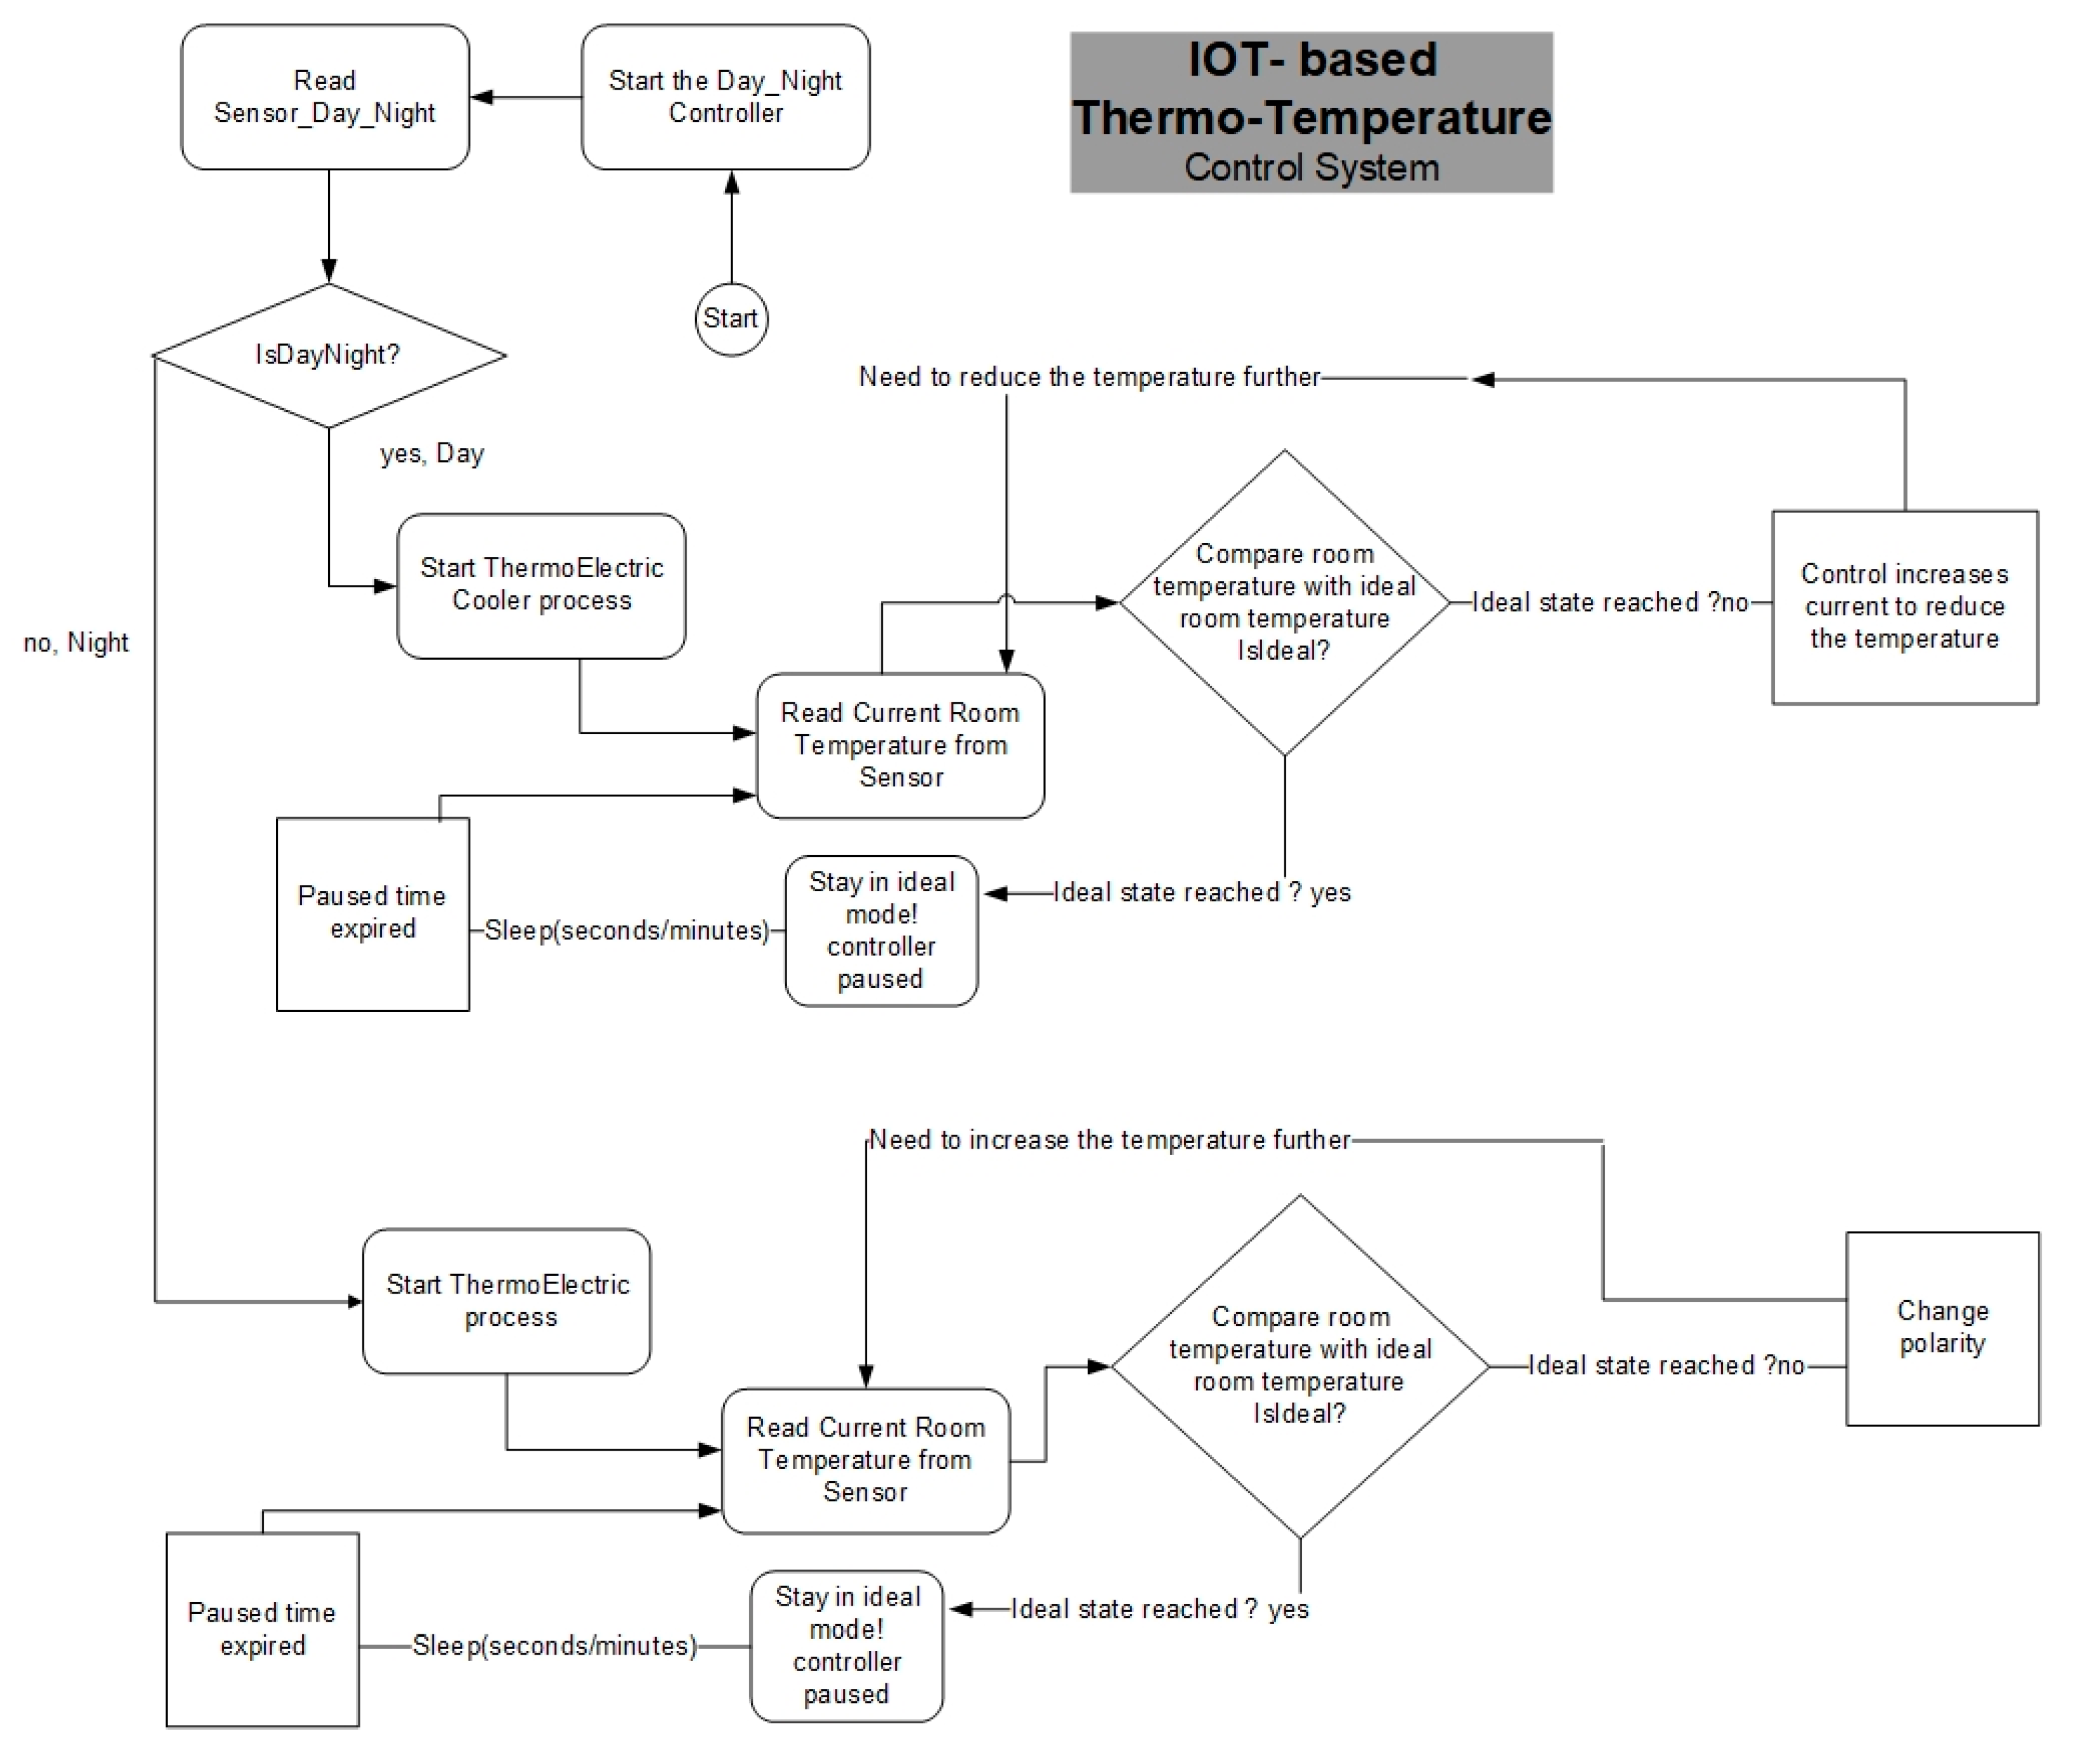
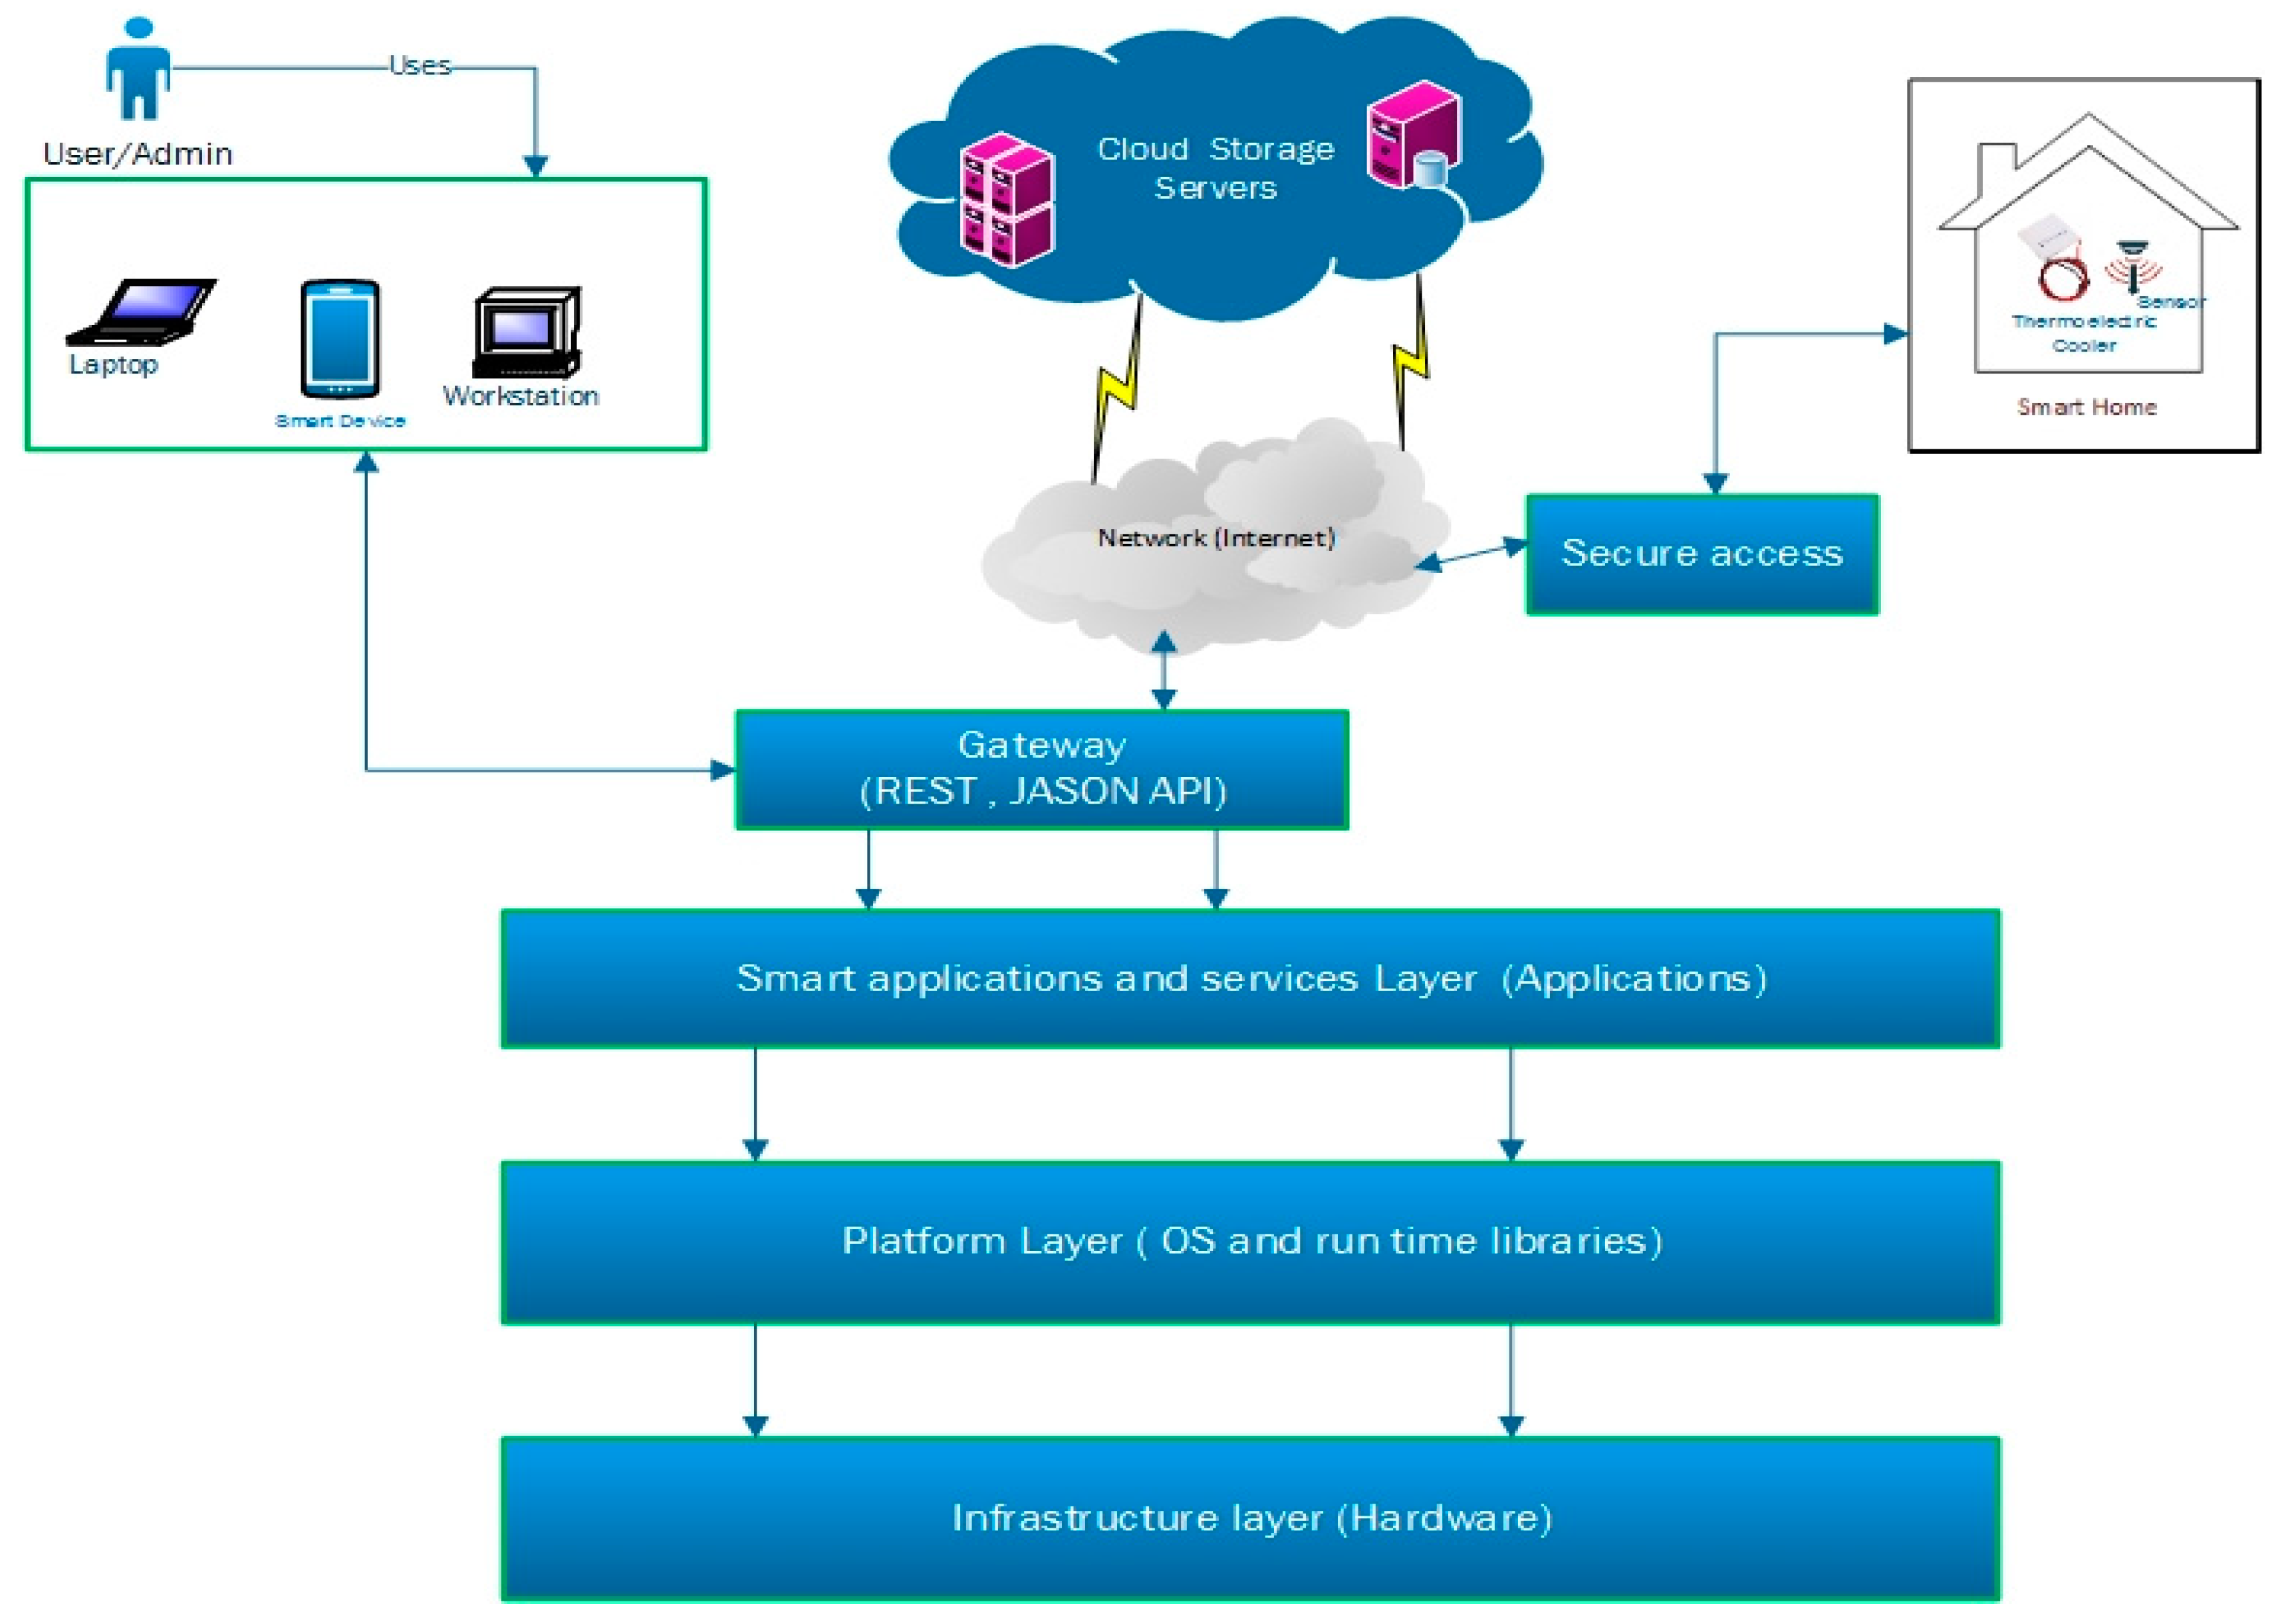
2.2. System Architecture

A lot of interest has been raised in energy-saving studies as it helps in the optimal use of energy by saving energy and thereby helps in reducing the cost to end-customers. The energy-saving system coupled with the TE-AC system consists of several devices and sensors interfaced through an Arduino UNO (Arduino.cc, Somerville, MA, USA). Besides Arduino UNO, it has an H Bridge Drive BTS7960B (Blue PCB Electronics, Umm Al Quwain, United Arab Emirates); an LDR sensor (Kitronik Ltd., Nottingham, UK); an LM 35 temperature sensor (Texas Instruments, Dallas, TX, USA) and an LCD. An Arduino UNO board is an “open source” electronic platform based on hardware and software and is used to build a cross-platform system and project. It contains a controlling electronic chip (microcontroller), standardized hardware, and connections that are used to interface with external sensors and devices.
Arduino has AVR 8-bit RISC architecture, which is accessible in a DIP package. The input voltage required to operate it 7–12 volts. It has 14 digital I/O pins and six analog inputs pins, which we can connect to different sensors and actuators. Arduino boards can read inputs from external sensors and convert them into some outputs, like actuating a motor or switching on an LED. It can be programmed using a programming language as per the user’s requirements by providing commands to the microcontroller inside the Arduino board. LM35 is a three-terminal, analog, linear temperature sensor produced by National Semiconductor Corporation whose output voltage modifies linearly with variations in the input temperature. It requires a 5 V supply and has a standby current smaller than 60 uA. It can measure temperature in the range of −55 °C to 150 °C with a very high operational accuracy. The output voltage varies by 10 mV per degree Celsius change in temperature. A Light Dependent Resistor (LDR) sensor is a kind of variable resistor, available in different sizes of 3 mm, 5 mm, 10 mm 20 mm, etc., whose resistance depends on the intensity of light falling on it. If there is complete darkness, the LDR resistance becomes as high as 10 Mega Ohms, which reduces to a few Ohms in bright light.
An H-Bridge Drive BTS7960A consists of an H-bridge driver module built using Infineon chips BTS7960. It possesses excellent current handling capability and can be interfaced with an Arduino. It allows us to control devices with a current as high as 43 A. It has a 74HC244 chip, which helps in efficiently isolating the microcontroller chip and the motor driver and thereby provides protection from overheating and overcurrent.
It can reverse the direction of current supply to devices like a motor and has a maximum operating frequency of 25 kHz. The LCD used in the proposed IoT-based system is a 16 × 2 display unit having two lines for display, each showcasing 16 characters. It comprises two registers—Command and Data. It is used for displaying sensor data. It has an LED backlight that facilitates optimal display in all lighting situations.
The function of this IoT-based Temperature Control System is to monitor and maintain the temperature of a test-room by continuous monitoring different heat-related parameters. The Light Dependent Resistor (LDR) in our IoT-based temperature regulator circuit is kept outside the test room. The circuit diagram is shown in Figure 4. The resistance of the LDR changes depending on the amount of light falling on it during different parts of the day. It decreases as light increases during the day, resulting in more flow of power to the Arduino connected to it, thus providing the digital input “High” to the Arduino. Once a High input is fed to the Arduino, it directs the H-bridge connected to it to start supplying power to the TEM module, which starts operating, leading to cooling and lowering the temperature of the test room. On the other hand, during the night, as the light input to the LDR ceases, the resistance increases leading to reduced digital input power to the Arduino, which in turn directs the H-bridge to reverse the polarity of the power supply to the TEM module, and it stops the cooling process.
Additionally, the LM 35 senses the temperature and transfers the output to the Arduino so that, once the desired temperature is attained, the extra energy obtained can be channelized to be used for other applications, hence optimizing the energy use. The flow chart for the whole process is presented in Figure 5. Figure 6 shows the software component model for the IoT-based temperature control system.
The system uses the IoT platform, which is based on three major core components, i.e., things (sensors), the gateway, and the cloud (networks). The whole system flow (IoT sensor location, main device location, data flow) is shown in Figure 7. The IoT sensor is located in the lab, which is securely connected to the cloud server. Sensor data is stored on the cloud server and is later analyzed through the in-house build analytical application. To secure the data transfer between different networks we used the Rivest, Shamir, Adleman (RSA) encryption technique, which is a robust asymmetric cryptography algorithm for encrypting/decrypting
The system uses Component-Based Software Development (CBD) methodology. Each component requires and provides input and output to perform its own operations for generating its unique output. One of the main advantages of using CBD is that it supports software development using plug and play techniques by assembling software from existing components, as shown in Figure 6. The system uses standardized protocols such as
HTTP(S)—Commonly used transport protocol;
REST—Representational State Transfer, which is a uniform interface on data as resources with known manipulation means. It describes how one system can communicate state with another;
JSON—JavaScript Object Notation is a lightweight simple data representation format that is used for data interchanging.

3. Results

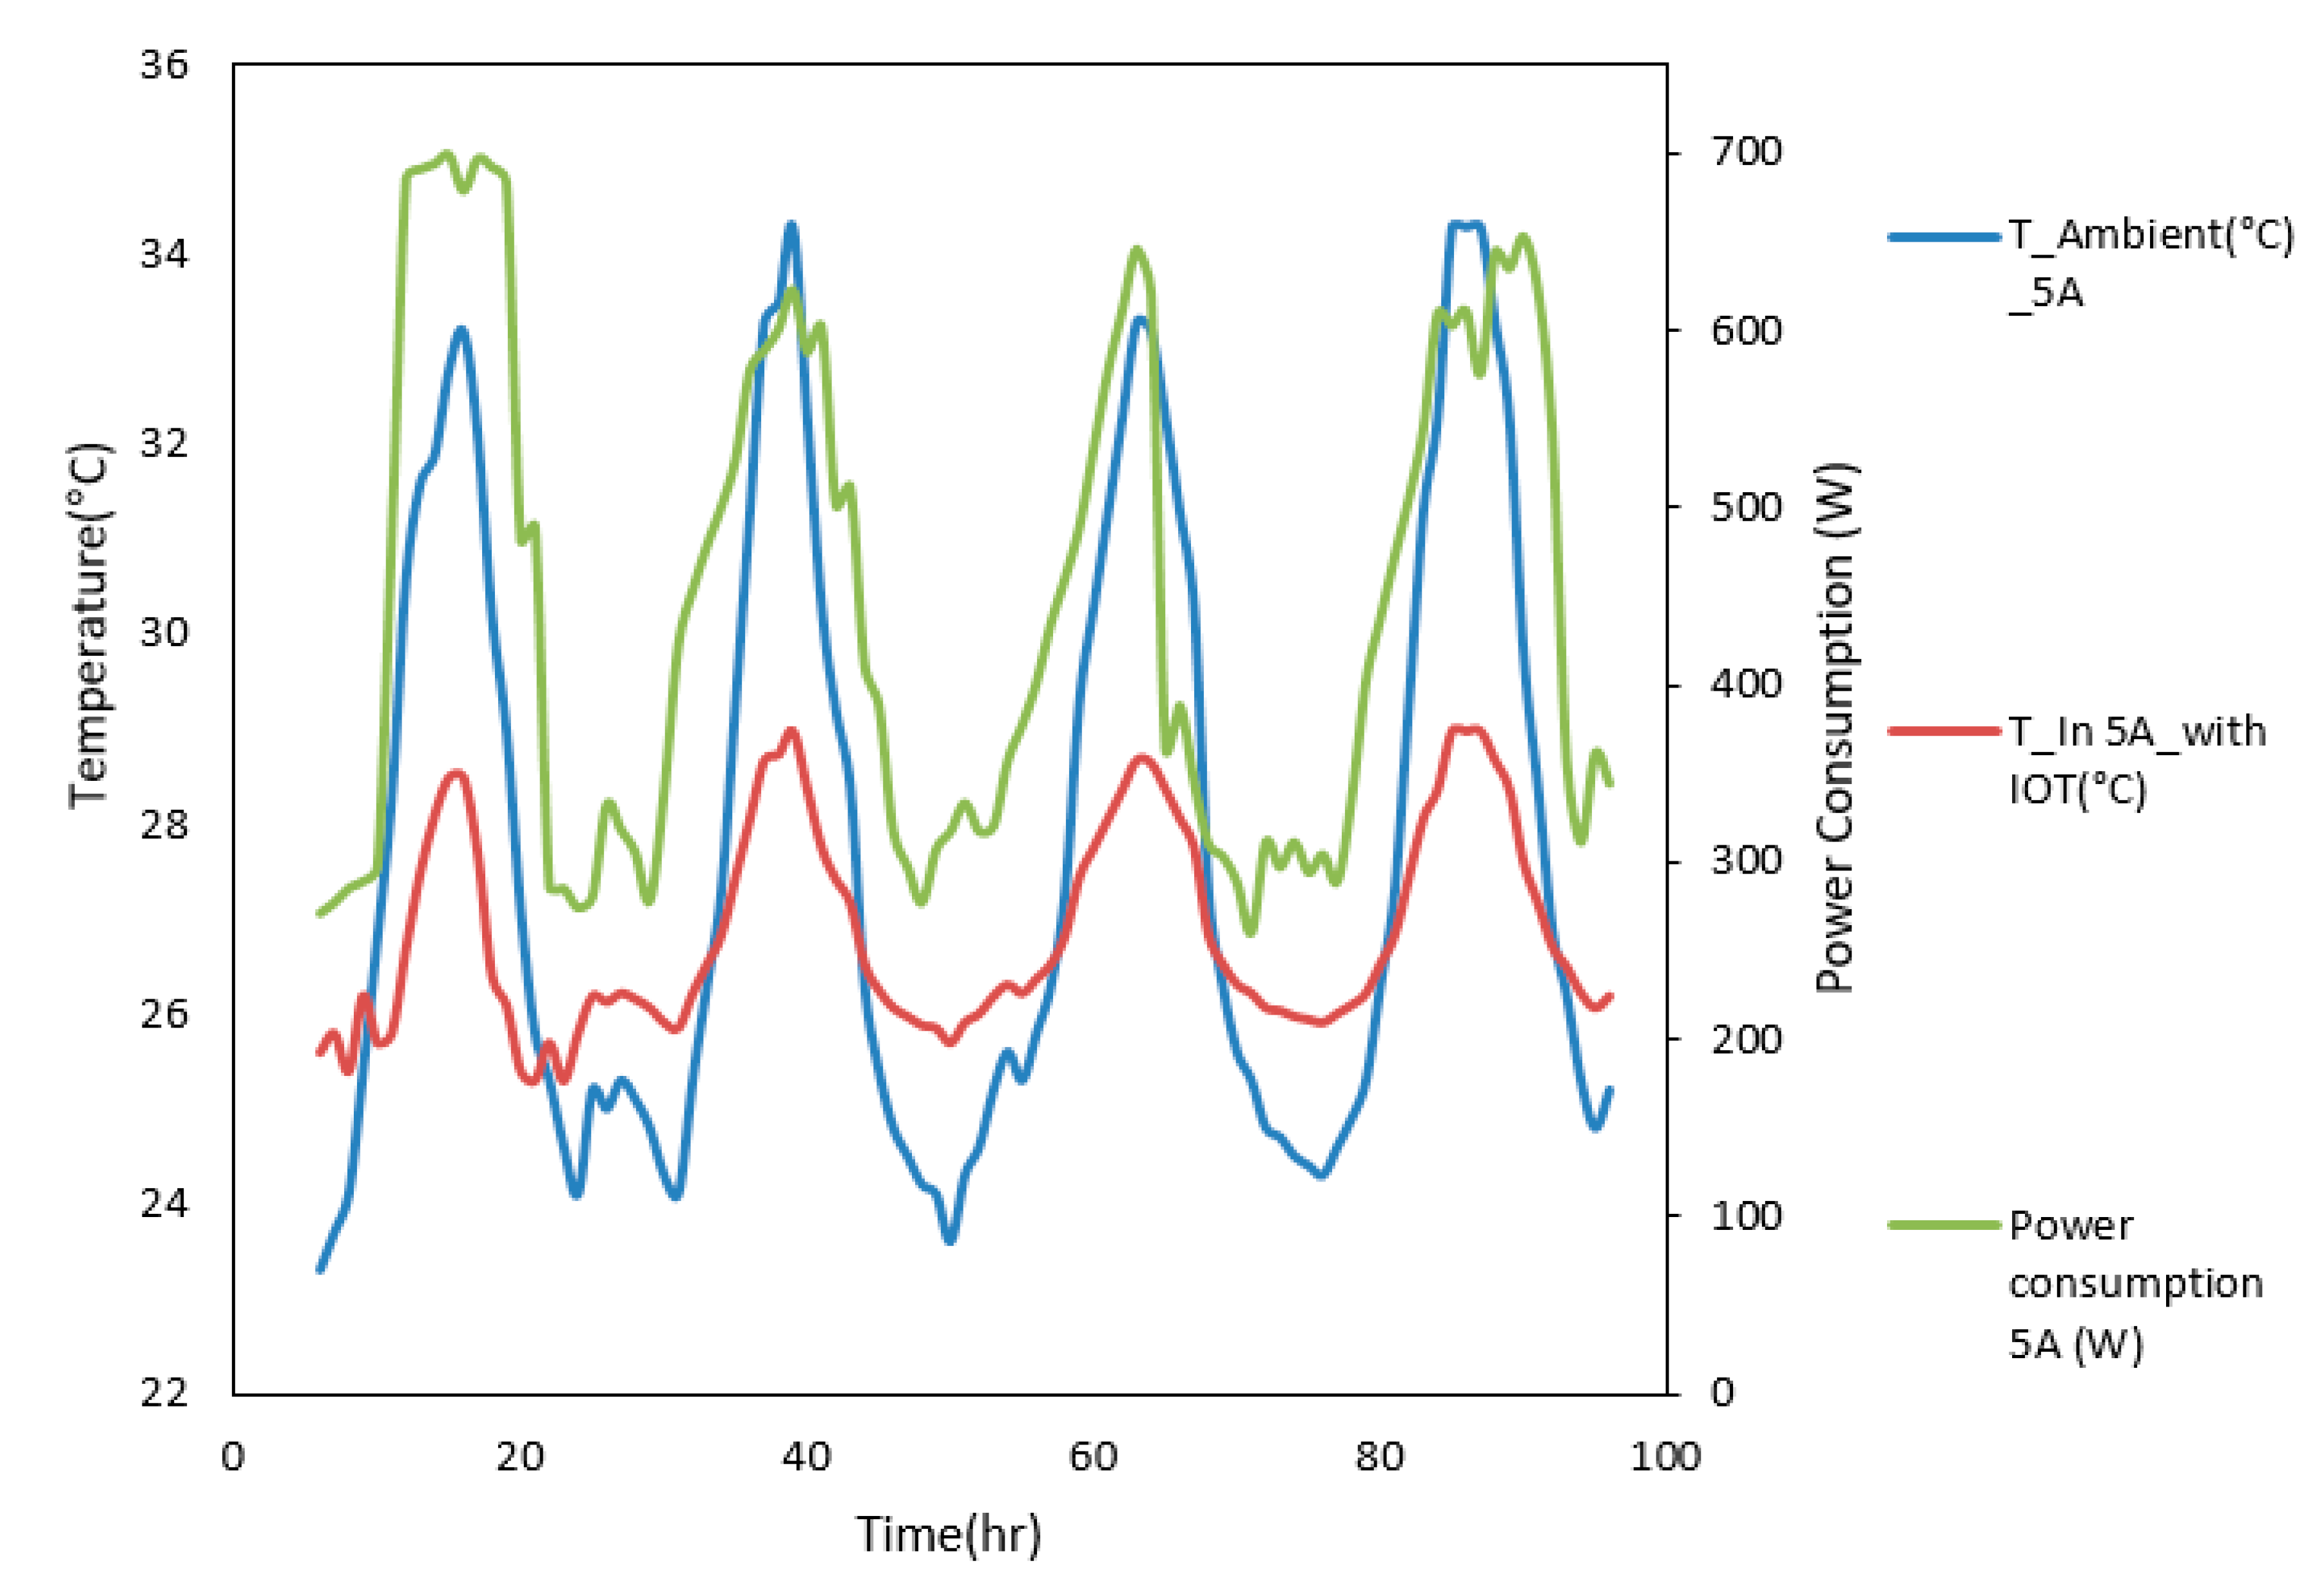
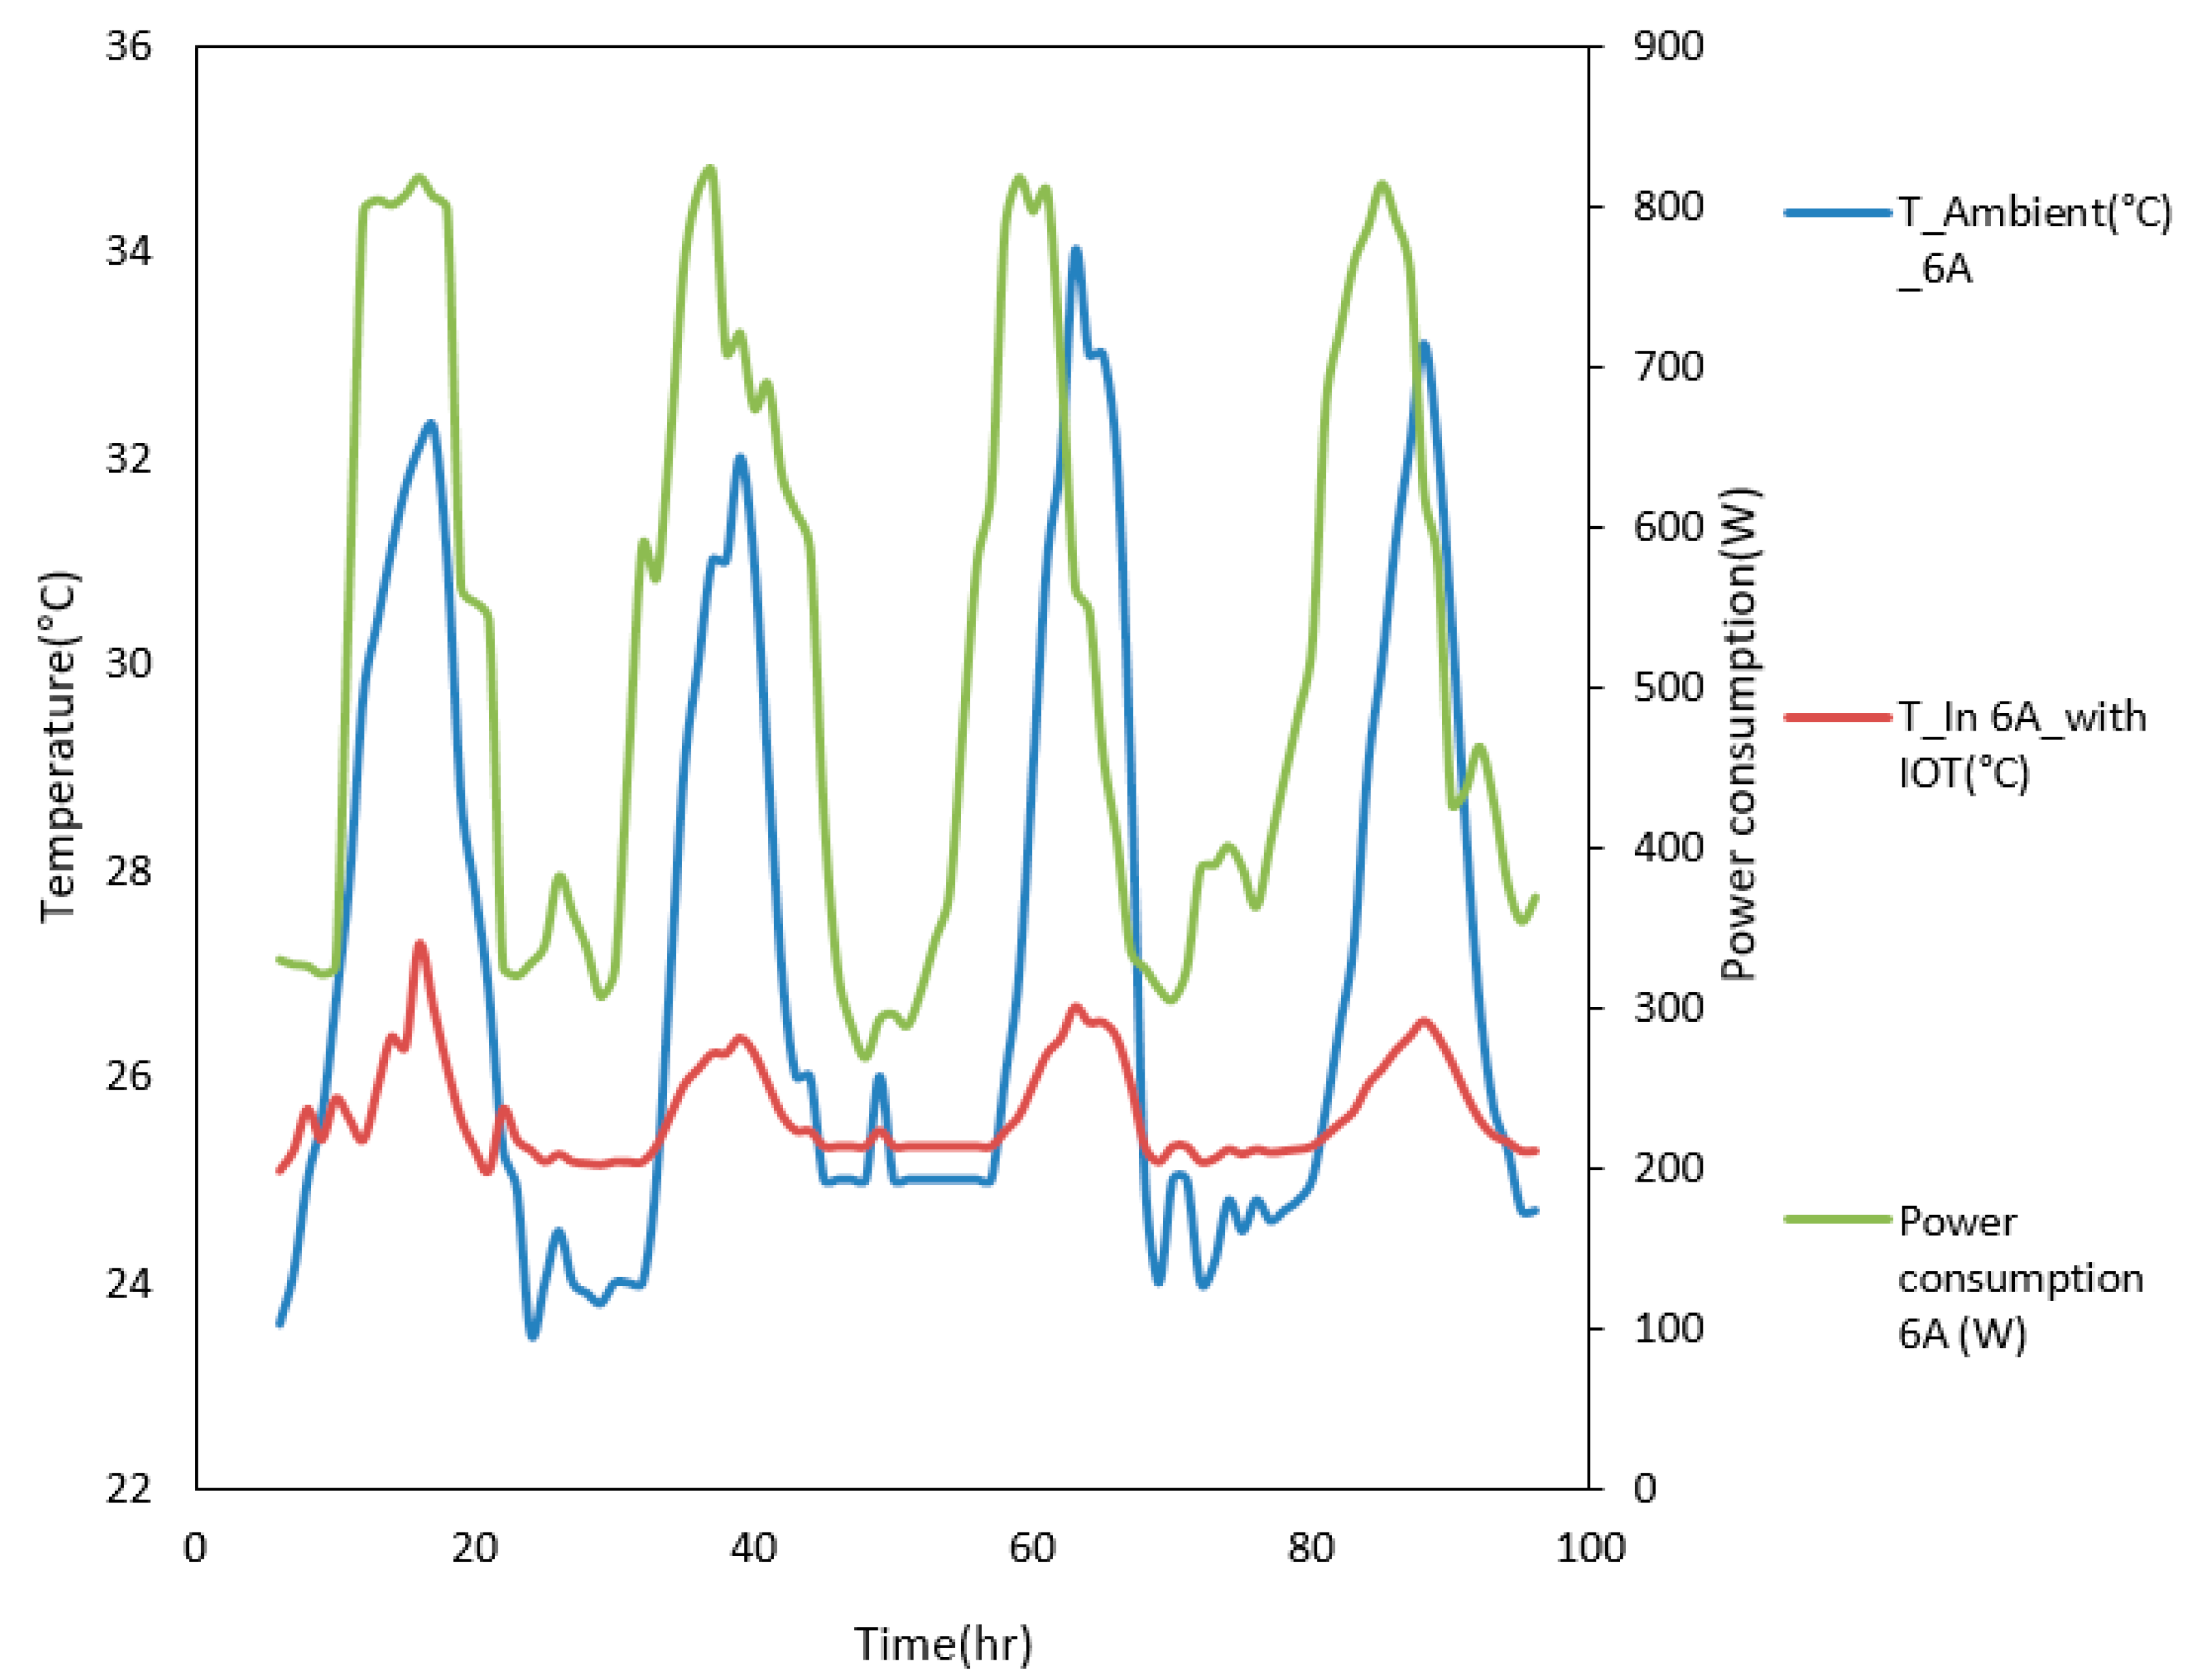
3.1. Effect on Room Temperature

The proposed TE-AC system aims to integrate indoor thermal management through smart sensors, which condenses the energy consumption. The variation in the indoor thermal environment was quickly monitored by high thermal diffusive temperature sensors. In similar conditions, the test room and the TE-AC system were tested in two modes, i.e., with the IoT-based TE-AC system and without the IoT-based TE-AC system. Since the performance of the TE-AC system was under observation since 2015 as stated in a previous paper [15], the optimum input power that was found in a previous paper was 5 A and 6 A. Thus, the system performance was tested by integrating IOT smart thermal management on an input current of 5 A and 6 A. As shown in Figure 8, when the TE-AC system operated at a 5 A input current without the IoT system, and the average power consumption is 639 W in its three-day operations. The temperature difference between indoor and outdoor climatic conditions was maximally reduced by 5 °C in this operation.
By integrating the IoT smart thermal management system with the TE-AC system, the power consumption fluctuation increases due to the dependence of sensor input, as shown in Figure 9. It was found that, during peak hours, the power consumption reached an upper quartile of 680 W/h, while on the non-peak hours, this consumption reduced to 250 W/h, as shown in Figure 9. Thus, the cumulative power consumption was reduced, while the reduction of the maximum temperature difference between indoor and outdoor temperature conditions remained almost the same.
By increasing the input current supply to the TE-AC system to 6 A, cooling performance of system increases and maximum temperature reduction between inside and outside increases to 6.5 °C. However, this increase in input power brings more challenges in the operation of the system, such as an increase in the hot-side temperature of the TEMs, an increase in the fan speed attached to the backside of the heat sink, the chance of heat transfer back to the cold side, and the reduction of overall efficiency. Thus, when the system runs continuously on the same power input, the above-mentioned challenges intensify, and the operation problems increase. The reliability and efficiency of TEC degraded due to the rise in thermal stress caused by the excessive rise in temperature. The air cooling of the hot-side of TEC becomes insufficient to meet the requirements. At the Peltier junction, additional thermal load caused diffusion of heat from the junctions, which are cold [29]. In this case, the non-uniform thermal load causes a large gradient in temperature at the cold-side of TEMs, which probably causes high thermal stress. This type of stress causes a rise in contact resistance, deformation, and sublimation of different layers of TE material. All this causes degradation in the cooling capacity of the TEC with increases in energy consumption. Further, this can also cause uncontrolled heat dissipation, which further reduces the system’s reliability and efficiency. The stress produced due to temperature increases was primarily related to displacement, strain, and the field of temperature. The strain can be in two forms—linear and angular. The linear strain deformation can be expressed as [29]:
ε = lim L 0 ( Δ L | L )
while the angular strain displacement can be expressed as:
ε x x = u ¯ x ¯ ,   ε y y = v ¯ y ¯ ,   ε z z = w ¯ z ¯
ε xy = 1 2 ( u ¯ y ¯ + v ¯ x ¯ ) ,   ε y z = 1 2   ( v ¯ z ¯ + w ¯ y ¯ ) ,   ε x x = 1 2 ( u ¯ z ¯ + w ¯ x ¯ )
In this examination, the levels of thermal stress were determined as equivalent stress σv (additionally called von Mises stress). The plastic deformation causing stress can be measured by:
σ v = ( σ 11 σ 22 ) 2 + ( σ 22 σ 33 ) 2 + ( σ 33 σ 11 ) 2 + 6 ( σ 12 2 + σ 23 2 + σ 31 2 ) 2 2
As seen in Figure 10, the average power consumption is 772 W for three days of operation. Further, it was found that, due to the above-mentioned challenges, the temperature difference between inside and outside climatic conditions reduced to less than 3 °C due to back heat transfer and inefficiency of the heat sink attached to the fan to exhaust heat.
As shown in Figure 11, the performance of the TE-AC system with IoT integration was evaluated throughout the day. It was found that, during the peak hours, the power consumption touches the upper quartile, and during non-peak hours, power consumption was even lower than 300 W/h. The IoT sensors sensed the outdoor climatic conditions, and based on that, they regulated the operation of the TE-AC system. During the initial and final phase of operation, the outdoor temperature was lower, thus the IoT-based sensor cut operation of two columns of the TE-AC system; thus, only one column of eight TEMs was under operation. This automatically lowered the power consumption of the TE-AC system. This process also reduced the unnecessary cooling of the system, which was not possible in the previous system [21]. Similarly, during peak hour operation all the columns are attached in parallel and thus utilized the maximum cooling capacity of TEMs and hence reduces the maximum indoor temperature to make indoor climatic conditions compatible with the occupants. The cumulative power consumption of the system will be reduced, and this helps in making a more energy-efficient system.
As shown in Figure 12, the system power consumption was reduced significantly by implementing the IoT system, as it was more user-friendly and adjusted according to the indoor climatic condition requirement. The IoT-based TE-AC system not only saves 1687 kWh/year amount of energy but also increases the longevity of the system by reducing the chances of defect caused by high heat.

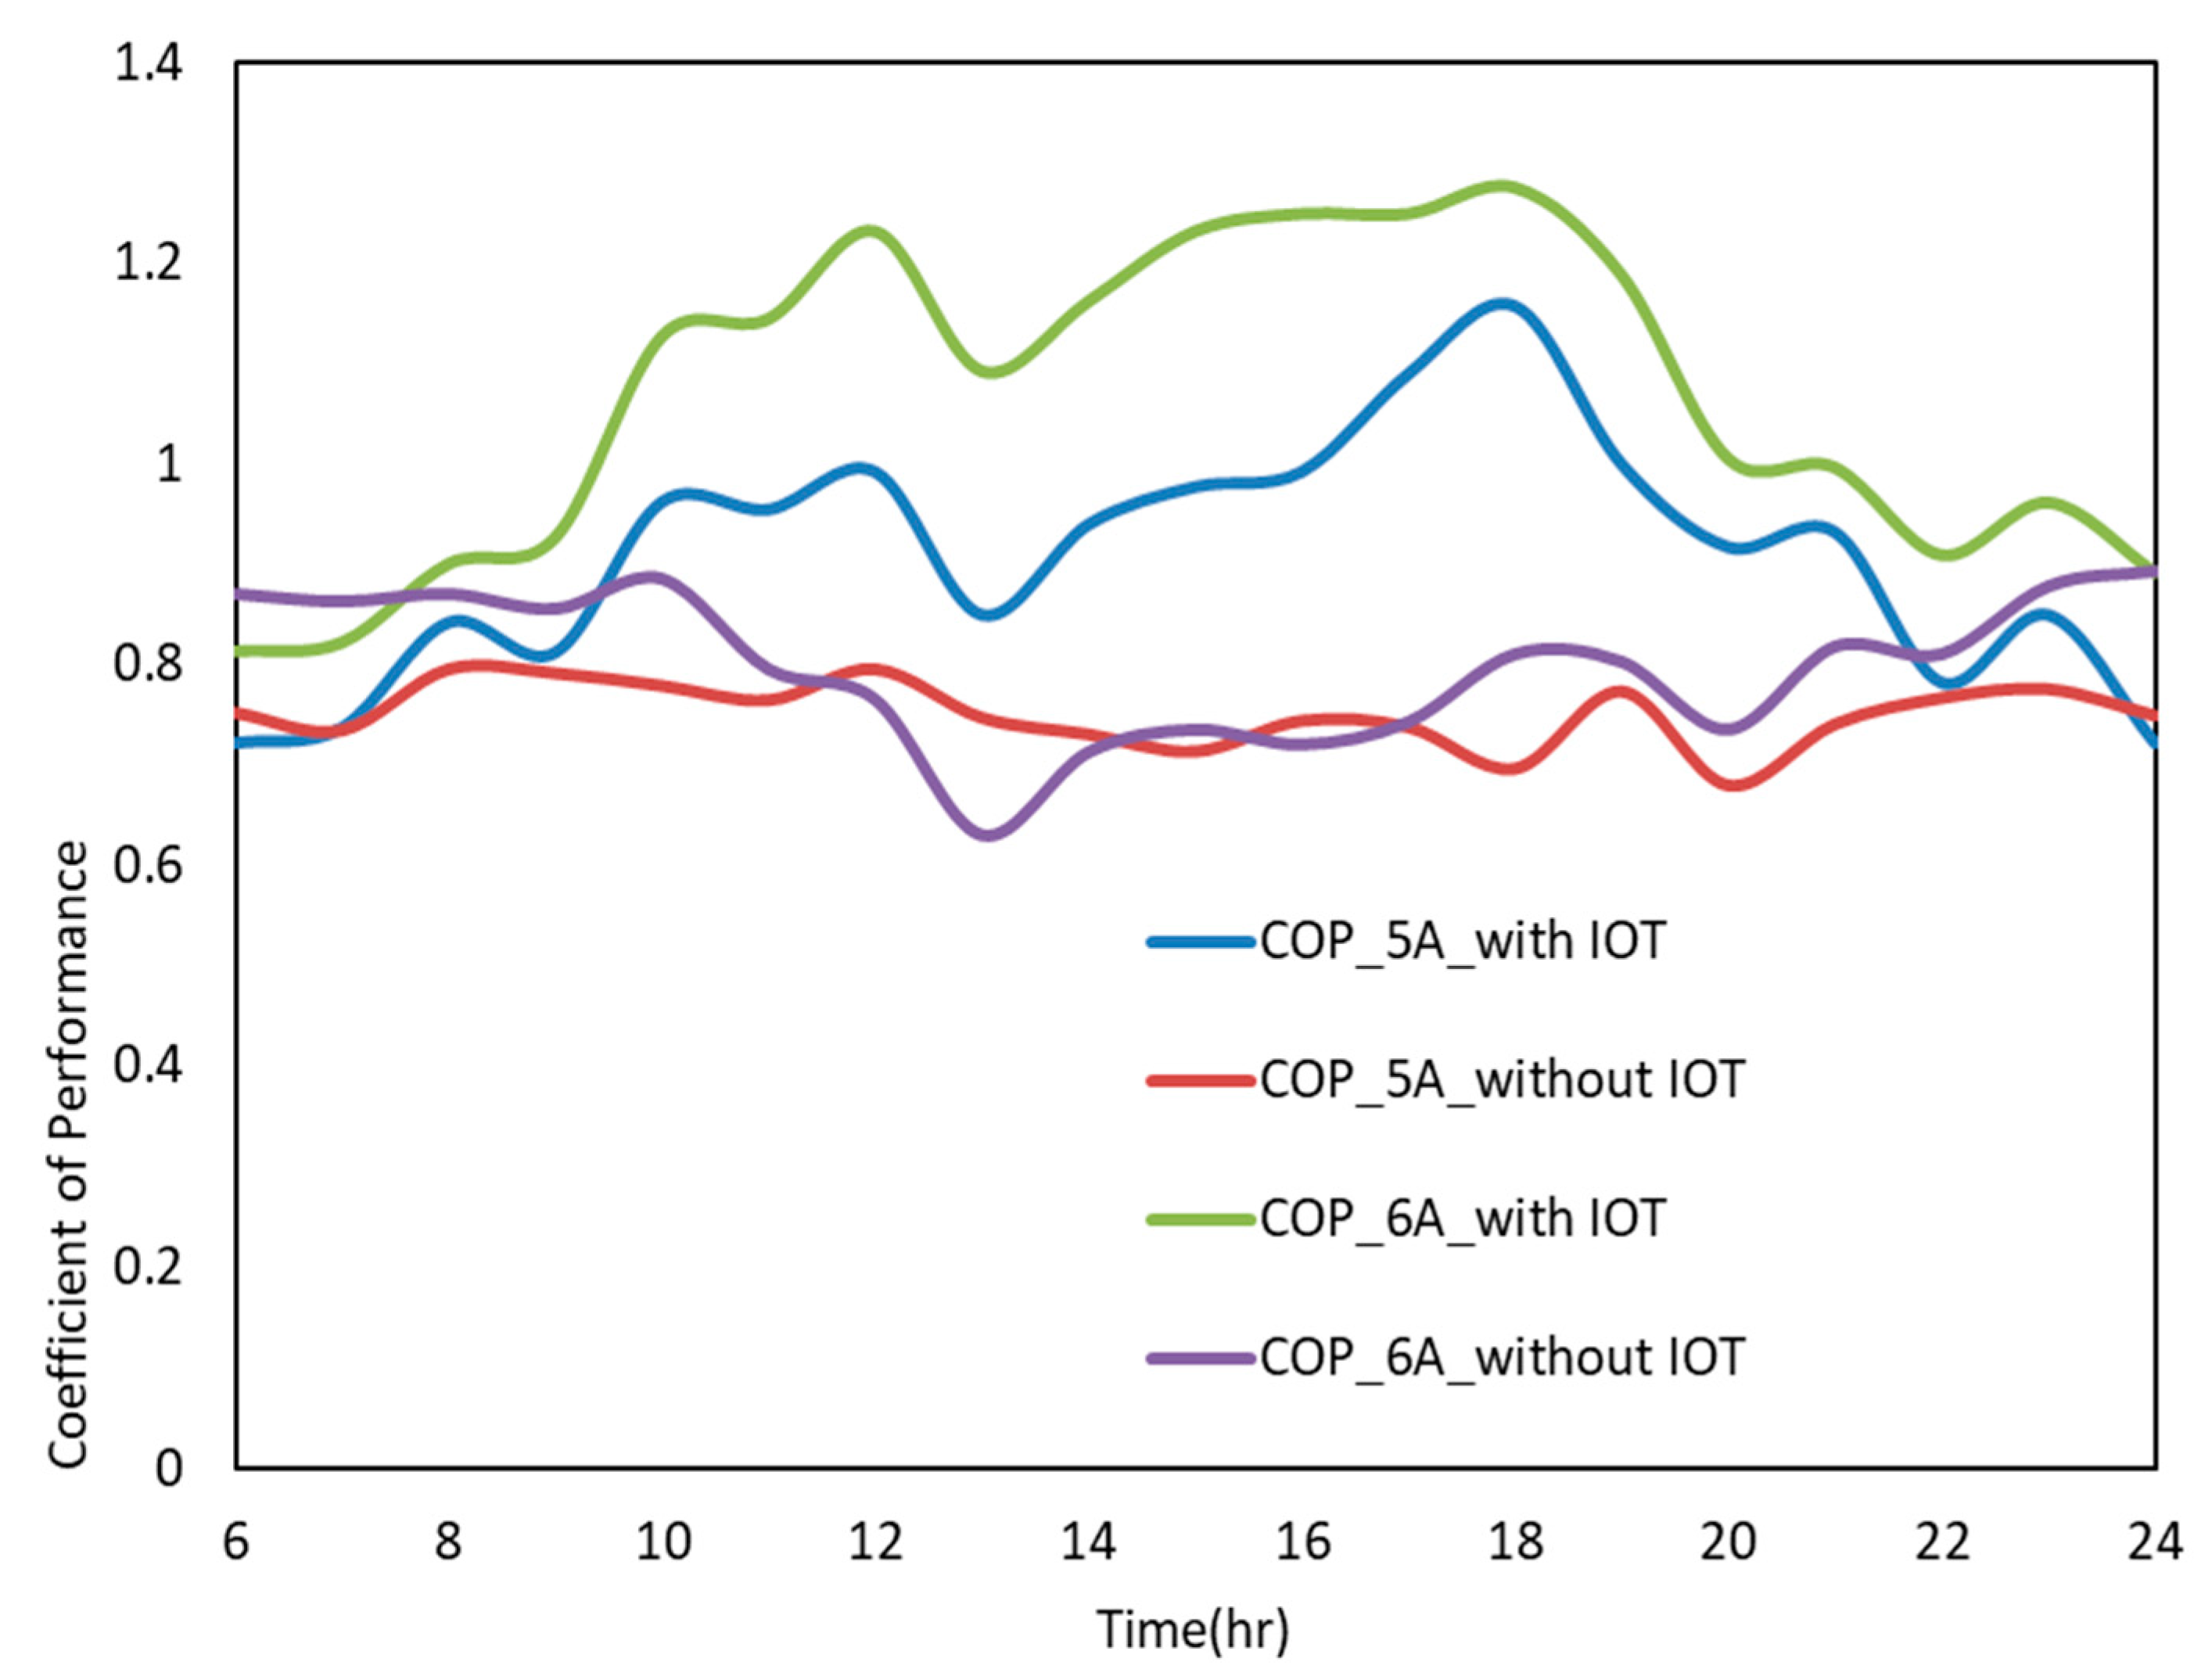
3.2. Effect on Cooling Capacity and Coefficient of Performance of the TE-AC System

In the TEC, the electrical flow streams from the N-type component to the P-type component. The temperature Tc of the cold intersection diminishes, and the heat is moved from the outside climate to the cool intersection at a lower temperature. This occurs due to the movement of electrons from a low energy stage in the P-type component to a high energy stage in the N-type component via the cold intersection. Simultaneously, the electrons take away the heat from the hot intersection, which is at temperature Th. This warmth is scattered in the heat sink, while the electrons return at a lower energy stage in the P-type (the Peltier effect). The nature of a thermoelectric cooler relies upon various parameters, including the electric flow connected at the coupling of N-type and P-type thermo-elements, the temperatures of the hot and cold sides, the electrical contact obstruction between the cold side and the device surface, thermo-element electrical and thermal conductivities, and the heat sink thermal resistance on the hot side of the TEC [30]. The quantity of thermo-elements in a TEM fundamentally relies upon the required cooling limit and maximum electric flow [31]. The q is the flow of heat along a thermo-element, and I, is electric flow, κ is thermal conductivity (W/(on), ρ is humidity ratio, α is Seebeck coefficient (V/K), A is the area in (m2) and T is the temperature, the equations can be formulated as [32]:
q = κ A d T d x ± α I T
I = A ρ ( d V d x ± α d T d x )
Along these lines, one side of the thermoelectric cooler is warmed while the contrary side is cooled. Four types of heat are used to defined cooling and heating capacity TEMs i.e., Peltier cooling (QPEC), Peltier heating (QPEH), Joule heat(QJH), and Fourier heat (QFH), which are defined as [31]:
Q P E C = α I T c o l d
Q P E H = α I T h o t
Q F H = κ ( T h o t T c o l d )
Q J H = I 2 R
where R is the module’s electrical resistance (Ω).
By using Equations (7)–(10), TEMs cooling and heating capacity was defined as [33]:
Q c o l d = S T E I T c o l d 0.5 I 2 R T E K T E Δ T
S T E = 2 N α
where STE is the module’s Seebeck voltage (V/K) and N is the total number of elements.
R T E = 2 N σ / G
where G is the total solar radiation on the vertical plane (W/m2).
K T E = 2 N κ G
where G′ is the geometric factor (area/length of the TE element) (cm).
Q h o t = S T E I T h o t + 0.5 I 2 R T E K T E Δ T
V i n = ( S T E × ( T h o t T c o l d ) ) + ( I × R T E )
Hot and cold side energy balance equations can be determined as [30]:
h T E A T E ( T a T c o l d ) = α I T c 0.5 I 2 R K ( T h o t T c o l d )
h T E A T E ( T h o t T a ) = α I T h + 0.5 I 2 R K ( T h o t T c o l d )
The input power to the TEM was given by [30]:
P T E = α I ( T h o t T c o l d ) + I 2 R T E
Ζ = S T E 2 R T E K T E
where Z is the figure of merit.
COP of the thermoelectric module in cooling mode is given by [34]:
C O P T E c o o l i n g = Q c o l d P T E
The COP of a system in cooling mode was given by:
C O P T E A C s y s t e m = Q c o l d ( P T E + W )
where W is the power consumption of the fan.
For TE-AC system, cooling capacity QTE-AC was evaluated by using the following equations:
Q T E A C = C p , a i r m ˙ ( T a T o u t )
C O P T E A C = Q T E A C n P T E
Thus, based on the above heat transfer equation, it was clear that the major factor that will affect the cooling capacity of the TEMs is the temperature difference between hot and cold sides of the module, apart from other factors. As seen in Figure 13, the cooling capacity of the TE-AC system improves by implementing the IoT-based smart thermal management system. The reason for this improvement is that the IoT assisted the TE-AC system sensed the indoor and outdoor temperatures and reacted accordingly, rather than the full system operating throughout the day, which was observed in previous experiments [21,27].
As mentioned in Equations (21)–(24), the COP of the system was based on both cooling capacity and power input. As seen in Figure 14, the COP of the system improved significantly by implementing the IoT-based thermal management system. It was observed that the maximum percentage increase in COP of the TE-AC system operated at 6 A and 5 V was 45.2%.

3.3. Mitigation of CO2 Emissions and Operational Cost

The building sector of Malaysia generally relies upon climate control systems to give comfort to the inhabitants, which expends a significant amout of non-renewable energy source assets. Total carbon emissions in Malaysia have quickly expanded by 221% from 1990 to 2004, and it is expected to ascend by as much as 328 million tons by 2020 [35]. The IoT-based TE-AC framework will end up as one of the most dependable and naturally inviting sustainable power source advancements, which assumes a noteworthy contribution in CO2 emanations alleviation. The numerical computation was completed to gauge the measure of CO2 discharge alleviated because of the TE-AC without the IoT framework, TE-AC with IoT framework, and ordinary cooling frameworks of 0.5-ton capacity as shown in Table 1. For a Malaysian thermal power plant, it was calculated that 1.21 kg/kWh of CO2 is released [36]. The absolute moderation of CO2 outflows from the current TE-AC framework and traditional cooling frameworks for a long time life can be determined by utilizing Equation (25) [37] as follows:
C O 2 ( k g | l i f e ) = 1.21 ( k g | k W h ) × E ( k W h | y e a r ) × n ( y e a r )  

4. Conclusions

This paper examined the improvement in the cooling performance of a TE-AC system upon the integration of an IoT-based smart thermal management system into the TE-AC system. The following conclusions are drawn from the findings:
The cooling power of the TE-AC system increases with an increase in input power from 600 W to 720 W. This was observed in both cases—the TE-AC with IoT system and the TE-AC without the IoT system. However, there was a significant reduction in power consumption in the case of the IoT-based TE-AC system as compared to the TE-AC system without IoT. Furthermore, the incorporation of IoT into TE-AC system ensures better microclimatic temperature control.
For the full-day performance of the TE-AC system, an average reduction in power consumption in the range of 189 W–242 W per day of TE-AC operation was achieved by implementing the IoT system.
The IoT based TE-AC system improves the coefficient of performance (COP) by 45% and cooling capacity by 13.2%.
Carbon dioxide emission reduction by the IoT-based smart TE-AC system has reached up to 56 tons, which were almost two times less as compared to the TE-AC system with an IoT system with an additional benefit of operational cost saving of $132 USD as compared to half-ton traditional air conditioning system.
For further analysis, it is recommended that, for data obtained from real IoT-based TE-AC experiments that involve non-linear variables, the artificial neural network (ANN) model will be preferred for forecasting the desired results. An ANN technique integrated with an IoT system will be simpler to implement and perform better on more complex temperature, relative humidity, and cooling data sets having a high degree of non-linearity. It is also suitable for real-time prediction applications in a test room equipped with the TE-AC system where new training samples can be added or removed without extensive retraining.

Author Contributions

K.I. designed and performed the experiments, derived the models, drafted the manuscript, and analyzed the data. Abdulmohsen Almalawi arranged of the funding and performed the review and numerical analysis. A.I.K. was involved in the planning, supervised the work, processed the experimental data, performed the analysis, and designed the figures. M.M.A. contributed to the design and implementation of the research, to the analysis of the results, and to the writing of the manuscript. M.H.Z. undertook subject arrangement and analysis, prototype development, and performed the experimental task. Amjad Ali contributed to the interpretation of the results and supervised the project. All authors have read and agreed to the published version of the manuscript.

Funding

This research was funded by the Deanship of Scientific Research (DSR), King Abdulaziz University, Jeddah, under Grant No. DF-262-611-1441.

Acknowledgments

This project was funded by the Deanship of Scientific Research (DSR), King Abdulaziz University, Jeddah, under Grant No. DF-262-611-1441. The authors, therefore, gratefully acknowledge DSR technical and financial support.

Conflicts of Interest

The authors declare no conflict of interest.

References

  1. Irshad, K.; Habib, K.; Saidur, R.; Kareem, M.W.; Saha, B.B. Study of thermoelectric and photovoltaic facade system for energy efficient building development: A review. J. Clean. Prod. 2019, 209, 1376–1395. [Google Scholar] [CrossRef]
  2. Bunjongjit, S.; Ngaopitakkul, A. Feasibility study and impact of daylight on illumination control for Energy-saving lighting systems. Sustainability 2018, 10, 4075. [Google Scholar] [CrossRef] [Green Version]
  3. Xu, X.; Li, C.Z.; Wang, J.; Huang, W. Collaboration between designers and contractors to improve building energy performance. J. Clean. Prod. 2019, 219, 20–32. [Google Scholar] [CrossRef]
  4. Kamal, A.; Al-Ghamdi, S.G.; Koç, M. Role of energy efficiency policies on energy consumption and CO2 emissions for building stock in Qatar. J. Clean. Prod. 2019, 235, 1409–1424. [Google Scholar] [CrossRef]
  5. Sáez, P.C.; Astorqui, J.S.C.; Merino, M.D.R.; Moyano, M.D.P.M.; Sánchez, A.R. Estimation of construction and demolition waste in building energy efficiency retrofitting works of the vertical envelope. J. Clean. Prod. 2018, 172, 2978–2985. [Google Scholar] [CrossRef]
  6. He, Y.; Liao, N.; Bi, J.; Guo, L. Investment decision-making optimization of energy efficiency retrofit measures in multiple buildings under financing budgetary restraint. J. Clean. Prod. 2019, 215, 1078–1094. [Google Scholar] [CrossRef]
  7. Piderit, M.B.; Agurto, S.; Marín-Restrepo, L. Reconciling energy and heritage: Retrofit of heritage buildings in contexts of energy vulnerability. Sustainability 2019, 11, 823. [Google Scholar] [CrossRef] [Green Version]
  8. Baheta, A.T.; Looi, K.K.; Oumer, A.N.; Habib, K. Thermoelectric air-conditioning system: Building applications and enhancement techniques. Int. J. Air Cond. Refrig. 2019, 27, 1930002. [Google Scholar] [CrossRef] [Green Version]
  9. Davidsson, P.; Eklund, U.; Olsson, C.M. Elis: An open platform for mobile energy efficiency services in buildings. Sustainability 2019, 11, 858. [Google Scholar] [CrossRef] [Green Version]
  10. Lilis, G.; Conus, G.; Asadi, N.; Kayal, M. Towards the next generation of intelligent building: An assessment study of current automation and future IoT based systems with a proposal for transitional design. Sustain. Cities Soc. 2017, 28, 473–481. [Google Scholar] [CrossRef]
  11. Iqbal, J.; Khan, M.; Talha, M.; Farman, H.; Jan, B.; Muhammad, A.; Khattak, H.A. A generic internet of things architecture for controlling electrical energy consumption in smart homes. Sustain. Cities Soc. 2018, 43, 443–450. [Google Scholar] [CrossRef]
  12. Bastani, M.; Thanos, A.E.; Damgacioglu, H.; Celik, N.; Chen, C.H. An evolutionary simulation optimization framework for interruptible load management in the smart grid. Sustain. Cities Soc. 2018, 41, 802–809. [Google Scholar] [CrossRef]
  13. Murugesan, L.K.; Hoda, R.; Salcic, Z. Design criteria for visualization of energy consumption: A systematic literature review. Sustain. Cities Soc. 2015, 18, 1–12. [Google Scholar] [CrossRef]
  14. Irshad, K.; Habib, K.; Kareem, M.W.; Basrawi, F.; Saha, B.B. Evaluation of thermal comfort in a test room equipped with a photovoltaic assisted thermo-electric air duct cooling system. Int. J. Hydrog. Energy 2017, 42, 26956–26972. [Google Scholar] [CrossRef] [Green Version]
  15. Irshad, K.; Habib, K.; Basrawi, F.; Thirumalaiswamy, N.; Saidur, R.; Saha, B.B. Thermal comfort study of a building equipped with thermoelectric air duct system for tropical climate. Appl. Therm. Eng. 2015, 91, 1141–1155. [Google Scholar] [CrossRef]
  16. Gillott, M.; Jiang, L.; Riffat, S. An investigation of thermoelectric cooling devices for small-scale space conditioning applications in buildings. Int. J. Energy Res. 2010, 34, 776–786. [Google Scholar] [CrossRef]
  17. Seo, Y.M.; Ha, M.Y.; Park, S.H.; Lee, G.H.; Kim, Y.S.; Park, Y.G. A numerical study on the performance of the thermoelectric module with different heat sink shapes. Appl. Therm. Eng. 2018, 128, 1082–1094. [Google Scholar] [CrossRef]
  18. Sun, X.; Ling, L.; Liao, S.; Chu, Y.; Fan, S.; Mo, Y. A thermoelectric cooler coupled with a gravity-assisted heat pipe: An analysis from heat pipe perspective. Energy Convers. Manag. 2018, 155, 230–242. [Google Scholar] [CrossRef]
  19. Dizaji, S.H.; Jafarmadar, S.; Khalilarya, S.; Moosavi, A. An exhaustive experimental study of a novel air-water based thermoelectric cooling unit. Appl. Energy 2016, 181, 357–366. [Google Scholar] [CrossRef]
  20. Attar, A.; Lee, H.S. Designing and testing the optimum design of automotive air-to-air thermoelectric air conditioner (TEAC) system. Energy Convers. Manag. 2016, 112, 328–336. [Google Scholar] [CrossRef]
  21. Irshad, K.; Habib, K.; Thirumalaiswamy, N.; Saha, B.B. Performance analysis of a thermoelectric air duct system for energy-efficient buildings. Energy 2015, 91, 1009–1017. [Google Scholar] [CrossRef]
  22. Manikandan, S.; Kaushik, S.C. Energy and exergy analysis of an annular thermoelectric cooler. Energy Convers. Manag. 2015, 106, 804–814. [Google Scholar] [CrossRef]
  23. Yilmazoglu, M.Z. Experimental and numerical investigation of a prototype thermoelectric heating and cooling unit. Energy Build. 2016, 113, 51–60. [Google Scholar] [CrossRef]
  24. Naphon, P.; Wiriyasart, S.; Hommalee, C. Experimental and numerical study on thermoelectric liquid cooling module performance with different heat sink configurations. Heat Mass Transf. Stoffuebertragung 2019, 55, 2445–2454. [Google Scholar] [CrossRef]
  25. Luo, Y.; Zhang, L.; Liu, Z.; Wang, Y.; Wu, J.; Wang, X. Dynamic heat transfer modeling and parametric study of thermoelectric radiant cooling and heating panel system. Energy Convers. Manag. 2016, 124, 504–516. [Google Scholar] [CrossRef]
  26. Dizaji, H.S.; Jafarmadar, S.; Khalilarya, S. Novel experiments on COP improvement of thermoelectric air coolers. Energy Convers. Manag. 2019, 187, 328–338. [Google Scholar] [CrossRef]
  27. Irshad, K.; Habib, K.; Basrawi, F.; Saha, B.B. Study of a thermoelectric air duct system assisted by photovoltaic wall for space cooling in tropical climate. Energy 2017, 119, 504–522. [Google Scholar] [CrossRef]
  28. ASHRAE. Handbook—HVAC Applications; American Society of Heating, Refrigerating and Air-Conditioning Engineers, Inc.: Atlanta, GA, USA, 2007. [Google Scholar]
  29. Gong, T.; Wu, Y.; Gao, L.; Zhang, L.; Li, J.; Ming, T. Thermo-mechanical analysis on a compact thermoelectric cooler. Energy 2019, 272, 1211–1224. [Google Scholar] [CrossRef]
  30. Goldsmid, H.J. Introduction to Thermoelectricity; Springer Nature: Sydney, Australia, 2010. [Google Scholar]
  31. Enescu, D.; Virjoghe, E.O. A review on thermoelectric cooling parameters and performance. Renew. Sustain. Energy Rev. 2014, 38, 903–916. [Google Scholar] [CrossRef]
  32. Snyder, G.J.; Toberer, E.S. Complex Thermoelectric Materials. In Materials for Sustainable Energy; Nature Publishing Group: Basingstoke, UK, 2010; pp. 101–110. [Google Scholar]
  33. He, W.; Zhou, J.; Hou, J.; Chen, C.; Ji, J. Theoretical and experimental investigation on a thermoelectric cooling and heating system driven by solar. Appl. Energy 2013, 107, 89–97. [Google Scholar] [CrossRef]
  34. Tan, G.; Zhao, D. Study of a thermoelectric space cooling system integrated with phase change material. Appl. Therm. Eng. 2015, 86, 187–198. [Google Scholar] [CrossRef]
  35. Shamsuddin, A.H. Development of renewable energy in malaysia-strategic initiatives for carbon reduction in the power generation sector. Procedia Eng. 2012, 49, 384–391. [Google Scholar] [CrossRef] [Green Version]
  36. Shafie, S.M.; Masjuki, H.H.; Mahlia, T.M.I. Life cycle assessment of rice straw-based power generation in Malaysia. Energy 2014, 70, 401–410. [Google Scholar] [CrossRef]
  37. Saidur, R. Energy consumption, energy savings, and emission analysis in Malaysian office buildings. Energy Policy 2009, 37, 4104–4113. [Google Scholar] [CrossRef]
Figure 1. Configuration of the test chamber.
Sustainability 12 01564 g001
Figure 2. Test room equipped with a thermoelectric air conditioning (TE-AC) system.
Sustainability 12 01564 g002
Figure 3. Cut view configuration of the TE-AC system.
Sustainability 12 01564 g003
Figure 4. Internet of Things (IoT)-based temperature control system circuit diagram.
Sustainability 12 01564 g004
Figure 5. Flow chart of the IoT-based temperature control system.
Sustainability 12 01564 g005
Figure 6. Software component model for the IoT-based temperature control system.
Sustainability 12 01564 g006
Figure 7. Advanced thermoelectric air management framework: integrating IoT and cloud computing.
Sustainability 12 01564 g007
Figure 8. Variation of power consumption and indoor temperature when the TE-AC system operated at 5 A without the IoT system.
Sustainability 12 01564 g008
Figure 9. Variation of power consumption and indoor temperature when the TE-AC system operated at 5 A with an IoT system.
Sustainability 12 01564 g009
Figure 10. Variation of power consumption and indoor temperature when the TE-AC system operated at 6 A without the IoT system.
Sustainability 12 01564 g010
Figure 11. Variation of power consumption and indoor temperature when the TE-AC system operated at 6 A with an IoT system.
Sustainability 12 01564 g011
Figure 12. Power consumption with and without IoT based TE-AC system for two input power operation.
Sustainability 12 01564 g012
Figure 13. Variation of the cooling load when the TE-AC system operated at 5 and 6 A with and without the IoT system.
Sustainability 12 01564 g013
Figure 14. Variation of COP when the TE-AC system operated at 5 and 6 A with and without the IoT system.
Sustainability 12 01564 g014
Table 1. Comparative analysis of the different types of AC systems.
ParametersAC Type
AC (Split-0.5 tons)TE-AC without IoT SystemTE-AC with IoT System
Energy consumption (kWh/year)25001523802
Energy saving (kWh/year)010341687
Cost of operation (US$/year)1869144
Saving of operation cost (US$/year)089132
Carbon dioxide reduction (ton/life)03256

