Abstract
Due to the wide range of waterway engineering strategies, the government often has the view that investment in hardware (such as construction, equipment renewal, etc.) is more important than that in software (such as information systems, service concepts, etc.) in the investment decision-making of waterway engineering. Besides, some government departments lack a consideration of coordinated development among different industries, resulting in the waterway industry lagging behind other industries (such as expressways, high-speed railway, etc.). To facilitate a more balanced infrastructure investment, we create a novel index, the Hub Economic Index (HEI), by incorporating the theory of the hub economy into the investment decision-making of waterway engineering. HEI consists of two major criteria, tangible and intangible assets, further divided into 10 indices. In particular, investment allocation between tangible and intangible assets is evaluated for the four major reaches of the North Jiangsu Canal. Multiple years of HEI values for the water transport industry are calculated for trend analysis and comparison with other industries. The results show that (1) through the comparison between the calculated values of the HEI investment model and the actual investment, the deviation of the tangible investment is 2.8% lower, and that of the intangible hub investment is 7.2% higher, which is basically in line with the actual situation. At the same time, it promotes the development of software; and (2) through the variation trends in HEI for various industries from 2008 to 2018, the HEI values of the different industries in the transportation system show a trend of steady growth. This is basically consistent with China’s economic development trend, but also reflects the development gap between the different industries. The research results are of great significance to help the government to make investment decisions in different fields and industries. The investment based on HEI values will further promote the integrated development of the water transport industry and other industries.
1. Introduction
As a traditional method of project evaluation and economic analysis, cost–benefit analysis (CBA) has been applied in many countries. CBA can be used in many fields as a decision-making basis to judge the feasibility of the project [1,2,3]. CBA is more important to measure and evaluate the cost and benefit of investment projects. Because some public investment (such as transportation infrastructure) has certain comprehensive benefits (including social benefits), its benefits are difficult to evaluate. Therefore, the investment decision-making of transportation infrastructure should not only be considered from the cost–benefit analysis (CBA), but also from multiple sustainable perspectives [4]. Some scholars have carried out research on different aspects of investment decision-making of transportation infrastructure projects. In view of the optimization of resource allocation in traffic engineering investment planning, a quantitative model is constructed from the two dimensions of industry risk concentration and regional difference, and a regional agglomeration viewpoint with a good environment is put forward [5]. The analytic hierarchy process (AHP) method is adopted to calculate the benefit of an expressway investment project and sort the project investment according to the calculation results [6]. Data envelopment analysis is used to analyze the effectiveness of the Jiangsu inland waterway investment. The analysis results are helpful for waterway management organizations to adjust the level of a regional waterway investment [7]. In view of the regional differences in the development of highway transportation in different regions of China, it is proposed to improve the regional equalization level of highway development, narrow the economic development gap and promote a regionally balanced development. The strategic model of traffic regional differentiation is established [8,9]. In order to make an effective decision on the regional traffic investment structure, considering the regional and interregional economic growth induced by the traffic infrastructure, an optimization model of the regional traffic infrastructure investment structure is established by defining the maximum economic benefit of the regional investment. The model can effectively analyze the impact of the regional traffic investment structure on the economic efficiency and distribution pattern [10]. There are also some scholars from the impact of transport investment path, planning, regulatory effectiveness and other aspects of research [11,12,13,14,15]. The above-mentioned decision-making method solves the priority problem of investment decision-making, but in view of the unbalanced development, only macro investment suggestions are put forward, rarely realizing the quantification of investment decision-making. At the same time, in order to effectively analyze the investment decision-making of transportation engineering, it is necessary to classify the traffic infrastructure. Tangible and intangible assets [16] can be viewed as an important classification for transportation infrastructure, where tangible means visible, real engineering projects, and intangible means non-financial assets, more about the intellectual sides. They are both important for long-term financial performance while the latter is often ignored or underestimated [17]. Further complicated by the multiple projects (regions), it is the high-order decision-making problems that need a huge amount of information and professional judgement. It is a challenge to achieve the balance between transportation and environment, transportation types and project prioritization.
It is key to find a suitable index for sustainable investment and development of transportation infrastructure. However, the establishment of the index system is often a case-specific process, requiring scrutiny of problem and considering many factors. In the construction of terminal investment decision-making indices, the principles of systematization (reflecting the overall investment environment) and operability (providing reference for decision-making) are considered [18]. The principle of combining quantitative and qualitative indexes is considered in the selection of performance evaluation indexes of green highway project management [19]. Many countries gradually apply sustainable development indices to project investment. The sustainability index of integrating road traffic externalities is established [20]. From the perspective of promoting the overall development of the economy, society and ecology, as well as improving the quality-of-life of residents, the definition and connotation of sustainable development of urban transportation are explained, and the life quality index and fairness index based on people are put forward [21]. At present, the common quantitative research methods of selecting indices include the Delphi method, fuzzy mathematics method and analytic hierarchy process [22,23,24], among which analytic hierarchy process is the most widely used, because the AHP decomposes complex problems into various components, which are grouped according to the dominant relationship to form an orderly hierarchical structure, each of which quantifies the impact results. The calculation result is simple and clear, which is easy to provide a reference for decision makers [25]. However, there are some shortcomings in AHP, such as the consistency of the judgment matrix that is not easy to master, and there are some differences between the consistency of the judgment matrix and the consistency of decision-making thinking. In order to optimize the consistency of judgment, many scholars began to introduce the fuzzy method into the analytic hierarchy process, and solved many practical sustainable development problems [26,27,28]. This paper attempts to apply the fuzzy analytic hierarchy process to the investment decision-making of waterway engineering. Due to the multi-criteria and multi-level characteristics of the actual project, it is proposed to optimize the method according to the characteristics of indices, hoping to further promote the sustainable development of waterway engineering.
With the deepening of research, some scholars began to study new indices, such as the human water harmony index (HWHI); this method is a more comprehensive method based on the concept of harmony, and also a method of sustainable development. HWHI employs 27 indices from three dimensions (development, coordination and satisfaction) and was applied to five important cities in China—Beijing, Shanghai, Guangzhou, Xi’an and Nanjing [29]. The above research studies the indices of sustainable development from different aspects, especially the establishment of a new index that could provide new ideas for decision-making investment. With the continuous development of the city, the form of transportation has changed from single to diversified, and gradually integrates with other industries (logistics, Internet, etc.) to form a hub economy based on a variety of transportation.
The hub economy is a new economic model developed on the basis of transportation, logistics and information hubs. It mainly relies on various factors gathering carriers and platforms, such as transportation hubs, logistics hubs and information hubs. According to the law of value, with the help of modern information technology such as network and big data, the hub economy can induce talent, labor force, information, technology, capital and other production factors to gather in the hub region. At the same time, the region can become a center of economic value creation. A hub economy generally has three stages of development: One is a transportation hub economy based on transportation infrastructure; the other is an economic hub characterized by factor agglomeration; and the third involves the integration of transportation and the social economy [30]. The hub economy coincides with the concept of sustainable development. The implementation of the three development stages is conducive to the integrated development of transportation and social economy. The efficiency of the public transportation hub characteristics has been studied [31]. A reliable model of the multimodal transportation hub location problem was established [32]. Through market-oriented operation and the introduction of diversified social investment research, improvement of the social and economic benefits of a comprehensive transportation hub was realized [33]. A comprehensive evaluation index for the transfer efficiency of the urban transportation hub was established [34]. One of the important factors in the design of a comprehensive transportation hub is passenger orientation [35]. The cooperation effect between high-speed rail and airlines under the capacity constraint of a hub airport is studied [36]. The concept of the urban hub economy and four aspects of promoting the urban hub economy have been described [37]. The path of hub economy development has been proposed [38]. China’s regional hub economic development was studied in three aspects, namely basic conditions, core contents and support [39]. The above research describes the development process and conditions of the hub economy and has made some achievements. Because the hub economy is a new type of economic model, the research on hub economy is still in its infancy. Scholars put forward the idea of constructing and investing the transportation support system (including water transportation) of a freedom hub to develop the hub economy [40]. However, most of the above studies are based on the macro level hub economy theory. At present, there is a gap on quantitative aspects on the hub economic index.
In this paper, waterway engineering is taken as the research object and a clear and quantitative Hub Economic Index is established. The Hub Economic Index (HEI) employs 10 indices from two dimensions (tangible index and intangible index). Taking the North Jiangsu Canal, part of the South to North Water Diversion Project in China as an example, the effectiveness of the scheme is evaluated. The contribution of this paper is to propose an investment method for sustainable development of waterway engineering based on the quantitative index of a hub economy. The results show that the proposed model provides quantitative decision indices for investors of waterway engineering, which is conducive to promoting the development of a hub economy and realizing the comprehensive development of the transportation industry.
2. Methods
2.1. Sustainable Development Investment Function
According to the definition of sustainable development [41], in the process of investment decision-making of water transport engineering, we should take social, economic and ecological factors into account from the perspective of sustainable development and get the function of the sustainable development investment. Therefore, the sustainable development investment function is computed as shown in Equation (1).
where T is the time, e.g., year; V(T) is the sustainable development investment value at T; Vi(T) represents the investment amount of part i at T; Si(T) is the social index of part i at T; e1i(T) is the economic index of part i at T; and e2i(T) is ecological index of part i at T.
2.2. Sustainable Development Investment Function Based on Hub Economy
As the project investment involves a wide range of factors, this paper introduces the hub economic indices into the sustainable development investment function, which can not only reflect the comprehensive benefits of each project, but also provide important decision-making reference for government departments. In order to facilitate the calculation of the hub economy value, we divide the investment based on hub economy into the tangible hub investment H1(T) and the intangible hub investment H2(T).
Definition 1:
H1(T) is the tangible hub index value at T. The main investment objects are hardware (such as construction, equipment renewal, etc.).
Definition 2:
H2(T) is the intangible hub index value at T. The main investment objects are software (such as information systems, service concepts, etc.)
Therefore, the sustainable development investment function based on hub economy is computed as shown in Equation (2).
where HEIi(T) is the hub economic index value of part i at T.
Hub economic index values are a combination of tangibles and intangibles. Therefore, HEI(T) is computed as shown in Equation (3).
Constraint conditions: , where is the weight of value of H1(T) and is the weight of value of H2(T). Determined by AHP method:
where H1(T)Ri is the value of H1(T) in the Ri region; WH1(T) represents the weight value of H1(T); WRi represents the weight value of Ri region; H2(T)Ri is the value of H2(T) in the Ri region; WH2(T) represents the weight value of H1(T); and WRi represents the weight value of Ri region.
The investment proportion formula of the different jurisdictions is as shown in Equations (6) and (7).
where and represent the proportion of investment in the tangible and intangible hubs, respectively.
2.3. Investment Decision-Making Process of Waterway Engineering Based on HEI
The traditional investment decision-making process is mainly about fund implementation, fund allocation model and fund allocation. In this paper, HEI is introduced into the process of investment decision-making, combined with the current situation of capital allocation, and HEI is introduced into the process of capital allocation model to meet the needs of sustainable development of the project. The investment decision-making process in waterway engineering was discussed by experts, and includes three aspects: First, an investment plan for waterway engineering is needed, and the capital has to be raised; second, an HEI calculation model of waterway engineering is established, and the HEI values of the whole and each subitem are calculated according to the model; finally, the calculated HEI values are compared with the hub economy grade table to get an investment plan for each subproject. Figure 1 shows the workflow of the waterway engineering investment process used in this study.
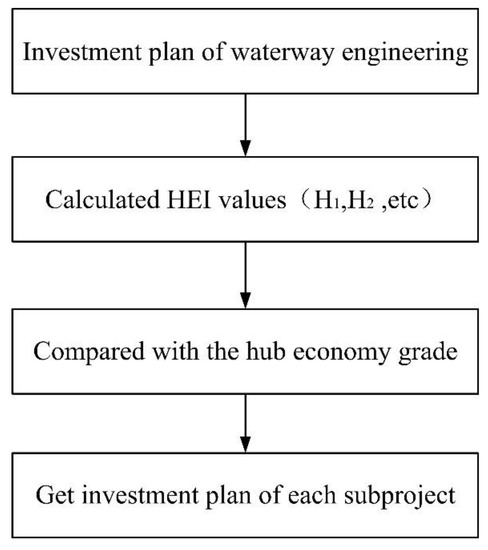
Figure 1.
Overview of the waterway engineering investment process based on the Hub Economic Index (HEI).
2.4. Hub Economic Index System
Because the hub economy involves different regions or industries, its investment scope is also different. To facilitate investment decisions in different regions or industries. According to the different hub economic scope, after extensive discussion by experts, the hub economic indices are divided into cross-regional hub economic indices, regional and below hub economic indices and industrial hub economic indices. The relationship is as shown in Figure 2. Hub indices are mainly divided into two levels, the first being cross-regional hub economic indices, and the second level being regional and below hub economic indices and industrial hub economic indices.
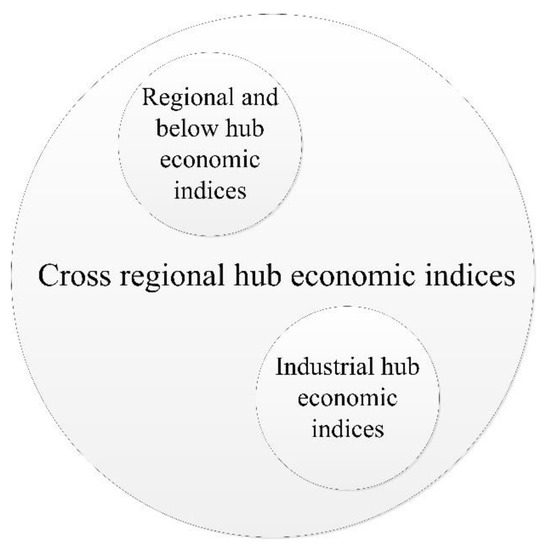
Figure 2.
Relationship between hub economic indices of different levels based on the hub concept [42].
This paper takes the hub economic indices of the transportation industry as an example; its framework is as shown in Figure 3.
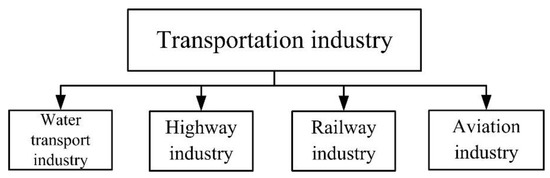
Figure 3.
Framework of the transportation industry’s hub economic indices.
As can be seen from Figure 3, the transportation industry is composed of the water transportation industry, the highway industry, the railway industry and the aviation industry. This paper mainly studies the investment decision-making of the water transportation industry. As the water transportation industry has entered the information age, intelligent transportation systems have played an increasingly important role. Considering the experience of the current project investment, after extensive discussion by experts and engineers, the HEI system is classified into tangible hub indices (H1) and intangible hub indices (H2). At the same time, the social, economic, ecological and other contents of sustainable development are included in HEI quantification indices. In this paper, the selection of indices mainly considers the principles of systematization, a combination of qualitative and quantitative, and operability. The Delphi method and frequency analysis method [43] were used to screen the indices. The specific steps of selecting indices were as follows: (1) Statistics of the indices in domestic and international academic research reports, journals and other materials were carried out by using the frequency analysis method, and the indices with a higher frequency were selected according to certain mathematical statistical methods, and these indices are summarized in order; (2) according to the characteristics of waterway engineering, opinions of domain experts were sought and indices were supplemented and improved; and (3) after the final confirmation by experts, the final index set after screening was obtained. Figure 4 shows the waterway engineering index system screening process.
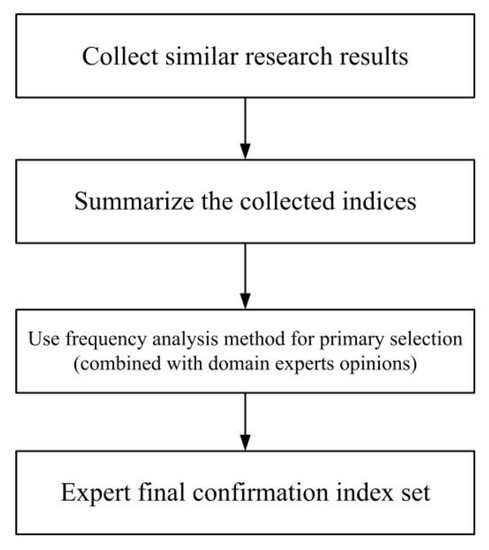
Figure 4.
Overview of the waterway engineering index system screening process.
According to the above index system screening process. A preliminary selection of quantitative indices for waterway engineering is as shown in Table 1.

Table 1.
The HEI quantification indices in waterway engineering.
The preliminary screening results of the waterway engineering index system were screened twice by expert review, and the indices with a high correlation were eliminated (channel level compliance and digital channel coverage), and finally the index set (final results) of the waterway engineering index system was formed.
2.5. Quantitative Method of HEI
2.5.1. AHP Method to Determine Index Weight
An analytic hierarchy process (AHP) [25] is a practical and effective method to deal with multi-objective, multi criteria, multifactor and multilevel complex problems. It is a system analysis method combining qualitative and quantitative analysis. Its basic principle is to decompose the complex problems to be identified into several levels. The experts and decision-makers graded the listed indices layer-by-layer by comparing the importance of the two, and determined the contribution of the lower-level indices to the upper-level indices by calculating the feature vector of the judgment matrix, so as to determine the importance of the basic-level indices to the overall objectives. The index weight was determined by the AHP method.
2.5.2. Comprehensive Optimization Method Based on Fuzzy Consistent Matrix and AHP
More and more fuzzy mathematics methods [26,27,28] are used in project investment decision-making. For multi-objective and multilevel fuzzy comprehensive optimization, firstly, the scheme set V and the index set H and U need to be determined; secondly, a fuzzy consistent matrix is constructed to calculate the scheme optimization value under a single index; finally, according to the weight of each sub-index, the overall scheme is optimized.
(1) Determine scheme set V and index set H and U.
Let decision domain V be a set of schemes (regions) to form a set of optimal schemes.
The indices that have an impact on HEI values of each region are as follows:
The first-grade index set is When the first-grade indices is the corresponding second-grade index set is
(2) Construction of a fuzzy consistent matrix and the calculation of a scheme optimization value under a single index.
As m schemes are optimized under n indices, n single index fuzzy priority relation matrices can be established; , where is the priority relation coefficient of Vi to Vj under the Uk index.
Constraint conditions:
Building fuzzy consistent matrix :
where
The method to calculate the optimal value of scheme Vi under UK index is the root method.
(3) Optimization of overall scheme.
Use the AHP method to get the second-grade index weight and meet the requirements of . The comprehensive superior degree values of each scheme were computed as shown in Equation (14):
Use the AHP method to get the first-grade index weight and meet the requirements of . The overall optimal value of the upper level was computed as shown in Equation (15):
2.6. Level Classification of HEI
In a comprehensive consideration of regional and interindustry development levels, the HEI values were divided into five levels according to expert opinions. These were, respectively, the excellent level (), the good level (), the fair level (), the bad level () and the poor level (). Similar to the short plate theory, when the HEI value is lower than 0.6, the investment should be inclined to provide comprehensive benefits.
3. Case Study
3.1. Research Area
The Beijing‒Hangzhou Canal starts in Beijing in the north, passes through Tianjin, Hebei, Shandong and Jiangsu, and ends in Hangzhou, Zhejiang Province, in the south. It runs through five major water systems, namely the Haihe River, Yellow River, Huaihe River, Yangtze River and Qiantang River, with a total length of nearly 1800 km.
The North Jiangsu Canal is located in the middle of the Beijing‒Hangzhou Canal, starting from Linjiaba in Xuzhou City in the north and ending at Liuweikou in Yangzhou City in the south, with a total length of 404 km and a total water level drop of 31 m. It is a comprehensive channel with the highest level (Level 2 channel) in the accessible reach of the Beijing‒Hangzhou Canal and with the most benefits. It can be used for the navigation of 2000-ton ships. In recent years, the average annual cargo was more than 300 million tons, and good economic benefits have been achieved through water transportation. The location is shown in Figure 5.
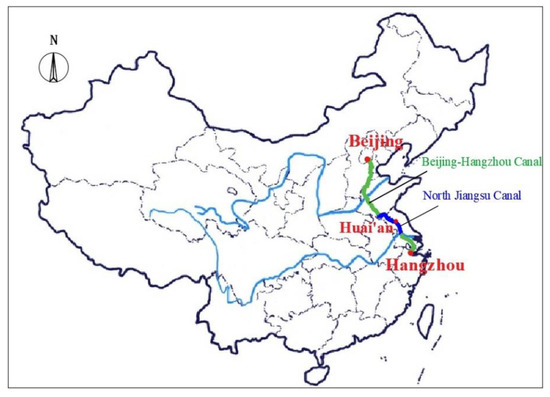
Figure 5.
The North Jiangsu Canal location map.
3.2. Quantification Indices
Since the comprehensive regulation of the North Jiangsu Canal began in 2008, this paper takes 2008 as the initial year of research. According to the HEI quantification indices in waterway engineering (Table 1), combined with the actual situation of the North Jiangsu Canal, hub economy quantification indices for waterway engineering in the North Jiangsu Canal are constructed; the specific indices are as shown in Table 2.
Table 2.
The hub economy quantification indices of waterway engineering in the North Jiangsu Canal.
Taking the R1, R2, R3 and R4 waterways in the North Jiangsu Canal area as examples, an investment decision-making analysis of waterway engineering is carried out. The North Jiangsu Canal system map can be seen in Figure 6.
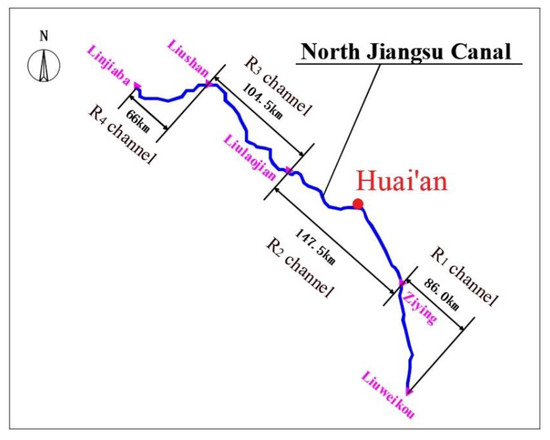
Figure 6.
The North Jiangsu Canal system map.
R1 channel: 86-km channel from Ziyingzha of Gaoyou City to Liuweikou of the Yangtze River. R2 channel: 147.5-km channel from Liulaojian lock to Ziyingzha of Gaoyou City. R3 channel: 104.5-km channel from Liushan lock to Liulaojian lock. R4 channel: 66-km channel from Linjiaba lock to Liushan lock.
The HEI values of the North Jiangsu Canal waterway engineering are as shown in Table 3.
Table 3.
The hub economy quantification indices values of waterway engineering for the North Jiangsu Canal in 2008.
3.3. Weight Values Calculation
3.3.1. Calculate the Optimal Value of Each Jurisdiction under the H1 Index
(1) Calculate the optimal value under each sub-index of H1.
For sub-index U11, “Damaged length of channel revetment,” the priority matrix is established according to Equation (9):
According to Equation (10), the fuzzy consistent matrix is transformed:
According to Equation (13), the optimal value of each scheme under the first sub-index U11 is calculated:
Similarly, the optimal value of each scheme under A2–A5 is calculated.
(2) Calculate the weight values under each sub-index.
Under the H1 index of tangible hub, the judgment matrix of U11–U15 is as follows:
The maximum eigenvalue of judgment matrix B1 is and the corresponding eigenvector is .
Check consistency:
CI = 0.000175.
CR = CI/RI = 0.000175/1.12 = 0.000175 < 0.1.
Therefore, the judgment matrix has good consistency.
The weight vector of each sub-index after normalization is .
(3) Calculate the optimal values of each jurisdiction under the H1 index.
3.3.2. Calculate the Optimal Values of Each Jurisdiction under the H2 Index
The method is the same as above. The optimal values of each jurisdiction under the H2 index are as follows:
3.4. HEI Values Calculation
According to the weight values of H1 and H2 determined by the AHP method, the weight values WH1(T) and WH2(T) of H1 and H2 are 0.7 and 0.3, respectively. The corresponding tangible hub degree and intangible hub degree values of each jurisdiction were calculated. The HEI level of four jurisdictions of the North Jiangsu Canal were determined according to the level classification of HEI. The specific hub economy results of each jurisdiction are as shown in Table 4.
Table 4.
Calculation of the hub economic degree values for different jurisdiction in 2008.
4. Results
4.1. Calculation Results of the Overall HEI Values for the North Jiangsu Canal
The final weight values are WR1, WR2, WR3 and WR4, respectively. The weight values are 0.19, 0.30, 0.26 and 0.25 through the AHP method.
The overall HEI values of the North Jiangsu Canal are calculated according to Equations (3)–(5). The main results are as shown in Table 5.
Table 5.
Calculation of the overall HEI values for the North Jiangsu Canal in 2008.
According to the calculation, the HEI value of the North Jiangsu Canal was 0.4874 in 2008, which is in the worse category. It is necessary to continue to invest in tangible hubs and intangible hubs. At the same time, in order to improve the intelligent maintenance of the North Jiangsu Canal project and the intelligence level of ships passing through the gate, the investment should be in line with the intangible hub.
4.2. Calculation of Investment Proportion in Different Jurisdictions of the North Jiangsu Canal
The specific investment proportion of different jurisdictions of the North Jiangsu Canal are calculated according to Equations (6) and (7), and the main results are as shown in Table 6.
Table 6.
Investment proportion of the North Jiangsu Canal for different jurisdictions.
4.2.1. Investment Plan for Waterway Engineering Based on HEI Values (2008–2018)
According to Table 5, the HEI level is in the bad category. The North Jiangsu Canal needs more capital investment to improve its operational capacity and further improve its connectivity with other industries According to the investment plan, the investment in 2008 was 30.68 million US dollars. According to the weight and specific investment proportion of different jurisdictions, the investment situation of each jurisdiction is as shown in Table 7.
Table 7.
Investment results of the North Jiangsu Canal for different jurisdictions based on the HEI model (2008) in millions of US dollars.
4.2.2. HEI Values Trend in the North Jiangsu Canal (2008–2018)
According to Equation (3), the overall HEI values from 2008 to 2018 were calculated, and the values are as shown in Table 8.
Table 8.
Calculation of the overall HEI values for the North Jiangsu Canal (2008–2018).
5. Discussion
5.1. Validation of Investment Decision in 2008
Table 9.
Comparison of modeled and actual investment (2008) in million dollars (US$).
Through the comparison between the actual investment and the calculated value of the HEI investment model, the deviation of the tangible investment is 2.8% lower, and that of the intangible hub investment is 7.2% higher, which is basically in line with the actual situation.
5.2. The Trend Analysis of HEI from 2008 to 2018
It can be seen from Table 8 that the HEI values increased rapidly from 0.48 to 0.56 from 2008 to 2010. The reason is that the government invested a lot of money in the North Jiangsu Canal, and the whole line of the North Jiangsu Canal reached the level of a second-class channel, with more than 2000 tons of navigable cargo. From 2011 to 2016, the HEI values were relatively stable, which shows that the engineering measures invested on in the early stage played a certain role. From 2017 to 2018, the HEI values made a breakthrough, because the construction of the North Jiangsu Canal was upgraded from an engineering construction to a smart channel construction, and the investment in an intelligent and ecological channel increased, which indicates that the North Jiangsu Canal is moving forward to become a green and smart channel. At the same time, the logistics system has been continuously improved to build a comprehensive transportation hub based on the North Jiangsu Canal. However, the absolute value of HEI is still relatively low, and there is still much room for improvement.
5.3. Analysis and Comparison of Contribution Rate of Each Second-Grade Index to HEI Value
The contribution rate is computed as shown in Equation (16).
where is the contribution rate, is the optimal value of each secondary index, and HEI is the hub economy value.
Take the calculation of the contribution rate of U11 to the HEI value of R1 as an example, according to the data in Section 3.3 and Section 3.4, C11 = 0.2767 × 0.3448 × 0.7/0.4099 × 100% = 16.29%. The contribution rate corresponding to other indices can be calculated similarly. The results of the contribution rate are as shown in Table 10.
Table 10.
Contribution rate of each second-grade index to the HEI value (%).
It can be seen from Table 10 that the contribution rate of the secondary indices in different regions to the HEI is different. Generally speaking, the contribution rate of channel revetment (U11), channel dredging (U12), intelligent software (U21) and mechanical equipment (U13) to the HEI is higher, while the contribution rate of crew satisfaction (U25) and greening rate (U24) to the HEI is slightly lower.
5.4. Analysis of the Relationship between the Hub Economy and Other Industries
In order to understand the position of waterway engineering in the hub economy and optimize investment behavior in transportation systems, this paper selects a representative expressway, a high-speed railway and aviation engineering for analysis. The calculation method is the same as that for the waterway engineering HEI. Different industries choose corresponding indices after extensive discussion by experts and engineers; the details are as follows: (1) expressway engineering, H1 (Damaged length of highway, Quantity of bridge maintenance, Failure rate of mechanical equipment, Failure rate of electrical equipment, Number of intelligent supervision devices), and H2 (Number of intelligent software, Toll station traffic efficiency, Qualified rate of regular training for employees, Greening rate of Expressway, Driver satisfaction); (2) high-speed railway engineering, H1 (Line maintenance length, Building maintenance quantity, Failure rate of mechanical equipment, Failure rate of communication equipment, Number of intelligent supervision devices), and H2 (Number of intelligent software, Punctuality rate, Qualified rate of regular training for employees, Railway greening rate, Passenger satisfaction); (3) aviation engineering, H1 (Runway maintenance length, Green maintenance area, Failure rate of mechanical equipment, Failure rate of electrical equipment, Number of intelligent supervision devices), and H2 (Number of intelligent software, Punctuality rate, Qualified rate of regular training for employees, Greening rate of Airport Road, Passenger satisfaction). Figure 7 shows the variation trends in the HEI for various industries from 2008 to 2018.
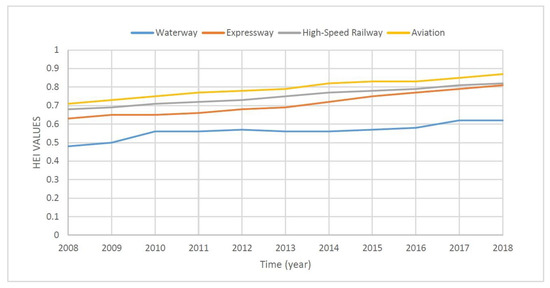
Figure 7.
Variation trends in HEI for various industries in transportation system.
As can be seen from Figure 7, the HEI values of the different industries in the transportation system show a trend of steady growth. The overall HEI value of aviation engineering is the highest—the interval is at (0.71, 0.87), which is near the excellent level; the high-speed railway is in second place with the interval at about (0.68, 0.82), which is rising from a fair level to a good level; and the expressway interval is at (0.63, 0.81), which is rapidly rising from a fair level to the good level. The overall HEI value of waterway engineering is relatively low, at (0.48, 0.62), which is between the bad level and the fair level. According to the hub theory, in order to make the comprehensive benefits of the transportation industry larger, the water transportation industry needs to increase its investment to narrow the gap.
6. Conclusions
The North Jiangsu Canal is an important waterway in China, with a large number of ships passing through it. When the government makes investment decisions on traffic engineering, due to the limited funds, it often takes subjective judgment on the allocation of engineering funds, which affects the sustainable development of waterway engineering. In this paper, an investment method for sustainable development of waterway engineering based on the quantitative index of hub economy is proposed. The HEI and quantification methods described in this study are complimentary to the theoretic discussions of hub economy in other studies, which is an important contribution. Based on the values of HEI and the contribution rate of secondary indices to the HEI, government decision makers can allocate funds more scientifically and quickly. At the same time, as the hub economy involves three stages of sustainable development, with the extension of secondary investment, it can help to improve the convenience of additional investment into the tangible hub and intangible hub, and improve the level of intelligent construction of the North Jiangsu Canal.
As time goes on, the weight value between the tangible hub and the intangible hub should change accordingly. Generally speaking, in the early stage of development, the proportion of the tangible hub is relatively large. In the middle stage of development, the proportions of the tangible hub and the intangible hub are similar. In the middle and late stages of development, due to the accumulated investment in the project in the early stages, the construction of engineering measures is basically complete and the proportion of investment in the intangible hub should be increased. The HEI value of the North Jiangsu Canal is 0.62 in 2018. The North Jiangsu Canal has changed from an engineering construction to an intelligent channel construction phase. According to the three stages of hub economy, the North Jiangsu Canal is in transition from the first stage to the second stage. The North Jiangsu Canal should seize the opportunities of the hub economy, strengthen its integrated development with the local economy, carry out quality construction and contribute to the development of Jiangsu’s hub economy.
There are many important traffic engineering projects in the world. Due to the different project characteristics, the index system should be changed appropriately so that the HEI can meet the sustainable development characteristics of the local engineering. The quantification of the HEI is helpful to the investment decision-making of major transportation projects, and to improve the sustainable development level of different projects.
Author Contributions
Conceptualization, J.R.; methodology, J.R. and Y.W.; software, J.R. and Y.W.; validation, J.R. and Y.W.; formal analysis, J.R. and Y.W.; investigation, J.R.; resources, J.R.; data curation, J.R. and Y.W.; writing—original draft preparation, J.R.; writing—review and editing, J.R., G.M., F.Z. and Y.W.; visualization, J.R. and Y.W.; supervision, J.R.; project administration, J.R.; funding acquisition, J.R., G.M. and Y.W. All authors have read and agreed to the published version of the manuscript.
Funding
This research was funded by Foundation of the research institute of grand canal cultural belt construction (No. DYH19YB01), Natural Science Foundation of Shandong Province, China (No. ZR2018BEE050), Humanities and Social Sciences Foundation of the Chinese Ministry of Education (No.18YJA790061) and Social Science Foundation of Jiangsu Province (No.18EYB008).
Acknowledgments
The authors are grateful for the comments and reviews from the reviewers and editors.
Conflicts of Interest
The authors declare no conflict of interest.
References
- Thoft-Christensen, P. Infrastructures and life-cycle cost-benefit analysis. Struct. Infrastruct. Eng. 2012, 8, 507–516. [Google Scholar] [CrossRef]
- Yu, B.; Zhang, C.; Jiang, Y.; Li, Y.; Zhou, H. Conjunctive use of Inter-Basin Transferred and Desalinated Water in a Multi-Source Water Supply System Based on Cost-Benefit Analysis. Water Resour. Manag. 2017, 31, 3313–3328. [Google Scholar] [CrossRef]
- Habibzadeh-Bigdarvish, O.; Yu, X.; Lei, G.; Li, T.; Puppala, A. Life-Cycle cost-benefit analysis of Bridge deck de-icing using geothermal heat pump system: A case study of North Texas. Sustain. Cities Soc. 2019, 47, 101492. [Google Scholar] [CrossRef]
- Teng, J.; Huang, W.; Lin, M. Systematic budget allocation for transportation construction projects: A case in Taiwan. Transportation 2010, 37, 331–361. [Google Scholar] [CrossRef]
- You, S.; Tan, Z. Study on transportation investment planning models from industrial and regional aspects. Syst. Eng. Theory Pract. 2019, 39, 2421–2428. [Google Scholar]
- Wang, S.; Yin, L.; Feng, L. Research and application of selection method of expressway investment project based on AHP. Shandong Commun. Technol. 2018, 2, 96–100. [Google Scholar]
- Ren, Q.; Wu, F. Analysis on the effectiveness of Jiangsu inland waterway investment based on DEA. Chin. Foreign Entrep. 2011, 19, 67–71. [Google Scholar]
- Li, Y.; Fan, J.; Deng, H. Analysis of Regional Difference and Correlation between Highway Traffic Development and Economic Development in China. Transp. Res. Rec. 2018, 2672, 12–25. [Google Scholar] [CrossRef]
- You, S.; Tan, Z. Regional differentiated development strategy and model of transportation. In Proceedings of the 19th COTA International Conference of Transportation Professionals, Nanjing, China, 6–8 July 2019; American Society of Civil Engineers (ASCE): Reston, VA, USA, 2019; pp. 5235–5246. [Google Scholar]
- Yu, H.; Pu, Y.; Liu, H.; Wang, Z. Regional transportation investment structure optimization under economic distribution pattern. J. Shanghai Jiaotong Univ. 2015, 49, 450–456. [Google Scholar]
- Lin, X.; Yang, J.; Tao, Z.; Song, J.; Ren, T. Transport investment, economic spatial aggregation, and multiple paths: A joint estimation by spatial panel and structural equation modeling. Acta Geogr. Sin. 2018, 73, 1970–1984. [Google Scholar]
- Vega, H.; Penne, L. Governance and institutions of transportation investments in U.S. mega-regions. Transport 2008, 23, 279–286. [Google Scholar] [CrossRef][Green Version]
- Yuan, L.; Wang, Y.; Huang, H. Game analysis on urban rail transit project under governmental investment regulation. Open Constr. Build. Technol. J. 2016, 10, 369–378. [Google Scholar] [CrossRef][Green Version]
- Hendren, P.; Debbie, A. Evaluating the effectiveness of state department of transportation investment decisions: Linking performance measures to resource allocation. J. Infrastruct. Syst. 2006, 12, 216–229. [Google Scholar] [CrossRef]
- Fichert, F. Transport policy planning in Germany—An analysis of political programs and investment masterplans. Eur. Transp. Res. Rev. 2017, 9, 28. [Google Scholar] [CrossRef]
- Epstein Barry, J.; Jermakowicz, E.K. WILEY Interpretation and Application of International Financial Reporting Standards 2010; John Wiley & Sons, Inc.: Hoboken, NJ, USA, 2010. [Google Scholar]
- Chareonsuk, C.; Chansa-ngavej, C. Intangible asset management framework for long-term financial performance. Ind. Manag. Data Syst. 2008, 108, 5–6. [Google Scholar] [CrossRef]
- Shen, Y.; Guo, X. Decision-making index system of overseas terminal investment layout based on AHP model. Port Waterw. Eng. 2019, 9, 32–36. [Google Scholar]
- Wang, H. Performance evaluation index system of green highway project management. Henan Build. Mater. 2018, 6, 195–198. [Google Scholar]
- Fernandes, P. Integrating road traffic externalities through a sustainability indicator. Sci. Total Environ. 2019, 691, 483–498. [Google Scholar] [CrossRef]
- Yang, C.; Wei, Y. Indexes of Sustainable Urban Transport Based on a Consideration of Residents’ Living Quality. J. Tongji Univ. (Nat. Sci.) 2013, 41, 1497–1501. [Google Scholar]
- Maceika, A.; Šostak, O.R. Delphi method application for engineering. In Proceedings of the 11th International DAAAM Baltic Conference “INDUSTRIAL ENGINEERING”, Tallinn, Estonia, 20–22 April 2016; pp. 48–53. [Google Scholar]
- Xu, L.; Zhu, H. Post evaluation model of water transport infrastructure project based on grey fuzzy theory. Port Waterw. Eng. 2011, 4, 24–27. [Google Scholar]
- Leng, H.; Xiang, Q.; Ning, J.; Yan, L. Research on the index system for evaluating safety state of freeway infrastructure. In Proceedings of the 2010 International Conference of Logistics Engineering and Management, Chengdu, China, 8–10 October 2010; American Society of Civil Engineers (ASCE): Reston, VI, USA, 2010; Volume 387, pp. 3959–3965. [Google Scholar]
- Han, Y.; Yan, X. Project evaluation model based on group decision-making vector optimization of AHP algorithm. Metall. Min. Ind. 2015, 7, 144–150. [Google Scholar]
- Zhang, S.; Ma, R.; Mo, X.; Fang, L. Comprehensive evaluation on sustainable development of the trunk road network based on fuzzy AHP. Appl. Mech. Mater. 2013, 2020–2024. [Google Scholar] [CrossRef]
- Wang, L.; Wang, X. The application of fuzzy analytic hierarchy process based on fuzzy consistent matrix in the optimal scheme of anchorage. China Water Transp. 2016, 16, 217–218. [Google Scholar]
- Kong, B. The application of the improved multi-objective and multi-level fuzzy evaluation method in the comprehensive evaluation of the benefits of water-saving transformation in irrigation area group. Tech. Superv. Water Resour. 2018, 1, 160–162. [Google Scholar]
- Ding, Y.; Tang, D.; Dai, H.; Wei, Y. Human water harmony index: A New Approach to Assess the Human Water Relationship. Water Resour. Manag. 2014, 28, 1061–1077. [Google Scholar] [CrossRef]
- Ming, W. Combination of logistics channel and hub to promote hub economic development. Marit. China 2018, 11, 44–45. [Google Scholar]
- Ustadi, M.N.; Shopi, N.A.M. A Study towards the Efficiency of Public Transportation Hub Characteristics: A Case Study of Northern Region, Peninsular Malaysia. Procedia Econ. Financ. 2016, 35, 612–621. [Google Scholar] [CrossRef]
- Torkestani, S.S.; Seyedhosseini, S.M.; Makui, A.; Shahanaghi, K. The reliable design of a hierarchical multi-modes transportation hub location problems (HMMTHLP) under dynamic network disruption (DND). Comput. Ind. Eng. 2018, 122, 39–86. [Google Scholar] [CrossRef]
- Sun, H. Discussion on operation mode of comprehensive transportation hub. China Policy Rev. 2018, 5, 71–73. [Google Scholar]
- Yao, L.; Xia, X.; Sun, L. Transfer Scheme Evaluation Model for a Transportation Hub based on Vectorial Angle Cosine. Sustainability 2014, 6, 4152–4162. [Google Scholar] [CrossRef]
- Shao, M.; Xie, C.; Sun, L.; Jiang, L. Optimal Layout of Static Guidance Information in Comprehensive Transportation Hubs Based on Passenger Pathfinding Behavior. Sustainability 2019, 11, 3684. [Google Scholar] [CrossRef]
- Jiang, C.; Zhang, A. Effects of high-speed rail and airline cooperation under hub airport capacity constraint. Transp. Res. Part. B Methodol. 2014, 60, 33–49. [Google Scholar] [CrossRef]
- Yao, S.; Yu, C. On the new development level of urban hub economy. Urban. Plan. Forum. 2002, 5, 17–19. [Google Scholar]
- Mao, K.; Fan, Y. China needs to make clear the direction and path of hub economic development. China Econ. Trade Herald. 2017, 10, 58–60. [Google Scholar]
- Zhao, J. An analysis of the factors influencing the development of Henan hub economy. China J. Commer. 2018, 12, 161–162. [Google Scholar]
- Sun, G. Research on transportation support system of freight hub based on urban hub economy. In Proceedings of the 2019 China Urban Planning Annual Meeting, Beijing, China, 28–29 June 2019; Urban Planning Society of China and Chongqing Municipal People’s Government: Chongqing, China, 2019; Volume 10, pp. 500–506. [Google Scholar] [CrossRef]
- Hák, T.; Janoušková, S.; Moldan, B. Sustainable Development Goals: A need for relevant indicators. Ecol. Indic 2016, 60, 565–573. [Google Scholar] [CrossRef]
- Xie, Y.; Lu, C.; Wang, M. Constructing national logistics hub network and reconstructing high quality transportation pattern. New Silk Road Horiz. 2019, 10, 22–24. [Google Scholar]
- Liu, J.; Fu, H.; Guo, Z. Comprehensive Frequency Analytic Approach and Its Application on the Multi-target Orthogonal Test Design. Value Eng. 2016, 24, 124–126. [Google Scholar]
© 2020 by the authors. Licensee MDPI, Basel, Switzerland. This article is an open access article distributed under the terms and conditions of the Creative Commons Attribution (CC BY) license (http://creativecommons.org/licenses/by/4.0/).