1. Introduction
Personalized recommendation has become a research hotspot as the volume of data on e-commerce platforms continues to grow at an exponential rate, it provides an unprecedented development for precision marketing and dynamic supply chain optimization [
1]. In real applications, due to inaccurate recommendation results, personalized recommendation service faces the problem of unsustainable development [
2]. Some literature has proposed some solutions recently [
3,
4], traditional recommended systems usually adopt collaborative filtering algorithms [
5,
6] and content-based filtering algorithms [
7,
8], but this strategy cannot solve these issues well and meets bottlenecks to improve the accuracy of recommendation results. The experiments of literature in recent years suggest that relational social information is very effective in improving traditional recommendation algorithms [
9,
10]. Relationship strength, as known as tie strength, is an important part of relational social information, and its application can promote the sustainable development of personalized recommendation services. The notion of tie strength is a “combination of the amount of time, the emotional intensity, the intimacy (mutual confiding) and reciprocal services”, which was first proposed by Granovetter [
11] in 1973. Many approaches have been proposed to solve the problem of relationship strength measurement [
12,
13]. However, one problem in existing approaches is that they neglect the fact that different users have different activity field preferences due to their interests. It will affect the user’s interaction choice for different activity fields. A simple example is used to illustrate this point. If a user enjoys eating but does not like sports, he may pay more attention to the posts related to the “diet” field rather than the “sport” field, generating frequent interaction in the “diet” field instead of the “sport” field. Furthermore, the high frequent interaction between the user and his friends is not just for their strong relationship strength but may be because the posts published by these friends are most related to the “diet”. The reverse is true where the low frequencies of interaction with other friends are not only due to the weak relationship strength, but due to these friends’ stronger motivation to post about “sport” than “diet”. In addition, various individuals have different interactive habits, which will affect their behavior to generate the interactive frequency and interactive types. For instance, some users have less interaction due to their taciturn personality rather than disfavor or disapproval, while other users are habituated to give likes; and so on. Therefore, it is necessary to study the relationship strength in combination with the individual’s activity field preferences and interactive habits.
Based on this motivation, in this paper, a general framework is proposed to measure the relationship strength based on the user’s activity field preference and interactive habit. The contributions of our work are threefold. First, the three-way method is adopted to represent each activity field. The representation is a general framework of the activity field which can reflect the affiliation between each activity document and the activity fields. Second, the contribution weight of the activity field preference and interactive habit for users are calculated. The contribution weight of the activity field preference is measured based on interactions in the positive and boundary region of the activity fields. The contribution weight of the interactive habit is calculated by different types of the user’s interactive behaviors. Third, a method is proposed to measure the relationship strength based on the user’s activity field preference and interactive habit. The main strategy of the proposed approach is combining the interaction strength, the common friend rate and the similarity of the feature attribution. The performance of the proposed method is evaluated on the WeChat (6.6.5 version in Android platform, Shenzhen, China) Moments network. The results of comparative experiments show that it is an efficient and highly appropriate method for relationship strength measurement.
The rest of this paper is organized as follows. In
Section 2, the existing methods for relationship strength measurement is reviewed and the motivation of the present study about several seldom considered issues is pointed out. In
Section 3, the framework for measuring the relationship strength that is based on the user’s activity field preference and interactive habit is introduced briefly. The details of the proposed approach are elaborated in
Section 4. In
Section 5, the initial experimental results of our approach on the WeChat Moments dataset is showed. Finally, the summary of the present study is given in
Section 6.
2. Literature Review
The literature reviews for the existing research on relationship strength measurement in an online social network are presented in this section, and several unconsidered issues that motivate the present study are also pointed out subsequently.
For the measurement about the relationship strength between users, lots of methods were proposed recently, which could be categorized by utilizing the user’s feature information [
14], topology of networks information [
15] and interactive information [
16]. The user’s feature information can provide an overview of personal characteristics, including the user’s profile information and the following information. The profile information contains gender, age, education, work experience, hobbies, religious views, etc. The following information involves the public account, topic, field that is followed by users. Luarn and Chiu [
17] predicted the relationship strength by the similarity of the profile information and interaction data between users, thus distinguished the strong and weak relationships on social network sites. Ju and Tao [
18] estimated the user’s similarity based on the profile information and the following information of the official accounts that is concerned by users. Then, the similarity, timeliness and interaction were confused to improve the accuracy of the relationship strength calculation to some extent.
The topology of the network information can reflect the link between users in a complex social network, such as the common friends’ relationship, the link between common neighbor nodes, the social relationship overlaps, etc. For the research about the common friend and common neighbor nodes, Chen, Liu and Zou [
19] utilized the number of common friends to measure the tie strength, and proposed a Social Tie Factor Graph (STFG) model to estimate a Twitter user’s city-level location, user-centric data and relationship strength. Chulyadyo and Leray [
20] measured the relationship strength between nodes based on the number of common neighboring nodes. Other directions of the related research have considered the social relationship overlaps. For instance, Burt [
21] regarded the social structure as an important factor affecting players’ relationship strength, and the connection tightness between nodes that could reflect the difference in relationship strength. Cannistraci, Alanis and Ravasi [
22] discovered two nodes were more likely to link when they had common neighbor nodes, there were link edges between the neighbor nodes. Alba and Kadushin [
23] confirmed the overlapping and similarity of the social relationship and the social circles of nodes would affect the strength and loyalty between them.
Interactive information indicates the record of interactive behaviors between users, such as tagging the friends’ pictures, commenting and liking the friends’ posts, and sending a message to friends, etc. Most of the existing research on the relationship strength measurement was based on interactive information, and considered the interactive times and frequency. For the research about the interactive times, Wilson, Boe and Sala [
24] studied the activities of Facebook users, taking the number of different interactions as signs. Backstrom et al. [
25] studied how users allocated attention to their Facebook friends, by taking messages, comments, wall posts and information on the number of times each user’s profile page or photo submissions was viewed by another user into account. For the research about interactive frequency, Ahmed, Villata and Governatori [
26] studied the attitudes of individuals in the social networks to privacy issues, and proposed information and friend isolation strategies based on the frequency of interaction between individuals and the sensitivity of information. Luarn et al. [
27] discussed the effects of relationship strength and gender difference on social support for online friendships, and showed that individuals with strong relationships had a significantly higher frequency of clicking like, and posting comments and messages on Facebook than individuals with weak relationships did. Jason et al. [
28] found the frequency of online interaction was diagnostic of a strong relationship, and it was a much more useful diagnostician than the attributes of the user or the user’s friends.
From the review of existing studies, there are several issues that have not been resolved satisfactorily. Existing approaches of relationship strength concentrate on the user’s feature information, topology of networks information and interactive information. Activity field preferences have good application value, but there are insufficient investigations on the consideration of users’ activity field preference in their action. For example, when we want to recommend a fitness class, we can choose people who prefer sport, it may have a higher probability to achieve a successful recommendation. For the user’s feature information, the typical approaches to estimate the relationship strength are utilizing the similarity of profile information or the followed official accounts. However, the profile information is usually incomplete with the increasing awareness of the user’s personal privacy protection, and the official accounts followed by users are usually random, which will reduce the accuracy of the experimental results. Hence, the similarity of users is calculated based on their posts, the activity field preference of the user’s posts can represent their attention degree of activity fields and their interests. The posts of two users with a similar activity field preference are likely to exhibit greater similarity, and they may have higher relationship strength. For the topology of networks information, the existing research mainly focuses on the number of common friends, common neighbor nodes, social relationship overlap, etc. Common friends and neighbor nodes are the fundamental factors for relationship strength. Therefore, the common friend rate is given as one of the dimensions of relationship strength measurement. For interactive information, most existing research only considers the interactive times and frequency. Nonetheless, the user’s activity field preference and interactive habit have a significant impact on the choice of interactive behavior for everyone. High or low frequency of interaction is produced by the user’s activity field preference for the corresponding activity fields and the tendency of interactive habit. These cases are explained by using the example of sports fans and sports haters, when browsing the posts related to the “sport” field, the sport fans display strikingly high frequency of interaction than sport haters under the same relationship strength. Another example of a habitually active user and habitually silent user, the former displays strikingly high frequency of interaction than the latter, with relationship strength being equal. Therefore, only depending on the times and frequency of interactions cannot truly reflect the interaction strength between users.
Based on the above analysis, a method of relationship strength measurement based on the user’s activity field preference and interactive habit is proposed. The interaction strength, common friend rate and the similarity of the feature attribute are set as three dimensions in this method, which is promising to improve the measuring accuracy of relationship strength between users in online social networks.
3. Overview of the Estimation of the Relationship Strength
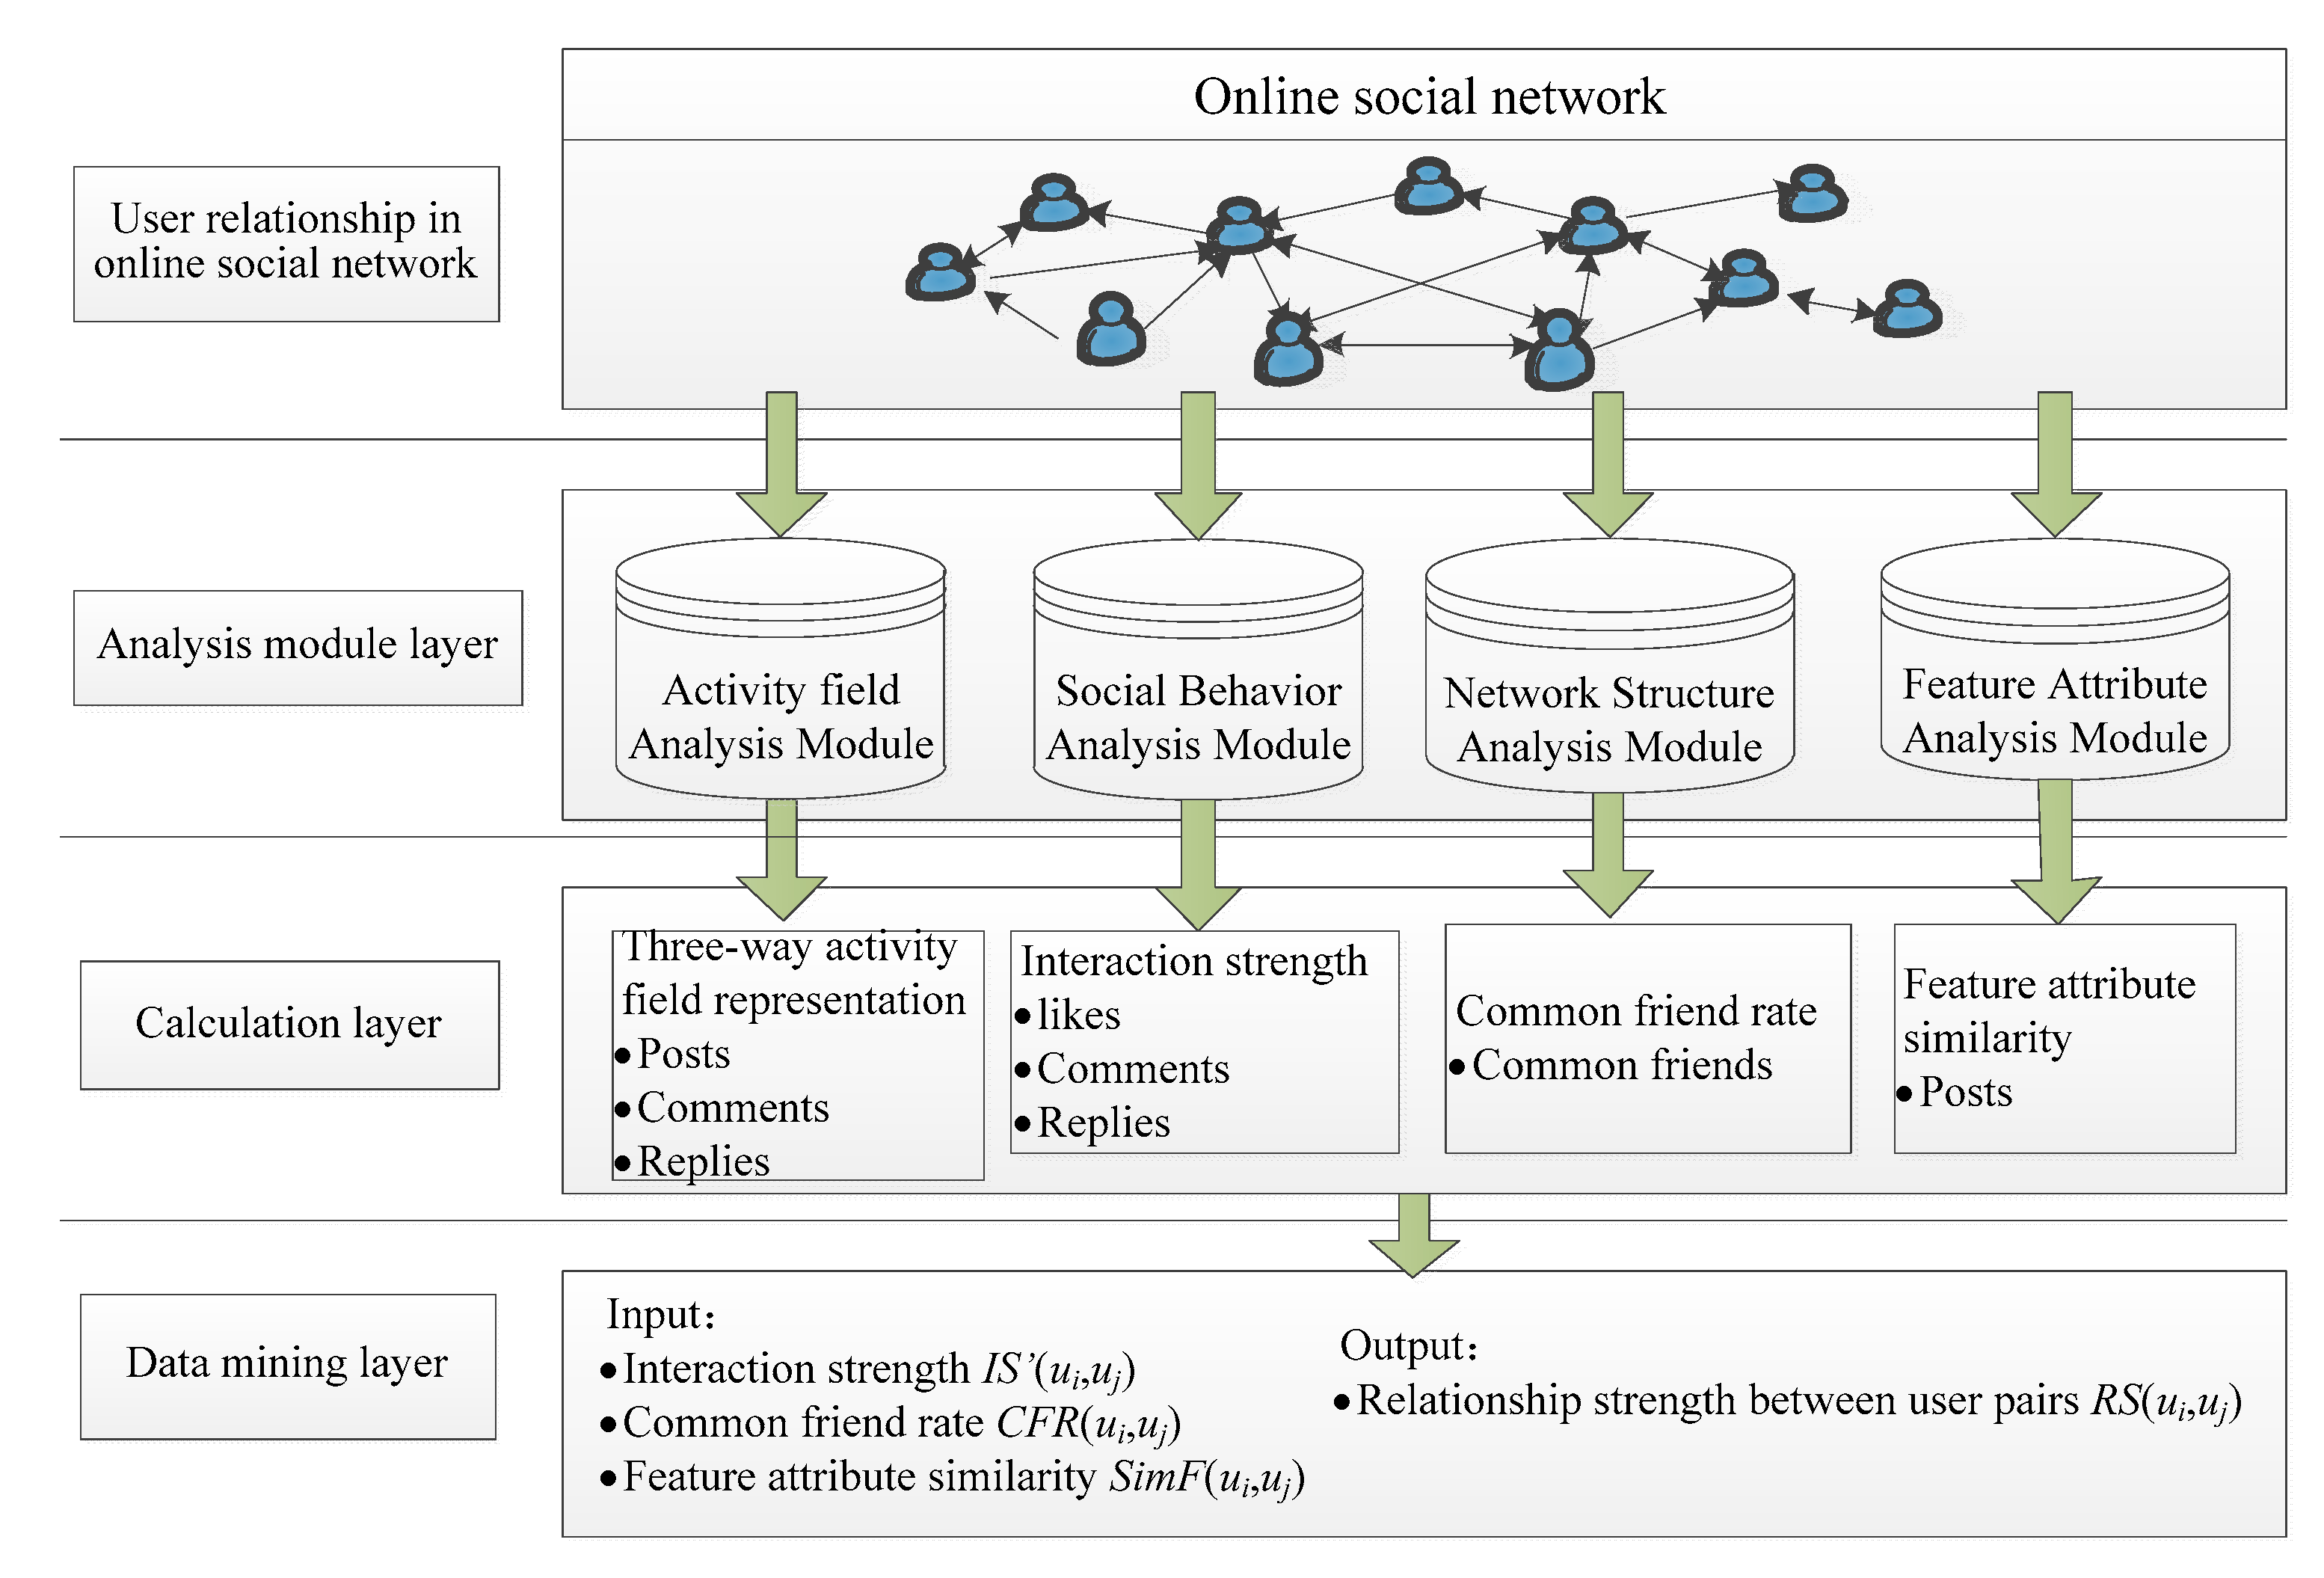
A new model of relationship strength measurement is proposed in this paper (
Figure 1). It consists of four layers: (1) Users in an online social network layer. Attribute and interactive information can be achieved from this layer. (2) Analysis module layer. It is the main part of the model and consists of four analysis modules includes activity field analysis, social behavior analysis, network structure analysis and feature attribute analysis. (3) Module calculation layer. Utilize the information extracted from the first layer to calculate the analysis modules layer. (4) Data mining layer. Taking interaction strength, common friend rate and the similarity of the feature attribute as input to achieve the relationship strength between user pairs in online social networks.
Two key parts of this model are the module calculation layer and data mining layer, which can be summarized into the following two main steps in sequence:
Represent each activity field.
Measure the relationship strength of the user pair based on three dimensions: interaction strength, common friend rate and the similarity of feature attribute, by considering the activity field preference and interactive habits of the individual.
In the first step, each activity field is represented by the three-way method and divided into three regions: the positive region, the boundary region and the negative region. Firstly, an estimation method of correlation between the activity document and activity field is defined. Then, the optimal representation of the activity field is determined by comparing the manual label result with the result of the three-way method by different thresholds.
For the second step, relationship strength of any user pairs is estimated based on the dimensions, including interaction strength, common friend rate and the similarity of feature attribute. Meanwhile, the estimation of interaction strength considers the contribution weight of the activity field preference and interactive habit. Since interactive documents in the negative region are irrelevant to the activity field and cannot reflect the individual’s activity field preferences, the calculation of the interaction strength is only related to the positive region and boundary region. The final interaction strength between user pairs is obtained by weight summing the interaction strength in these two regions. The common friend rate is equal to the ratio of common friends to target the user’s total friends. The user’s feature attribute similarity is measured by the distance of personal posts, and the region of each activity field involved by post was regarded as the feature attribute of this post.
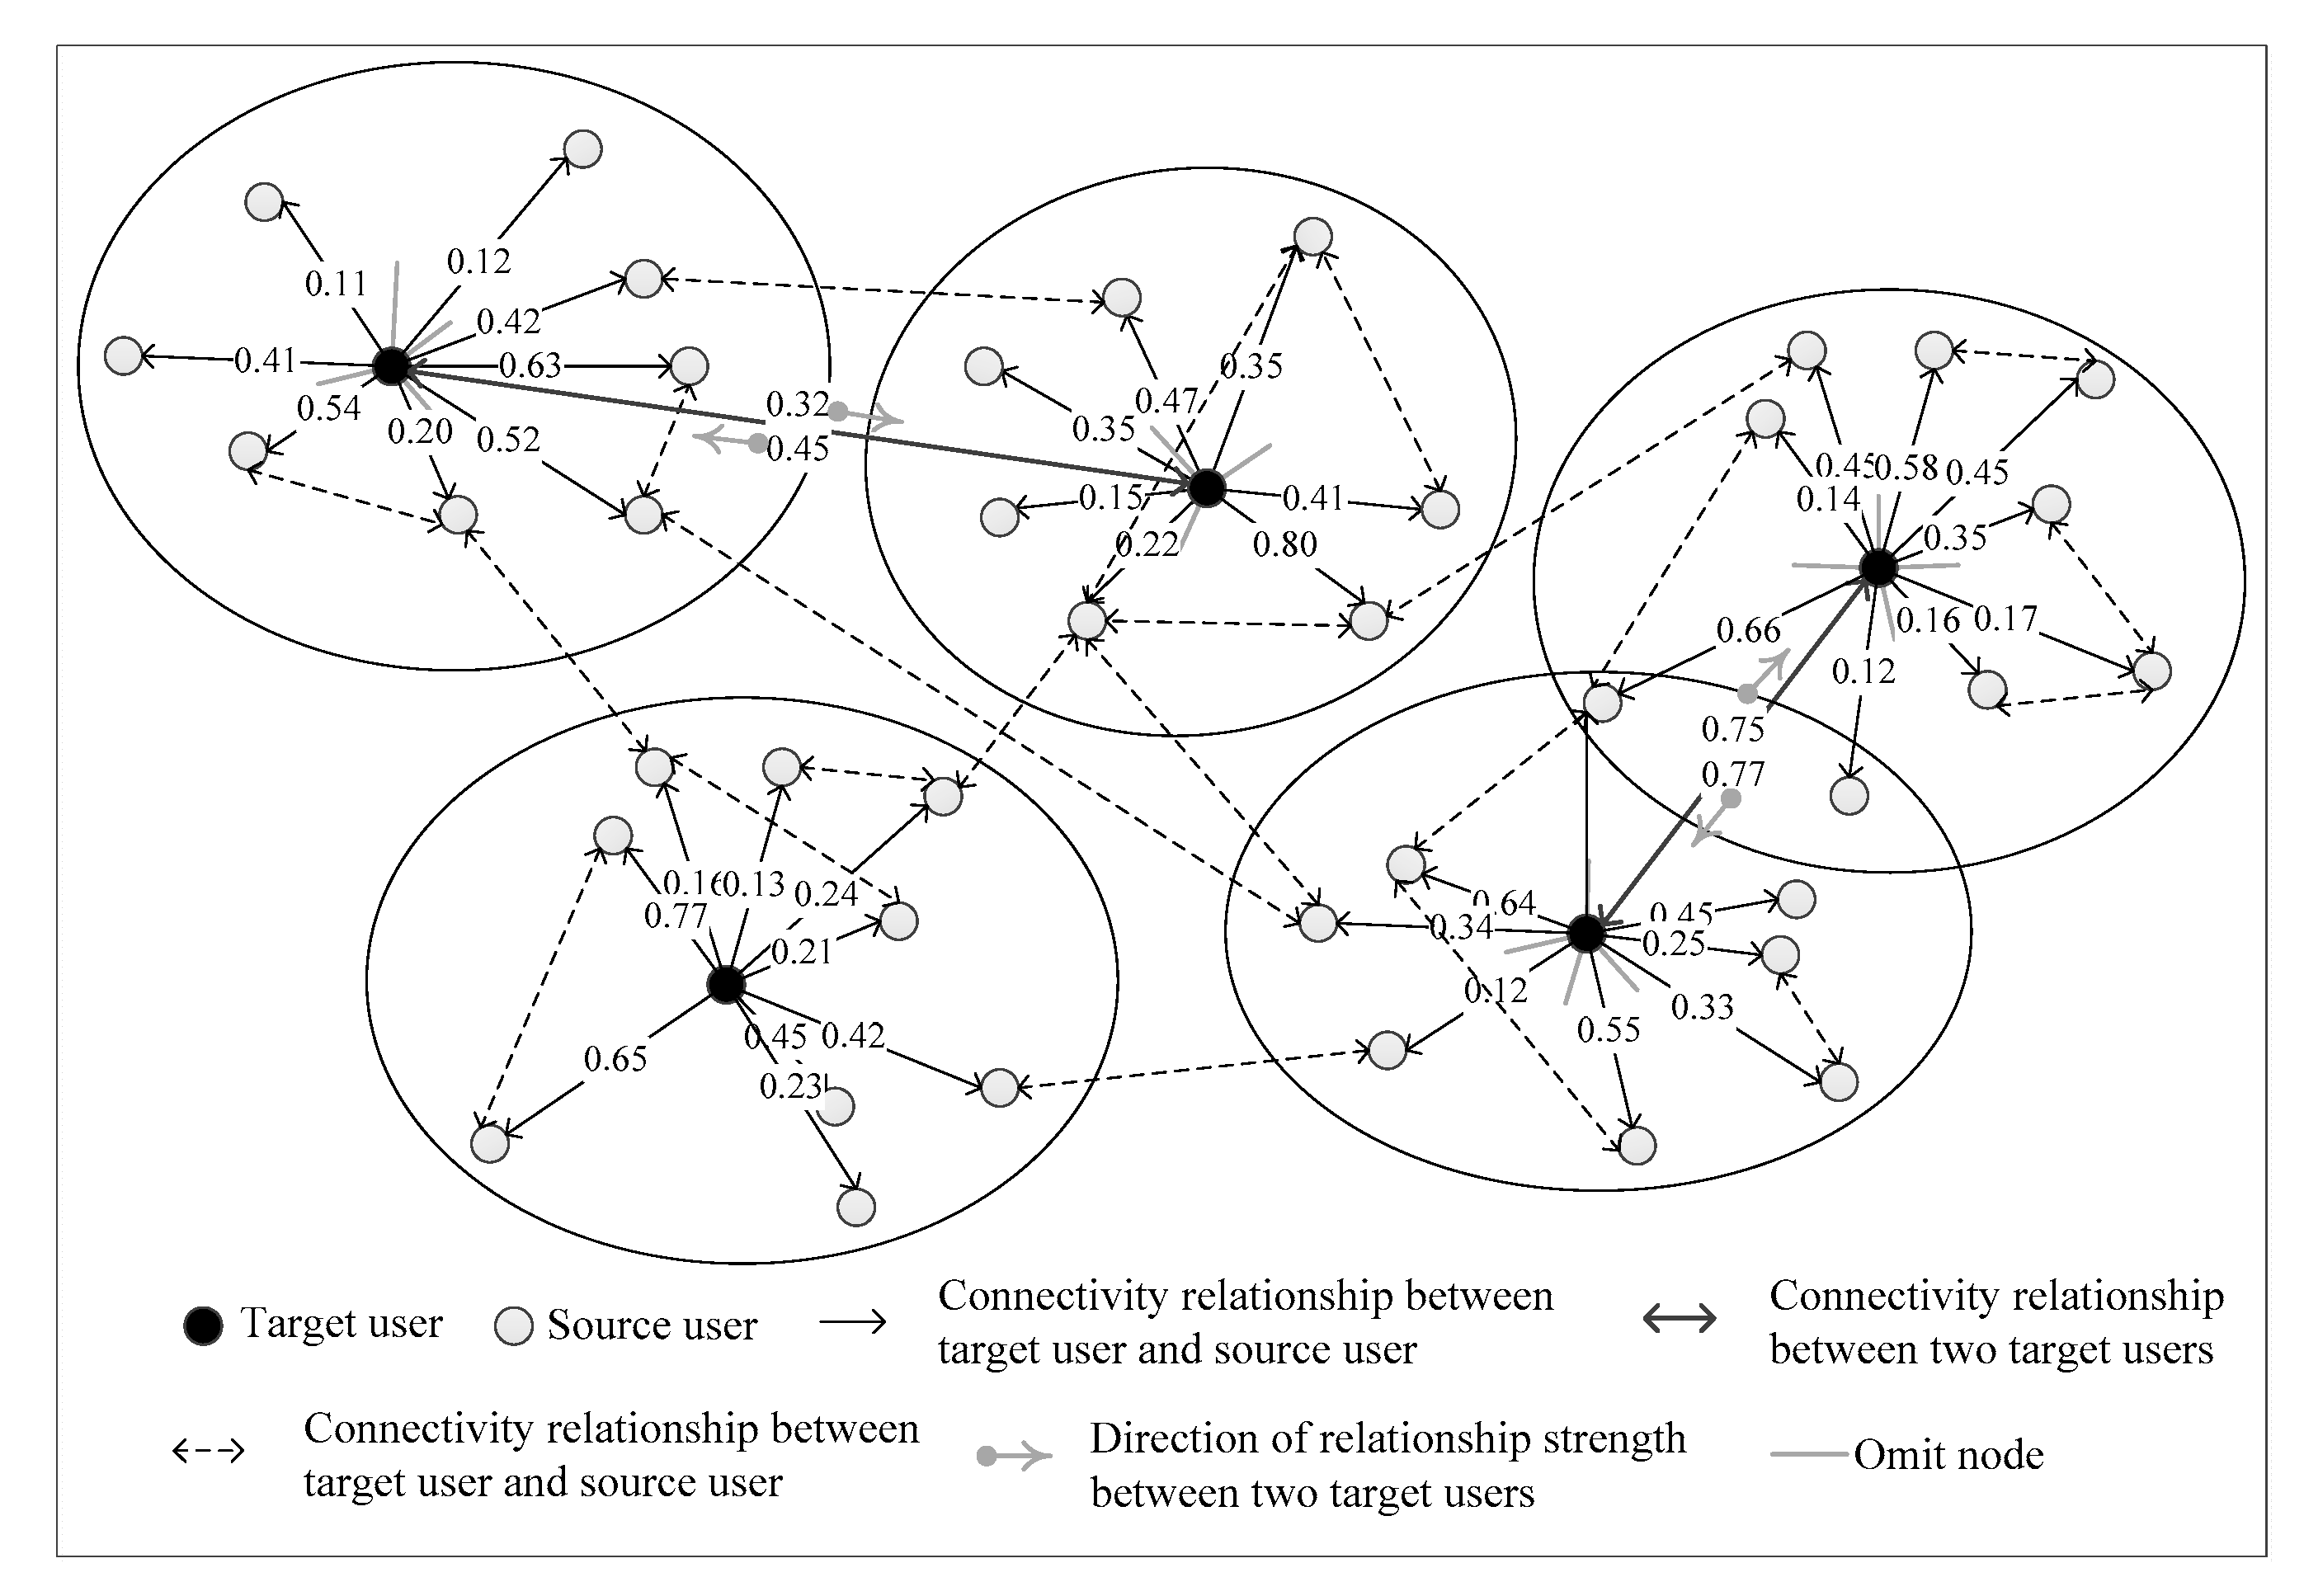
Figure 2 shows an example of a partial schematic diagram of user relationship in an online social network. The black node is the target user, white node indicates the friend of the target user which is also called the source user. Each oval contains a target user and all of his friends. The connection between two nodes denotes friend relationship, and the arrow signifies the directionality of the relationship. The value (reserves two decimal fractions) over a connection represents the relationship strength from the target user to his friend, which can be calculated by the proposed method in this paper.
4. Methodology of the Relationship Strength Estimation
4.1. Data Preprocessing
In order to give the set of the action data (posts, likes, comments and replies) downloaded from online social networks, there are three main sequential steps in our data preprocessing: punctuation marks removing, Chinese text segmentation, stop word removing. After that, the dataset of post documents P = {p1, p2, …, pl} and interactive documents D = {d1, d2, …, dk} are obtained, where l is the number of the post documents and k is the number of the interactive documents. The post document and interactive document are collectively called the activity document, which are represented as dataset PD in this paper. The set of the user is recorded as U = {u1, u2, …, un}, where n is the number of the users, for each post document pl, its related user is who sending this post, and for each interactive document dn, its related users are those who are sending or receiving this interaction.
4.2. Representation of Activity Field by Three-Way Method
An issue related to the existing research about the relationship strength measurement in activity fields is more likely based on two-way (i.e., binary) decisions. It is described by a single set, where every activity document plays the same role in this field. In other words, there are two regions to represent an activity field (
Figure 3a), namely, the positive (i.e., in) region and the negative (i.e., out) region. If an activity document is in the activity field, that means it is in the positive region. If an activity document is not in the activity field, it is classified into the negative region. With this mode, an activity document in the online social network can only belong to one field. But it is more complex in reality that an activity document may belong to several activity fields simultaneously. Such as the post content “I have a nice impression on this Hong Kong trip, the most delicious food is Kau Kee Food Café, and the cheapest cosmetic is Bonjour.” This post is mainly about a traveling experiment, but also related to diet and shopping. Therefore, it is inadequate to assign the activity field to an activity document only by two-way. By borrowing ideas from the three-way analysis [
29], this problem is resolved by introducing a third region of the activity field, namely, the boundary region (
Figure 3b). With this three-way mode, an activity document can be both in the positive region of several fields or in the positive region of one field and the boundary field of another field.
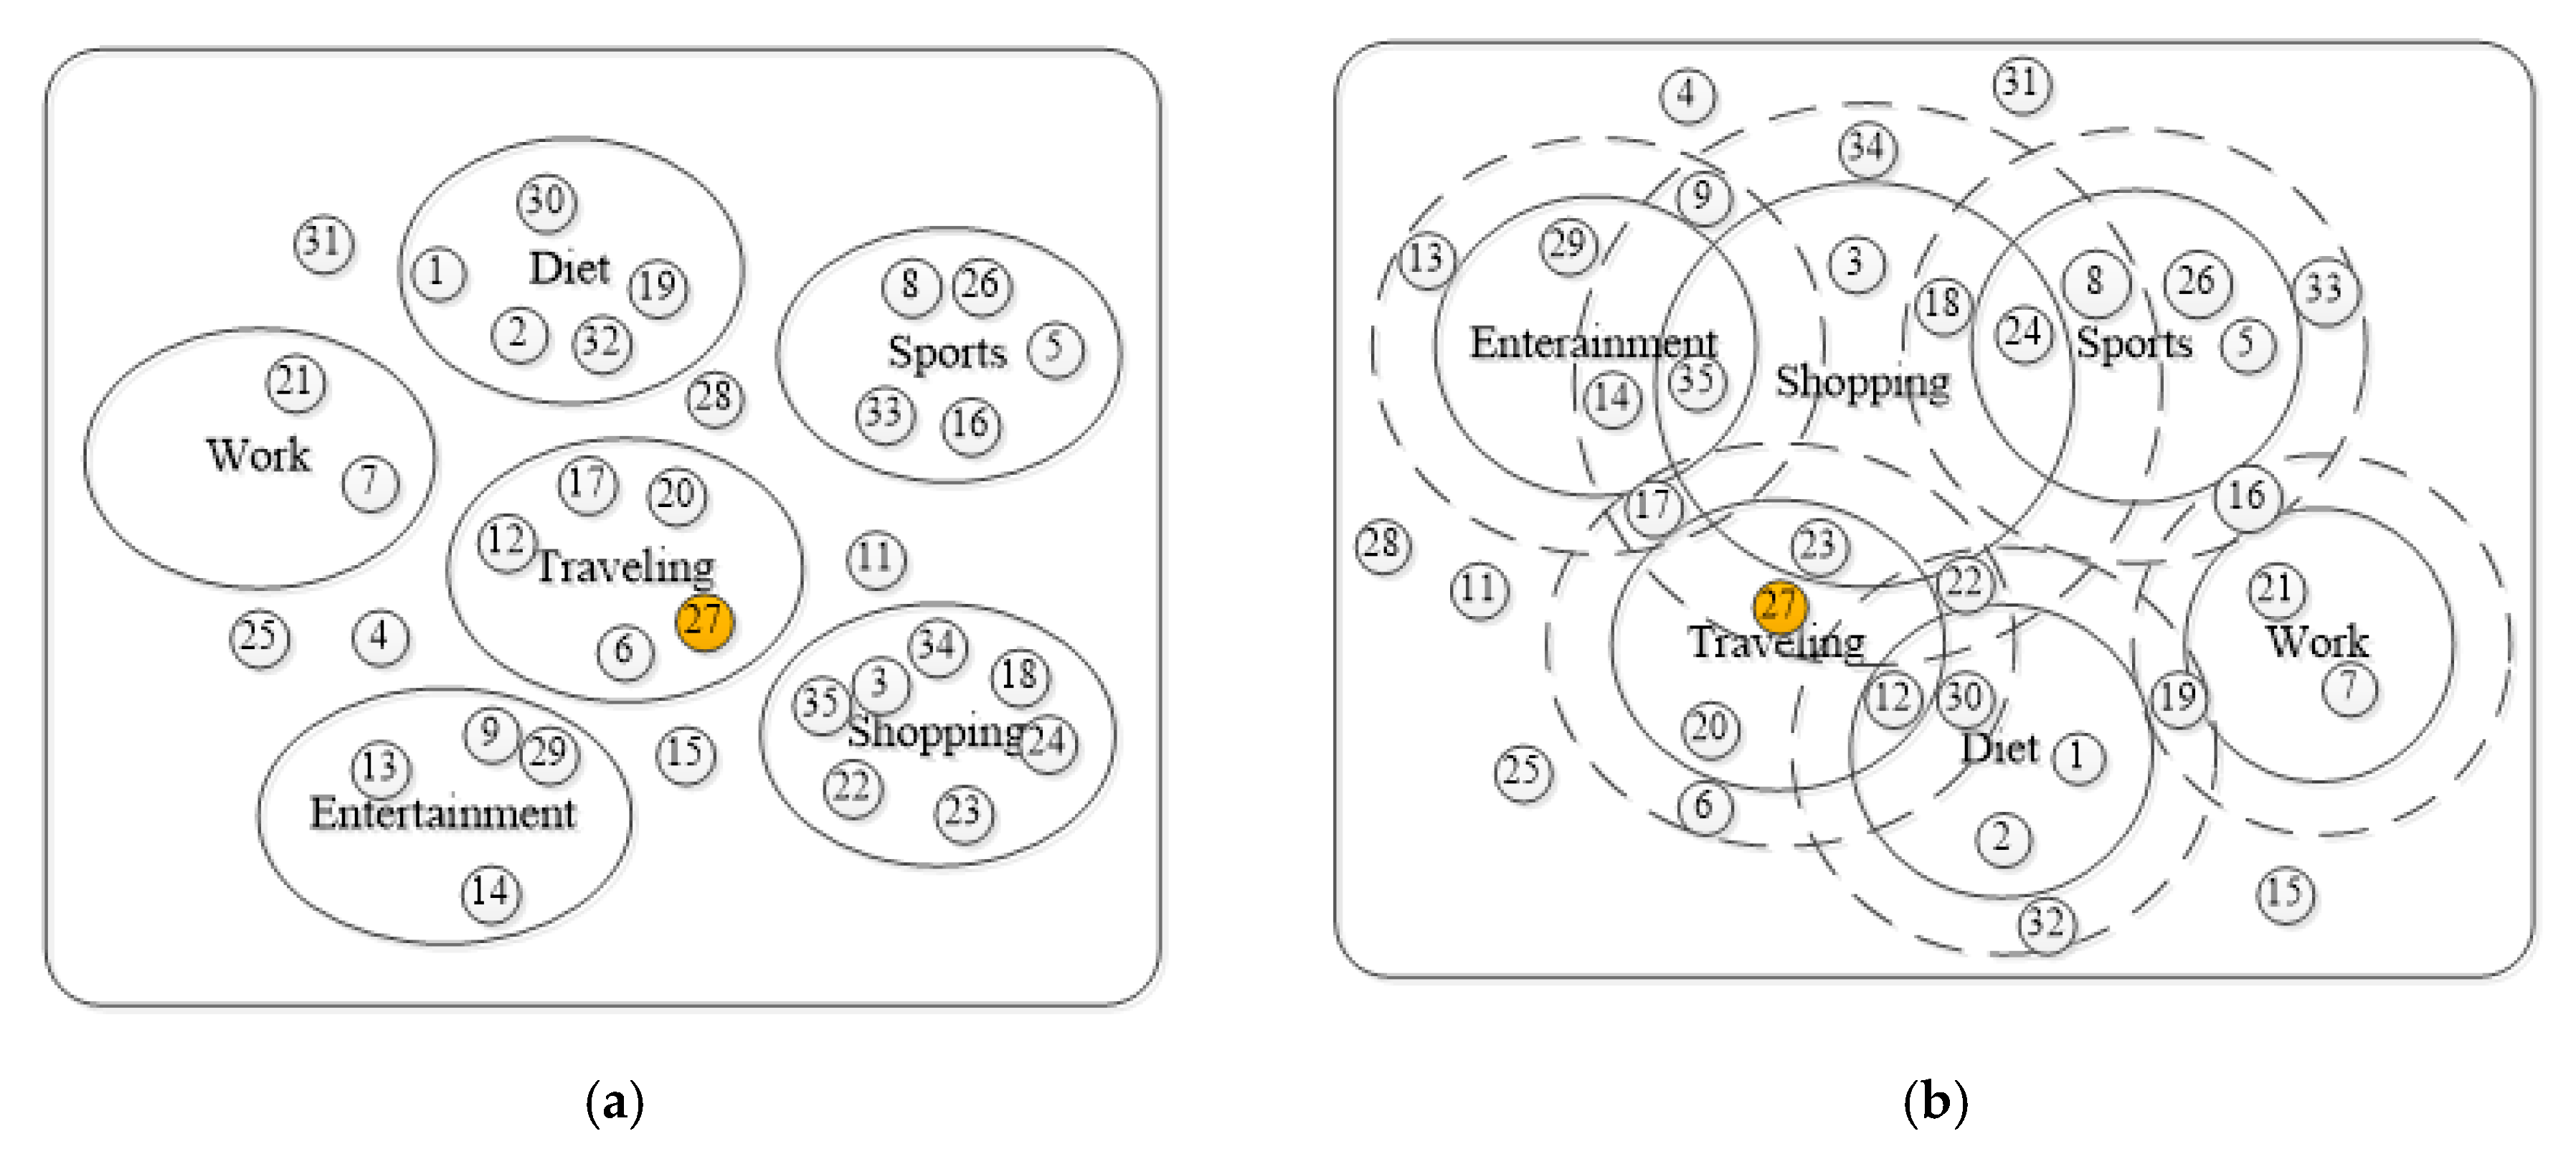
Figure 4 shows activity document distribution scenarios by two-way method (
Figure 4a) and three-way method (
Figure 4b) in online social networks. The small numbered circle indicates the active document. Take document 27 (orange circle in
Figure 4) as an example, it can belong to the positive region of the traveling field and the boundary region of the shopping field concurrently, while only in the traveling field by the two-way method.
To represent activity field with the three-way method, the correlation between the activity field and activity document is defined firstly.
Definition 1. The correlation between activity document pdi and activity field aj is defined as follows:where R denotes the dimension of the normalized word frequency vector TF, tfr is rth element in vector TF, means the normalized frequency of the word wr in an activity text w. Similarity (wr,aj) represents Cosine similarity [30] between word wr and the activity field aj, and given by the following equations:where xt and yt respectively represent the tth components of vectors of word wr and word aj, and T denotes the dimension of components. In order to facilitate subsequent calculations, the value of cor(pdi,aj) is normalized, which is re-represented as Ncor(pdi,aj). Based on the Bayesian decision theory, Yu [
31] introduced a decision-theoretic rough set model, which was a flexible probabilistic model of three-way decisions. One will make acceptance or rejection decisions for more objects with some tolerance of error base on a pair of thresholds (
α,
β) with 1 >
α >
β > 0. A three-way representation of the activity field is generalized, which divides each activity field into three pair-wise disjoint regions:
The activity document in POS(aj) definitely belongs to the activity field aj, the region of POS(aj) is called the positive region. The activity document in NEG(aj) definitely does not belong to aj, the region of NEG(aj) is called the boundary region. The object in BND(aj) belongs to the boundary region of aj. The setting of value α and β will be explained in the experimental part.
4.3. Interaction Strength Estimation Integrates Activity Field Preference and Interactive Habit
The interaction strength is triggered by the interaction between user pairs, which reflects relationship strength between pairs. We treat it as one of the dimensions to measure the relationship strength between user ui and uj, which is donated by IS(ui,uj). Due to the direction of user interaction, two users in a pair are distinguished into the target user and source user, and then the interactive behaviors initiated by the target user are concerned. The measurement of IS(ui,uj) integrates the contribution weight of the activity field preference and the contribution weight of the interactive habit of users, where ui and uj are denoted by the target and source user, respectively.
4.3.1. Estimation of Contribution Weight of Activity Field Preference
Different users have various degrees of preference for diverse activity fields. If some user’s interactive behaviors for an activity field ai are common, their high frequency may be due to the user’s enjoyment for ai rather than the strong connection with his friends. The user’s high frequency interaction in the preference field has a small reflection on the interaction strength, that is, the weight of the user’s interaction behaviors in his preference field is small. On the contrary, if the other user’s uncommon interactive behaviors for ai turn to be frequent, the behaviors are more likely due to the strong connection with his friends rather than his enjoyment. The user’s high frequency interaction in his dislike field reflects the interaction strength obviously, that is, the interactive behaviors arising in the user’s dislike field have a greater weight. Hence, it is necessary to introduce the contribution weight of the activity field preference into the interaction strength measurement.
Focusing on the target user
ui, firstly
is calculated, which is defined as the number of interactions from
ui to the related field
al (
) over the total number of interactions from
ui to the all related field:
where
L denotes the total number of activity field categories, which are six in this paper.
Then, referring to the idea of inverse document frequency by the TF-IDF algorithm [
32], it is an information retrieval technique and used to measure how important a term is:
where |SD| donates the total number of documents, and
represents the number of documents with term
t in it.
|S| is used to represent the total number of user interaction by target user u
i actively,
to indicate the number of users that is interacted by target user
ui to related field
al, and the inverse interactive object frequency (
IIUFi,al) is proposed to measure the interaction (the interaction is initiated by user
ui to related field
al) whether concentrated. While for the online social situation, the user may never initiate interaction with others. Hence, 1 is added to the elements in the molecule to improve the above formula, which can avoid the unexpected occurrence of
log0:
The contribution weight of the activity field preference of user
ui to the related filed
al can be calculated as follows:
Furthermore, the activity documents in disparate regions indicate their different importance in the field. It is necessary to consider diverse regions when calculating the contribution weight of the activity field preference. Since the activity document in the negative region indicates that is irrelevant to the activity field and cannot reflect the individual’s activity field preferences. Only the activity documents of the positive and boundary regions are considered in the calculation of the contribution weight of the activity field preference.
The contribution weight of the activity field preference related to the positive region and boundary region are presented as
,
, respectively. In this scenario,
and
are given by a new definition.
is indicated as the number of interactions from
ui to the region (positive or boundary) of activity field
al over the number of interactions from
ui to the corresponding region of all activity fields. When the region is positive,
is represented by
, when the region is a boundary,
is used. For inverse interaction object frequency
IIUFi,al of target node
ui, when the interactions are in positive and boundary region of activity field
al,
and
are used, respectively:
where
and
is the number of interactions initiated by target user
ui that is in the positive region and boundary region of the activity field
al, respectively,
and
donate the number of users that target user
ui interacts actively and the interactive document
dn is in the positive region and boundary region of the activity field
al, respectively.
4.3.2. The Estimation of Contribution Weight of User’s Interactive Habit
Everyone’s custom in online social networks is different. Some users are accustomed to browse through friends’ moving news with low sense of participation, while other users enjoy frequent interactions (e.g., likes, comments). If a kind of interactive behavior is common, that means the high frequency of this interactive behavior reflecting the strong interaction strength is less obvious, and interactive behavior owns less weight. The opposite is true, that a kind of uncommon interactive behavior owns larger weight. It has the same meaning as “When a thing is scarce, it is precious.” Since, it is necessary to introduce the contribution weight of the interactive habit into the interaction strength measurement. Looking at all sorts of SNS (Social Networking Services) platforms, the essential interactive behaviors including likes, comments and replies over all behaviors involved are chosen from the discussion.
For each target node ui, the estimation of the contribution weight of the interactive habit consists of three steps:
In the first step,
is used to denote a ratio of the number of interactive behaviors
bk initiated by target user
ui (
) to all the interactive behaviors by him:
where
b1,
b2,
b3 is used to represent the interactive behavior of like, comment, reply, respectively.
In the second step, let
be the inverse interactive behavior frequency of
bk from user
ui:
where
is the number of interactive behavior
bk from the target user
ui.
For the third step, the contribution weight of interactive behavior
is calculated by the following equations:
4.3.3. The Estimation of Interaction Strength
Based on the calculated contribution weight of the activity field preference (
) and interactive habit (
), the interaction strength (
IS(
ui,
uj)) is measured to donate the interactive behavior from target user
ui to source user
uj:
where
is the number of the interactive behavior
bk from
ui to
uj and related to activity field
al.
Based on the idea of the positive region and boundary region of activity fields, the calculation of interaction strength can be divide into two parts, one part reflected by the interaction behaviors of the positive region that is denoted by
, and the other part is in the boundary region represented by
:
where
and
represent the number of the interactive behavior
bk (
bk is initiated by user
ui to source user
uj) in the positive region and boundary region of
al, respectively.
On the basis of different important degrees of the positive region and boundary region, the final interaction strength is obtained by weight summing of the interaction strength in these two regions:
where
γ1 and
γ2 represent the weight coefficient of interaction strength in the positive region and boundary region, respectively. Since they are related to the values of
α and
β in Equation (3), these two weight coefficients satisfy
γ1 +
γ2 = 1 are defined as follows:
4.4. Calculation of Common Friend Rate and the Similarity of User’s Feature Attributes
The more common friends of the user pairs and the more similar their social circle is, the tighter the relational network will be [
18]. Therefore, it is necessary to quantify design measurements for the factor of a common friend. The degree of overlapping of friend groups is considered in this paper. Lee et al. [
33] introduced a similarity between two user communities as follows:
where
Ci is the friend set of target user
ui, and
Cj is the friend set of source user
uj. What is more, in fact, some earlier studies [
18,
34] demonstrated that direction is one of characterization of relations. Garton, Haythornthwaite and Wellman [
35] proposed the ties changed in content, direction and strength. For direction, while pairs both share friendship, the relationship may be unbalanced: one user may claim a close friendship and the other a weaker friendship, or communication may be initiated more frequently by one actor than the other. Thus, when the relationship is shared, its expression may be asymmetrical. The measurement method for the direction of relations by focusing on the target user of a pair is generalized, and
CFR(
Ci,
Cj) is used to donate the common friend rate as follows:
Besides, the similarity of the user’s feature attribute is another dimension of relationship strength measurement, which is measured based on the posts of the user pair. Distance formulas are widely used in the similarity measurement, such as Euclidean distance, Manhattan distance [
36,
37], Chebyshev distance [
38,
39], Minkowski distance [
40,
41] and so on. Among those models, the squared Euclidean distance calculation is the most popular for practical application, therefore, it is adopted to measure the similarity of the user’s feature attribute.
The proportion of the user’s posts in a positive and boundary region of every activity field is recorded as the value of the user’s feature attributes. Estimating the feature attributes similarity of the target user
ui and source user
uj by the model of squared Euclidean distance, the smaller the distance means, the higher similarity of feature attributes between user pair. Considering the different correlation of the diverse region to every activity field, the weight coefficients of the user’s feature attributes distance in the positive region and boundary region are set as the method in
Section 4.3.1. The feature attributes distance formula is defined as following:
where
posFil and
posFjl donate the proportion of posts in the positive region and posted by user
ui and user
uj, respectively.
bndFil and
bndFjl are the proportion of posts in the boundary region and posted by user
ui and user
uj, respectively.
Then, the similarity of feature attributes between user
ui and
uj is denoted by
SimF(
ui,
uj):
where
Maxdis is the maximum value of all
DisF(
ui,
uj).
4.5. The Estimation of Relationship Strength
Based on the definition of relationship strength given by Granovetter [
11], many existing research utilizes the linear combination model to calculate the relationship strength with some progress [
18,
42,
43]. In this paper, a linear combination model is adopted, then interaction strength, common friend rate and the similarity of feature attribute are integrated as three dimensions to estimate the relationship strength, and the activity field preference and interactive habit of an individual are introduced. The relationship strength between target user
ui and source user
uj, denoted by
RS(
ui,
uj), is given by:
where
ω1,
ω2,
ω3 indicate the weight coefficients of interaction strength, the common friend rate and the similarity of the feature attribute, respectively.
ω1+
ω2+
ω3 = 1,
ω1,
ω2,
ω3 ∈ [0,1] and the value of
ω1,
ω2 and
ω3 are set by making an experiment; it will be explained in the experimental part.
5. Experiment
The dataset is downloaded from Wechat Moments, which consists of friends in the Wechat contacts. There, we can post text-based updates, upload up to nine images as well as share videos and articles, just like Facebook Timeline or Twitter News Feed. To download data from Wechat Moments, ten users are selected randomly as seed nodes firstly. After obtaining their consents, all activities data (posts, likes and comments) from their Moments in a month were downloaded. It is divided into post documents (the detailed example is given in
Table 1), interactive documents (the detailed example is given in
Table 2) and user list (the detailed example is given in
Table 3). For post document, including posted user ID (UserId) and content of the post (P_content). For interactive document, including the ID of the user who initiates interaction (AuthorId) and receives interaction (toUserId), interactive content (I_content). All users’ ID (UserId) and nickname (UserName) are organized in the user list.
In order to reduce the experimental error, ten seed nodes were randomly selected five times, the final experimental results are determined by averaging five evaluated results. The amount of data included in each data set is shown in
Table 4.
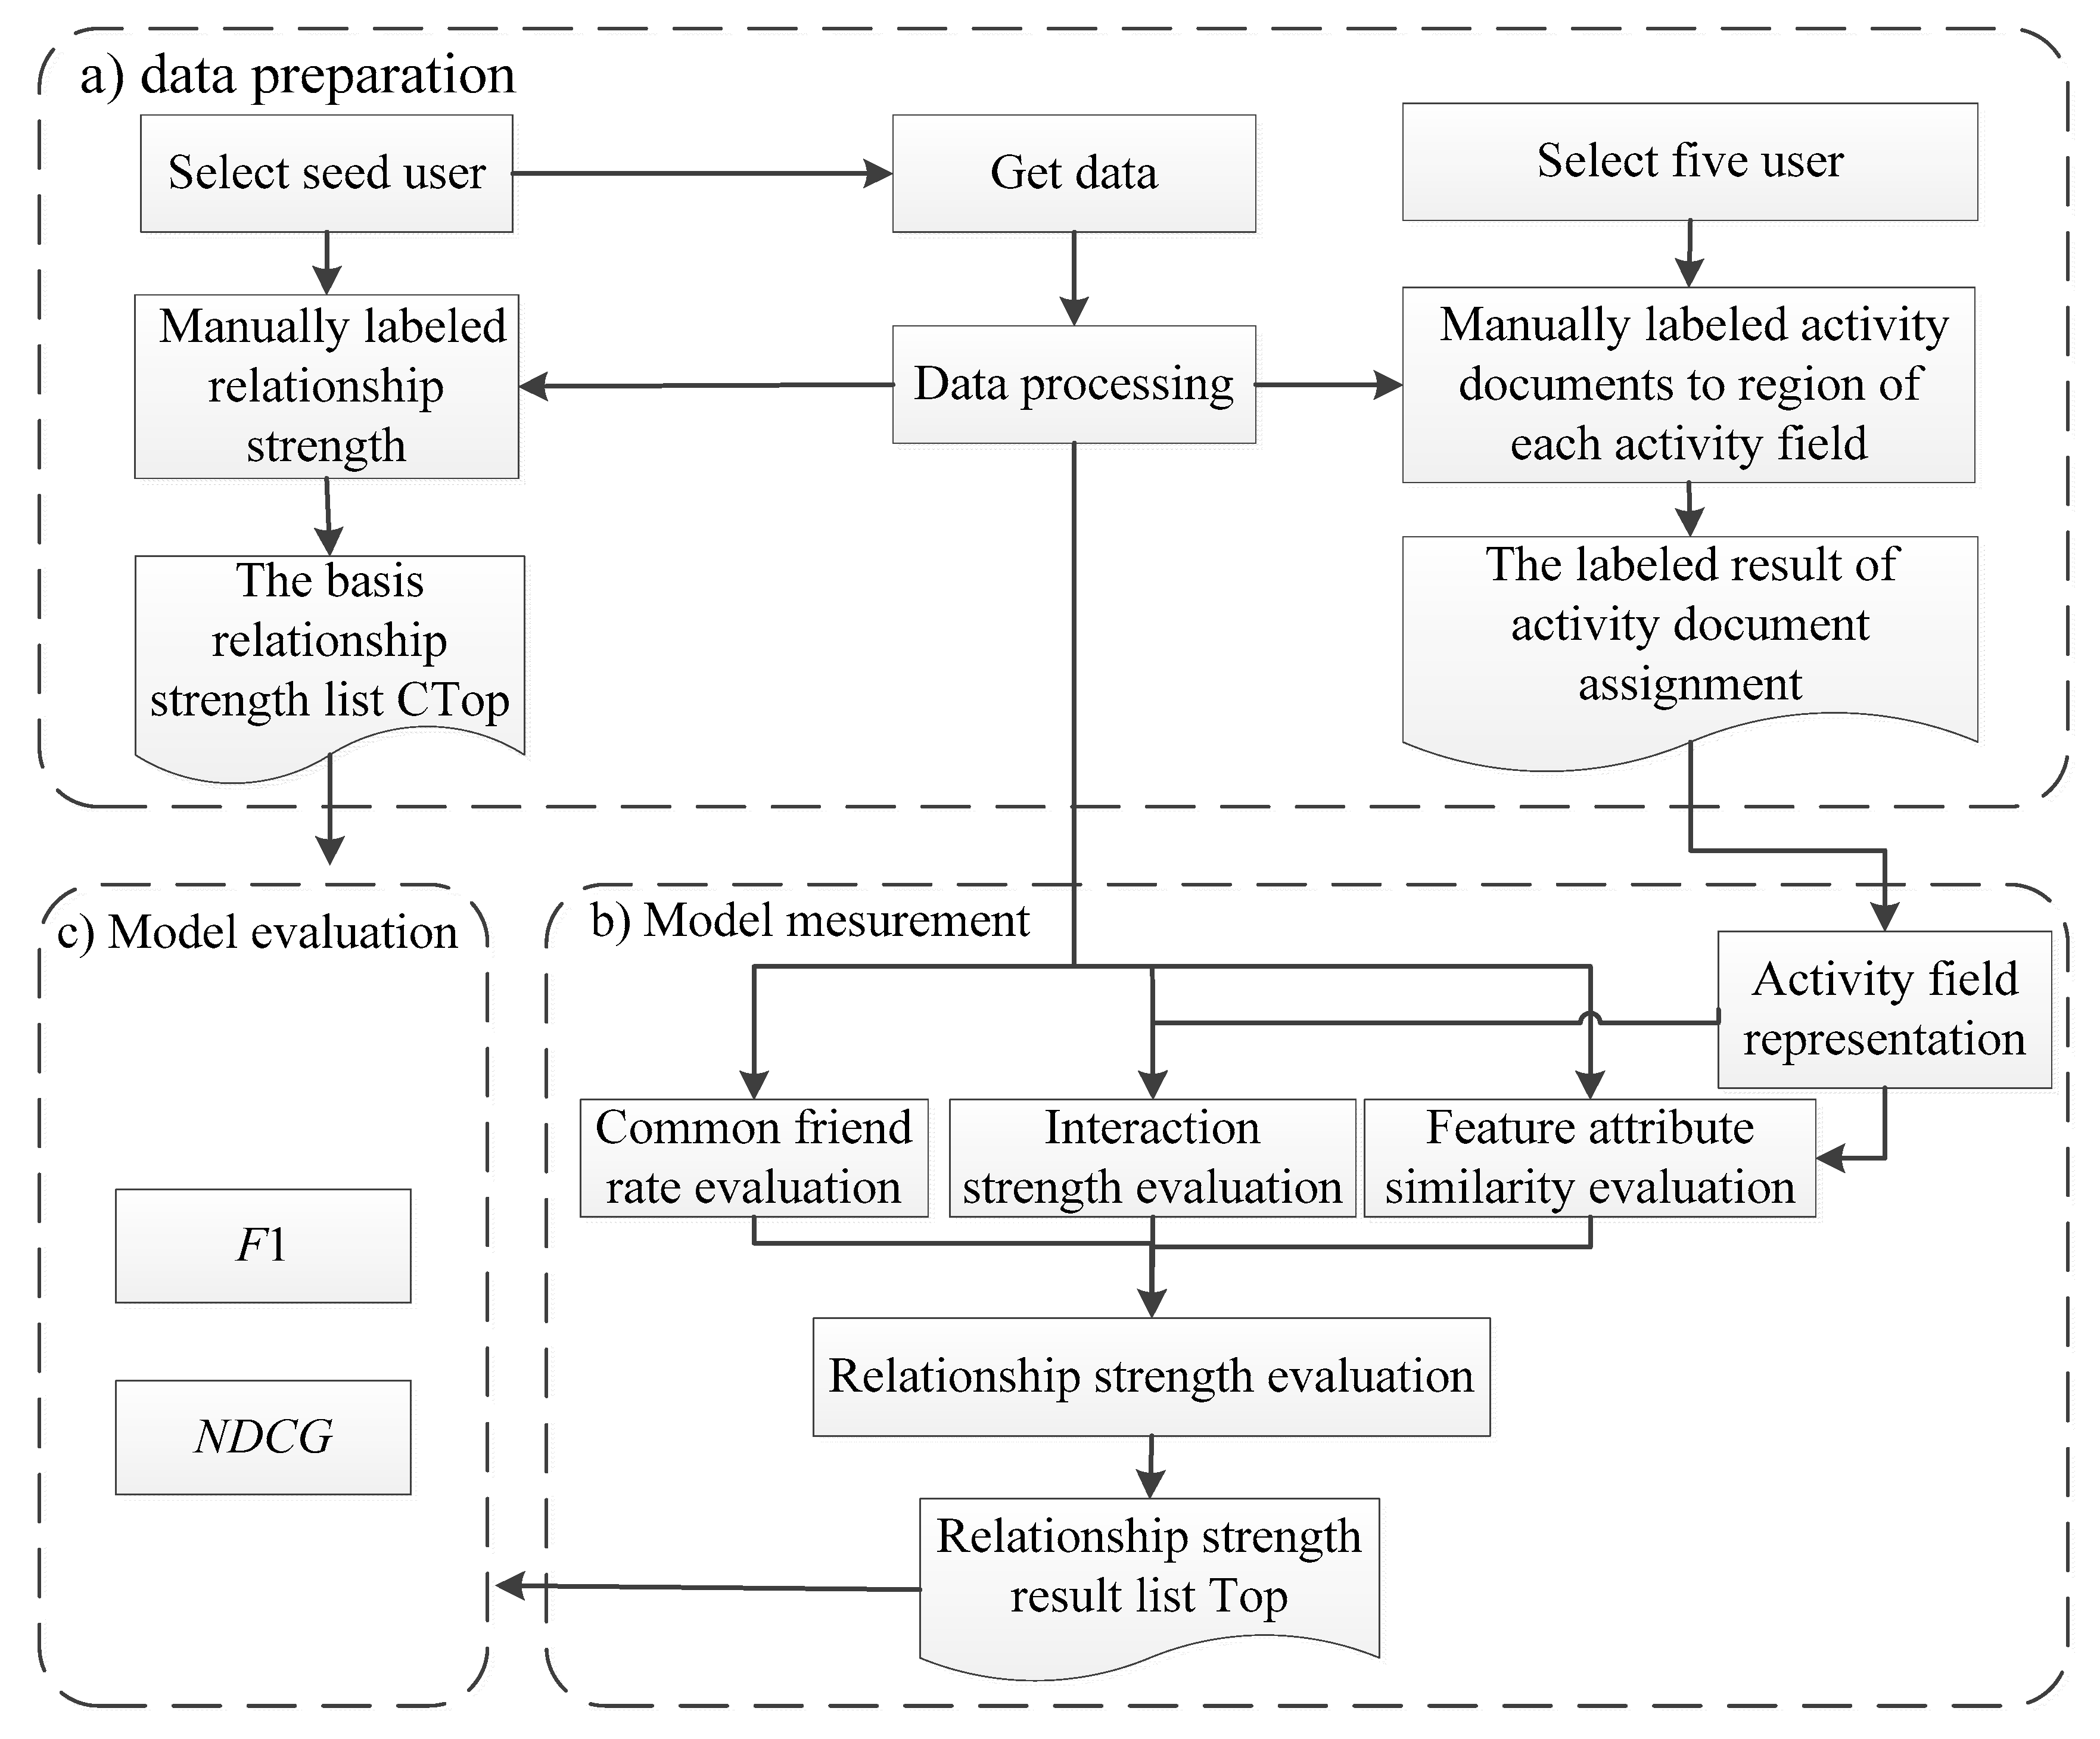
To evaluate the performance, a manual labeling procedure is adopted to generate the ground truths, which contains two parts: the ground truth for the activity document and the ground truth for the relationship strength. For the first part, five persons are asked to manually label each of the post document and interactive document, where each document is assigned into the positive, boundary, or negative region of each activity field (‘‘diet’’, ‘‘entertainment’’, ‘‘shopping’’, ‘‘sports’’, “traveling’’, ‘‘work’’). The final label result is established through majority voting among these five persons. For the second part, ten seed users are asked to label the relationship strength. The labeled score is from 1 to 10, the stronger the relationship strength is, the higher the score is. For each seed user, a list of his friends is provided, and each list shows the user ID and username of friends (according to user list as showed in
Table 3) to help seed users identify their friends. Friends are ranked based on the labeled score, friends with stronger relationship are placed at the top of list, and record it as the Ctop. Furthermore, top
n friends of ranked list are donated by the Ctop
-n, which is taken as the comparison basis in the experiment. The calculation result of relationship strength using the method stated in this paper is also ranked, it is remarked as the Top, and the top
n friends is remarked as the Top-
n. The effectiveness of the approach of this paper is verified by comparing the Top-
n with Ctop
-n. The experimental process is shown in
Figure 5.
5.1. Evaluation Metric
Precision and recall are the basic criteria for evaluation of retrieval quality in information retrieval systems. Precision (
P) is defined as the number of true positives (
TP) over the number of true positives plus the number of false positives (
FP). Recall (
R) is defined as the number of true positives (
TP) over the number of true positives plus the number of false negatives (
FN). For the analysis of relationship strength,
TP is the number of friend users appearing in both the list Ctop-
n and Top-
n,
FP is the number of friend users who are not in list Ctop-
n but in Top-
n,
FN is the number of friend users who are in list Ctop-
n but not in Top-
n:
Generally, precision and recall can reflect two aspects of model performance. It is impossible to comprehensively evaluate the performance of a model relying on only one of these two metrics. Hence, F1 is introduced as a comprehensive metric to balance the influence of precision and recall and improve the evaluated accuracy.
When considering the top
n friends, the value of precision, recall and
F1 are recorded as
Pn,
Rn,
F1, respectively:
The final F1n is averaging F1n from all target users.
In addition,
NDCG is an indicator of PageRank which is widely used in the search engine. It considers both the importance of searching results and the relative location of searching results.
NDCG is a metric that is widely used to evaluate the relationship strength measurement [
34,
41,
44]. Hence,
NDCG is chosen as another evaluation metric for performance comparison, which is defined as follows:
where
DCGn is the discounted cumulative gain, and
iDCGn is the ideal discounted cumulative gain that refers to
DCGn of Ctop-
n. The calculation of
DCGn is defined as the following:
The order of users who are in the Ctop-n list are rearranged according to their order in the Top list, Top’-n is used to record this remarked result. reli indicates the relationship strength of the user in the location i of Top’-n.
5.2. Setting of Weight Coefficient
In
Section 4.2, the threshold value of
α,
β will affect the accuracy of the activity field representation. Different threshold values are set, the “accuracy” is adopted to compare the result of the proposed activity field representation with the labeled result, and the optimal threshold is got subsequently. The “accuracy” indicates the ratio of the total times that documents are assigned to the correct activity fields regions in all assignments. In the labeled result, the major documents are in the negative region. If all activity document data are used for experiments, referring to the definition that the activity document
pdi is in the negative region of field
aj when cor(
pdi,
aj) <
β, the larger value of
β will achieve the higher accuracy. It will affect the accurate judgment of the threshold. This problem is solved by randomly selecting equal amounts of three types (belong to the positive region, boundary region and negative region) of labeled result data for experiments. The values of
α and
β are set as 0, 0.1, 0.2, …, 1, respectively, and satisfy
α <
β simultaneously. Therefore, there are 55 possible combinations. Maximum accuracy reaches 0.732 when
α = 0.7,
β = 0.8.
In addition, there is another set of weight coefficients that needs to be determined experimentally. The weighting coefficients ω1, ω2, ω3 in Equation (22) will affect the accuracy of the relationship strength calculation results. In the experiment, the value of ω1, ω2 and ω3 are also set as 0, 0.1, 0.2, …, 1 to calculate NDCGn, and ω1+ ω2 + ω3 = 1 is satisfied, there are 64 combinations. Friends in the top 50 are considered, and find that when ω1 = 0.4, ω2 = 0.3, ω3 = 0.3, the value of NDCGn reaches a maximum of 0.78. The next experiment is based on these values.
5.3. Evaluation of the Relationship Strength Measurement
In this paper, the proposed method of relationship strength measurement is based on activity field preference and interactive habit (AFP-IH). In order to illustrate the impact of the activity field preferences and interactive habits of individual on the relationship strength measurement, two comparative experiments (these experiments are donated as AFP-IH-1 and AFP-IH-2, respectively) are designed. AFP-IH-1 only neglect the user’s activity field preference and uses the cosine formula to measure the text similarity that the user pair posted. AFP-IH-2 only ignores the user’s interactive habits. Moreover, in order to explain the rationality of the three-way method in representation of the activity field, a third comparative experiment (AFP-IH-3) is designed by using the two-way method to represent the activity field and carry out the relationship strength measurement.
Firstly, various methods are compared with different
n based on the evaluation metric of
F1
n. The result in
Figure 6 shows that as
n increases, the value of
F1 gradually increases, indicating that the performance of the relationship strength measurement model increases with the number of users. What is more, the evaluated value (
F1) of AFP-IH is the largest under different
n, indicating that the performance of AFP-IH is better than the other three models.
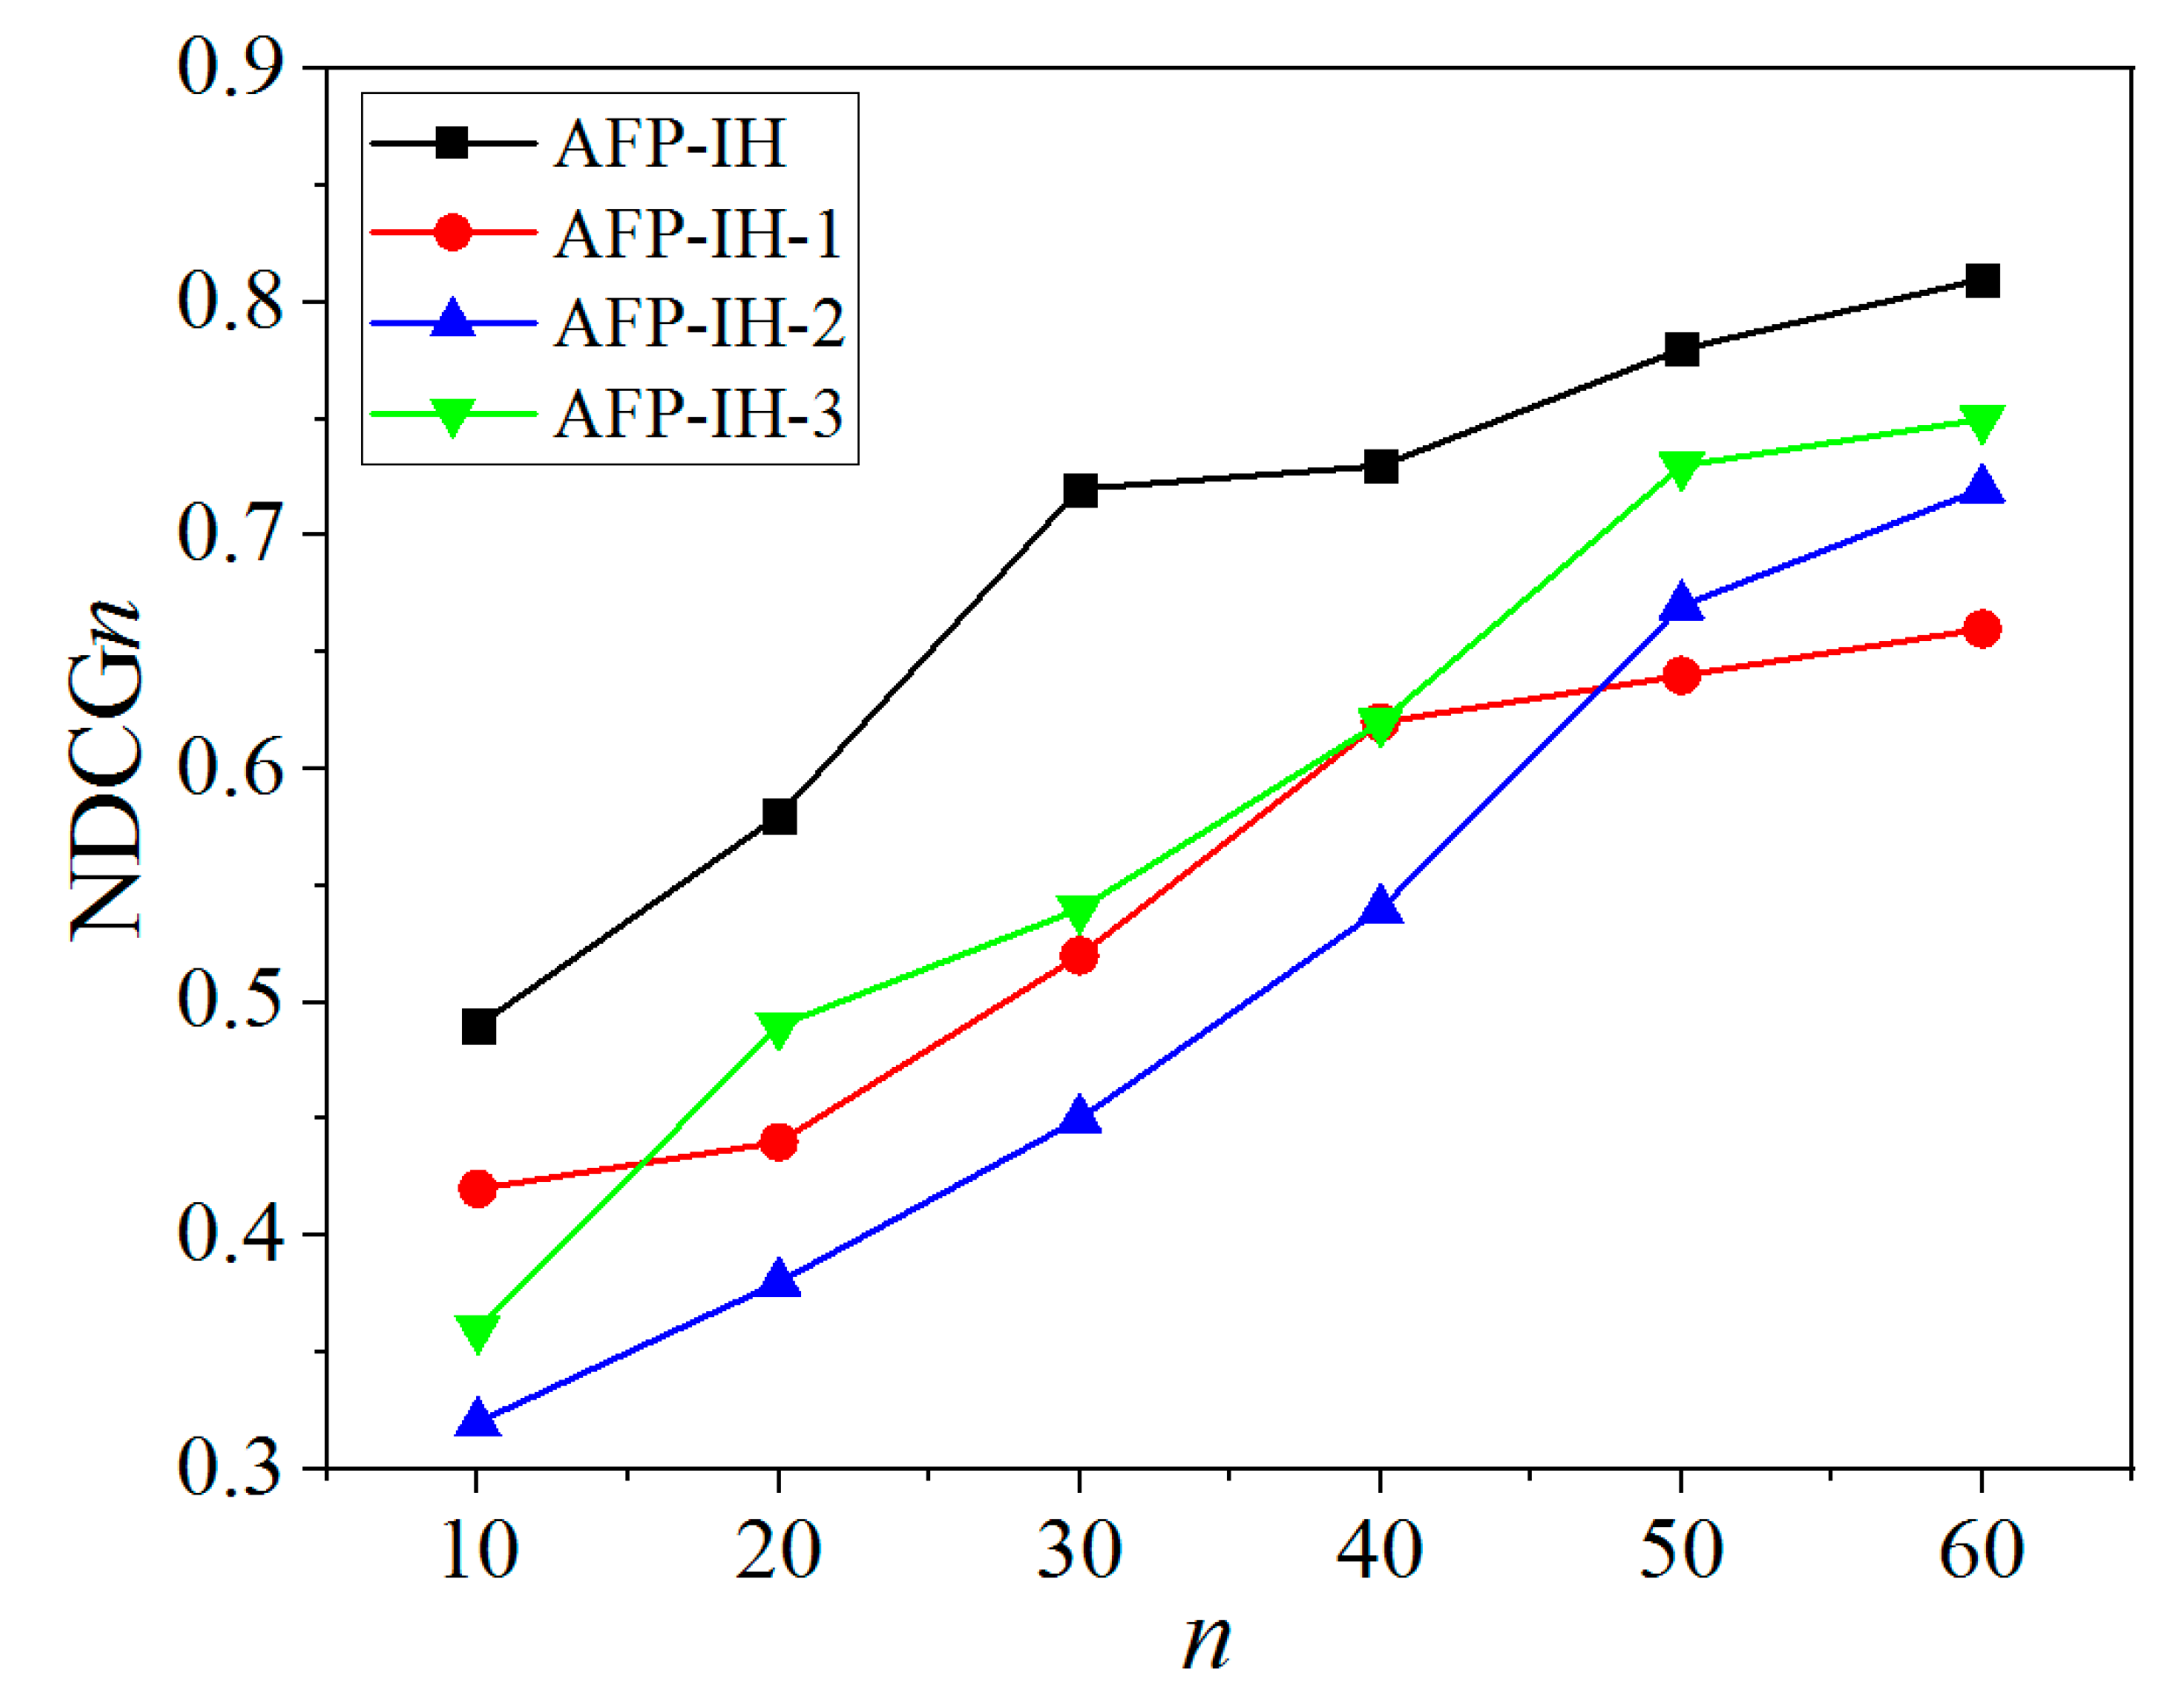
Secondly, various methods are compared with different
n based on the evaluation metric of
NDCGn, as shown in
Figure 7. The value of
NDCGn gradually increases with increasing
n, indicating that the performance of the relationship strength measurement model increases with the number of users. The value (
NDCGn) of the AFP-IH method is the largest, which further indicates that this method is superior to the other three methods. What is more, it can be clearly seen that the relationship between the three methods of AFP-IH-1, AFP-IH-2 and AFP-IH-3 is that the value (
NDCGn) of AFP-IH-3 is generally higher than methods AFP-IH-1 and AFP-IH-2. It indicates that performance of AFP-IH-3 is better than AFP-IH-1 and AFP-IH-2. Additionally, for AFP-IH-1 and AFP-IH-2, there is a cut-off point around
n = 47, the value (
NDCGn) of the method AFP-IH-1 is higher than that of AFP-IH-2 when
n < 47, the value (
NDCGn) of method AFP-IH-1 is lower than that of AFP-IH-2 when
n > 47. It indicates that when the considered top friends are less than 47, AFP-IH-1 is superior to AFP-IH-2, when the number of users is more than 47, AFP-IH-2 is more effective than AFP-IH-1.
6. Discussion and Results
This research emphasizes to improve the performance of the relationship strength measurement model under personalized recommendation service. Based on the evaluation results of comparative method, the following results are concluded:
The performance of the model can be improved by introducing activity field preferences and personal interactive habits into the calculation of relationship strength, and using the three-way method to represent the active field. Comparing AFP-IH with AFP-IH-1, AFP-IH-1 does not consider the influence of personal activity field preferences on the user’s interaction. But due to the user’s personal interests, individuals have specific preferences for content which involve some aspects, and they are more likely to participate in the interaction of the preferred content. The user will initiate interaction when attracted by the posts of his friends rather than their close relationship. As a result, AFP-IH-1 is less accurate. Therefore, it is necessary to consider activity field preferences on relationship strength measurement. For comparison of AFP-IH and AFP-IH-2, AFP-IH-2 does not consider the influence of personal interactive habits on the user’s interaction. However, some users will form habitual interaction behaviors when they must meet the need for communication that is not based on their identity. For everyone, different interaction behaviors imply various levels of identification, which can reflect the relationship strength between users to varying degrees. AFP-IH-2 is worse. Therefore, it is necessary to consider the interaction habit on relationship strength measurement. AFP-IH is also more excellent than AFP-IH-3, the reason is that AFP-IH-3 utilizes the two-way method to represent activity fields, the activity document only belongs to one activity field. However, in practice, the content of the activity document may involve multiple activity fields simultaneously, and the relationship between some contents and the activity field will be ambiguous. AFP-IH adopts the three-way method instead of the two-way method to represent the activity field much more applicable. The division of the boundary region in the activity field solves the classification problem of ambiguous documents to improve the rationality and accuracy of representation of the activity field. The issue of activity fields is inevitably involved, so AFP-IH improves the performance of the results.
The influence degree of the activity field preferences, personal interactive habits and three-way representation of activity fields on the performance of relationship strength measurement is different. For method AFP-IH-1, AFP-IH-2 and AFP-IH-3, the performance of AFP-IH-3 is obviously better than AFP-IH-2 and AFP-IH-1. AFP-IH-1 does not consider the influence of the personal activity field preferences on the user’s interaction, AFP-IH-2 does not consider the influence of personal interactive habits on the user’s interaction, and AFP-IH-3 utilizes the two-way method rather than three-way method to represent activity fields. It shows that the influence degree of the activity field preferences, individual interactive habits, and three-way representation of activity fields on the performance of relationship strength measurement is different. The first two have a greater impact on the accuracy of relationship strength predictions than the third. When considered, top friends are less than a numerical value (e.g., 47, shown in the above experimental result), AFP-IH-1 is superior to AFP-IH-2, it shows that the influence of individual interactive habits on improving relationship strength measurement performance is more obvious. Additionally, when the number of users is more than 47, AFP-IH-2 is better than AFP-IH-1, indicating that the influence of individual activity field preferences on performance improvement of relationship strength measurement is more obvious.
7. Conclusions
Social recommendation has become an extremely common analysis hotspot in recent years. It integrates the relationship of the user in online social networks to promote the recommendation result, and the measurement of relationship strength is an important part in this research field. An excellent relationship strength measurement method meets high accuracy.
In this paper, a method of relationship strength measurement based on the user’s activity field preference and interactive habit is proposed. The three-way method is utilized to represent each activity field firstly that presents an activity field with three regions and allows us to further calculate the contribution weight of the activity field preference based on interactive documents in positive and boundary regions. The contribution weight of individual interaction habit is calculated by different type of interactions. Finally, interaction strength, common friend rate and user feature attribute similarity are set as three dimensions in this method. Our method is verified with the dataset from Wechat Moments, and the experimental results on this method are distinctly better than those of several compared methods, and four conclusions can be obtained:
The three-way representation of the activity field is superior to the existing methods where only two regions are used, which helps to improve the accuracy of the relationship strength measurement.
Considering the activity field preferences of the individual in measurement of relationship strength between user pairs can improve the accuracy of the result.
Considering the interactive habits of the individual in the measurement model of relationship strength between user pairs can achieve performance improvement of the model.
The effect of individual interactive habits on relationship strength is more significant than the factor of individual activity field preferences and the activity fields represented by three-way.
Besides the recommendation system, the proposed method of this paper can also be used to improve the range and performance of various aspects of online social networks, including:
Link prediction: The system can automatically suggest new connections to users, it could be improved by suggesting those people with top relationship strength to users.
Newsfeeds updates. Newsfeeds (i.e., posts, activities or other stories from friend user) is an important function of an online social network platform. Based on the relationship strength to prioritize the updates when building the user’s personalized newsfeed about their connections, it is beneficial to remove updates from spurious contacts.
People search. Referring to relationship strength between the query sender and discovered people to rank search results, it may contribute to finding an accessible person more quickly for the query sender.
Visualization: The applications of visualizing the user’s local social network could be improved by scaling/shading links according to the estimated relationship strength.
Concerning future work based on these application values of relationship strength, study how to integrate the relationship strength into these applications is the focus.


