Article

Evaluating the Impact of Air Pollution on China’s Inbound Tourism: A Gravity Model Approach

School of Business Administration, Southwestern University of Finance and Economics, Chengdu 611130, China
*
Author to whom correspondence should be addressed.
Sustainability 2020, 12(4), 1456; https://doi.org/10.3390/su12041456
Submission received: 9 January 2020 / Revised: 6 February 2020 / Accepted: 11 February 2020 / Published: 15 February 2020
(This article belongs to the Special Issue Optimal Tourism Development)

Abstract

:
China’s inbound tourism grew very slowly in recent years. This study modelled China’s inbound tourism based on a gravity model with province-level inbound tourist arrivals data from 13 countries of origin between 2010 and 2016. It was found that air pollution in tourist destinations and origin regions both had significant negative impacts on China’s inbound tourism. On average, if the concentration of particulate matter with a diameter of 2.5 micrometers or less (PM 2.5 ) in China and foreign countries increased by 1 μ g/m 3 , inbound tourist arrivals would decline by approximately 1.7% and 3.8%, respectively. The effect of pollution in destination regions is explained by the importance of clean air as a favored characteristic of tourist attractions. The effect of pollution in tourist origin countries is explained by more awareness of and concern about air pollution by potential tourists if they live in more polluted countries. Further analysis showed that the impact of air pollution in destination regions was larger for tourists coming from more polluted and Asian countries, and visiting less polluted and more popular destinations. This study has a clear policy implication: improving air quality can be considered as a straightforward and effective way to promote inbound tourism in China. If air quality in China can be substantially improved in the future, inbound tourist arrivals have the potential to rise by at least tens of millions of person-times.

1. Introduction

Every year, numerous travelers from all over the world visit China for its beautiful scenery, renowned world heritage sites, and mysterious oriental culture. The expansion of the tourism industry has greatly benefited several relevant industries in China, such as tourism product manufacturing, transportation, hotels, and retail businesses [1]. Overall, the tourism industry has effectively promoted macroeconomic growth in many Chinese regions. According to a report released by China’s Ministry of Culture and Tourism [2], in 2018, the tourism sector’s total contribution to China’s gross domestic product (GDP) was 9940 billion CNY, accounting for 11.0% of GDP. Additionally, the tourism sector contributed roughly 28.3 million jobs directly and 51.7 million jobs indirectly. These two numbers together accounted for 10.3% of total employment in China. The World Travel and Tourism Council forecasted that in 2028 the total economic contribution of tourism in China could reach 18,462 billion CNY, as much as 12.9% of GDP. The contribution to job creation was forecasted to be 116.5 million in total, as much as 14.7% of total employment in the coming decade [3].
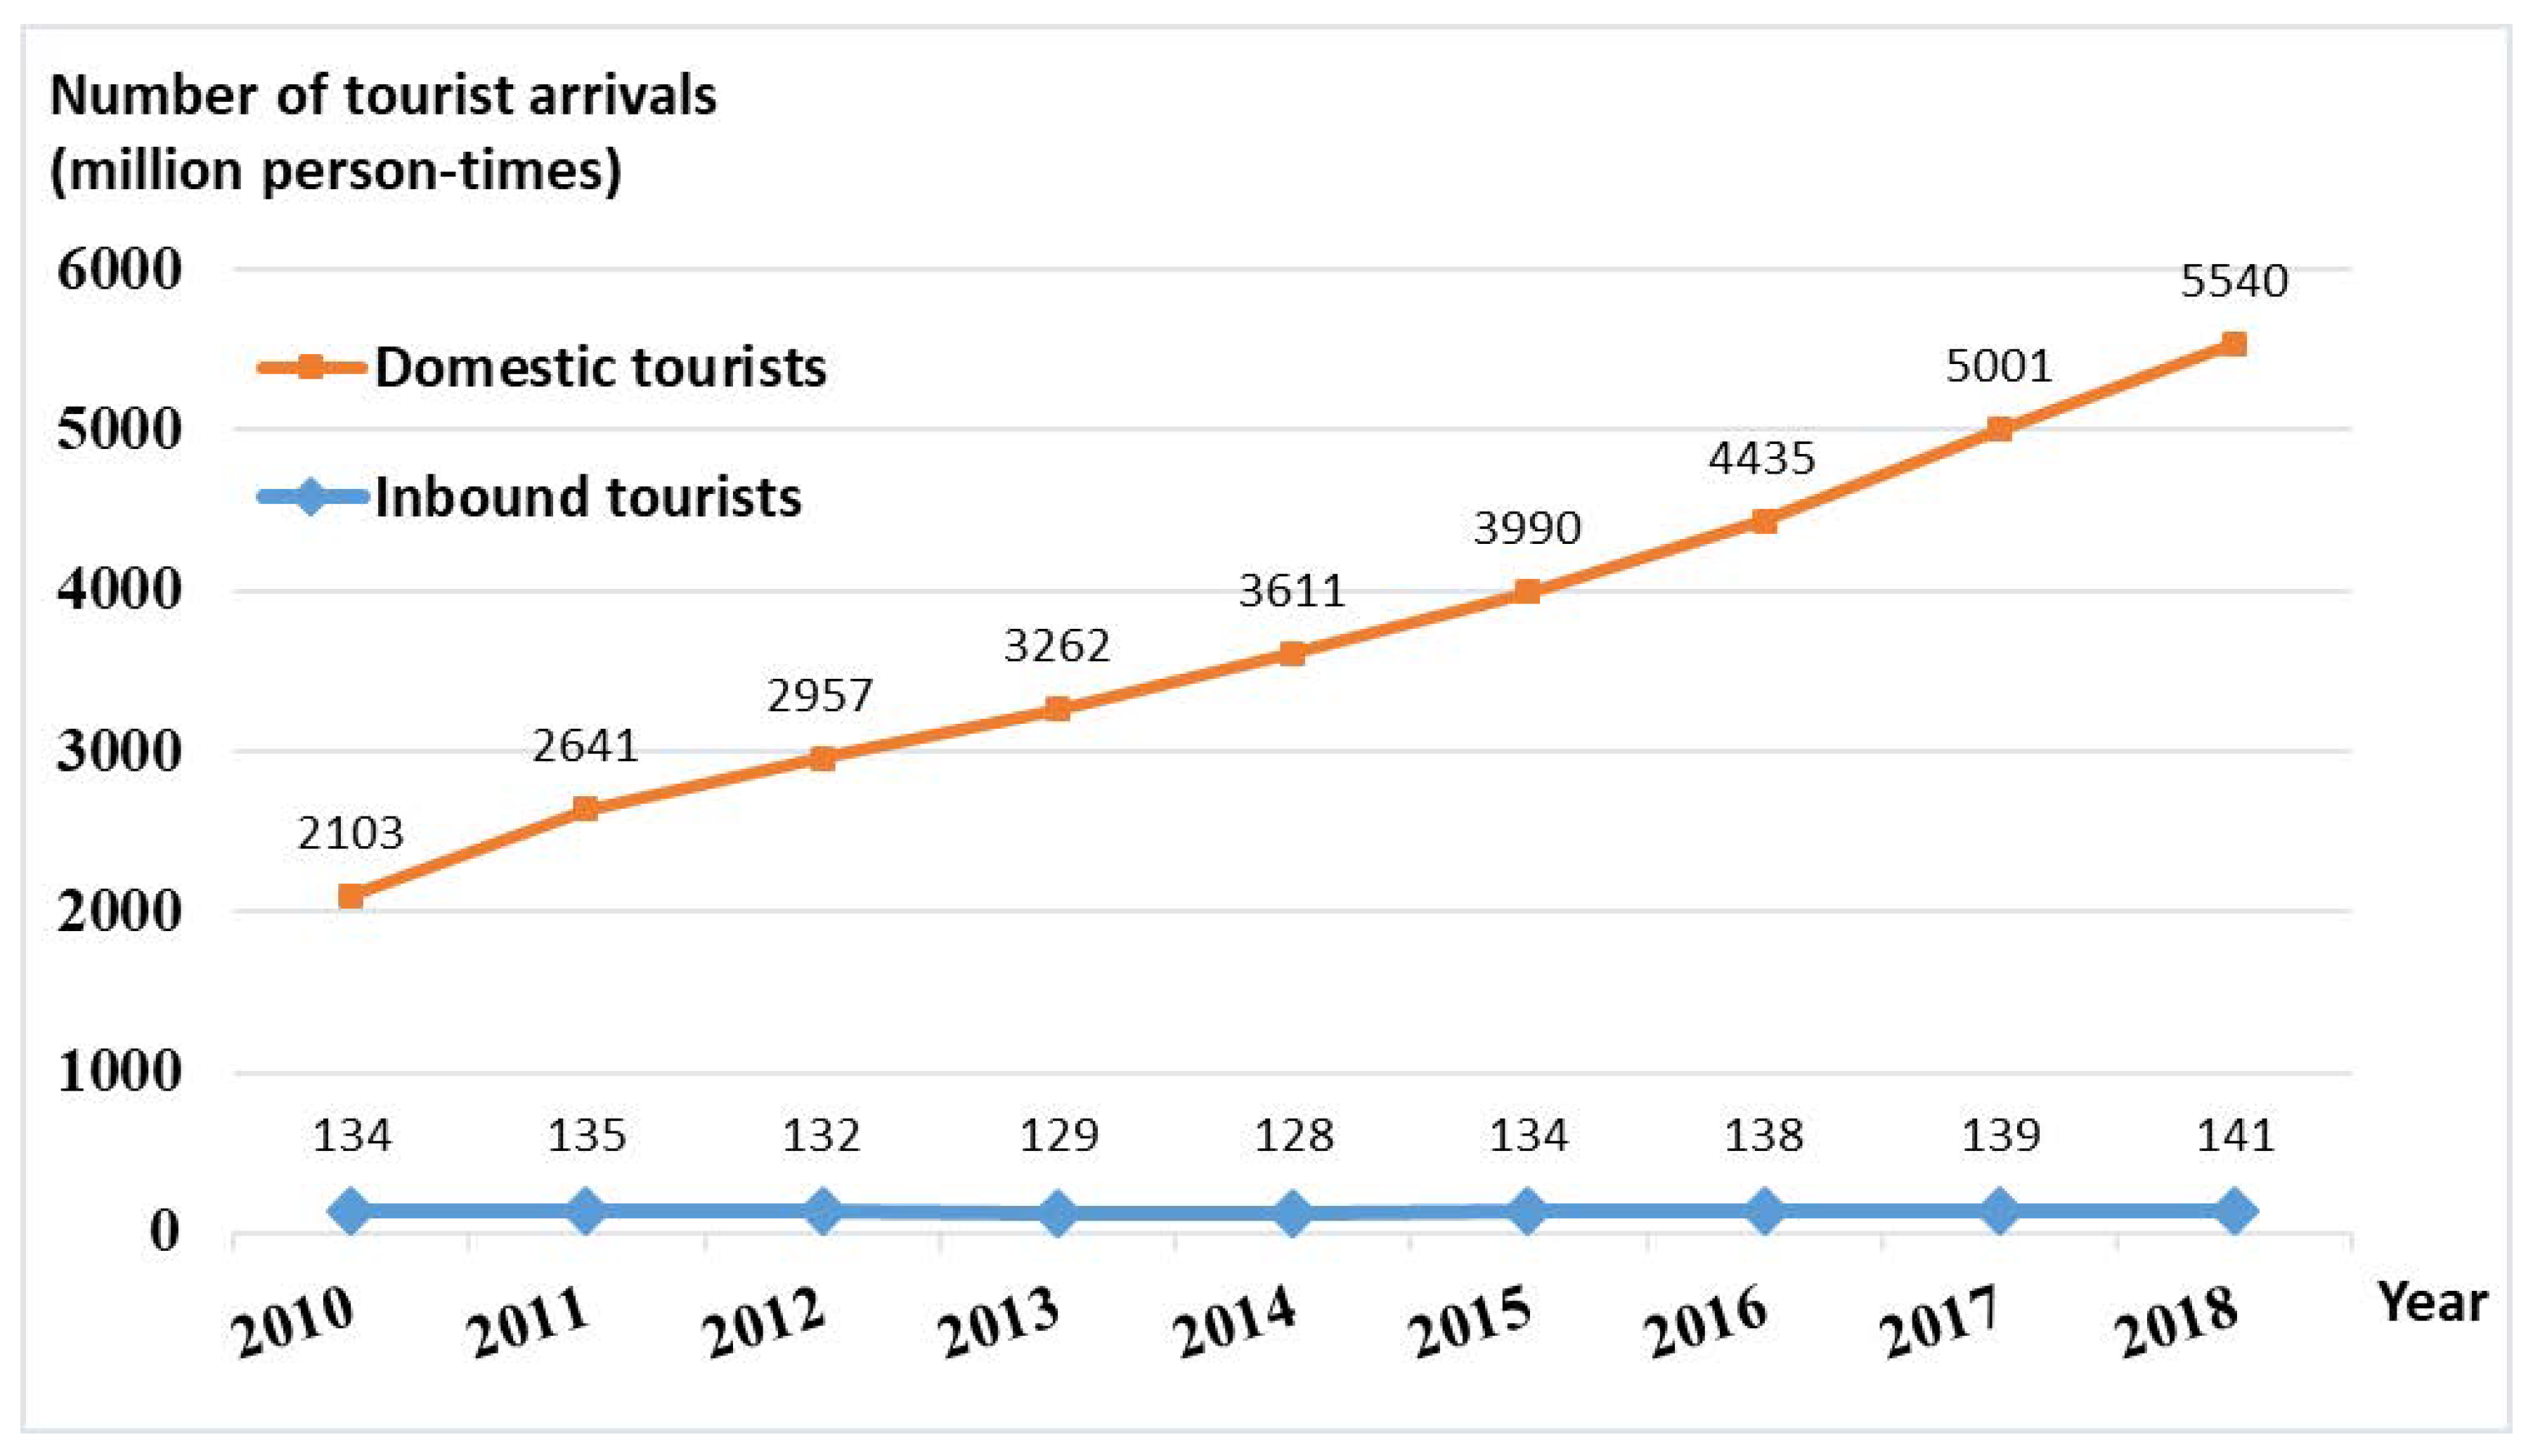
However, aside from its substantial growth in the past few decades, tourism in China still has problems that need to be dealt with. One of the most obvious problems is the huge difference between the levels of inbound and domestic tourism. Figure 1 shows the number of inbound and domestic tourist arrivals in China between 2010 and 2018. It can be seen from the figure that the growth of inbound tourist arrivals has remained stagnant in recent years. Since 2010, the number of inbound tourist arrivals vacillated between 128 and 141 million person-times. It even decreased in several years (e.g., the annual growth rate was −2.5% in 2013). In contrast, during the same period, the number of domestic tourist arrivals rose from 2103 to 5540 million person-times with an average annual growth rate of 12.9%. Concerning the revenues from tourism industries, the inbound tourism market in China is also much smaller than domestic tourism, though not shown in the graph. According to the official data, from 2010 to 2018, the annual inbound tourism receipts increased from 46 to 127 billion USD (i.e., from 310 to 841 billion CNY) while domestic tourism receipts grew from 1258 to 5128 billion CNY.
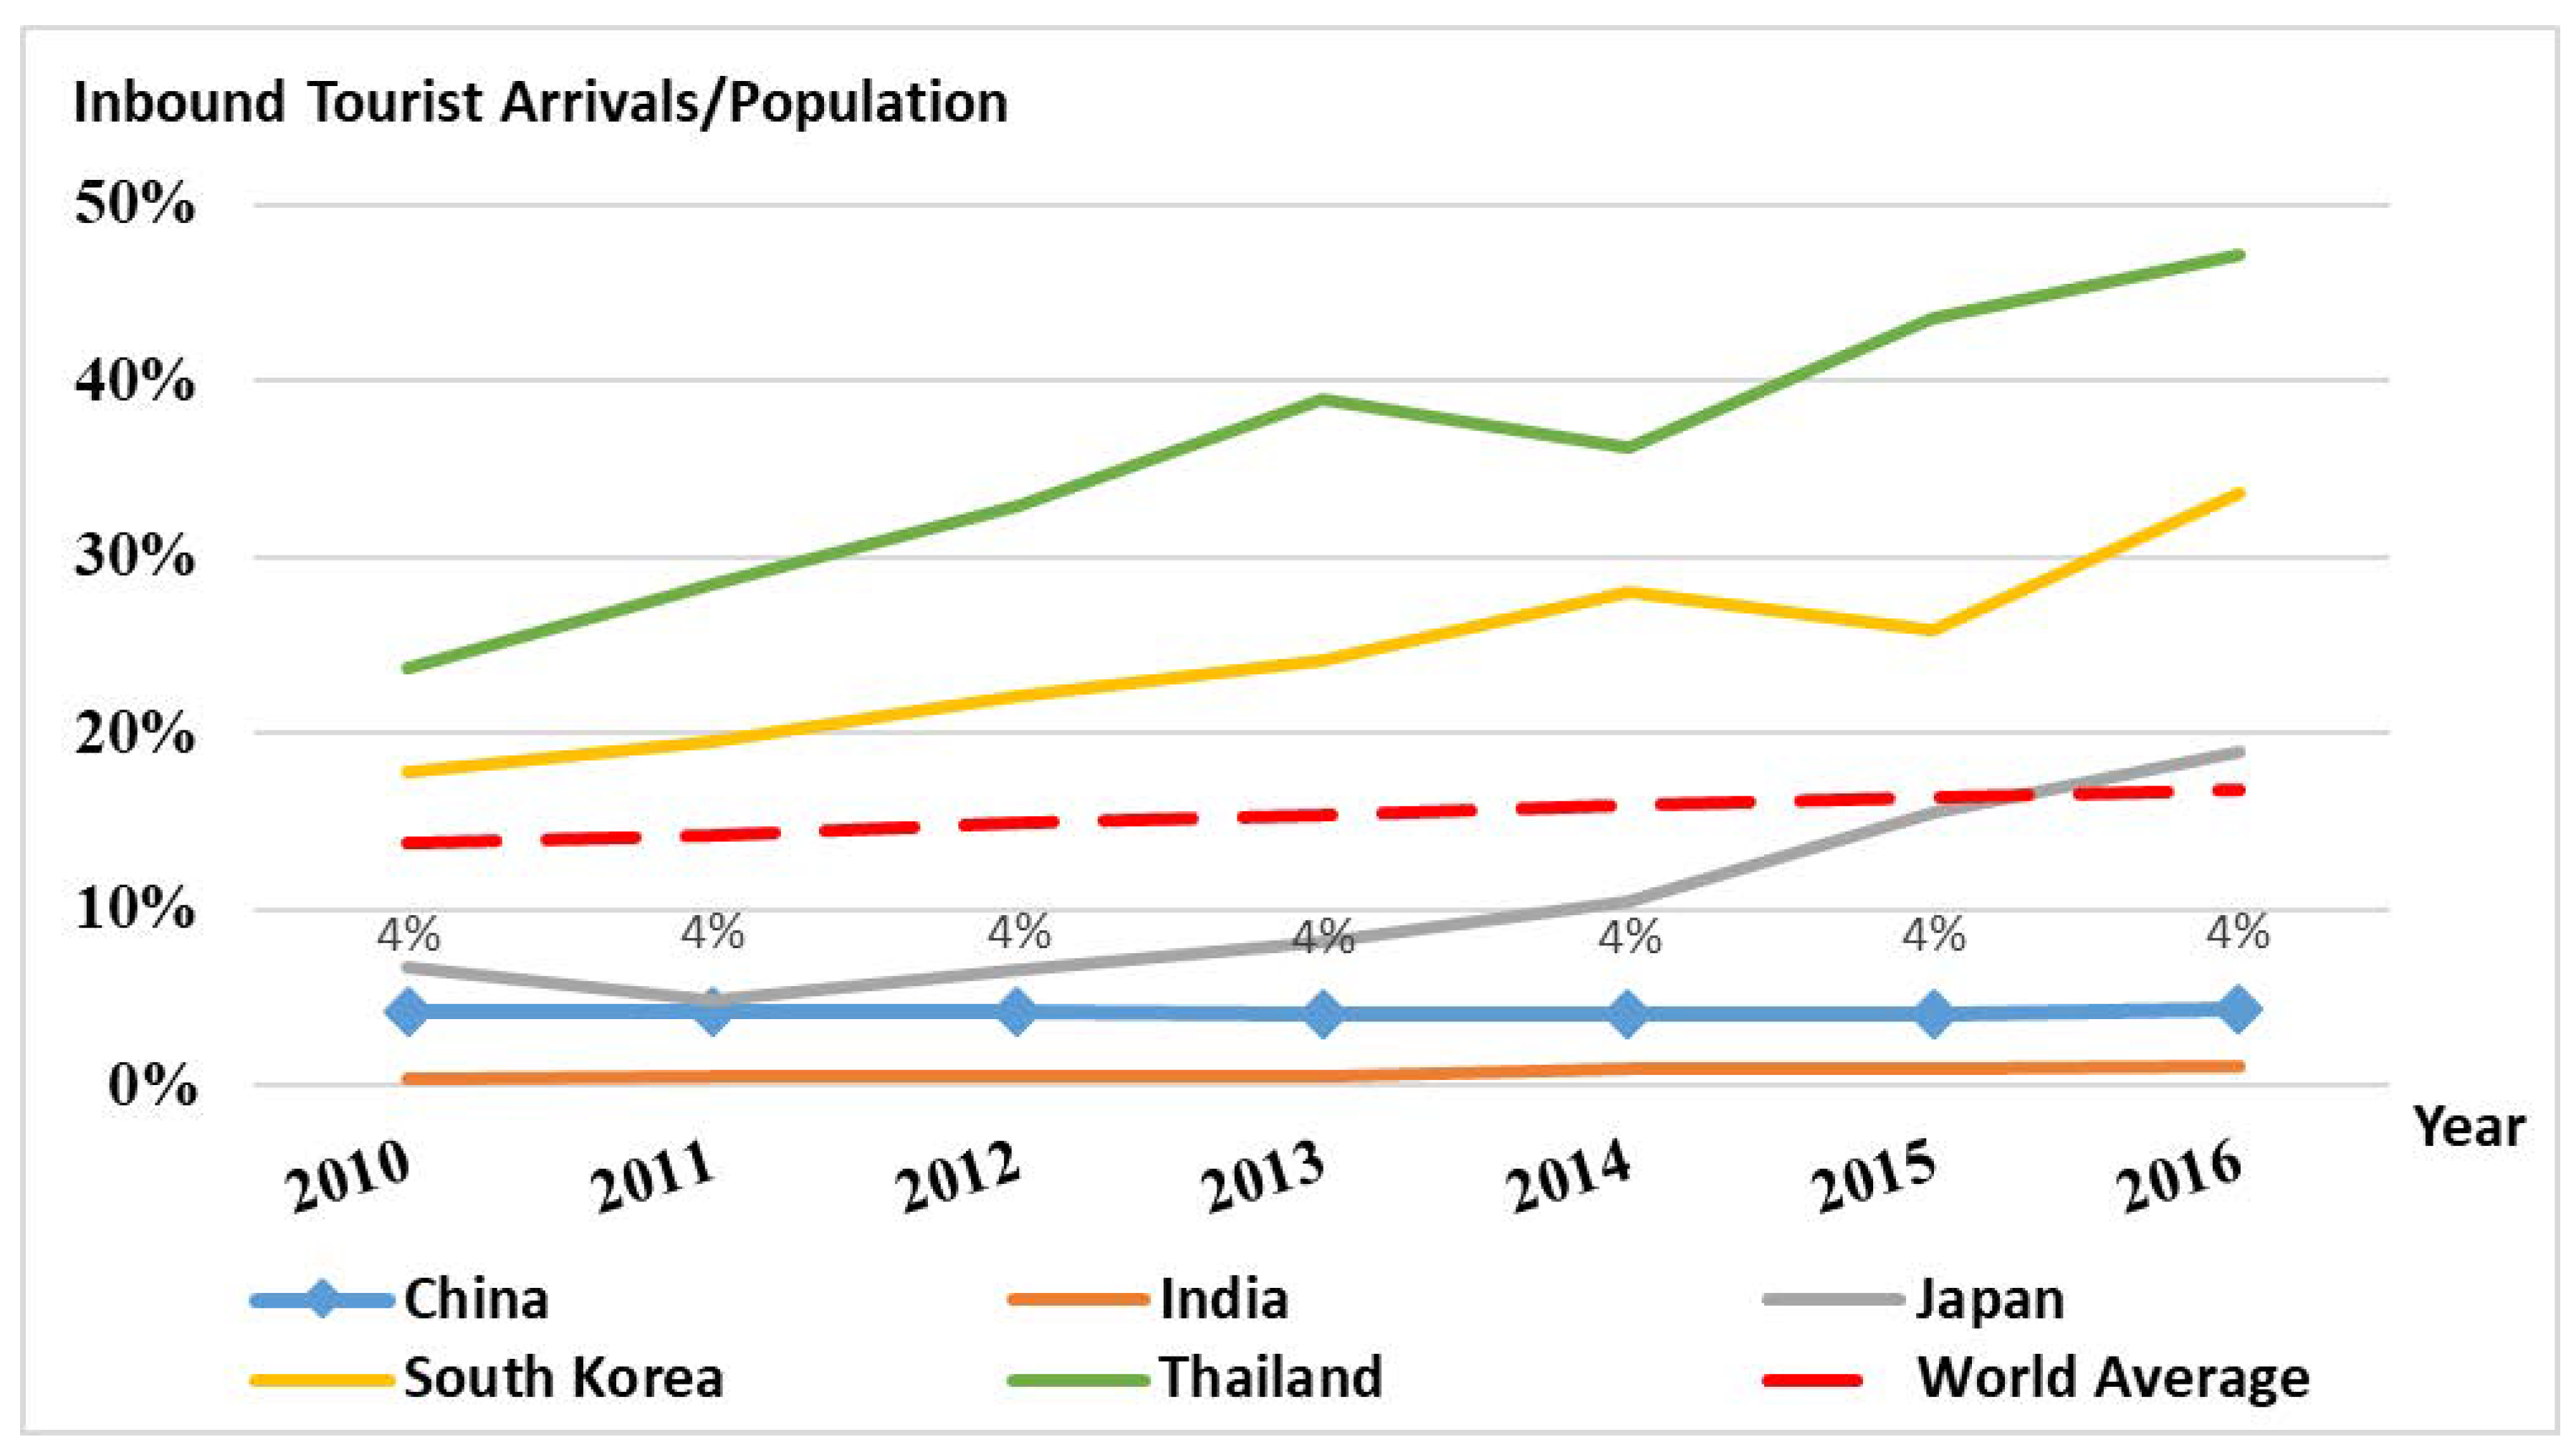
The development of China’s inbound tourism not only lags behind domestic tourism, but also far behind the average level in the world. Figure 2 shows the ratios of inbound tourist arrivals to local population in China and some other countries. (In the graph, we only demonstrate the circumstances in other four Asian countries, including India, Japan, South Korea, and Thailand, which have evident geographical or cultural similarities to China. The essential finding would not be changed if we take into account other countries for comparison.) It is apparent that the ratio in China is much lower than that in many other countries. For instance, in 2016, the ratios in South Korea and Thailand were around 34% and 47%, respectively. However, in China, the ratio was only slightly more than 4%. The world average ratio was around 17%, approximately four times the ratio in China. Additionally, from the perspective of inbound tourism receipts, China is still far behind other large economies. According to data provided by the World Bank’s World Development Indicators (WDI) dataset, in 2016, the international tourism receipts-to-GDP ratio in China was only 0.4%, much less than Japan’s 0.7%, USA’s 1.3%, and France’s 2.5%.
In order to find effective strategies for promoting China’s inbound tourism, it is important to evaluate the causes of stagnation in inbound tourism growth. There is no doubt that air quality is a crucial factor in the selection of tourist destinations [4,5,6,7,8]. Tourists care about air quality for at least two crucial reasons. First, air pollution causes considerable health risks. The medical literature has reported that air pollution is closely correlated with the incidence of mental and emotional depression, and respiratory and cardiovascular diseases [9,10,11]. Second, severe air pollution significantly impairs the visibility of air in scenic spots. This will heavily reduce the aesthetic enjoyment and pleasure obtained by tourists, and lower their willingness to travel and visit [12,13]. Therefore, it is expected that air pollution would have a negative influence on the number of tourist arrivals.
In recent years, China suffered severe haze problems much more frequently than before, which showed a deterioration of air quality. According to the 2018 China Environment Bulletin published by the Ministry of Ecology and Environment of China [14], 217 out of 338 cities in China failed to meet the preferred standard of the air quality index (AQI). The air pollution problem in China is indeed severe compared to many other countries in the world. 
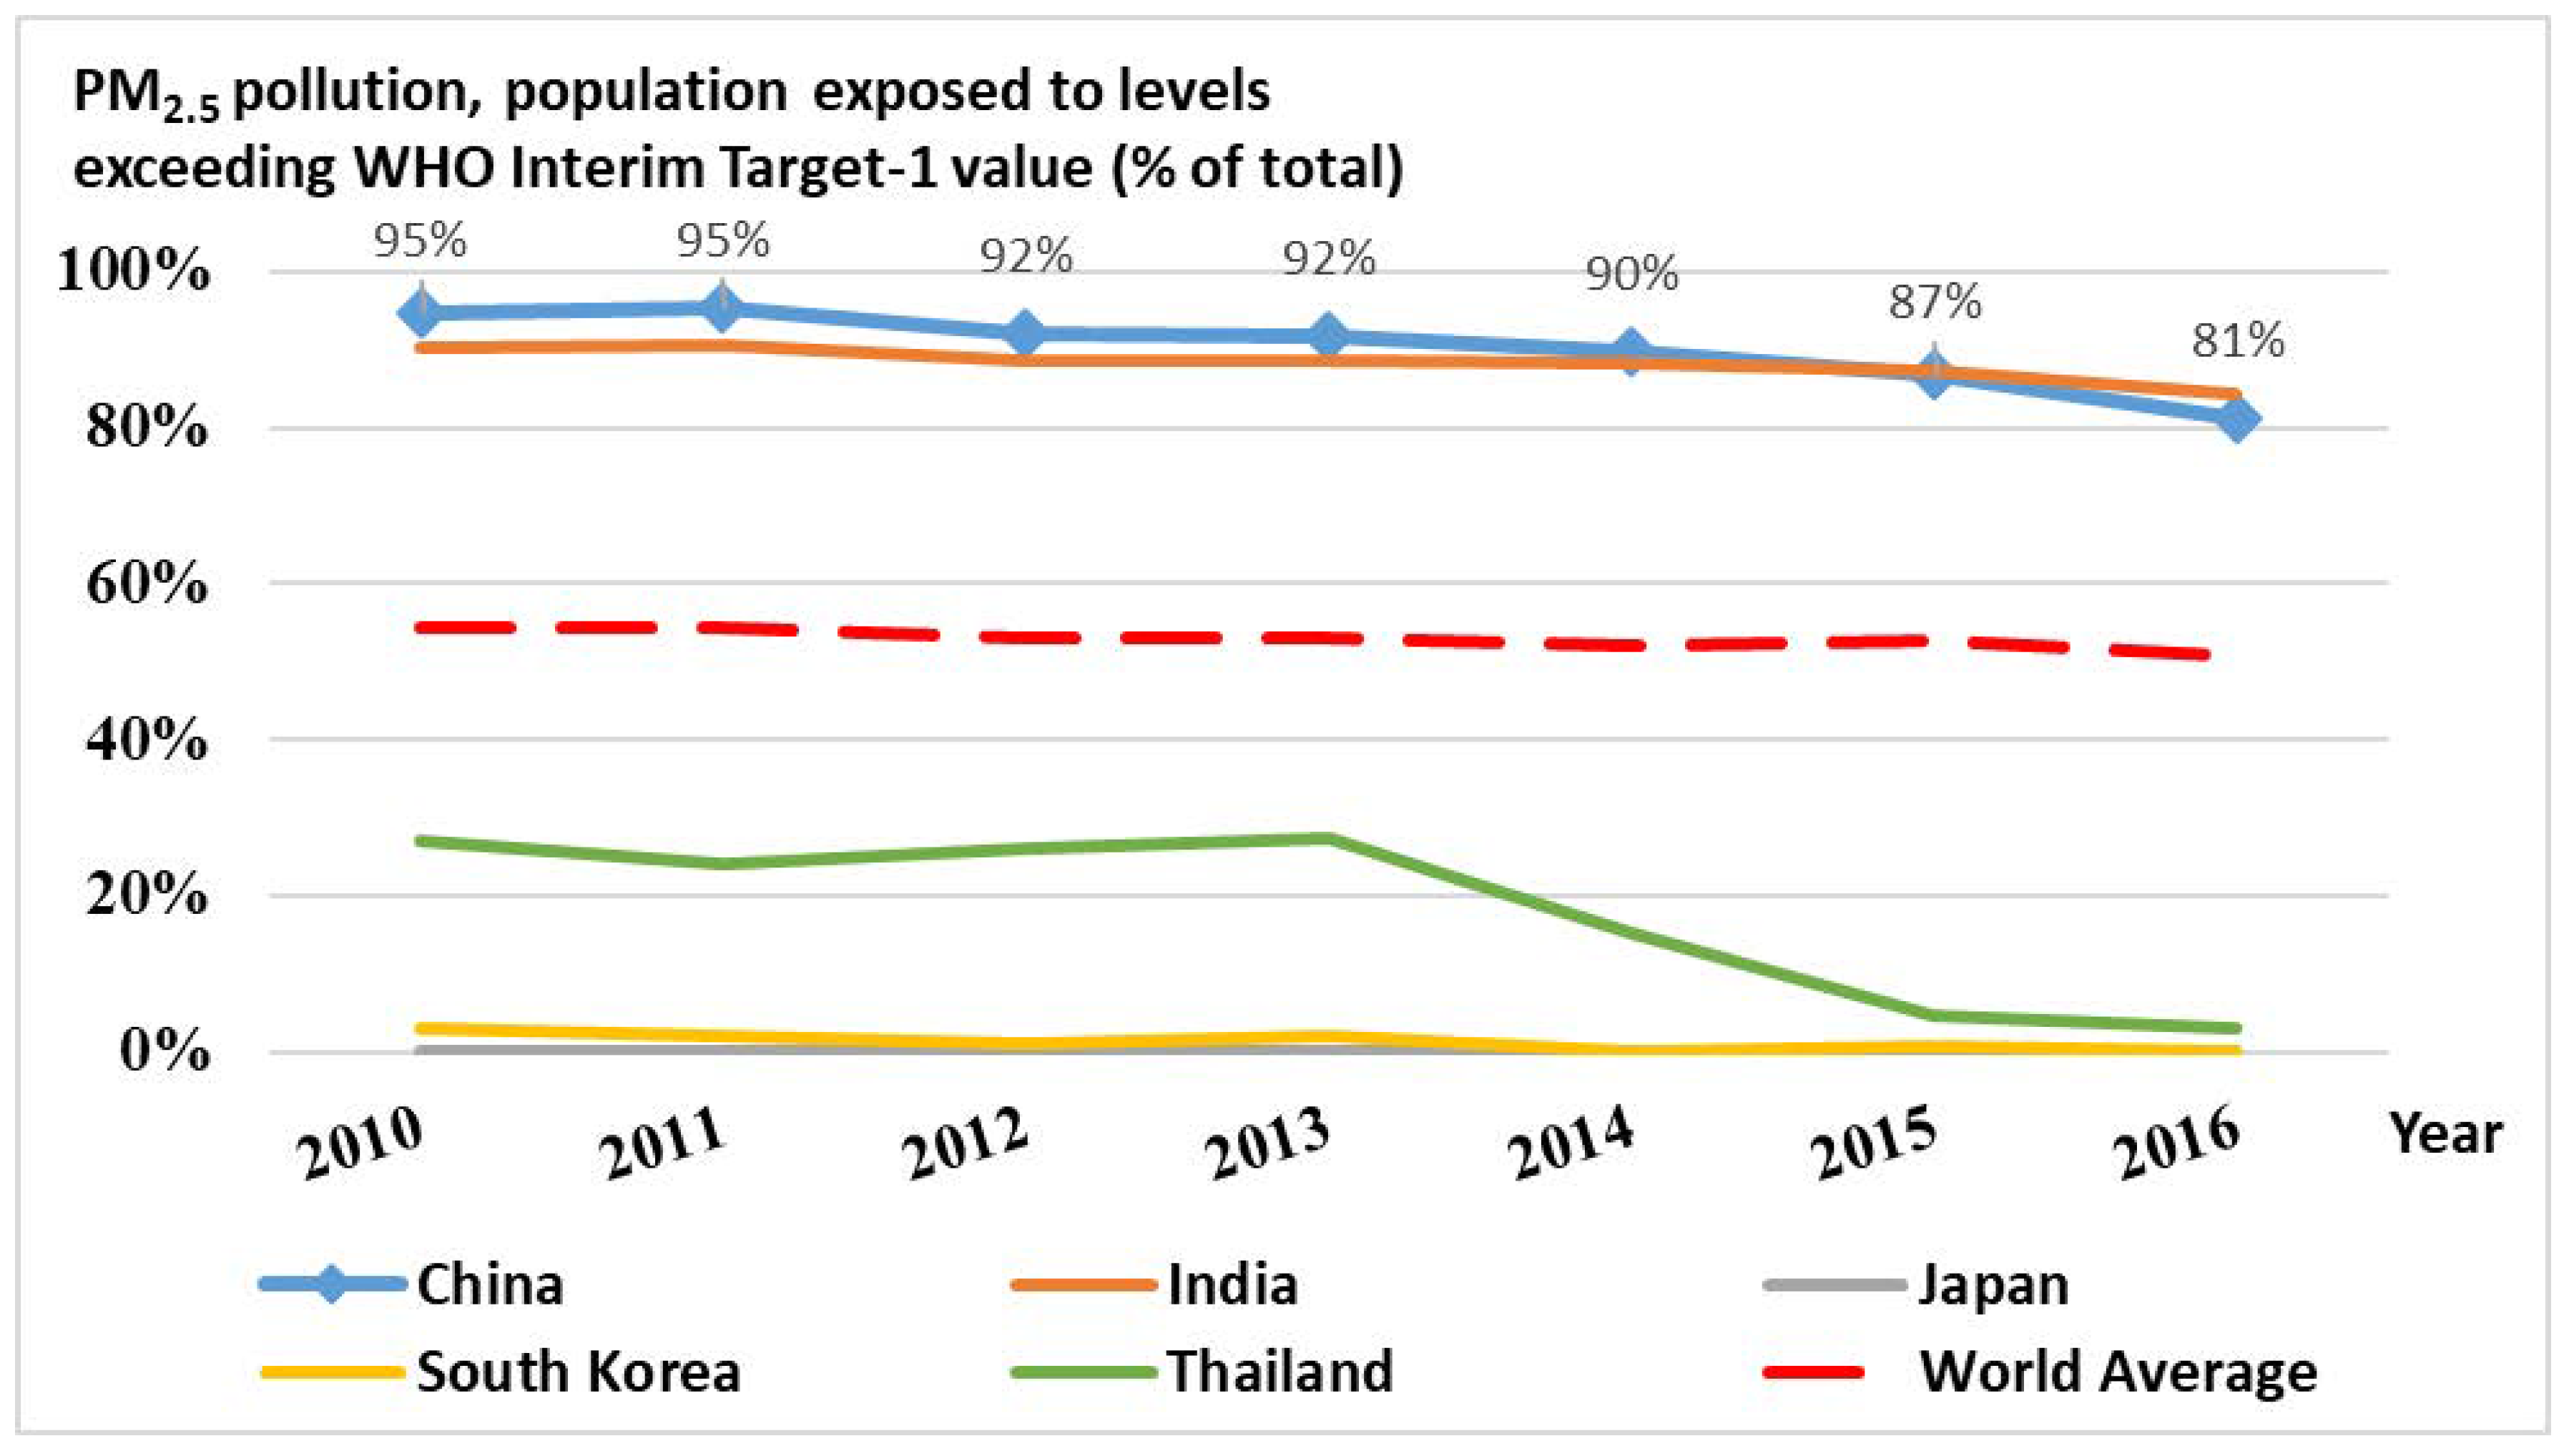
Figure 3 shows the severity of air pollution, measured by the proportion of population exposed to particulate matter with a diameter of 2.5 micrometers or less (PM 2.5 ) pollution levels exceeding World Health Organization (WHO) Interim Target-1 value (i.e., 35 μ g/m 3 ), in different countries. The higher the proportion, the severer the air pollution. In 2016, 81% of Chinese residents were exposed to PM 2.5 pollution levels exceeding WHO Interim Target-1 value. This proportion was substantially higher than the world average of 51%. Many countries with developed inbound tourism industries had low levels of air pollution. For instance, the value was 0% in Japan and South Korea, and 3% in Thailand. The haze problem not only affects the daily lives of local residents, but also substantially decreases the willingness of tourists to visit the destination. One impressive example is that, in 2013, due to the severe smog problem, the number of foreign visitors to Beijing declined by roughly half in the first three quarters of the year [15]. Combining Figure 2 and Figure 3 together, we can also observe a negative relationship between air pollution and tourist arrivals from the cross-country comparison. Particularly, China and India have high levels of air pollution and low levels of tourist arrivals-to-population ratio. In contrast, Japan, South Korea, and Thailand have low levels of pollution and high levels of tourism development. Although the figures suggest some preliminary evidence about the adverse effect of air pollution on China’s inbound tourism, the graphical observations are not sufficient to accurately evaluate the impact of air pollution. A quantitative assessment based on statistical methods is required.
The purpose of this study was to assess the impact of air pollution on China’s inbound tourism. Although several previous studies have empirically investigated the same research topic, there was no consensus on the magnitude of the impact of air pollution. For example, Liu et al. [16] used PM 2.5 to measure the degree of air pollution in 17 undeveloped provinces in China during 2005–2015, and reported that air pollution had no statistically significant effect on inbound tourist arrivals. Differently, a study by Tang et al. [17] indicated a significant and large impact of air pollution. They focused on Beijing City, and reported that the number of inbound tourists from major origin countries would decline by around 2%, if the AQI in Beijing rose by 1%. Given the large contribution of tourism to regional economic development (e.g., [1,18,19,20]), understanding the extent to which air pollution influences tourism is important. If the impact of air pollution is really large, communities, industrial sectors, and governments should consider clean air as a priority in tourism development strategies and make large collaborative efforts to mitigate pollution. If the impact is small, policy-makers might need to focus on other factors, such as tourism advertising and infrastructure construction, in order to promote local tourism industries. In addition, a precise estimation of the impact of air pollution will improve the reliability and accuracy of tourism demand forecasting, and hence facilitate the management and marketing of local tourism resources in practice.
This study contributes to the literature in several aspects. First, this paper utilized a gravity model with province-level data to estimate the influence of air pollution on inbound tourism in China. By containing a wide set of control variables suggested by the literature and taking the possible endogeneity issue into account in the regression analysis, this study attempted to provide a more accurate and reliable estimate. Second, this study explored possible heterogeneities among different tourist groups, which have not been analyzed in previous literature. Particularly, it was found that inbound tourists coming from different origin countries and visiting different destination regions responded to air pollution dissimilarly. Overall, according to the study results, it can be inferred that, if the air quality in China can be substantially improved, inbound tourist arrivals have the potential to rise by at least tens of millions of person-times. This study demonstrates that there is a bright market prospect for China’s inbound tourism.
The rest of the paper is organized as follows. Section 2 presents a literature review and develops the hypotheses. Section 3 describes the empirical model and data. Section 4 reports the estimation results based on the empirical model. Section 5 discusses the results and associated implications. Finally, Section 6 concludes the paper and talks about directions for future studies.

2. Literature Review and Hypothesis Development

Intuitively, a contaminated environment impedes the willingness of potential tourists to visit. Based on the relevant literature, the mechanisms through which air pollution affects tourism can be roughly summarized as follows. First, air pollution poses great health risks to tourists [21,22]. For instance, air pollution is directly correlated with the exacerbation of asthma, higher incidence of cardiovascular diseases, and increase in mortality [9,11,23]. Second, air pollution impairs the visibility of air in tourist attractions. This matter harms the aesthetic features of sceneries and tourist experiences, and sometimes causes traffic delays. As a result, tourists tend to have negative impressions and the destination images are damaged [12,13,24]. In addition, air pollution possibly has subtle impacts on the psychological status and behaviors of tourists, though they may not realize that. For instance, a recent study by Zhang et al. [25] reported that tourists who perceive severe air pollution in a destination are more likely to be suspicious of local service suppliers. Medical research also reported that air pollution causes more occurrences of mental and emotional troubles such as depression [10], which would reduce the happiness obtained from travelling and leisure activities. Overall, the literature indicated that air pollution could exert adverse impacts on tourists both physically and psychologically. It is reasonable to argue that air quality is a critical influential factor in tourism development.

2.1. Impact of Air Pollution in China

A set of studies have quantitatively revealed the harm of local air pollution to inbound tourism in China. The studies included Becken et al. [24], Deng et al. [26], Dong et al. [27], Tang et al. [17], Xu and Reed [28], Xu et al. [29], Zhou et al. [30], and Zhou et al. [31] on different districts in Mainland China; Cheung and Law [32] and Law and Cheung [33] on the Hong Kong SAR of China; and Chen et al. [34] on the Sun Moon Lake scenic area in the Taiwan Province of China.
Several studies inspected potential tourists’ intention to visit China. For example, Becken et al. [24] surveyed hundreds of American and Australian residents about their contemporary views on China as a travel destination. Their findings showed that potential travelers expressed negative views about travel risks in China caused by poor air quality. Xu and Reed [28] suggested that people’s perception of pollution levels substantially impeded tourism, by using Google Trends data as a proxy for tourism demand.
Some studies estimated the impact of air pollution on the actual level of inbound tourism. For instance, for one single scenic spot, Sun Moon Lake, Chen et al. [34] stressed the negative effect of air pollution on the business cycle of tourism demand, and reported that the monthly number of visitors would decrease by 25,725 person-times if the number of days with air pollution increased by one day during peak times. Using panel data on 31 Chinese provinces during 2001–2013, Deng et al. [26] reported that industrial waste gas emission had a significant negative correlation with tourist arrivals in different provinces. Dong et al. [27] found that the concentration of particulate matter with a diameter of 10 micrometers or less (PM 10 ) significantly reduced both inbound tourist arrivals and tourism receipts, based on data for 274 cities during 2009–2012. Moreover, they reported that the estimated impact was stronger after controlling for endogeneity in the econometric analysis. Tang et al. [17] quantified the impact of air quality on inbound tourism in Beijing, and found that air pollution, measured by AQI, had a negative effect on tourist arrivals in the long run, but not in the short run.
Following the findings in previous studies, the first hypothesis in this study was established as follows:
Hypothesis 1.
Air pollution in China negatively affects its inbound tourism.
Obviously, this hypothesis is not novel, as it has been tested in several previous studies. However, most of those studies did not distinguish inbound tourists according to their countries of origin, and hence did not include the characteristics of tourist origin countries and the interactive factors between origin and destination regions as explanatory variables in the econometric analysis. In consequence, important explanatory variables might be neglected and so-called “omitted variable bias” might cause the estimated effect of air pollution to be insufficiently accurate and reliable. Therefore, re-estimating the impact of air pollution on tourism within a gravity model, which explicitly controls for variables reflecting the features of origin regions and origin–destination interactions, is valuable.

2.2. Impact of Air Pollution in Tourist Origin Countries

It is notable that tourism might be affected by air pollution not only in destination areas, but also in tourist origin regions. Based on a sample covering 11 Chinese cities, Wang et al. [35] reported that air pollution in China stimulated Chinese residents’ outbound tourism demand. Given that the air pollution problem is severe in China relative to many other countries, this demand-inducement effect of local air pollution on outbound tourism reported by Wang et al. [35] is convincing, as Chinese people have many options for outbound travel destinations with good air quality. However, the same effect might not occur when the focus is on tourist flows from foreign countries to China. Even though the pollution in foreign countries stimulates the outbound tourism demand of foreign tourists, they may not choose China as a preferred travel destination because they would like to visit places with good air quality. Therefore, it was conjectured that the air pollution in foreign tourist origin countries might not have a positive impact on China’s inbound tourism.
Even worse, potential tourists living in foreign countries may have less preference for China as a destination if the air quality in their home countries deteriorates. This is because local air pollution raises residents’ awareness of and concern about the pollution problem, which has been confirmed by previous environmental literature. For example, Deguen et al. [36] interviewed around 2500 inhabitants in France to examine the association between air pollution and public perception of air quality. They reported that the measure of air quality perception (including sensory perceptions, symptoms and risk perception) significantly increased with the local air pollution level. Similar findings about the positive correlation between local air pollution and inhabitants’ awareness of and concern about pollution were also reported by some other studies, such as Atari et al. [37] in Canada, Moffatt et al. [38] in the UK, and Oglesby et al. [39] in Switzerland among others [40,41]. Nowadays, the usage of Internet even amplifies the air pollution risk perception of people [42]. In a nutshell, if the degree of air pollution in tourists’ origin countries increases, on average, tourists probably care more about pollution and become less willing to visit China. Following this logic, the second hypothesis in this study was formulated as follows:
Hypothesis 2.
Air pollution in foreign tourist origin countries negatively affects China’s inbound tourism.

3. Empirical Model and Data

3.1. Model

In order to provide a precise evaluation of the impact of air pollution on tourism, the empirical analysis should carefully control for other determinants of tourism. Tourist flows can be well modelled using the gravity model, which has been widely used in the international trade literature. As discussed in previous literature (e.g., [43]), the general form of a typical gravity model used in tourism research could be expressed by the following formula: T i j = f ( D e s t i n a t i o n i , O r i g i n j , I n t e r a c t i o n i j ) , where T i j denotes the number of tourist visits to destination region i from origin region j; D e s t i n a t i o n i refers to the features of the destination that act as forces pulling tourists to region i (e.g., clean environment, famous scenic spots, attractive culture); O r i g i n j refers to the features of the origin region that act as forces pushing tourists from region j (e.g., large population size, high disposable income); and I n t e r a c t i o n i j denotes the interactive factors that determine the costs for tourists from origin j to visit destination i (e.g., geographic distance, convenience of applying for a visa). The gravity model has been used in previous studies to explore the determinants of tourism. For instance, Huang et al. [44], Xu et al. [45], and Yang and Wong [46] investigated inbound tourism flows to China.
In this paper, in order to estimate the impact of air pollution on inbound tourism in different Chinese provinces, the following gravity model in a linear form was used:
T i j t = η A i r P o l l u t i o n i t + φ A i r P o l l u t i o n j t + D e s t i n a t i o n i t α + O r i g i n j t β + I n t e r a c t i o n i j t γ + s i + u j + v t + ε i j t ,
where T i j t is the dependent variable, the number of inbound tourist arrivals (in person-times) in China’s province i from country j in period t. Here, “inbound tourist” refers to the tourist who is not a resident of Mainland China. A i r P o l l u t i o n i t and A i r P o l l u t i o n j t are the degree of air pollution in province i and country j, respectively. D e s t i n a t i o n i t is a vector containing a set of variables capturing the characteristics of destination province i. O r i g i n j t is a vector containing the variables measuring the features of origin country j. I n t e r a c t i o n i j t is a vector containing the variables describing the interactive relationship between province i and country j. s i is the province-fixed effect; u j is the country-fixed effect; and v t is the time-fixed effect. ε i j t is the error term. The dependent variable is log-transformed to address the scaling problem. Thus, variations in tourist arrivals are expressed in percentage changes. η , φ , α , β , and γ are coefficients to be estimated.

3.2. Selection of Explanatory Variables

3.2.1. Air Pollution

In this study, the degree of air pollution was measured by the degree of PM 2.5 concentration in ambient air. PM 2.5 is one of the most significant air pollutants, well known by the public. Previous studies have reported that PM 2.5 heavily harms public health and the tourism experience (e.g., [29,47,48,49,50,51,52]). Thus, in Equation (1), the variables A i r P o l l u t i o n i t and A i r P o l l u t i o n j t refer to the annual average density of PM 2.5 pollutant ( μ g/m 3 ). According to Hypotheses 1 and 2, we expected that these two variables had negative coefficients.

3.2.2. Destination Features

The vector D e s t i n a t i o n i t in Equation (1) contains the following variables for province i in year t: l n ( P o p u l a t i o n ) i t , l n ( G D P p c ) i t , l n ( S c e n i c ) i t , l n ( H o t e l ) i t , H o s p i t a l i t , T r a n s p o r t i t , U r b a n i t , G D P g r i t , S t r u c t u r e i t , T e m p e r a t u r e i t , and R a i n i t .
l n ( P o p u l a t i o n ) i t and l n ( G D P p c ) i t are the logarithmic values of population and real GDP per capita, respectively. Previous studies suggested that the scale of destination economy is a determinant of cross-border tourism volume [53,54]. Ceteris paribus, a bigger economy is correlated with larger tourism volume compared to a smaller economy. The economic scale is typically measured by the size of GDP, which can be decomposed into GDP per capita multiplied by population. GDP per capita can be considered as an indicator of economic development level and people’s income level. Countries with higher GDP per capita usually enjoy better infrastructure and more developed transportation networks, and have abilities to provide services with higher quality. All of these attributes help constitute a favored tourism destination [55]. We expected that larger population and higher income level were associated with more inbound tourist arrivals.
l n ( S c e n i c ) i t refers to the logarithmic value of the number of 4A- and 5A-rated scenic spots, classified by the China National Tourism Administration. Because 5A spots are usually considered to be much more attractive than 4A spots, one 5A spot was assumed to be equal to two 4A spots. l n ( H o t e l ) i t is the logarithmic value of the number of star-rated hotels. The number of scenic spots is a proxy for the attractiveness of the destination region. The number of hotels indicates the capacity of providing accommodation services. Apparently, these two variables were expected to be positively correlated with tourist arrivals.
H o s p i t a l i t is the ratio of the number of health-care workers to local population. This variable is a proxy for the abundance of public hygiene infrastructure, which provides a component of tourism services. As many foreign tourists stay in China for days or even weeks, the availability of public health services might be a concern. T r a n s p o r t i t is a variable reflecting the convenience of transportation, measured by the length of road per capita. Since the transportation system is responsible for transporting travelers and relevant tourist products, its infrastructure should be seen as one of the most vital bases for tourism services. Convenient transportation infrastructure will increase the possibility that international travelers will visit. In contrast, terrible traffic conditions will leave a negative impression on foreign visitors, hurt the tourist experience, and limit the expansion of tourism. In previous studies, such as those by Khadaroo and Seetanah [53] and Zheng et al. [56], it was widely confirmed that transportation infrastructure is a significant determinant of tourism development. These two variables, measuring hospital and transportation availability, were supposed to facilitate inbound tourism.
U r b a n i t is the urbanization rate, measured by the proportion of urban population in total population. G D P g r i t is the GDP growth rate. These two variables were used to describe social and macroeconomic status. As tourism is a part of the aggregate socioeconomic system, it is probably relevant to these two variables. S t r u c t u r e i t is the industrial structure, with the non-agricultural value added as a share of GDP as proxy. It was expected that the process of industrial updating was positively correlated with the development of tourism.
T e m p e r a t u r e i t and R a i n i t refer to the annual average temperature and proportion of rainy days. These two variables might be relevant to the number of tourist arrivals because tourism is a weather-dependent industry.

3.2.3. Origin Features

The vector O r i g i n j t in Equation (1) contains the following variables for country j in year t: l n ( P o p u l a t i o n ) j t , l n ( G D P p c ) j t , T r a n s p o r t j t , U r b a n j t , and G D P g r j t .
l n ( P o p u l a t i o n ) j t is the logarithmic value of population size. l n ( G D P p c ) j t is the logarithmic value of GDP per capita. The scale of origin country may be a crucial determinant of cross-border tourism volume [53,54]. Generally speaking, a big country has larger tourism volume compared to a small country. The economic scale can be measured by the size of GDP, which equals GDP per capita multiplied by population. A higher GDP per capita level indicates a higher level of personal income, on average, implying that more people can afford international travels. A larger population base is associated with a greater scale of population mobility. We expected that these two variables had positive correlations with the number of tourists visiting China.
T r a n s p o r t j t reflects the convenience of air transport, measured by the ratio of the number of registered carrier departures to local population. The transportation system is responsible for transporting travelers and tourist products. Transportation infrastructure is one of the most vital bases for tourism activities. Since most international tourists need to travel long distances from their origin countries to China, the convenience of air transport in their countries is a crucial concern. We supposed that this variable had a positive effect on tourist arrivals in China.
U r b a n j t is the urbanization rate, and G D P g r j t is the GDP growth rate. We used them as control variables to represent the basic social and macroeconomic status in tourists’ home countries. We did not impose any prior expectation on the sign of their coefficients.

3.2.4. Interaction Variables

The vector I n t e r a c t i o n i j t in Equation (1) contains the following variables: l n ( E R ) i j t , l n ( D i s t a n c e ) i j , T r a d e O p e n i j t , and V i s a F r e e i j t .
l n ( E R ) i j t is the logarithmic value of the relative exchange rate between Chinese currency and foreign currency adjusted by price level. It was calculated according to the formula: l n ( E R ) i j t = l n [ ( C P I i t / E i t ) / ( C P I j t / E j t ) ] , where C P I is the consumer price index (value in 2010 = 100) and E is the exchange rate of the local currency against the US dollar (value in 2010 = 100). The relative price of tourism products and services between origin and destination countries influences tourists’ decisions [57,58,59]. The price factor demonstrates the relative cost of staying in the destination country compared to staying in the origin country. Two major elements of tourists’ expenditures are the costs of travel and living [60,61]. The consumer price index together with the exchange rate are key indices used to evaluate the cost. We expected that the relative price negatively affected the tourist arrivals in China.
l n ( D i s t a n c e ) i j is the logarithmic value of the geographic distance between the capital city of province i and the capital of country j. The distance between origin and destination countries should be taken into account. The geographical distance between two regions directly affects the cost of travel. International tourists usually depart from and arrive in big cities because of the good infrastructure and convenient transportation in those cities. Thus, researchers often use the distance between capital cities of origin and destination countries as a proxy for intercountry distance. Besides geographic distance, it was found in the literature that cultural distance might also play a role in shaping tourism demand [62]. For instance, Yang and Wong [46] reported that cultural distance had a negative effect on inbound tourism flow into China. Because of the lack of data, we did not include the cultural distance in our model. The variable of geographic distance was expected to be negative correlated with the dependent variable.
T r a d e O p e n i j t refers to the degree of international trade openness, calculated by T r a d e O p e n i j t = T r a d e i j t / G D P j t , where T r a d e i j t is the volume of international trade between province i and country j and G D P j t is the GDP of country j. The factor of trade flows can be used to assess the intensity of economic interactions between two regions. The more intensive the economic relationship, the more business tourists there are traveling between regions. Thus, the relative trade volume is a meaningful variable that can be utilized as a proxy for the closeness of intercountry economic relationship and partially explain the volume of tourism flow [44,45]. Because of its great size in terms of macroeconomy and international trade, China is one of the most important business partners for many countries. Obviously, the variable of trade flows cannot be omitted in research on tourists into China. It was expected that, if the degree of trade openness was high, the number of cross-border tourists would also be large.
V i s a F r e e i j t is a dummy variable indicating whether there is a 72-h visa-free policy for tourists from country j to the capital city of province i. Its value is equal to 1 if the policy was implemented, and 0 otherwise. As a sign of the relationship between different countries, tourism liberalization policies also play an important role in tourism development. Liberalization policies provide convenience for potential visitors and present a welcome attitude to tourists. Arita et al. [63] found that Approved Destination Status (ADS), which allows government-approved travel agencies to obtain visas to ADS destinations in bulk, resulted in a significant increase in the number of cross-border tourists. Gil-Pareja et al. [64] reported that tourism-related agreements had a significant impact on international tourism inflow. For many ordinary tourists, the process of applying for a visa is time-consuming. Thus, a visa-free policy might significantly stimulate people’s intention to visit.

3.3. Data

The sample covered 30 provinces in Mainland China, excluding Tibet. Tibet was not included because of the unavailability of weather-relevant data. Tourist arrivals data at the province level were available for 13 origin countries: Australia, Canada, France, Germany, Japan, South Korea, Malaysia, Philippines, Russia, Singapore, Thailand, the United Kingdom, and the United States. The number of tourist arrivals from those 13 countries accounted for more than half of total foreign tourist arrivals in China. The sample period covered seven years, spanning from 2010 to 2016.
The PM 2.5 data in different Chinese provinces were obtained from the Chinese Research Data Services Platform (CNRDS), available at https://www.cnrds.com. The data of tourist arrivals and the destination regions’ economic and social features were derived from the database provide by the EPS China Data, which was accessed at http://www.epschinadata.com. The weather data were obtained from the China Meteorological Data Service Center, accessed at http://data.cma.cn/en. The data for variables in different foreign countries were publicly available from the World Bank’s World Development Indicators (WDI) dataset at http://datatopics.worldbank.org/world-development-indicators.
The data of the interaction variables were constructed by combining several data sources. The variable of relative exchange rate required information about the exchange rate and price level. The exchange rate data mainly came from the WDI dataset. Since WDI does not report the exchange rate for Euro Zone countries, the exchange rate data for France and Germany were obtained from the website of the Federal Reserve Bank of St. Louis at https://fred.stlouisfed.org. CPI data in the foreign countries were obtained from the WDI. CPI data in different Chinese provinces were obtained from the EPS database. The values of the distances between different regions were calculated based on longitude and latitude information supplied by the World Cities Database, available at https://simplemaps.com/data/world-cities. Information about trade openness required data at both the province and country level, which were available from the EPS and WDI, respectively. The data for 72-h visa-free policy were collected from news reports published by the official mass media.
Summary statistics of the variables are reported in Table 1. The table shows that the study samples were highly diversified, including regions with different levels of air pollution and degrees of tourism development. The final dataset used in regression analyses was comprised of 23 variables with 2651 observations in total.

4. Results

This section reports the estimation results. First, based on the gravity model with province-level data, the important influence of air pollution on China’s inbound tourism was identified. Then, a set of robustness checks were conducted. After that, the heterogeneities among different tourist groups were explored.

4.1. Main Result

The regression results for Equation (1) are listed in Table 2. The table shows the impacts of different factors on China’s inbound tourism. Column (i) shows the baseline regression result. Air pollution in local provinces substantially harmed inbound tourism. The estimated coefficient for the variable A i r P o l l u t i o n i is −0.017, statistically significant at the 1% level. The coefficient implies that, if PM 2.5 concentration rose by 1 μ g/m 3 , inbound tourism arrivals would decline by 1.7%. Thus, Hypothesis 1 in this study is supported. Given that the average scale of inbound tourist arrivals in China between 2010 and 2016 was 133 million person-times per year, this number indicates that, if the country could take effective actions to reduce PM 2.5 by 1 μ g/m 3 , annual inbound tourist arrivals would increase by 2.261 million person-times. This is indeed a large benefit.
It is notable that the degree of air pollution in tourist origin countries also had an obvious impact on tourist arrivals, as suggested by the estimated coefficient of A i r P o l l u t i o n j , which is −0.038 and statistically significant. This finding is not consistent with the finding by Wang et al. [35] that local air pollution stimulated outbound tourism. They reported that Chinese residents tended to have an increased demand for outbound tourism when local air quality became worse. What they found was not detected for tourists from foreign countries to China. The estimate in this study indicates that, on average, if PM 2.5 density in potential tourists’ home countries increased by 1 μ g/m 3 , the actual number of tourists visiting China would decline by 3.8%, equal to a decline of 5.054 million person-times per year. Thus, Hypothesis 2 in this study is confirmed.
The estimated coefficients of the control variables are also reported in the table. The coefficient of l n ( P o p u l a t i o n ) i is not statistically significant, indicating that inbound tourism is not sensitive to the local population size. The coefficient of l n ( G D P p c ) i is significantly positive, indicating that expansion of inbound tourism is accompanied by overall economic development. The variables l n ( S c e n i c ) i and l n ( H o t e l ) i both have significant positive coefficients, reflecting the straightforward opinion that more scenic spots and hotels are associated with a larger scale of tourism. The variables used as proxies for the abundance of infrastructure, H o s p i t a l i and T r a n s p o r t i , both have positive coefficients, though the coefficient of H o s p i t a l i is not statistically significant. U r b a n i and G D P g r i both have significantly negative coefficients, implying that rapid urbanization and GDP growth actually do not increase the attractiveness of China to foreign tourists. S t r u c t u r e i , the indicator for industrial structure, has a significantly positive coefficient, which was expected. The variables for weather, T e m p e r a t u r e i and R a i n i , do not demonstrate any statistically significant impact.
The variables describing the characteristics of origin countries generally do not have a significant impact on inbound tourism in China. An exception is the variable T r a n s p o r t j , whose coefficient is positive and significant at the 5% level. This indicates that international tourists’ decision to visit China is affected by the convenience of cross-country transportation.
The signs of interaction variables are consistent with the economic intuition. l n ( E R ) i j has a statistically significant negative coefficient, indicating that an increase in the relative price of tourism in China would reduce the number of inbound tourist arrivals. The coefficient of l n ( D i s t a n c e ) i j is significantly negative, indicating a strong negative impact of travel distance. T r a d e O p e n i j is positively correlated with tourist arrivals, revealing that the trade linkage between two regions is associated with people’s mobility. As expected, V i s a F r e e i j has a positive coefficient, though not statistically significant.

4.2. Robustness Analysis

This subsection describes several robustness checks that were conducted to inspect the robustness of the baseline estimation results. First, we inspected whether the estimate was robust to the selection of air pollution indicator. Previously, the level of PM 2.5 concentration in ambient air was utilized to measure the degree of air pollution. Although PM 2.5 is one of the most significant air pollutants in daily life, people sometimes check the AQI value rather than PM 2.5 density to judge the severity of pollution. AQI has a nonlinear monotonic relationship with the physical density of air pollutants, and is also a widely used indicator of air pollution. Column (ii) of Table 2 reports the estimated coefficients if PM 2.5 was replaced by the corresponding AQI value calculated based on the Chinese official standard. This time, the coefficient of A i r P o l l u t i o n i is −0.014, close to the value of −0.017 reported in column (i). The coefficient of A i r P o l l u t i o n j is −0.027, not far from the value of −0.038 reported in column (i). The results indicate that our estimation was not sensitive to the selection of index used to measure the degree of air pollution.
Next, the endogeneity issue in econometric regression was taken into account. Previous studies, such as Dong et al. [27], suggested paying attention to the possible endogeneity problem when estimating the impact of air pollution on tourism because environmental quality and tourism might have reciprocal interactions with each other [65]. The instrumental variable (IV) approach is an effective method to tackle the potential endogeneity problem. Two meteorological indicators, wind speed and vapor pressure, were used as instrumental variables. Valid instrument variables should satisfy two conditions: they should be strongly correlated to the endogenous explanatory variable, and they should not directly affect the dependent variable, except through their link with the endogenous variable. The meteorological and environmental literature confirmed that meteorological conditions are strongly relevant to the degree of air pollution (e.g., [66,67,68]). There is no obvious reason to believe that tourists’ visiting behaviors are sensitive to those meteorological indicators (as long as they are within normal ranges), except the relationship between air pollution and meteorological conditions. Thus, both conditions for the selection of IVs were satisfied.
Column (iii) reports the two-stage least squares (2SLS) IV estimation results. The estimated coefficient of A i r P o l l u t i o n i is −0.050, which is statistically significant and even larger than the coefficient in the baseline regression shown in column (i). The corresponding Cragg–Donald Wald F-statistic and Kleibergen–Paap rk Wald F-statistic are both statistically significant, indicating that the selected IVs were not “weak IVs”. The Hansen J-statistic is not statistically significant, indicating that the regression model was not overidentified. Overall, these statistics imply that the IVs were properly used in the estimation. In order to further inspect the IV estimation results, the general method of moments (GMM) estimation was applied. The results, shown in column (iv), provide a statistically significant coefficient of −0.053 for A i r P o l l u t i o n i . Therefore, combining columns (iii) and (iv) together, the previous finding that air pollution harms China’s inbound tourism is still supported after the potential endogeneity issue is explicitly addressed. In addition, it is easy to see that the finding about the negative effect of air pollution in tourist origin countries is robust. As demonstrated in columns (iii) and (iv), the estimated coefficients of A i r P o l l u t i o n j are −0.039 and −0.040, respectively, very close to the value of −0.038 reported in column (i).

4.3. Heterogeneities among Different Tourist Groups

Different types of inbound tourists may respond to air pollution in dissimilar ways. Considering this, tourists were classified into groups by the characteristics of their origin countries and destination regions, and their heterogeneous responses to air pollution were analyzed. Because the air pollution in tourists’ origin countries is out of China’s control, in this subsection, we focus on the heterogeneous responses of tourists to the air pollution within China. The analysis was based on Equation (2):
T i j t = η 1 A i r P o l l u t i o n i t + η 2 A i r P o l l u t i o n i t × D + φ A i r P o l l u t i o n j t + D e s t i n a t i o n i t α + O r i g i n j t β + I n t e r a c t i o n i j t γ + s i + u j + v t + ε i j t .
Equation (2) was revised from Equation (1) by adding the interactive term A i r P o l l u t i o n i t × D . Here, D is a dummy variable equal to 1 or 0, depending on the classification of tourists. For the tourist group with D = 1 , the impact of air pollution in China is measured by the coefficient η 1 + η 2 ; for the tourist group with D = 0 , the impact is measured by the coefficient η 1 .
First, tourists were classified according to the degree of air pollution in their origin countries. This classification makes sense because the basic logic behind this study is that people will compare the air quality in candidate destinations with that in their home country and, ceteris paribus, will be more willing to visit places with better air quality. Consistent with this logic, if the degree of air pollution in tourists’ origin country is high, potential tourists may be highly concerned about the pollution problem, and be very responsive to the air pollution in China. To verify this viewpoint, we set up one “high-pollution” country group and one “low-pollution” country group. The dummy variable was defined such that D j H i g h P o l l u t i o n = 1 if the mean air pollution level in country j during the sample period was above the sample average, and D j H i g h P o l l u t i o n = 0 , otherwise. The estimate results are reported in column (i) of Table 3. The estimated coefficients of A i r P o l l u t i o n i and A i r P o l l u t i o n i × D j H i g h P o l l u t i o n are −0.014 and −0.006, respectively. Both coefficients are statistically significant. Therefore, it was found that, if PM 2.5 pollution increased by 1 μ g/m 3 , the number of tourists from “low-pollution” and “high-pollution” countries would decline by 1.4% and 2.0% ( = 0.014 + 0.006 ), respectively. Indeed, as expected, tourists from more polluted countries were more responsive to China’s air pollution.
Second, the influence of air pollution on tourists from Asian and non-Asian countries was examined. The majority of inbound tourists to China come from Asian regions. Asian and non-Asian tourists may react to air pollution differently. To investigate this, we set the dummy variable such that D j A s i a n C o u n t r i e s = 1 if tourist origin country j is in Asia, and D j A s i a n C o u n t r i e s = 0 , otherwise. (We classified Russia as an Asian country because it shares very long common national boundaries with China.) As reported in column (ii) of Table 3, the estimated coefficient of A i r P o l l u t i o n i is −0.014, and the coefficient of A i r P o l l u t i o n i × D j A s i a n C o u n t r i e s is −0.005. Both are statistically significant. Thus, it was found that China’s air pollution has a larger negative impact on Asian tourists than on non-Asian tourists.
Third, tourists were classified according to the air pollution level in their visiting destinations. We set up one “high-pollution” province group and one “low-pollution” province group. The dummy variable was defined such that D i L o w P o l l u t i o n = 1 if the mean air pollution level in Chinese province i during the sample period was below the sample average, and D i L o w P o l l u t i o n = 0 , otherwise. The estimation results are reported in column (iii) of Table 3. The coefficient of A i r P o l l u t i o n i is −0.011, and the coefficient of A i r P o l l u t i o n i × D i L o w P o l l u t i o n is −0.035. Both are statistically significant. Thus, we essentially detected a nonlinear effect of air pollution on China’s inbound tourism. In “high-pollution” and “low-pollution” provinces, if PM 2.5 concentration rose by 1 μ g/m 3 , the number of inbound tourist arrivals would decline by 1.1% and 4.6% ( = 0.011 + 0.035 ), respectively. In other words, tourists who decide to visit more polluted areas are less sensitive to the variations of air pollution, and those that choose to visit less polluted areas care much more about pollution.
Lastly, tourists were grouped according to the degree of popularity of their visiting destinations. We considered one “popular destinations” province group and one “less popular destinations” province group. We defined the dummy variable such that D i P o p u l a r D e s t i a n t i o n s = 1 if the mean number of annual inbound visitors to province i during the sample period was above the sample average, and D i P o p u l a r D e s t i n a t i o n s = 0 , otherwise. As demonstrated in column (iv) of Table 3, the estimated coefficient of A i r P o l l u t i o n i is not statistically significant, and the coefficient of A i r P o l l u t i o n i × D i P o p u l a r D e s t i n a t i o n s is −0.040 and significant at the 1% level. Thus, it was found that tourists visiting popular Chinese destinations are sensitive to air quality, but tourists who choose to visit less popular destinations are not responsive to air pollution. Indeed, if a foreign tourist decided to travel to a Chinese region that was not visited by many people, the tourist would probably have an extraordinary interest or reason, e.g., for the purpose of business or conference. In this circumstance, air quality may not be a major concern.
In summary, the heterogeneity analysis shows that the magnitude of tourists’ responses to air pollution in China is dependent on the characteristics of their origin and destination regions. The impact of air pollution in China is larger for travelers coming from more polluted and Asian countries, and visiting less polluted and more popular destinations.

5. Discussion and Implications

This study emphasizes the importance of good air quality for inbound tourism development. While this point has been confirmed by previous literature, this study aimed to estimate the impact of air pollution on the basis of a wide sample by using a gravity model, in which the features of destinations, origin regions, and their interactive relationship were explicitly modelled. According to the estimation results, if PM 2.5 concentration in China rose by 1 μ g/m 3 , inbound tourist arrivals would decline by approximately 1.7%. Hypothesis 1 is strongly supported. This result confirms the importance of a clean environment as a favored characteristic of tourist attractions as argued in the literature, such as by Goodwin [4], Hu and Wall [5], Mihalič [6], Zhang et al. [7], and Zhang et al. [8].
An interesting finding of this study is that, if PM 2.5 in tourist origin countries increased by 1 μ g/m 3 , tourist arrivals in China would drop by 3.8%. This large impact has not been noted in previous studies. Environmental studies, such as those by Atari et al. [37], Dong et al. [40], and Moffatt et al. [38], reported that the existence of local air pollution would raise residents’ awareness of and concern about the pollution problem. Therefore, if air quality in their home countries got worse, potential tourists living in foreign countries would be less willing to choose China as a tourism destination. The estimation in this study confirms Hypothesis 2. Although this finding has no direct practical implication for China’s tourism development because China cannot change the level of air pollution in foreign countries, it reminds researchers that air pollution in tourist origin regions is an explanatory variable in tourism demand analysis that cannot be ignored.
It is notable that the estimated magnitude of the impact of air pollution in China is different from that reported in previous studies. Table 4 briefly summarizes several previous studies on the impact of air pollution in China on inbound tourist arrivals. There are five columns in the table. The first column, “Literature”, lists the authors’ names. The second column, “Area Studied”, and third column, “Period Covered” provide information about the sample regions and periods studied. Different air pollutants were used in previous studies to represent the degree of air pollution. The fourth column of the table, “Air Pollutant”, lists the names of air pollution indicators. The last column, “Estimated Effect”, reports the estimated response of inbound tourist arrivals to a 1 μ g/m 3 increase in air pollutant concentration.
For instance, according to the study by Dong et al. [27], who investigated 274 cities in China for the period 2009–2012, if PM 10 concentration in ambient air increased by 1 μ g/m 3 , inbound tourist arrivals would decline by 0.56%. Zhou et al. [31] focused on Beijing City, and reported that, if PM 10 density increased by 1 μ g/m 3 , inbound tourist arrivals in Beijing would decline by 0.33%. Differently from these two studies, Xu et al. [29] reported that the response of inbound tourist arrivals to PM 10 pollution was not significant statistically, based on a sample covering 337 cities. However, they found that inbound tourists were sensitive to PM 2.5 pollution. The estimated effect of a 1 μ g/m 3 rise in PM 2.5 concentration on tourist arrivals was −1.23%. But this finding was not supported by Liu et al. [16], whose study did not report a statistically significant impact of PM 2.5 pollution on tourism. Overall, these previous studies have not provided a consensus on the magnitude of the impact of air pollution on inbound tourism in China.
Although the core finding of this study on the harmful influence of air pollution in China is qualitatively consistent with the findings of Dong et al. [27], Xu et al. [29], and Zhou et al. [31], the estimated effect of air pollution in this study is quantitatively different from that reported in previous studies. Particularly, the estimated negative impact is much stronger than that reported by Liu et al. [16] and Xu et al. [29], who also took PM 2.5 as the indicator of air pollution. Since this study utilized a sample covering almost all Chinese regions and focused on recent years, the results may better reflect the general situation in China in the recent period.
The estimation results in this study enables a quantitative evaluation of the potential of promoting inbound tourism by improving air quality. According to the estimation, if PM 2.5 density could be reduced by 1 μ g/m 3 , inbound tourist arrivals would rise by 1.7%. This impact is substantial. For instance, if PM 2.5 density can be reduced by 10 μ g/m 3 , which is not an unrealistic target, it is expected that inbound tourist arrivals would rise by around 17%. In 2016, the number of annual inbound tourist arrivals was 138 million person-times. An increase of 17% represents 23.46 million person-times. Obviously, improving air quality should be considered as a practical and effective way to promote China’s inbound tourism. If air quality in China can be substantially improved in the future, inbound tourist arrivals could potentially increase by at least tens of millions of person-times.
As reported in the section on heterogeneity analysis of different tourist groups, inbound tourists are more sensitive to air pollution in less polluted and more popular destinations. This finding indicates that air quality is a critically important factor of sustainable development in tourism-dependent areas. Because many scenic spots in less polluted areas are famous for their natural landscape, air pollution will substantially reduce the attractiveness or even destroy the beauty of these spots. Since popular destinations are representative of China and preferred options for most international travelers, their ability to attract tourists largely determines China’s position in the world tourism market. Thus, particular emphasis should be placed on pollution control in currently less polluted and more popular tourist destinations, in order to improve the attractiveness and competitiveness of China’s tourism.
Based on the results of this research, two practical implications can be drawn for China’s inbound tourism. First, from the perspective of industrial policy, it is urgent to implement environmental regulations effectively to ensure that the environment can be improved in the future. This is especially crucial in districts whose economies are largely dependent on tourism. The local governments in those districts should prioritize the issue of air quality improvement. Second, from the perspective of tourism marketing, in order to attract more international tourists, China’s destination image should be repaired from the negative influence of air pollution. It is valuable to inform potential foreign tourists that there are attractive places with good air quality and the air quality is getting better. The tourism sector needs to have supportive policies and conduct strong tourism destination marketing campaigns, such as participating in international tourism exhibitions and forums.
In fact, in the past few years, China has implemented a comprehensive and complicated set of policies to reduce air pollution, including many environmental laws and standards, environmental action plans proposed by the central and local governments, and specific and detailed regulatory measures on the production and economic activities [69,70]. China has achieved some substantial success in air pollution reduction, especially concerning SO 2 and NO x emissions. However, so far, PM concentrations remain high, and haze remains a severe problem in many areas [69,71]. It is necessary to promote research on the sources of PM pollutants, and apply new technologies and methods to further reduce emissions. Improving air quality will generate great benefits. More tourists will be attracted to boost the economy, and local residents’ life and public health will also be ameliorated.

6. Conclusions and Directions for Future Studies

In this study, we explored the negative effects of air pollution on inbound tourist arrivals in China, based on a gravity model using data of province-level inbound tourist arrivals from 13 origin countries during the period 2010–2016. The estimation results show that, on average, if PM 2.5 concentration in China increased by 1 μ g/m 3 , inbound tourist arrivals would decline by approximately 1.7%. This verifies Hypothesis 1, confirming that clean air is an important element of attractive tourist destinations. This finding generates a clear policy implication: China’s inbound tourism can be substantially expanded by implementing environmental protection policies. In addition, it was found that, if PM 2.5 concentration in tourist origin countries rose by 1 μ g/m 3 , inbound tourist arrivals in China would decline by roughly 3.8%. This supports Hypothesis 2, which can be explained by potential tourists’ increased perception of and concern about air pollution in response to the pollution problems in their home countries. This finding indicates that an accurate modelling of tourism demand should also take into account the influence of pollution in regions where tourists come from.
This study was restricted by several limitations that could be addressed in the future. First, this study focused on air pollution and neglected other types of pollution such as water pollution and solid waste. Although air pollution has a severe impact on tourism, as reported by this study, other kinds of pollution might also have a substantial influence (e.g., [72,73,74]). Taking into account multiple pollution categories would help provide a more comprehensive understanding of the environment–tourism nexus. In the future, researchers can consider different pollution types as independent variables in one regression model, and compare their estimated impacts. This will help identify the relative importance of different pollutants and facilitate the design of efficient policies. Second, this study evaluated the benefits of improving air quality to boost tourism, but did not assess the costs of air pollution reduction. Obviously, actions to improve air quality are not free. For instance, some environment-friendly production processes should be adopted and some air-cleaning equipment needs to be installed. In the future, a detailed cost–benefit analysis would provide valuable suggestions for tourism policy-makers. This requires the researchers to collect detailed information about the costs and benefits of pollution reduction. As it is difficult to obtain sufficient data for a wide geographic area, researchers may start from the analysis on a specific small region, such as one scenic spot.

Author Contributions

Conceptualization, data curation, formal analysis, funding acquisition, methodology, and original draft preparation, D.D.; literature review, review and editing, software, and validation, B.X. All authors have read and agreed to the published version of the manuscript.

Funding

This research was funded by the Fundamental Research Funds for the Central Universities (Grant No. JBK1809054).

Acknowledgments

The authors are grateful to the editors and three anonymous referees for their comments and suggestions.

Conflicts of Interest

The authors declare no conflict of interest.

References

  1. Zhang, L.; Gao, J. Exploring the effects of international tourism on China’s economic growth, energy consumption and environmental pollution: Evidence from a regional panel analysis. Renew. Sustain. Energy Rev. 2016, 53, 225–234. [Google Scholar] [CrossRef]
  2. Ministry of Culture and Tourism of the PRC. Basic Situation of Tourism Market in 2018 (in Chinese). 2019. Available online: http://zwgk.mct.gov.cn/auto255/201902/t20190212_837271.html (accessed on 15 November 2019).
  3. World Travel and Tourism Council. Travel and Tourism: Economic Impact 2018—China. 2018. Available online: https://www.chinatravelnews.com/images/201803/3e373c28a7e45f2b.pdf (accessed on 15 November 2019).
  4. Goodwin, H. Tourism and the Environment. Biologist 1995, 42, 129–133. [Google Scholar]
  5. Hu, W.; Wall, G. Environmental Management, Environmental Image and the Competitive Tourist Attraction. J. Sustain. Tour. 2005, 13, 617–635. [Google Scholar] [CrossRef]
  6. Mihalič, T. Environmental management of a tourist destination: A factor of tourism competitiveness. Tour. Manag. 2000, 21, 65–78. [Google Scholar] [CrossRef]
  7. Zhang, H.; Gu, C.l.; Gu, L.W.; Zhang, Y. The evaluation of tourism destination competitiveness by TOPSIS information entropy—A case in the Yangtze River Delta of China. Tour. Manag. 2011, 32, 443–451. [Google Scholar] [CrossRef]
  8. Zhang, A.; Zhong, L.; Xu, Y.; Wang, H.; Dang, L. Tourists’ Perception of Haze Pollution and the Potential Impacts on Travel: Reshaping the Features of Tourism Seasonality in Beijing, China. Sustainability 2015, 7, 2397–2414. [Google Scholar] [CrossRef] [Green Version]
  9. Hadley, M.B.; Vedanthan, R.; Fuster, V. Air pollution and cardiovascular disease: A window of opportunity. Nat. Rev. Cardiol. 2018, 15, 193–194. [Google Scholar] [CrossRef]
  10. Szyszkowicz, M.; Kousha, T.; Kingsbury, M.; Colman, I. Air Pollution and Emergency Department Visits for Depression: A Multicity Case-Crossover Study. Environ. Health Insights 2016, 10, 155–161. [Google Scholar] [CrossRef] [Green Version]
  11. Trasande, L.; Thurston, G.D. The role of air pollution in asthma and other pediatric morbidities. J. Allergy Clin. Immunol. 2005, 115, 689–699. [Google Scholar] [CrossRef] [PubMed]
  12. Mace, B.L.; Bell, P.A.; Loomis, R.J. Visibility and Natural Quiet in National Parks and Wilderness Areas: Psychological Considerations. Environ. Behav. 2004, 36, 5–31. [Google Scholar] [CrossRef]
  13. Poudyal, N.C.; Paudel, B.; Green, G.T. Estimating the Impact of Impaired Visibility on the Demand for Visits to National Parks. Tour. Econ. 2013, 19, 433–452. [Google Scholar] [CrossRef]
  14. Ministry of Ecology and Environment of the PRC. 2018 China Ecology and Environment Bulletin (in Chinese). 2019. Available online: http://www.mee.gov.cn/home/jrtt_1/201905/t20190529_704841.shtml (accessed on 15 November 2019).
  15. Wall Street Journal. Pollution Halves Visitors to Beijing. 2013. Available online: https://blogs.wsj.com/chinarealtime/2013/10/31/beijing-air-pollution-drives-50-drop-in-visitors/ (accessed on 15 November 2019).
  16. Liu, J.; Pan, H.; Zheng, S. Tourism Development, Environment and Policies: Differences between Domestic and International Tourists. Sustainability 2019, 11, 1390. [Google Scholar] [CrossRef] [Green Version]
  17. Tang, J.; Yuan, X.; Ramos, V.; Sriboonchitta, S. Does air pollution decrease inbound tourist arrivals? The case of Beijing. Asia Pac. J. Tour. Res. 2019, 24, 597–605. [Google Scholar] [CrossRef]
  18. Brida, J.G.; Cortes-Jimenez, I.; Pulina, M. Has the tourism-led growth hypothesis been validated? A literature review. Curr. Issues Tour. 2016, 19, 394–430. [Google Scholar] [CrossRef]
  19. Li, K.X.; Jin, M.; Shi, W. Tourism as an important impetus to promoting economic growth: A critical review. Tour. Manag. Perspect. 2018, 26, 135–142. [Google Scholar] [CrossRef]
  20. Paramati, S.R.; Alam, M.S.; Chen, C.F. The Effects of Tourism on Economic Growth and CO2 Emissions: A Comparison between Developed and Developing Economies. J. Travel Res. 2016, 56, 712–724. [Google Scholar] [CrossRef] [Green Version]
  21. Guindi, M.N.; Flaherty, G.T.; Byrne, M. Every breath you take: How does air pollution affect the international traveller? J. Travel Med. 2018, 25, tay021. [Google Scholar] [CrossRef] [Green Version]
  22. Pant, P.; Huynh, W.; Peltier, R.E. Exposure to air pollutants in Vietnam: Assessing potential risk for tourists. J. Environ. Sci. 2018, 73, 147–154. [Google Scholar] [CrossRef]
  23. Lu, F.; Xu, D.; Cheng, Y.; Dong, S.; Guo, C.; Jiang, X.; Zheng, X. Systematic review and meta-analysis of the adverse health effects of ambient PM2.5 and PM10 pollution in the Chinese population. Environ. Res. 2015, 136, 196–204. [Google Scholar] [CrossRef] [PubMed]
  24. Becken, S.; Jin, X.; Zhang, C.; Gao, J. Urban air pollution in China: Destination image and risk perceptions. J. Sustain. Tour. 2017, 25, 130–147. [Google Scholar] [CrossRef] [Green Version]
  25. Zhang, K.; Hou, Y.; Li, G.; Huang, Y. Tourists and Air Pollution: How and Why Air Pollution Magnifies Tourists’ Suspicion of Service Providers. J. Travel Res. 2019. [Google Scholar] [CrossRef]
  26. Deng, T.; Li, X.; Ma, M. Evaluating impact of air pollution on China’s inbound tourism industry: A spatial econometric approach. Asia Pac. J. Tour. Res. 2017, 22, 771–780. [Google Scholar] [CrossRef]
  27. Dong, D.; Xu, X.; Wong, Y.F. Estimating the Impact of Air Pollution on Inbound Tourism in China: An Analysis Based on Regression Discontinuity Design. Sustainability 2019, 11, 1682. [Google Scholar] [CrossRef] [Green Version]
  28. Xu, X.; Reed, M. Perceived pollution and inbound tourism in China. Tour. Manag. Perspect. 2017, 21, 109–112. [Google Scholar] [CrossRef]
  29. Xu, X.; Dong, D.; Wang, Y.; Wang, S. The Impacts of Different Air Pollutants on Domestic and Inbound Tourism in China. Int. J. Environ. Res. Public Health 2019, 16, 5127. [Google Scholar] [CrossRef] [Green Version]
  30. Zhou, B.; Qu, H.; Du, X.; Yang, B.; Liu, F. Air Quality and Inbound Tourism in China. Tour. Anal. 2018, 23, 159–164. [Google Scholar] [CrossRef]
  31. Zhou, X.; Santana Jiménez, Y.; Pérez Rodríguez, J.V.; Hernández, J.M. Air pollution and tourism demand: A case study of Beijing, China. Int. J. Tour. Res. 2019, 21, 747–757. [Google Scholar] [CrossRef]
  32. Cheung, C.; Law, R. The impact of air quality on tourism: The case of Hong Kong. Pac. Tour. Rev. 2001, 5, 69–74. [Google Scholar]
  33. Law, R.; Cheung, C. Air Quality in Hong Kong: A Study of the Perception of International Visitors. J. Sustain. Tour. 2007, 15, 390–401. [Google Scholar] [CrossRef]
  34. Chen, C.M.; Lin, Y.L.; Hsu, C.L. Does air pollution drive away tourists? A case study of the Sun Moon Lake National Scenic Area, Taiwan. Transp. Res. Part D Transp. Environ. 2017, 53, 398–402. [Google Scholar] [CrossRef]
  35. Wang, L.; Fang, B.; Law, R. Effect of air quality in the place of origin on outbound tourism demand: Disposable income as a moderator. Tour. Manag. 2018, 68, 152–161. [Google Scholar] [CrossRef]
  36. Deguen, S.; Pédrono, G.; Ségala, C.; Mesbah, M. Association Between Pollution and Public Perception of Air Quality-SEQAP, a Risk Perception Study in France. Epidemiology 2008, 19, S216. [Google Scholar]
  37. Atari, D.O.; Luginaah, I.N.; Fung, K. The Relationship between Odour Annoyance Scores and Modelled Ambient Air Pollution in Sarnia, “Chemical Valley”, Ontario. Int. J. Environ. Res. Public Health 2009, 6, 2655. [Google Scholar] [CrossRef] [Green Version]
  38. Moffatt, S.; Phillimore, P.; Bhopal, R.; Foy, C. ‘If this is what it’s doing to our washing, what is it doing to our lungs?’ Industrial pollution and public understanding in North-East England. Soc. Sci. Med. 1995, 41, 883–891. [Google Scholar] [CrossRef]
  39. Oglesby, L.; Künzli, N.; Monn, C.; Schindler, C.; Ackermann-Liebrich, U.; Leuenberger, P.; the SAPALDIA Team. Validity of Annoyance Scores for Estimation of Long Term Air Pollution Exposure in Epidemiologic Studies: The Swiss Study on Air Pollution and Lung Diseases in Adults (SAPALDIA). Am. J. Epidemiol. 2000, 152, 75–83. [Google Scholar] [CrossRef] [Green Version]
  40. Dong, D.; Xu, X.; Xu, W.; Xie, J. The Relationship Between the Actual Level of Air Pollution and Residents’ Concern about Air Pollution: Evidence from Shanghai, China. Int. J. Environ. Res. Public Health 2019, 16, 4784. [Google Scholar] [CrossRef] [Green Version]
  41. Pu, S.; Shao, Z.; Fang, M.; Yang, L.; Liu, R.; Bi, J.; Ma, Z. Spatial distribution of the public’s risk perception for air pollution: A nationwide study in China. Sci. Total Environ. 2019, 655, 454–462. [Google Scholar] [CrossRef]
  42. Guo, Y.; Li, Y. Online amplification of air pollution risk perception: The moderating role of affect in information. Inf. Commun. Soc. 2018, 21, 80–93. [Google Scholar] [CrossRef]
  43. Morley, C.; Rosselló, J.; Santana-Gallego, M. Gravity models for tourism demand: Theory and use. Ann. Tour. Res. 2014, 48. [Google Scholar] [CrossRef]
  44. Huang, X.; Han, Y.; Gong, X.; Liu, X. Does the belt and road initiative stimulate China’s inbound tourist market? An empirical study using the gravity model with a DID method. Tour. Econ. 2019. [Google Scholar] [CrossRef]
  45. Xu, L.; Wang, S.; Li, J.; Tang, L.; Shao, Y. Modelling international tourism flows to China: A panel data analysis with the gravity model. Tour. Econ. 2019, 25, 1047–1069. [Google Scholar] [CrossRef]
  46. Yang, Y.; Wong, K.K.F. The influence of cultural distance on China inbound tourism flows: A panel data gravity model approach. Asian Geogr. 2012, 29, 21–37. [Google Scholar] [CrossRef]
  47. Barregard, L.; Molnàr, P.; Jonson, E.J.; Stockfelt, L. Impact on Population Health of Baltic Shipping Emissions. Int. J. Environ. Res. Public Health 2019, 16, 1954. [Google Scholar] [CrossRef] [PubMed] [Green Version]
  48. Colacci, A.; Vaccari, M.; Mascolo, G.M.; Rotondo, F.; Morandi, E.; Quercioli, D.; Perdichizzi, S.; Zanzi, C.; Serra, S.; Poluzzi, V.; et al. Alternative Testing Methods for Predicting Health Risk from Environmental Exposures. Sustainability 2014, 6, 5265–5283. [Google Scholar] [CrossRef] [Green Version]
  49. Săndică, A.M.; Dudian, M.; Ştefănescu, A. Air Pollution and Human Development in Europe: A New Index Using Principal Component Analysis. Sustainability 2018, 10, 312. [Google Scholar] [CrossRef] [Green Version]
  50. Song, C.; He, J.; Wu, L.; Jin, T.; Chen, X.; Li, R.; Ren, P.; Zhang, L.; Mao, H. Health burden attributable to ambient PM2.5 in China. Environ. Pollut. 2017, 223, 575–586. [Google Scholar] [CrossRef]
  51. Xu, D.; Huang, Z.; Hou, G.; Zhang, C. The spatial spillover effects of haze pollution on inbound tourism: evidence from mid-eastern China. Tour. Geogr. 2019. [Google Scholar] [CrossRef]
  52. Yin, H.; Pizzol, M.; Xu, L. External costs of PM2.5 pollution in Beijing, China: Uncertainty analysis of multiple health impacts and costs. Environ. Pollut. 2017, 226, 356–369. [Google Scholar] [CrossRef]
  53. Khadaroo, J.; Seetanah, B. The role of transport infrastructure in international tourism development: A gravity model approach. Tour. Manag. 2008, 29, 831–840. [Google Scholar] [CrossRef]
  54. Santeramo, F.G.; Morelli, M. Modelling tourism flows through gravity models: A quantile regression approach. Curr. Issues Tour. 2016, 19, 1077–1083. [Google Scholar] [CrossRef]
  55. Zamparini, L.; Vergori, A.S.; Arima, S. Assessing the determinants of local tourism demand: A simultaneous equations model for the Italian provinces. Tour. Econ. 2017, 23, 981–992. [Google Scholar] [CrossRef]
  56. Zheng, Q.; Kuang, Y.; Huang, N. Coordinated Development between Urban Tourism Economy and Transport in the Pearl River Delta, China. Sustainability 2016, 8, 1338. [Google Scholar] [CrossRef] [Green Version]
  57. Mangion, M.L.; Durbarry, R.; Sinclair, M.T. Tourism Competitiveness: Price and Quality. Tour. Econ. 2005, 11, 45–68. [Google Scholar] [CrossRef]
  58. Seetanah, B.; Sannassee, R.; Rojid, S. The impact of relative prices on tourism demand for Mauritius: An empirical analysis. Dev. South. Afr. 2015, 32, 363–376. [Google Scholar] [CrossRef]
  59. Vogt, M.G.; Wittayakorn, C. Determinants of the demand for Thailand’s exports of tourism. Appl. Econ. 1998, 30, 711–715. [Google Scholar] [CrossRef]
  60. Dwyer, L.; Forsyth, P.; Rao, P. The price competitiveness of travel and tourism: A comparison of 19 destinations. Tour. Manag. 2000, 21, 9–22. [Google Scholar] [CrossRef]
  61. Martin, C.A.; Witt, S.F. Substitute prices in models of tourism demand. Ann. Tour. Res. 1988, 15, 255–268. [Google Scholar] [CrossRef]
  62. Ahn, M.J.; McKercher, B. The Effect of Cultural Distance on Tourism: A Study of International Visitors to Hong Kong. Asia Pac. J. Tour. Res. 2015, 20, 94–113. [Google Scholar] [CrossRef]
  63. Arita, S.; Edmonds, C.; Croix, S.L.; Mak, J. Impact of Approved Destination Status on Chinese Travel Abroad: An Econometric Analysis. Tour. Econ. 2011, 17, 983–996. [Google Scholar] [CrossRef]
  64. Gil-Pareja, S.; Llorca-Vivero, R.; Martínez-Serrano, J.A. The impact of embassies and consulates on tourism. Tour. Manag. 2007, 28, 355–360. [Google Scholar] [CrossRef]
  65. Holden, A. The environment-tourism nexus: Influence of market ethics. Ann. Tour. Res. 2009, 36, 373–389. [Google Scholar] [CrossRef]
  66. Hien, P.D.; Bac, V.T.; Tham, H.C.; Nhan, D.D.; Vinh, L.D. Influence of meteorological conditions on PM2.5 and PM2.5–10 concentrations during the monsoon season in Hanoi, Vietnam. Atmos. Environ. 2002, 36, 3473–3484. [Google Scholar] [CrossRef]
  67. Koutrakis, P.; Sax, S.N.; Sarnat, J.A.; Coull, B.; Demokritou, P.; Demokritou, P.; Oyola, P.; Garcia, J.; Gramsch, E. Analysis of PM10, PM2.5, and PM2.5–10 Concentrations in Santiago, Chile, from 1989 to 2001. J. Air Waste Manag. Assoc. 2005, 55, 342–351. [Google Scholar] [CrossRef]
  68. Wang, J.; Ogawa, S. Effects of Meteorological Conditions on PM2.5 Concentrations in Nagasaki, Japan. Int. J. Environ. Res. Public Health 2015, 12, 9089–9101. [Google Scholar] [CrossRef]
  69. Jin, Y.; Andersson, H.; Zhang, S. Air Pollution Control Policies in China: A Retrospective and Prospects. Int. J. Environ. Res. Public Health 2016, 13, 1219. [Google Scholar] [CrossRef] [Green Version]
  70. Yang, W.; Yuan, G.; Han, J. Is China’s air pollution control policy effective? Evidence from Yangtze River Delta cities. J. Clean. Prod. 2019, 220, 110–133. [Google Scholar] [CrossRef]
  71. Zeng, Y.; Cao, Y.; Qiao, X.; Seyler, B.C.; Tang, Y. Air pollution reduction in China: Recent success but great challenge for the future. Sci. Total Environ. 2019, 663, 329–337. [Google Scholar] [CrossRef]
  72. Jang, Y.C.; Hong, S.; Lee, J.; Lee, M.J.; Shim, W.J. Estimation of lost tourism revenue in Geoje Island from the 2011 marine debris pollution event in South Korea. Mar. Pollut. Bull. 2014, 81, 49–54. [Google Scholar] [CrossRef] [PubMed]
  73. Krelling, A.P.; Williams, A.T.; Turra, A. Differences in perception and reaction of tourist groups to beach marine debris that can influence a loss of tourism revenue in coastal areas. Mar. Policy 2017, 85, 87–99. [Google Scholar] [CrossRef]
  74. Williams, A.T.; Rangel-Buitrago, N.G.; Anfuso, G.; Cervantes, O.; Botero, C.M. Litter impacts on scenery and tourism on the Colombian north Caribbean coast. Tour. Manag. 2016, 55, 209–224. [Google Scholar] [CrossRef]
Figure 1. Number of inbound vs. domestic tourist arrivals in China (2010–2018). Data source: Yearbook of China Tourism Statistics published by the National Bureau of Statistics of China.
Sustainability 12 01456 g001
Figure 2. Ratio of inbound tourist arrivals to local population in China vs. other countries (2010–2016). Data source: World Bank’s World Development Indicators (WDI) dataset. Statistics shown in this graph are only for overnight visitors.
Sustainability 12 01456 g002
Figure 3. Severity of air pollution in China vs. other countries (2010–2016). Data source: World Bank’s World Development Indicators (WDI) dataset. Abbreviations: PM 2.5 , particulate matter with a diameter of 2.5 micrometers or less; WHO, World Health Organization.
Sustainability 12 01456 g003
Table 1. Summary statistics.
VariableDefinitionMeanSDMinMax
Tourist arrivals l n ( A r r i v a l s ) i j Inbound tourist arrivals (person-times)10.2641.7573.36714.245
Air pollution A i r P o l l u t i o n i PM 2.5 concentration ( μ g/m 3 )30.75417.2123.26082.420
A i r P o l l u t i o n j PM 2.5 concentration ( μ g/m 3 )16.3166.8216.54931.610
Destination features l n ( P o p u l a t i o n ) i Population (10,000 persons)8.1130.8435.7049.306
l n ( G D P p c ) i GDP per capita (in constant 2010 USD)8.6240.4307.5769.626
l n ( S c e n i c ) i Number of 4A- and 5A-rated scenic spots4.2910.7042.3985.517
l n ( H o t e l ) i Number of star-rated hotels5.7130.6244.0076.916
H o s p i t a l i Number of health-care workers (per 10,000 residents)73.11213.83544.336137.810
T r a n s p o r t i Length of road (km per 10,000 residents)42.52139.8545.149248.024
U r b a n i Urbanization rate (%)54.43413.72722.67089.600
G D P g r i Annual GDP growth rate (%)10.1422.782−2.50017.400
S t r u c t u r e i Share of non-agricultural value added in GDP (%)89.6875.11273.80099.610
T e m p e r a t u r e i Annual average temperature ( C)13.7335.5181.79125.800
R a i n i Annual proportion of rainy days0.3050.1000.0970.555
Origin features l n ( P o p u l a t i o n ) j Population17.8780.96215.44019.593
l n ( G D P p c ) j GDP per capita (in constant 2010 USD)10.3550.6108.62711.347
T r a n s p o r t j Number of registered carrier departures per capita0.0160.0110.0020.038
U r b a n j Urbanization rate (%)76.78614.78243.856100
G D P g r j Annual GDP growth rate (%)3.0882.330−2.30814.526
Interaction variables l n ( E R ) i j Relative exchange rate adjusted by price level0.1170.129−0.0550.551
l n ( D i s t a n c e ) i j Distance (km)8.5050.6996.3299.506
T r a d e O p e n i j Ratio of bilateral trade volume to GDP0.0030.01000.117
V i s a F r e e i j Dummy variable for 72-h visa-free policy0.3100.46301
Abbreviations: SD, standard deviation; Min, minimum; Max, maximum.
Table 2. Impact of air pollution on China’s inbound tourism estimated at the province level.
Estimated Coefficient
Baseline ModelRobustness Analysis
VariableUse AQIIV-2SLSIV-GMM
EstimationEstimation
(i)(ii)(iii)(iv)
Air pollution A i r P o l l u t i o n i −0.017 ***−0.014 ***−0.050 *−0.053 *
A i r P o l l u t i o n j −0.038 *−0.027 *−0.039 *−0.040 *
Destination features l n ( P o p u l a t i o n ) i −2.315−2.409−3.320 *−3.659 **
l n ( G D P p c ) i 2.021 ***1.992 ***1.795 ***1.754 ***
l n ( S c e n i c ) i 0.290 *0.296 *0.367 **0.391 **
l n ( H o t e l ) i 0.264 *0.261 *0.1900.195
H o s p i t a l i 0.0030.003−0.006−0.008
T r a n s p o r t i 0.036 ***0.036 ***0.040 ***0.041 ***
U r b a n i −0.092 ***−0.094 ***−0.117 ***−0.120 ***
G D P g r i −0.048 ***−0.048 ***−0.041 **−0.039 **
S t r u c t u r e i 0.117 ***0.117 ***0.118 ***0.113 ***
T e m p e r a t u r e i −0.035−0.034−0.038−0.040
R a i n i 0.5380.5550.8540.892
Origin features l n ( P o p u l a t i o n ) j 0.7270.7320.7760.760
l n ( G D P p c ) j −0.909−0.91−0.922−0.978
T r a n s p o r t j 27.240 **27.185 **26.679 **26.397 **
U r b a n j 0.0040.0040.0050.003
G D P g r j −0.0004−0.0004−0.0003−0.002
Interaction variables l n ( E R ) i j −0.518 *−0.518 *−0.516 *−0.491
l n ( D i s t a n c e ) i j −1.340 ***−1.340 ***−1.341 ***−1.341 ***
T r a d e O p e n i j 4.891 ***4.882 ***4.731 ***4.709 ***
V i s a F r e e i j 0.0690.0670.0490.053
Province-fixed effectYesYesYesYes
Country-fixed effectYesYesYesYes
Time-fixed effectYesYesYesYes
Observations2651265126512651
R 2 0.8190.8190.8170.816
Cragg-Donald Wald F-statistic--48.431 **48.431 **
Kleibergen-Paap rk Wald F-statistic--48.519 **48.519 **
Hansen J-statistic--1.1411.141
Statistical significance: * p 10%, ** p 5%, *** p 1%. Abbreviations: AQI, air quality index; IV, instrumental variable; 2SLS, two-stage least squares; GMM, general method of moments.
Table 3. Heterogeneous impact of air pollution on China’s inbound tourism estimated at the province level.
VariableEstimated Coefficient
(i)(ii)(iii)(iv)
Air pollution A i r P o l l u t i o n i −0.014 **−0.014 **−0.011 *0.006
A i r P o l l u t i o n i × D j H i g h P o l l u t i o n −0.006 ***
A i r P o l l u t i o n i × D j A s i a n C o u n t r i e s −0.005 ***
A i r P o l l u t i o n i × D i L o w P o l l u t i o n −0.035 **
A i r P o l l u t i o n i × D i P o p u l a r D e s t i n a t i o n s −0.040 ***
A i r P o l l u t i o n j −0.038 *−0.038 *−0.038 *−0.038 *
Destination features l n ( P o p u l a t i o n ) i −2.314−2.312−2.902 *−2.775 *
l n ( G D P p c ) i 2.022 ***2.023 ***1.725 ***2.230 ***
l n ( S c e n i c ) i 0.289 *0.289 *0.309 *0.225
l n ( H o t e l ) i 0.263 *0.264 *0.282 **0.291 **
H o s p i t a l i 0.0030.0040.000050.001
T r a n s p o r t i 0.036 ***0.036 ***0.037 ***0.035 ***
U r b a n i −0.092 ***−0.093 ***−0.095 ***−0.088 ***
G D P g r i −0.048 ***−0.048 ***−0.040 **−0.044 **
S t r u c t u r e i 0.117 ***0.117 ***0.117 ***0.097 ***
T e m p e r a t u r e i −0.035−0.035−0.031−0.055
R a i n i 0.5390.5390.6030.269
Origin features l n ( P o p u l a t i o n ) j 0.7010.7220.7210.689
l n ( G D P p c ) j −0.915−0.899−0.903−0.920
T r a n s p o r t j 27.371 **27.315 **27.387 **27.613 **
U r b a n j 0.0040.0040.0040.004
G D P g r j −0.0004−0.0002−0.0004−0.0005
Interaction variables l n ( E R ) i j −0.528 *−0.515 *−0.512 *−0.532 *
l n ( D i s t a n c e ) i j −1.336 ***−1.356 ***−1.340 ***−1.340 ***
T r a d e O p e n i j 6.394 ***5.953 ***4.844 ***4.860 ***
V i s a F r e e i j 0.0690.0660.0730.079
Province-fixed effectYesYesYesYes
Country-fixed effectYesYesYesYes
Time-fixed effectYesYesYesYes
Observations2651265126512651
R 2 0.8200.8200.8200.820
Statistical significance: * p 10%, ** p 5%, *** p 1%.
Table 4. Estimated response of inbound tourist arrivals to a 1 μ g/m 3 increase in air pollutant concentration in China, as reported in previous studies.
LiteratureArea StudiedPeriod CoveredAir PollutantEstimated Effect
Dong et al. [27]274 cities in China2009–2012PM 10 −0.56%
Xu et al. [29]337 cities in China2007–2016insignificant
Zhou et al. [31]Beijing, China2005–2016−0.33%
Liu et al. [16]17 provinces in China2005–2015PM 2.5 insignificant
Xu et al. [29]337 cities in China2007–2016−1.23%

