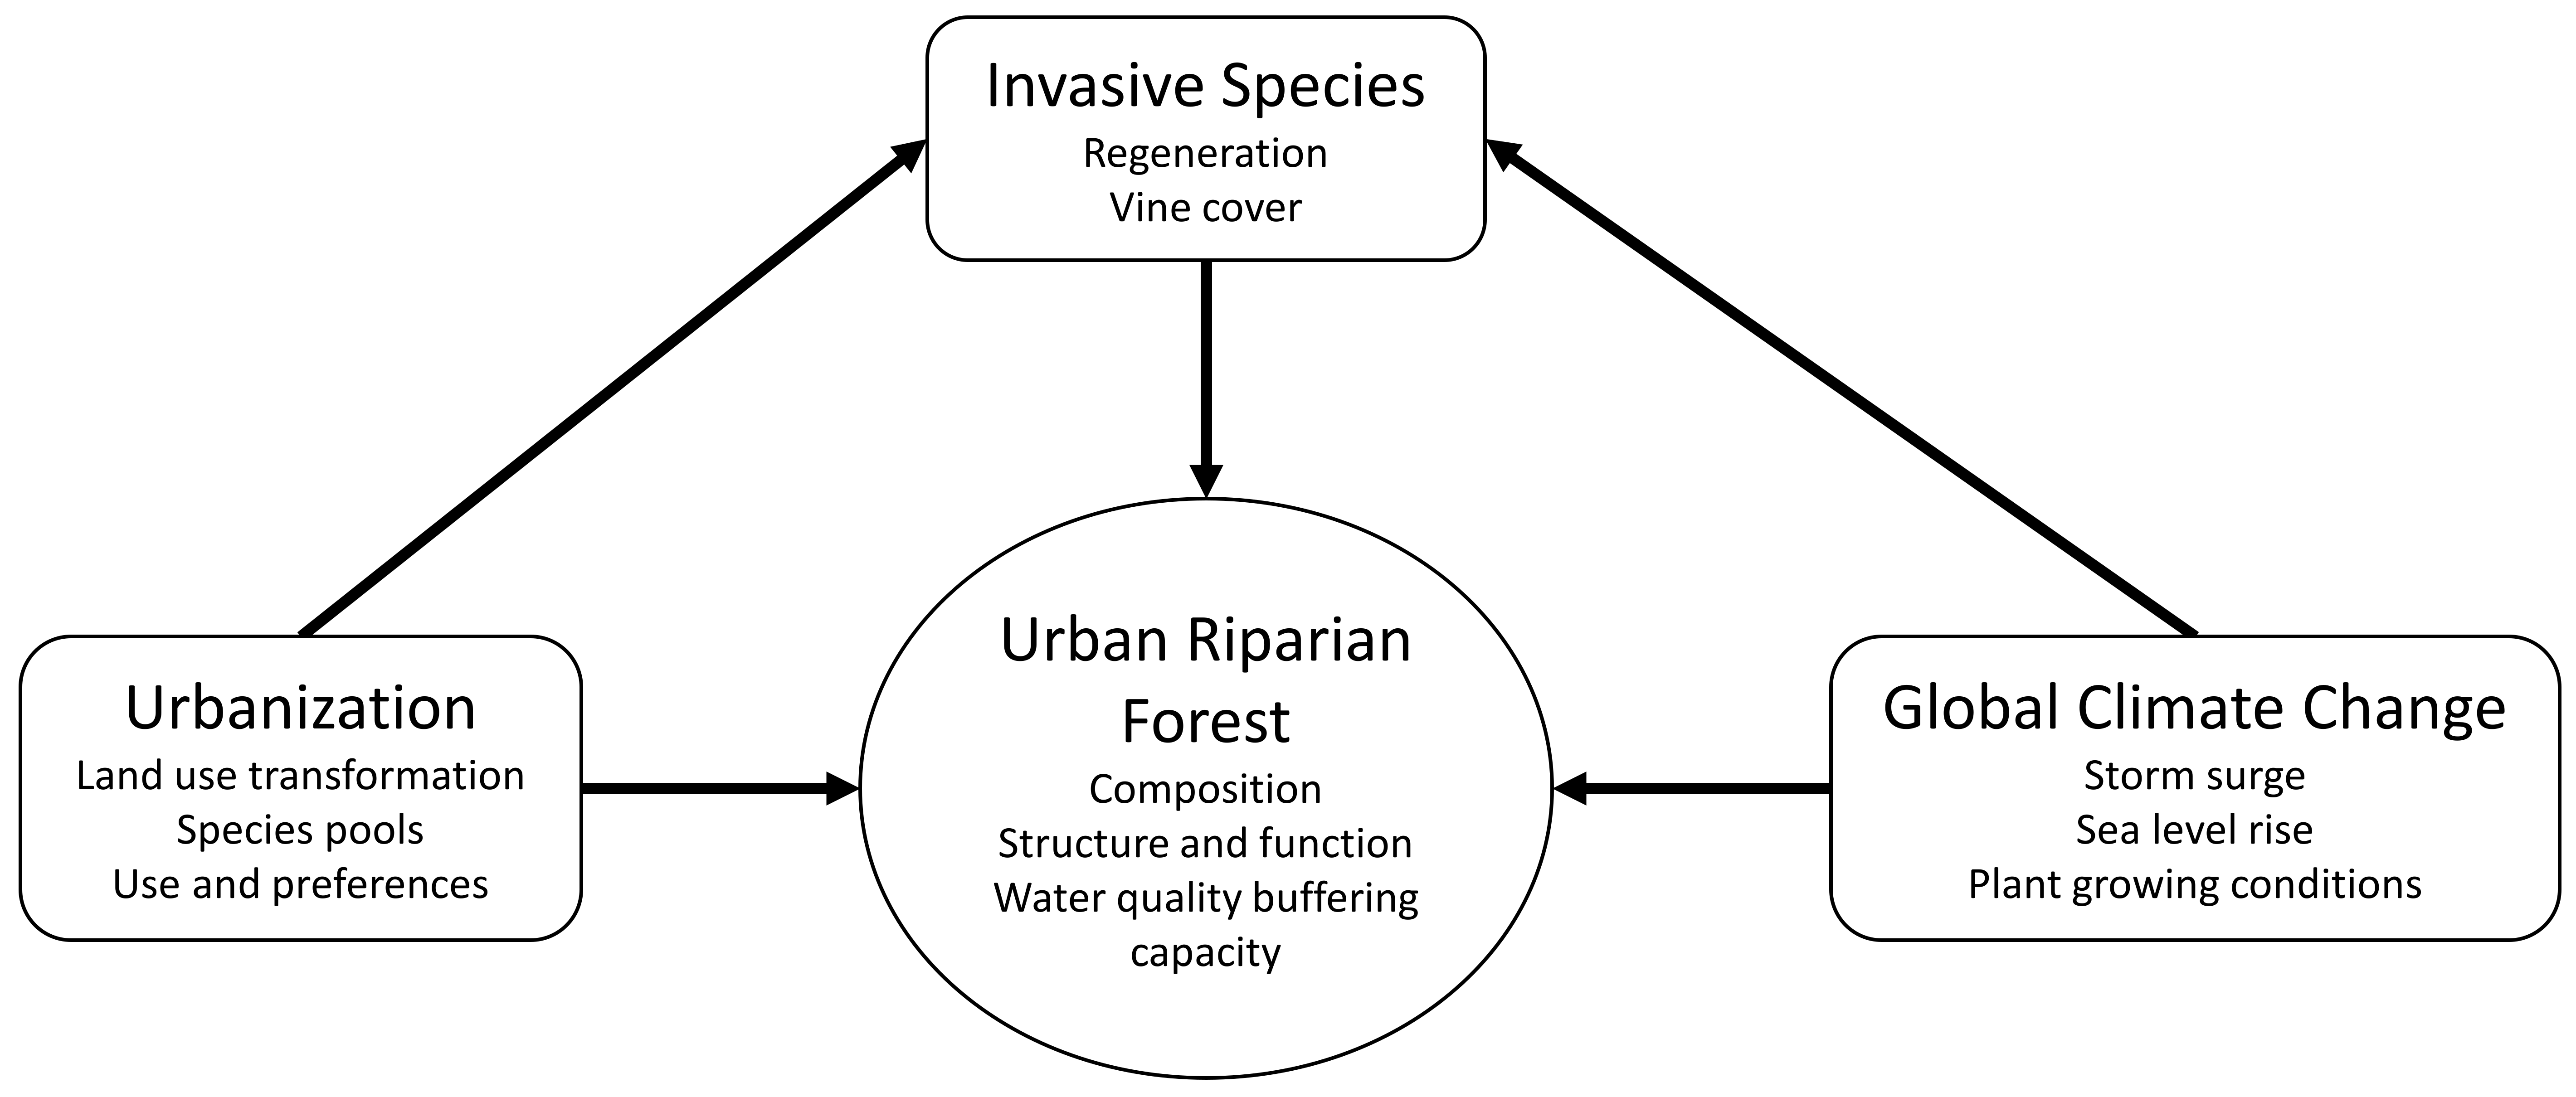
Squeezed from All Sides: Urbanization, Invasive Species, and Climate Change Threaten Riparian Forest Buffers

 , , and
Abstract
1. Introduction
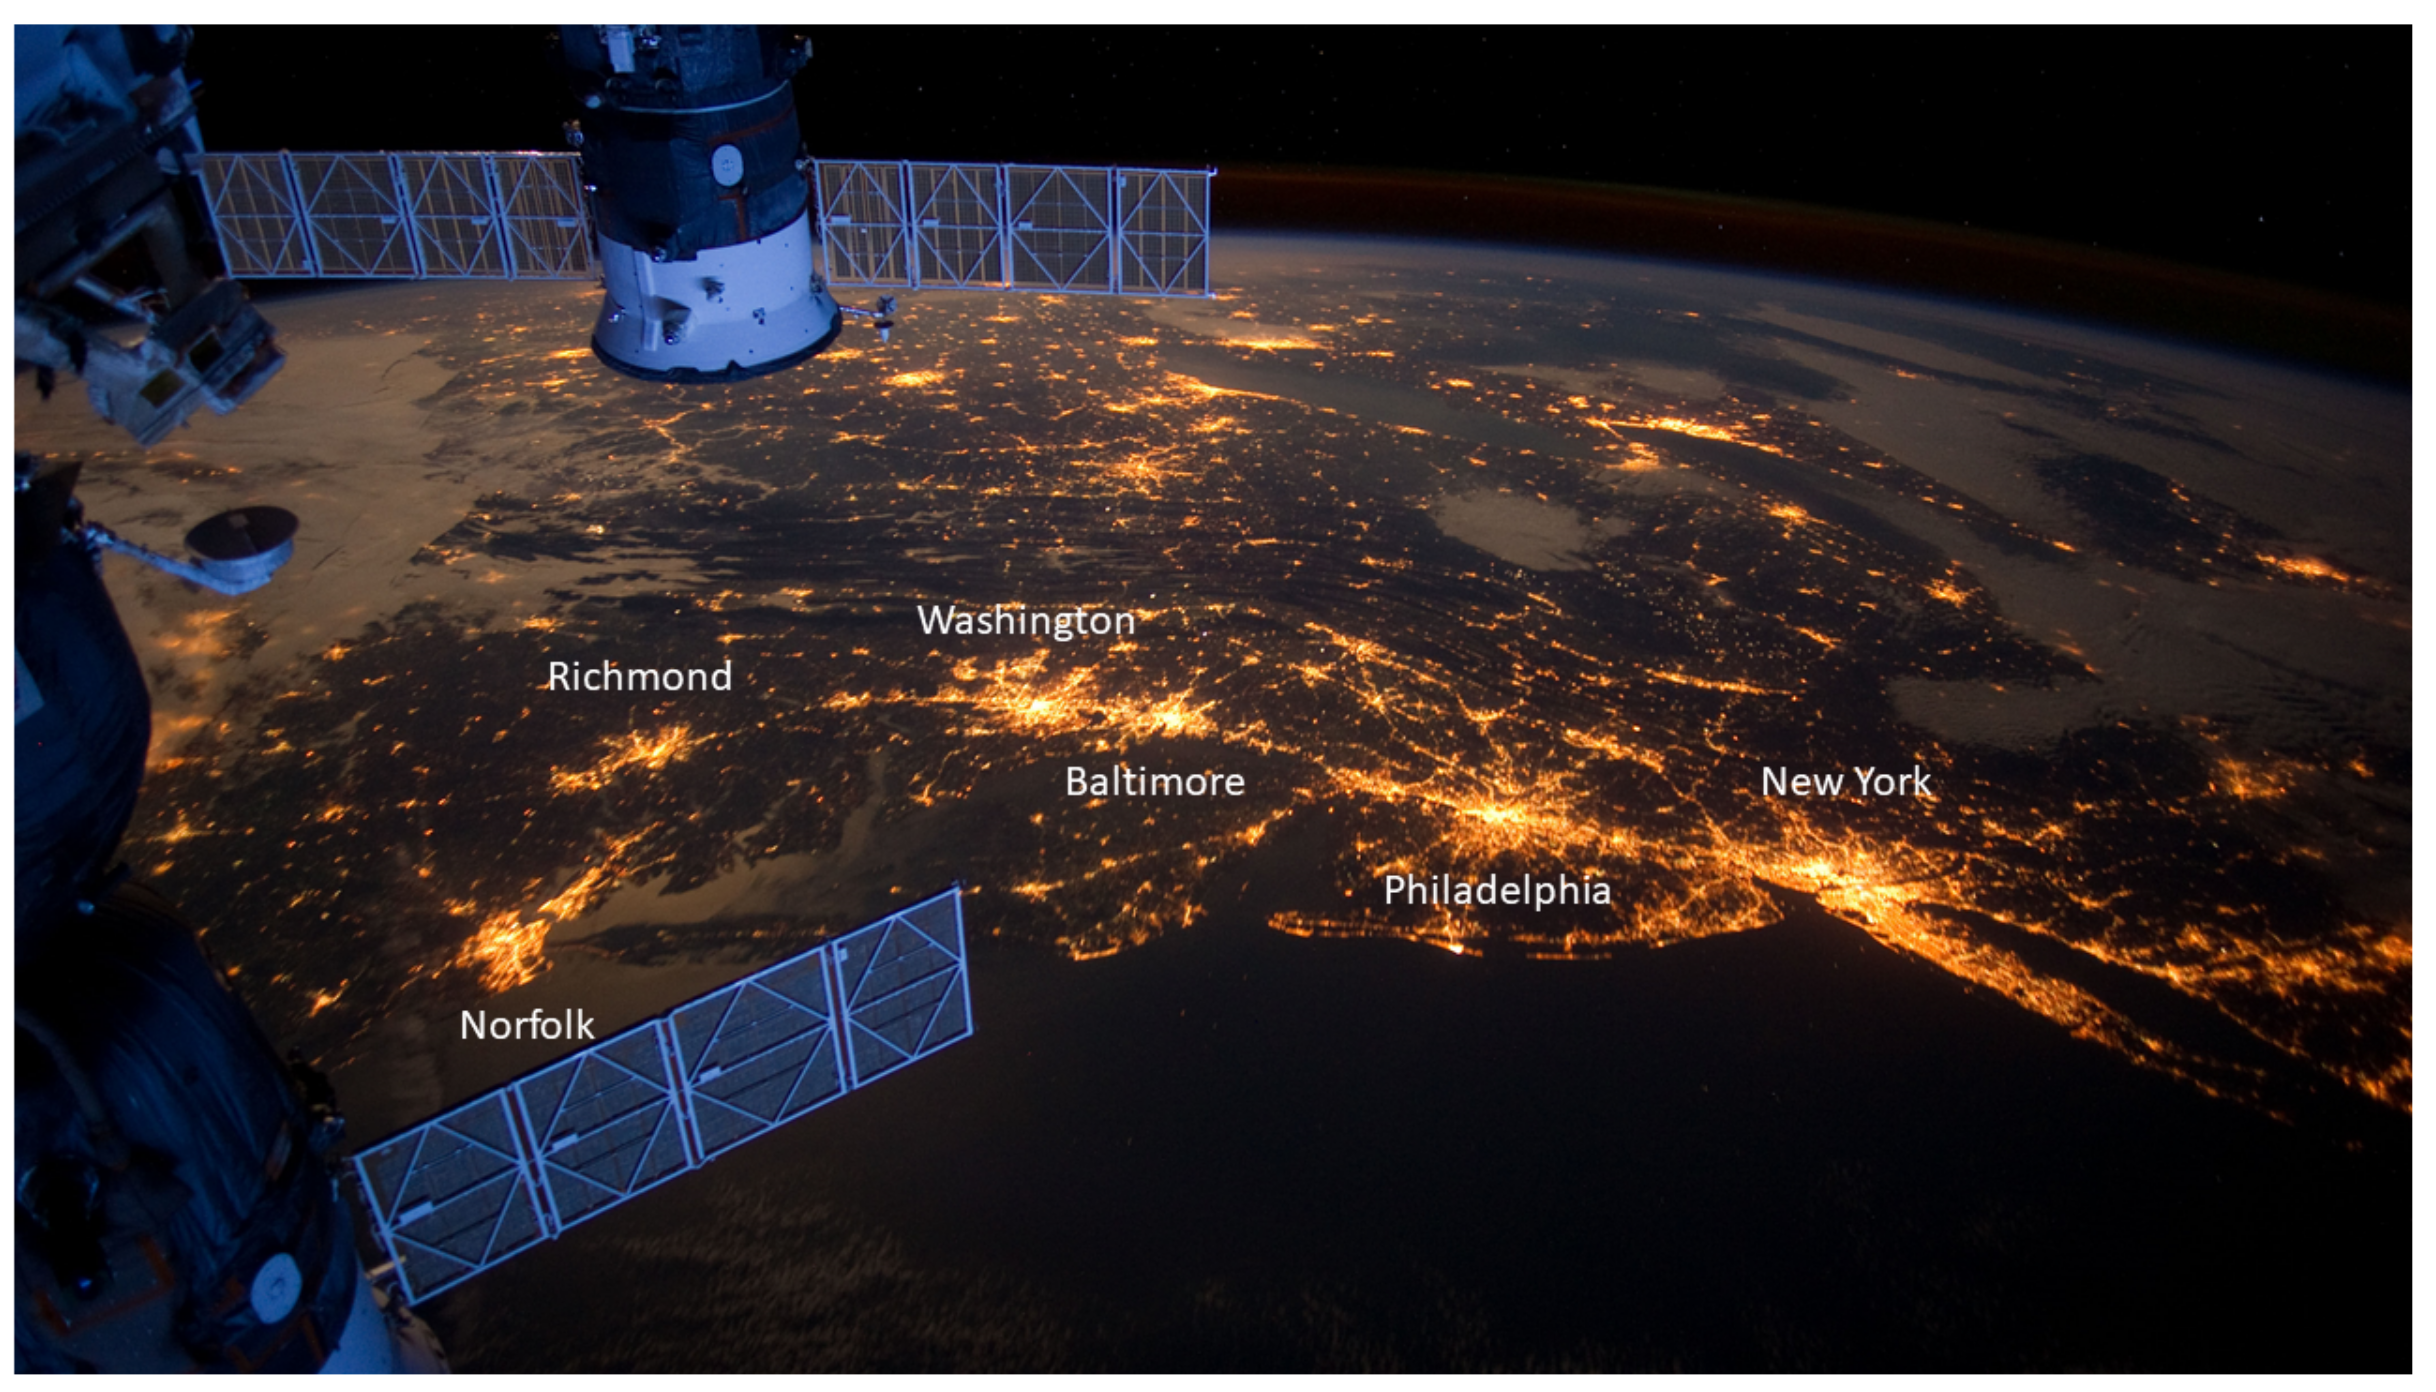
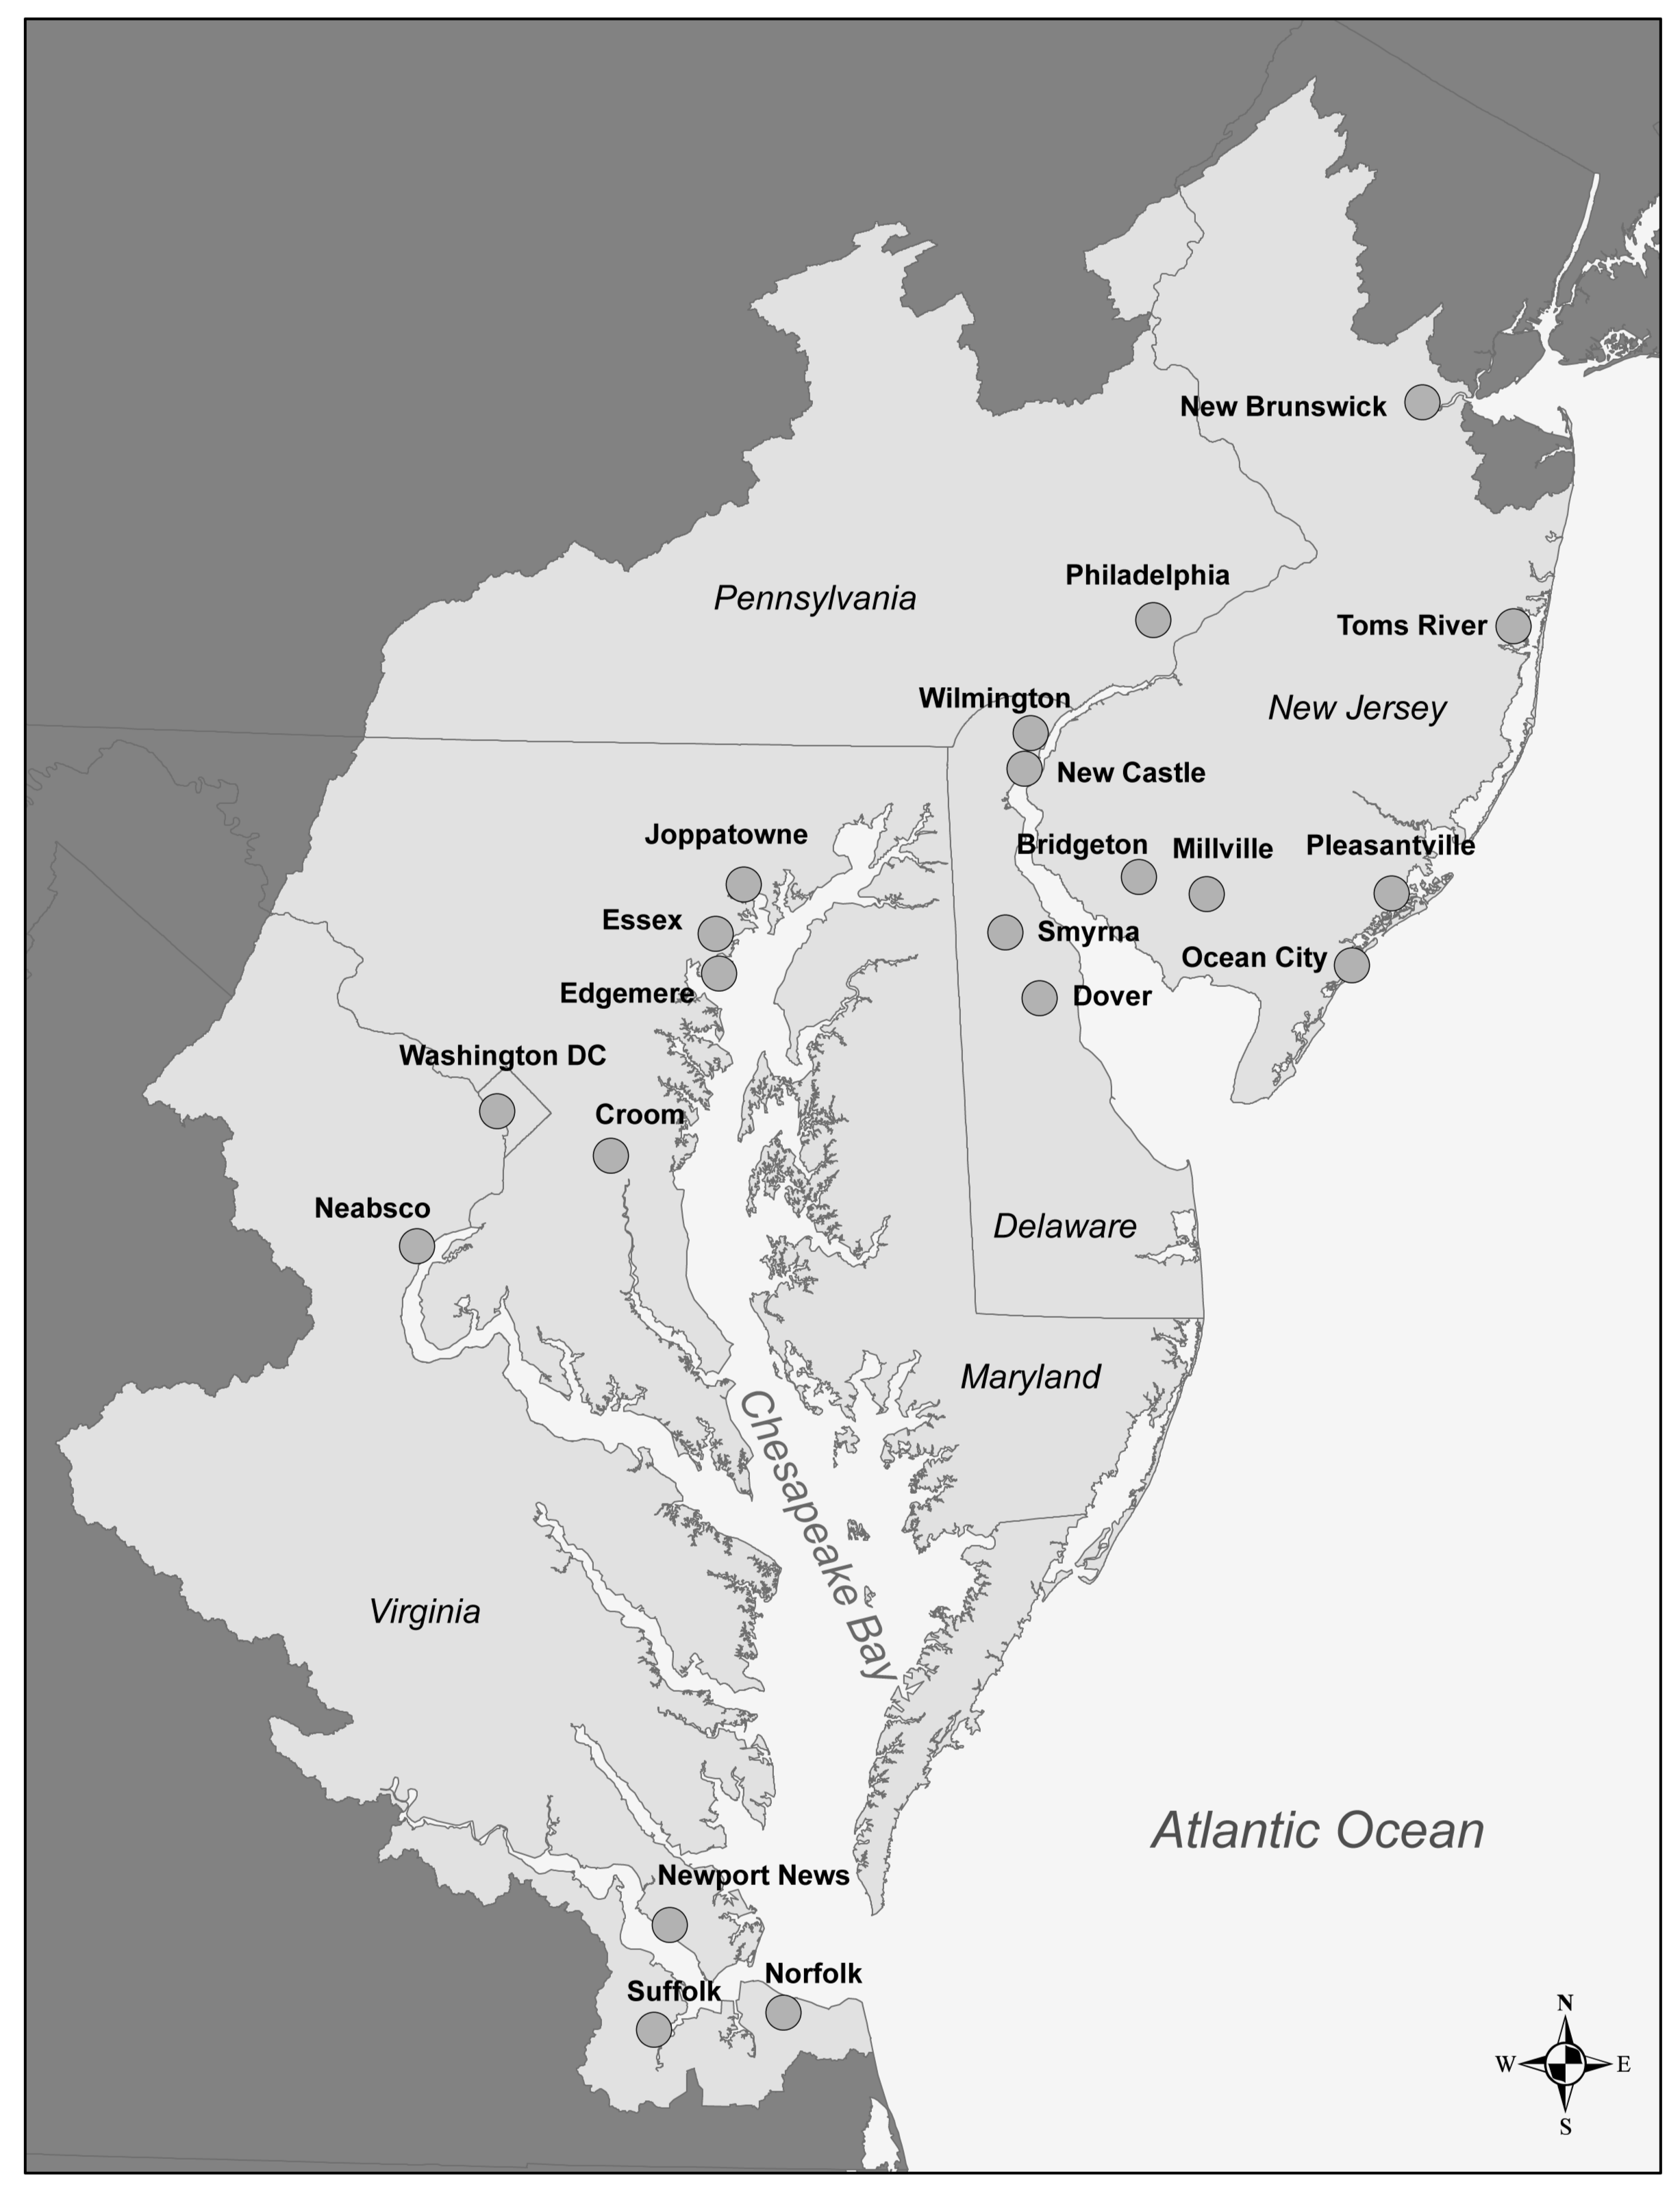
Study Area
2. Materials and Methods
2.1. Squeeze Modeling
2.1.1. Modeling Urbanization and Forest Extent
2.1.2. Modeling Sea Level Rise and Storm Surge Vulnerability
2.2. Field Rapid Assessment of Stressors and Forest Conditions
2.2.1. Selection and Location of Sampling Points
2.2.2. Field Sampling: Vegetation
2.2.3. Field Sampling: Disturbance Indicators
2.3. Statistical Analysis
3. Results
3.1. Spatial Extent
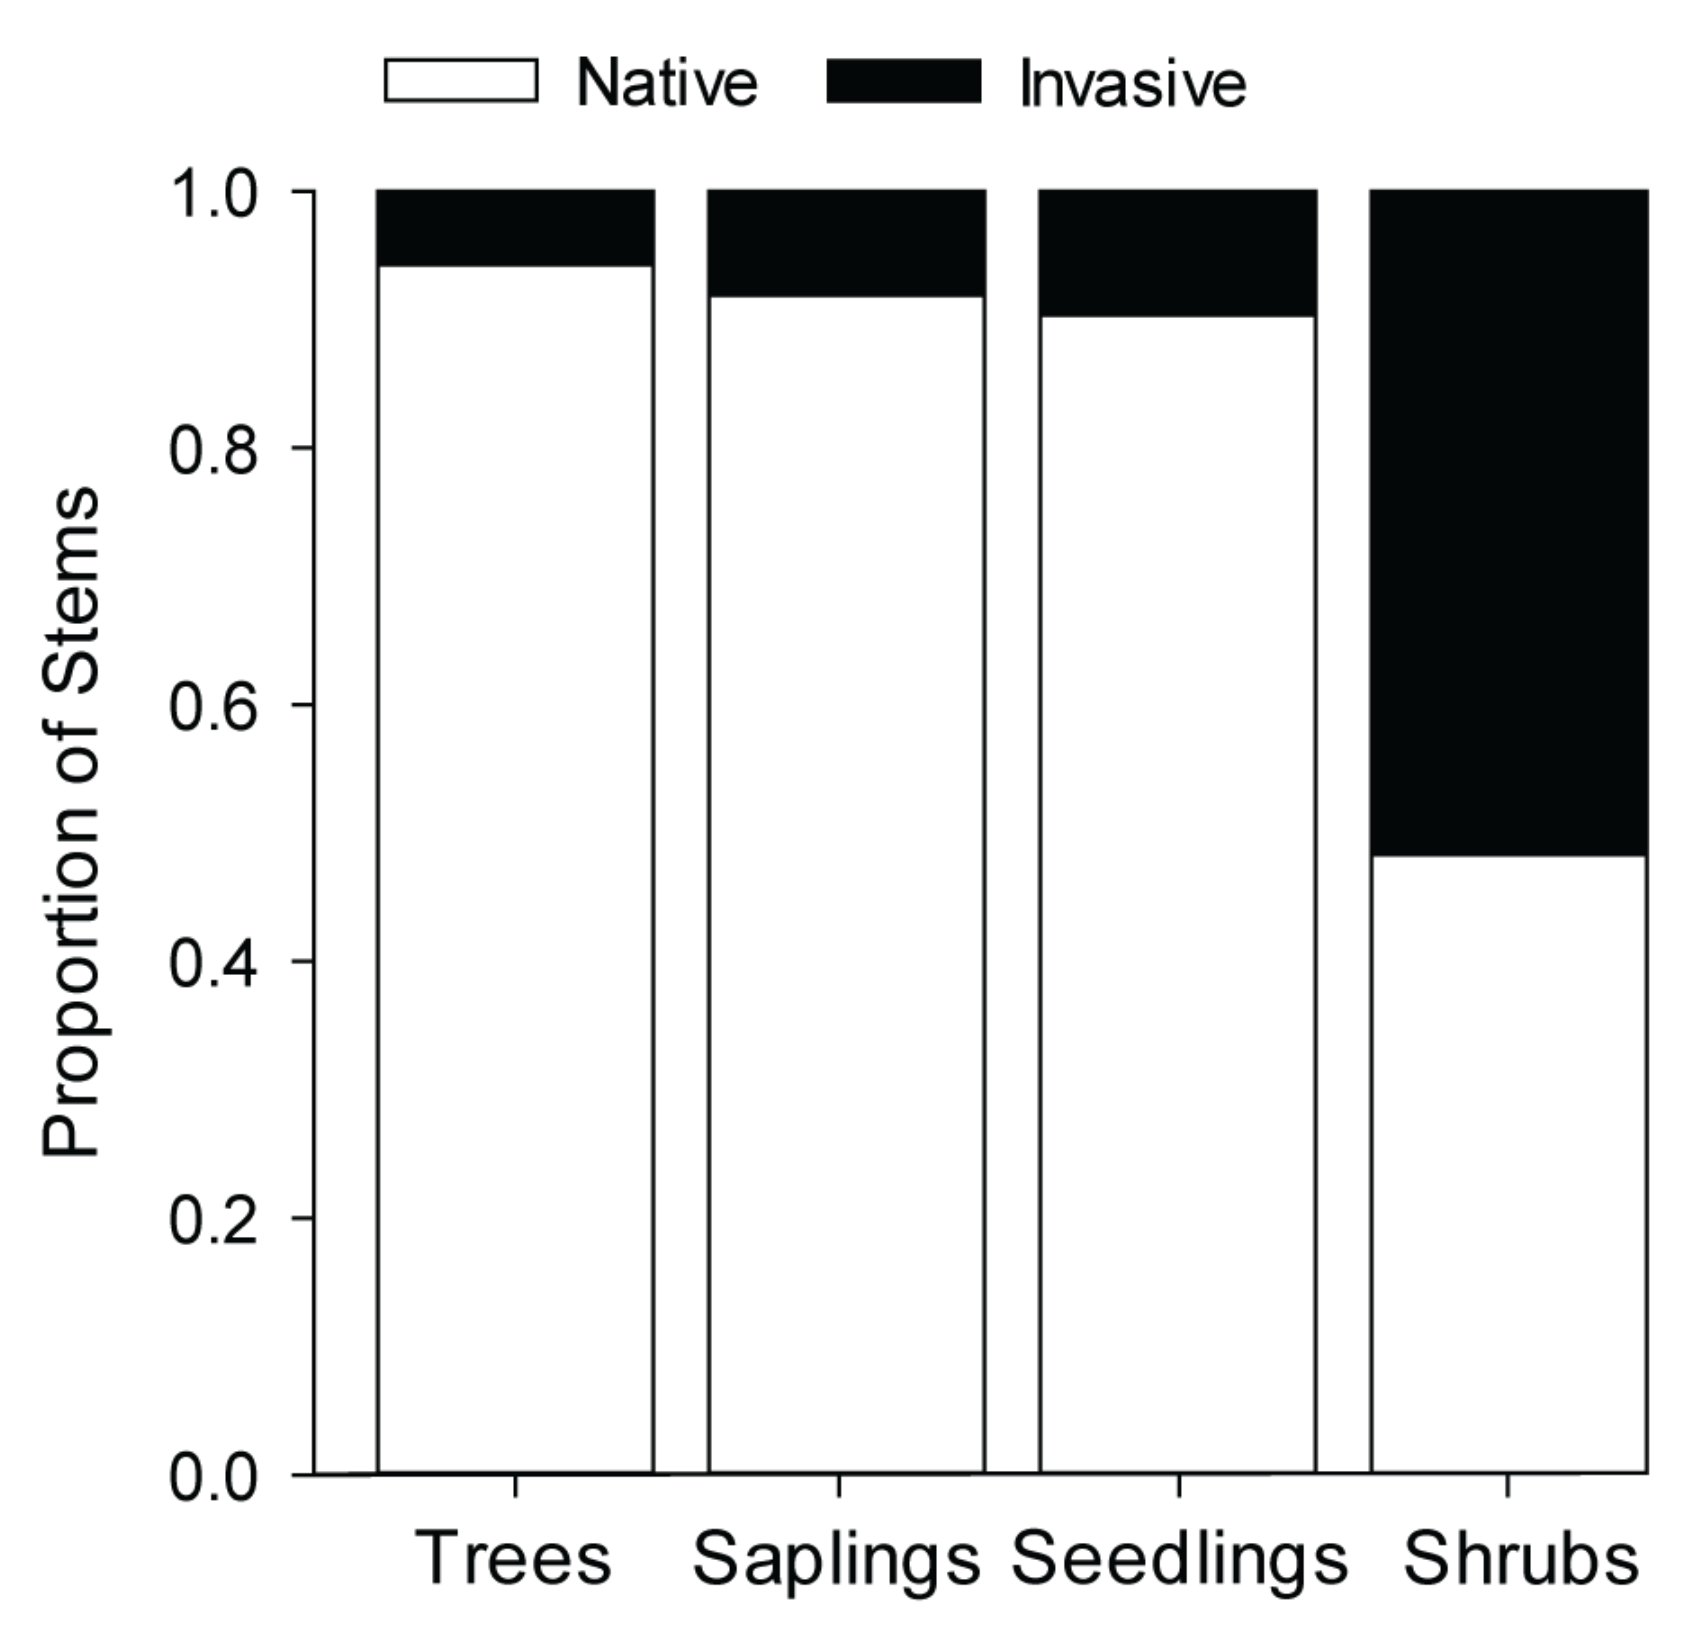
3.2. Plant Community Composition
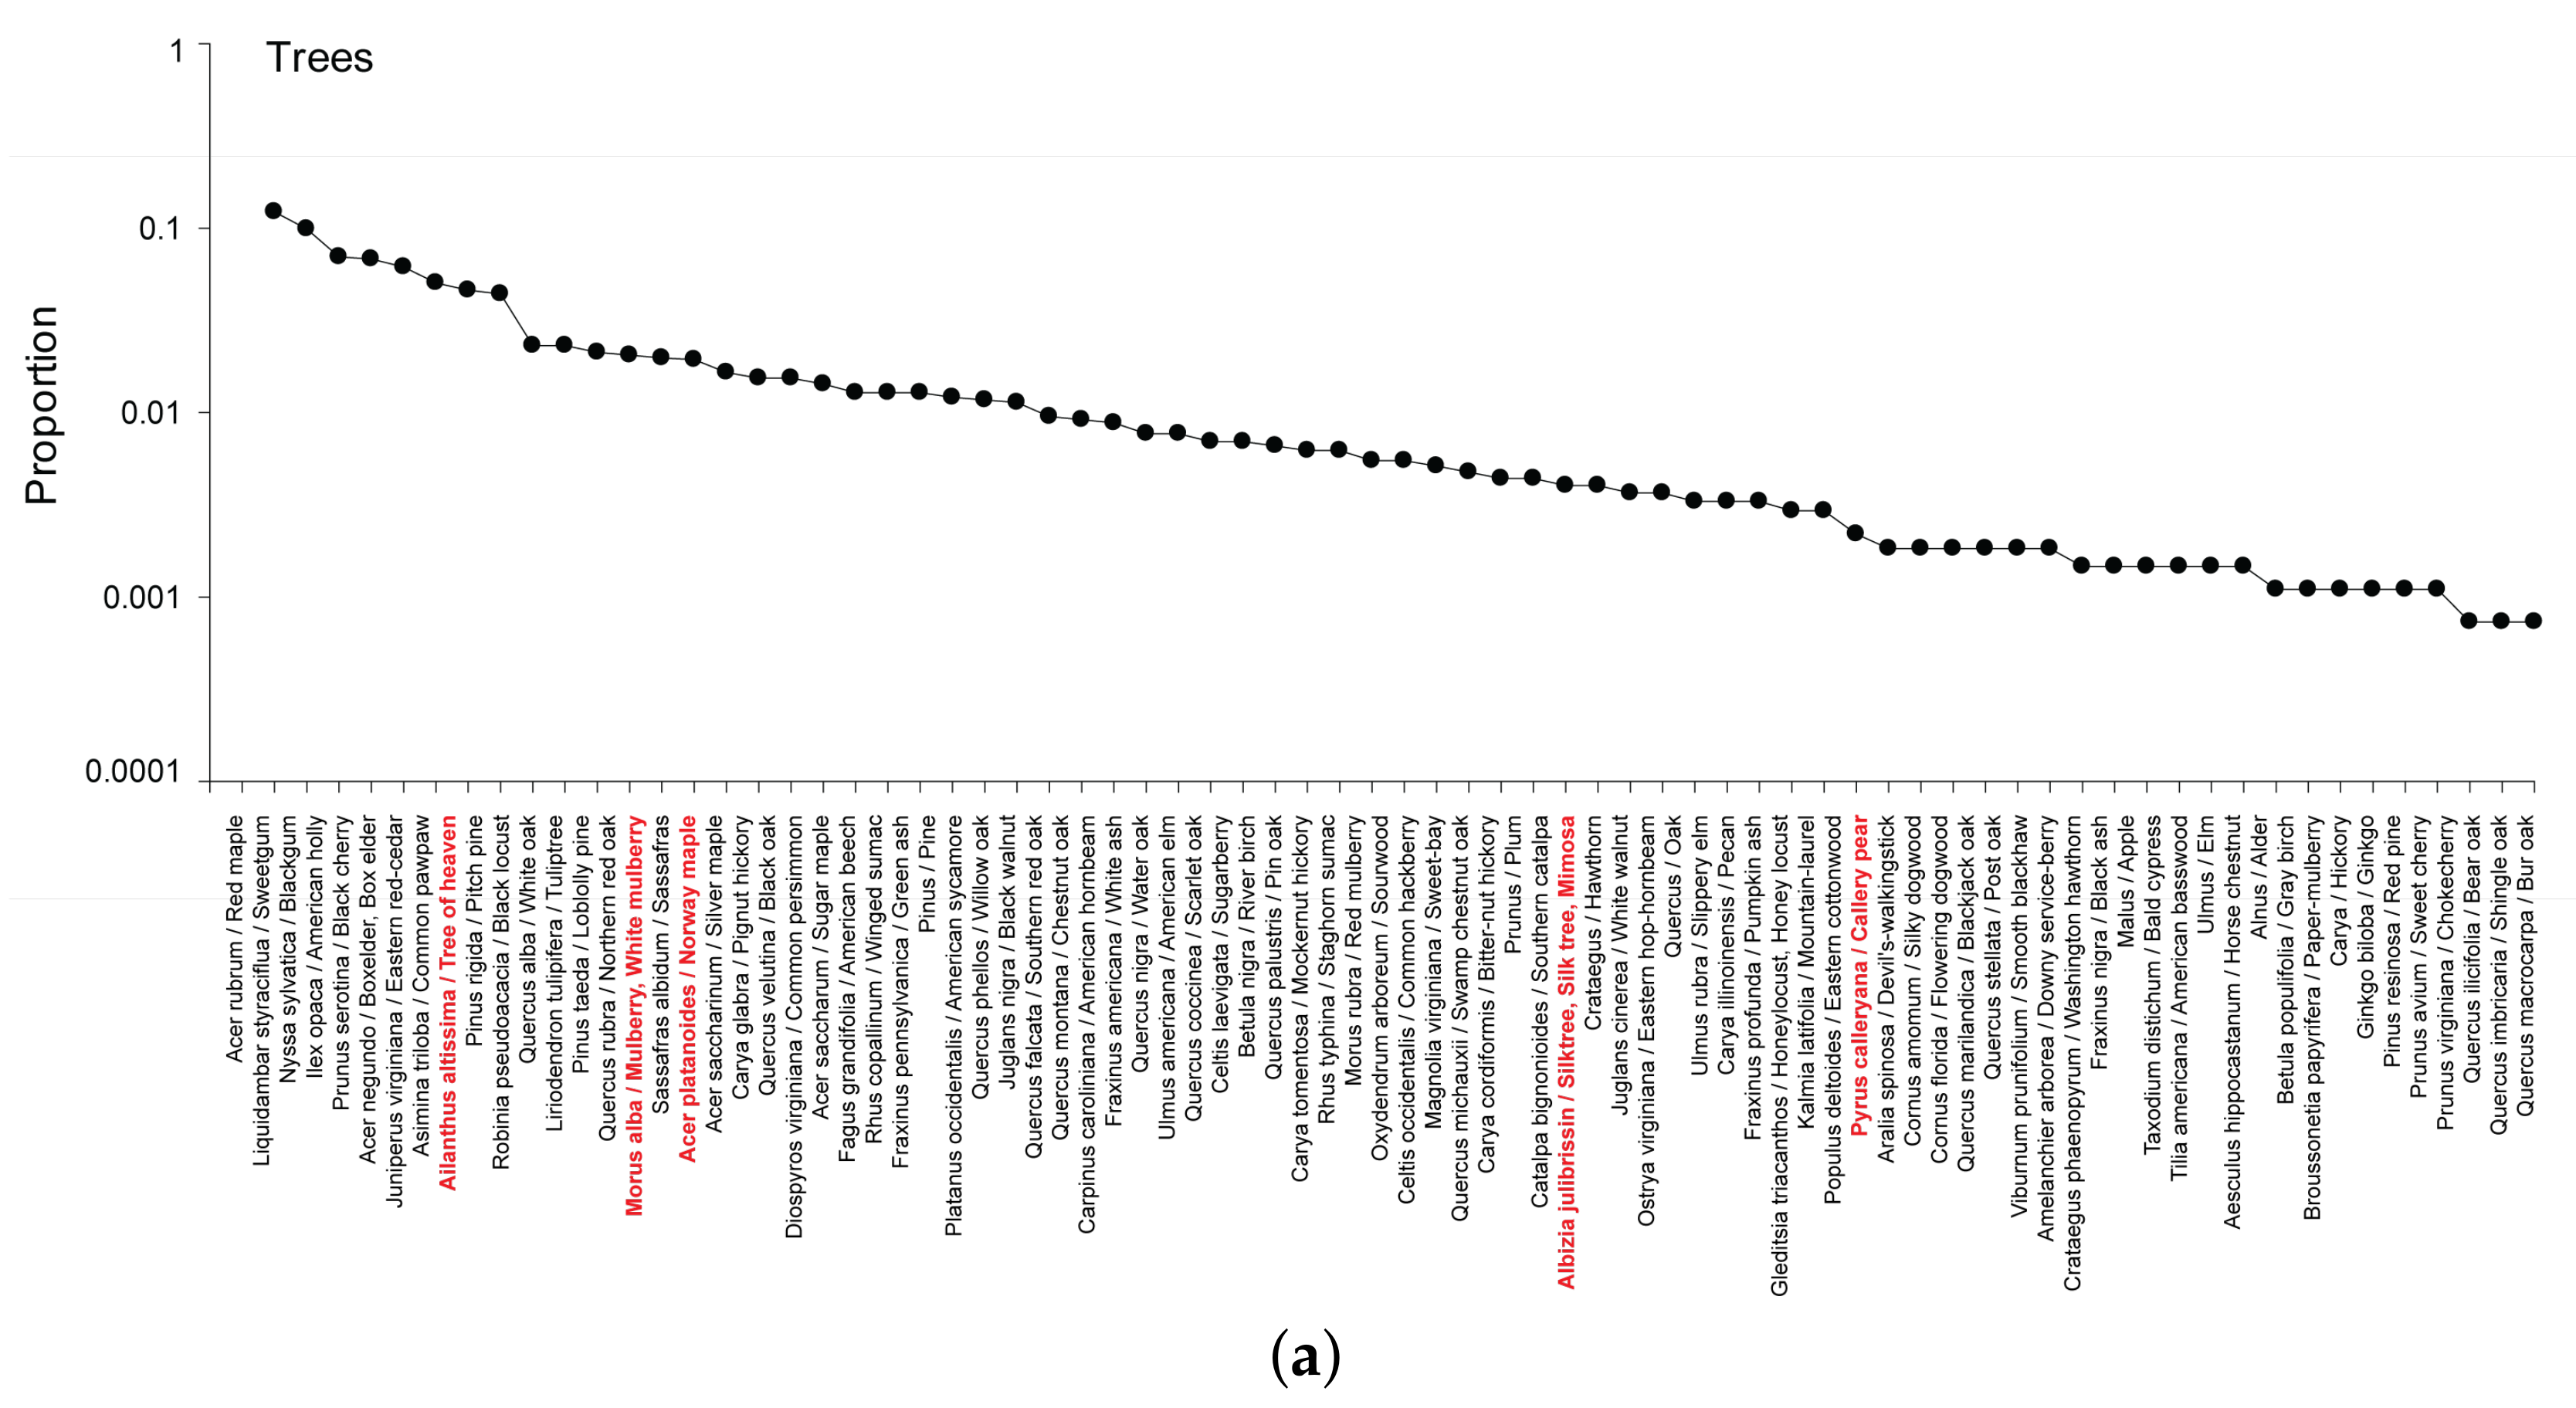
3.2.1. Trees
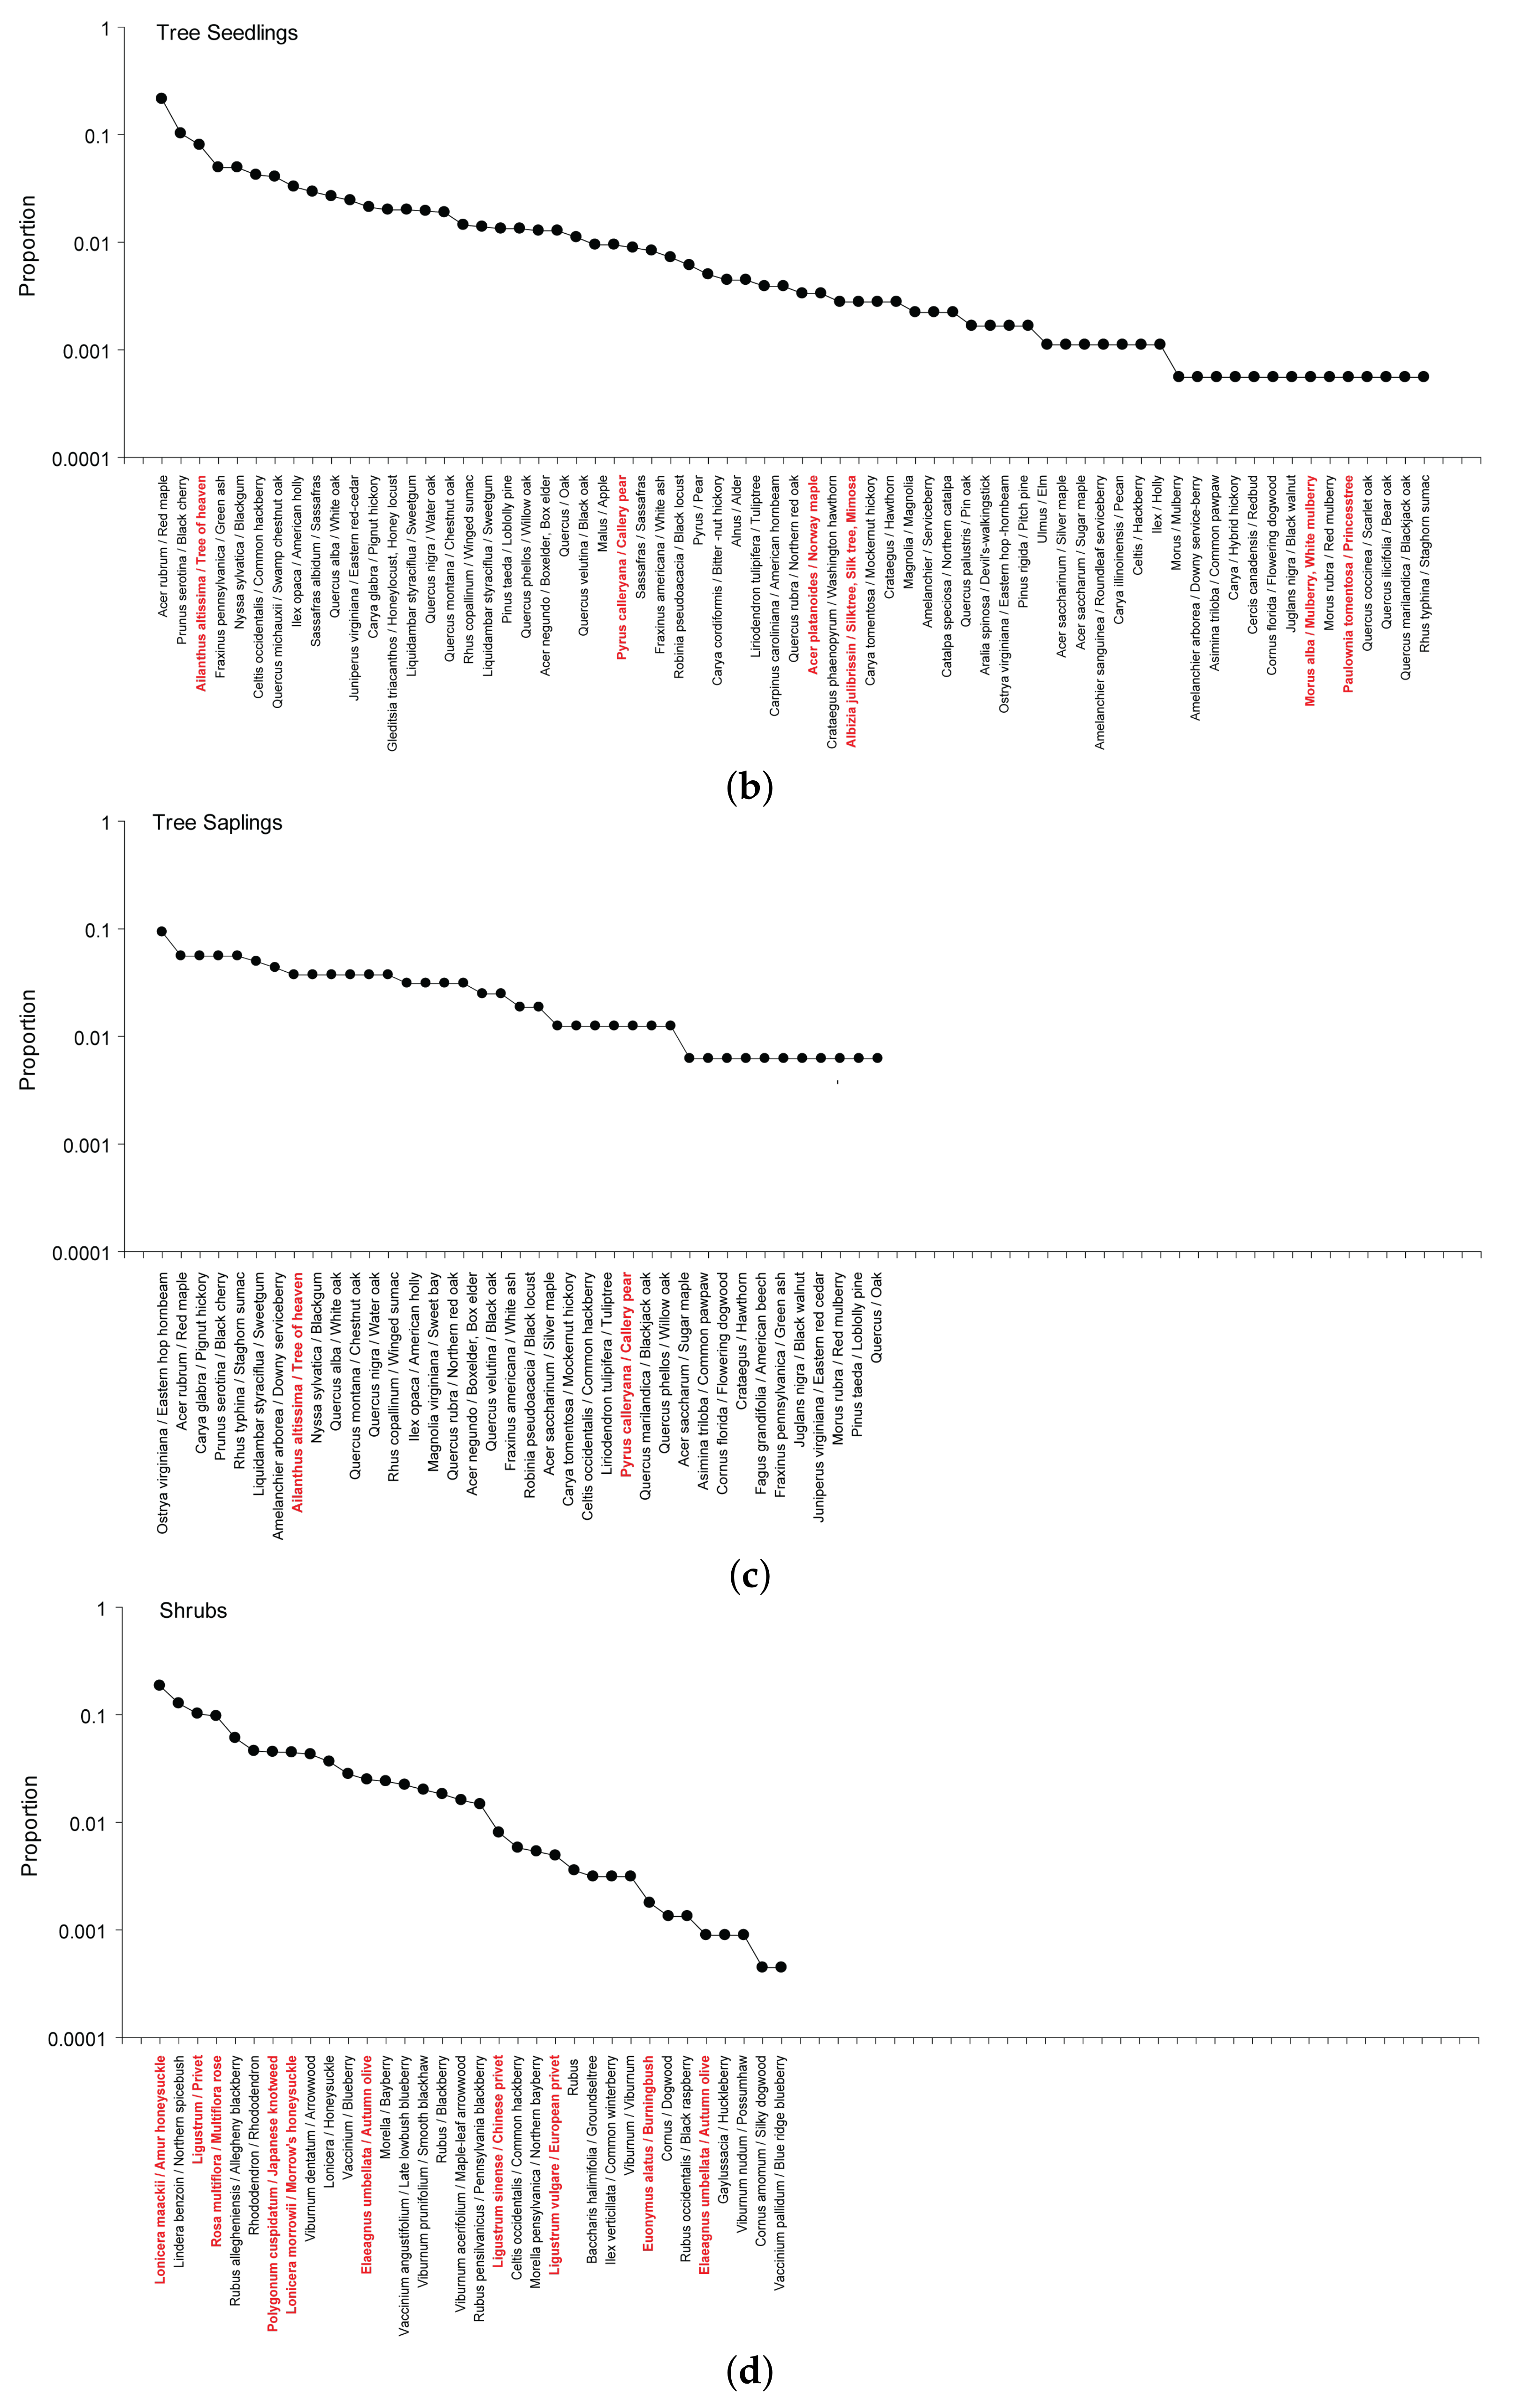
3.2.2. Tree Seedlings and Saplings
3.2.3. Shrubs
3.2.4. Vines
3.2.5. Forbs and Graminoids
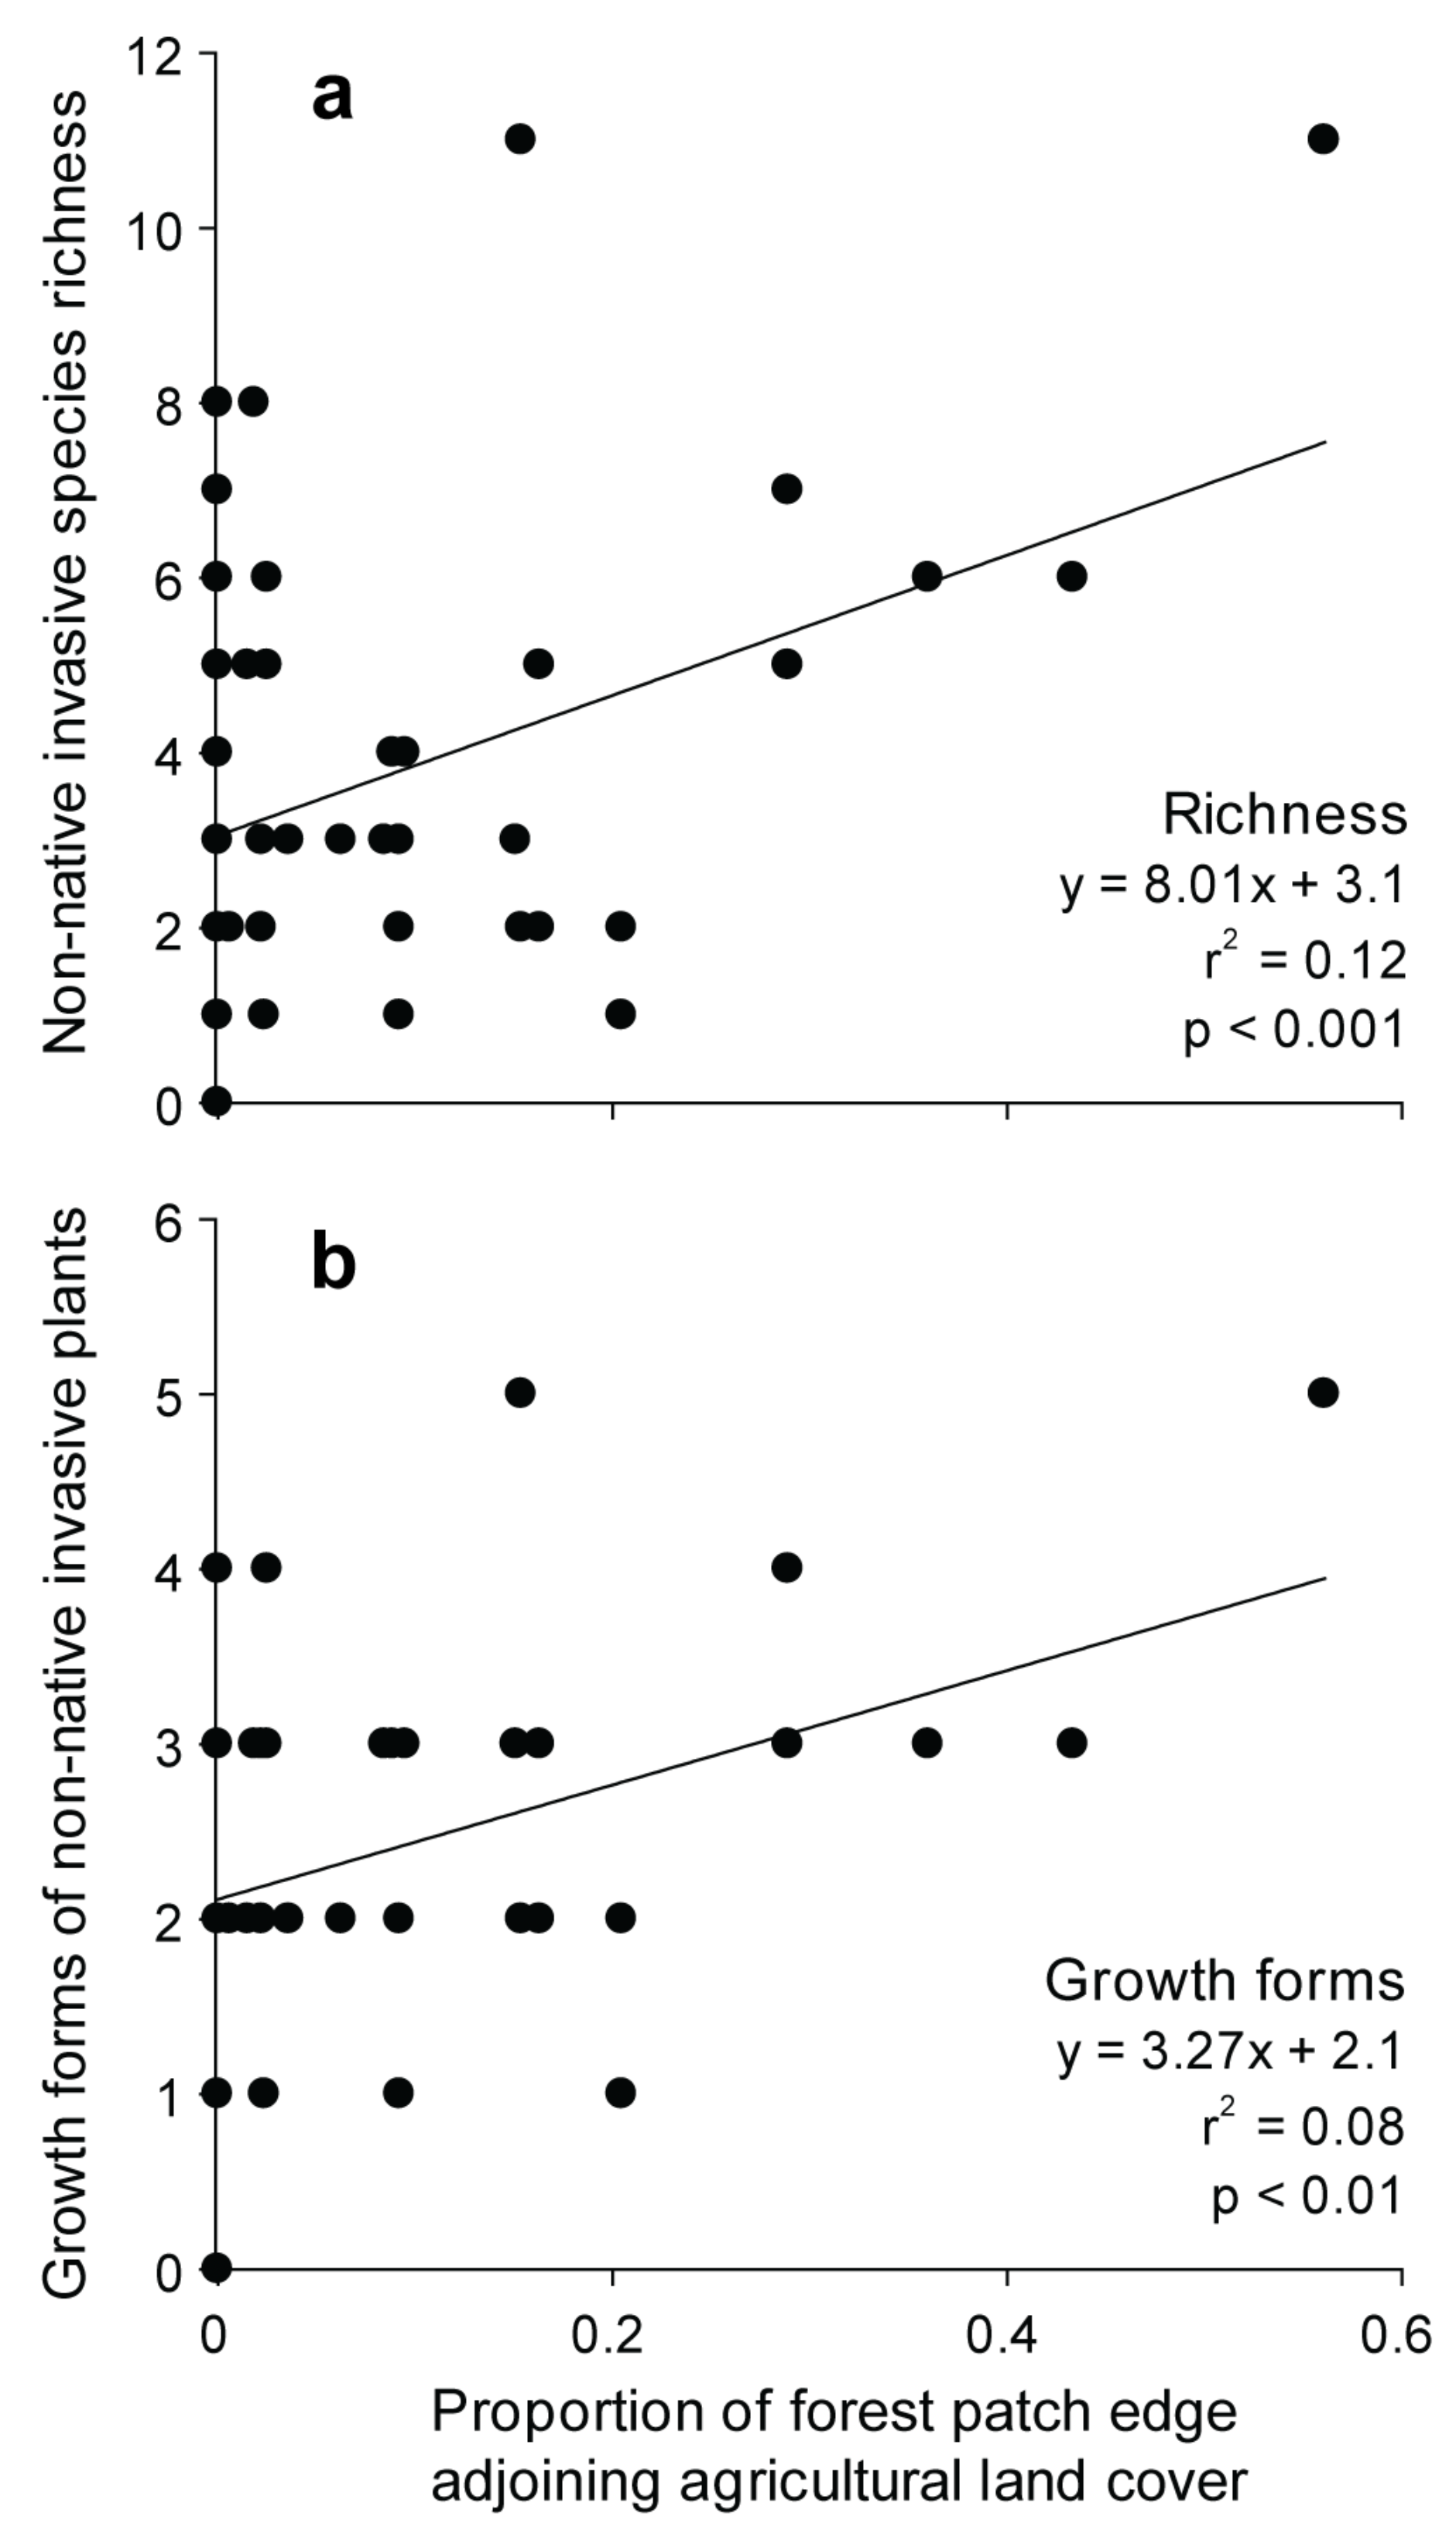
3.3. Effects of Landscape Context and Disturbance
4. Discussion
4.1. Spatial Patterns
4.2. Forest Condition
4.3. Drivers of Forest Conditions
5. Conclusions
Author Contributions
Funding
Acknowledgments
Conflicts of Interest
Appendix A

| Municipality | State | Population | Area (km2) | Population Density (/km2) | Metropolitan Statistical Area (MSA) | MSA Population |
|---|---|---|---|---|---|---|
| Philadelphia | PA | 1,526,006 | 370 | 4129 | Philadelphia-Camden-Wilmington, PA-NJ-DE-MD | 6,011,545 |
| Washington | DC | 601,723 | 177 | 3400 | Washington-Arlington-Alexandria, DC-VA-MD-WV | 5,695,369 |
| Norfolk | VA | 242,803 | 250 | 972 | VA Beach-Norfolk-Newport News, VA-NC | 1,685,610 |
| Newport News | VA | 180,719 | 310 | 583 | VA Beach-Norfolk-Newport News, VA-NC | 1,685,610 |
| Toms River | NJ | 88,791 | 106 | 840 | New York-Northern NJ-Long Island, NY-NJ-PA | 19,039,570 |
| Suffolk | VA | 84,585 | 1111 | 76 | VA Beach-Norfolk-Newport News, VA-NC | 1,685,610 |
| Wilmington | DE | 70,851 | 44 | 1615 | Philadelphia-Camden-Wilmington, PA-NJ-DE-MD | 6,011,545 |
| New Brunswick | NJ | 55,181 | 15 | 3703 | New York-Northern NJ-Long Island, NY-NJ-PA | 19,039,570 |
| Essex | MD | 39,262 | 31 | 1275 | Baltimore-Towson, MD | 2,738,814 |
| Dover | DE | 36,047 | 61 | 593 | Dover, DE | 166,656 |
| Millville | NJ | 28,400 | 115 | 246 | Vineland-Millville-Bridgeton, NJ | 157,291 |
| Bridgeton | NJ | 25,349 | 17 | 1507 | Vineland-Millville-Bridgeton, NJ | 157,291 |
| Pleasantville | NJ | 20,249 | 19 | 1073 | Atlantic City-Hammonton, NJ | 273,331 |
| Joppatowne | MD | 12,616 | 19 | 659 | Baltimore-Towson, MD | 2,738,814 |
| Neabsco | VA | 12,068 | 13 | 960 | Washington-Arlington-Alexandria, DC-VA-MD-WV | 5,695,369 |
| Ocean City | NJ | 11,701 | 30 | 391 | Ocean City, NJ | 97,616 |
| Smyrna | DE | 10,023 | 16 | 644 | Dover, DE | 166,656 |
| Edgemere | MD | 8669 | 53 | 163 | Baltimore-Towson, MD | 2,738,814 |
| New Castle | DE | 5285 | 9 | 579 | Philadelphia-Camden-Wilmington, PA-NJ-DE-MD | 6,011,545 |
| Croom | MD | 2631 | 92 | 29 | Washington-Arlington-Alexandria, DC-VA-MD-WV | 5,695,369 |
| Scientific Name | Common Name | Growth Form |
|---|---|---|
| Achillea millefolium | Yarrow | Forb |
| Ageratina altissima | White snakeroot | Forb |
| Alliaria petiolata | Garlic mustard | Forb |
| Allium vineale | Vineyard onion | Forb |
| Ambrosia artemisiifolia | Annual ragweed | Forb |
| Anagallis arvensis | Scarlet pimpernel | Forb |
| Apocynum | Dogbane | Forb |
| Apocynum cannabinum | Indian hemp | Forb |
| Arisaema triphyllum | Jack-in-the-pulpit | Forb |
| Artemisia vulgaris | Common wormwood | Forb |
| Asarum canadense | Canadian wild ginger | Forb |
| Bidens | Beggarticks | Forb |
| Boehmeria | False nettle | Forb |
| Botrychium virginianum | Rattlesnake fern | Forb |
| Chaerophyllum tainturieri | Hairy-fruit chervil | Forb |
| Circaea lutetiana | Enchanter’s nightshade | Forb |
| Commelina communis | Asiatic dayflower | Forb |
| Convallaria majalis | European lily of the valley | Forb |
| Conyza canadensis | Canadian horseweed | Forb |
| Diodia teres | Rough buttonweed | Forb |
| Duchesnea indica | Mock strawberry | Forb |
| Eclipta prostrata | False daisy | Forb |
| Erechtites hieraciifolius | American burnweed | Forb |
| Erigeron annuus | Annual fleabane | Forb |
| Eurybia | Aster | Forb |
| Euthamia graminifolia | Flat-top goldentop | Forb |
| Fabaceae sp | Legume | Forb |
| Froelichia gracillis | Slender snakecotton | Forb |
| Geum canadense | White avens | Forb |
| Glechoma hederacea | Ground ivy | Forb |
| Helenium autumnale | Common sneezeweed | Forb |
| Heterotheca subaxillaris | Camphorweed | Forb |
| Impatiens capensis | Spotted jewelweed | Forb |
| Lespedeza cuneata | Chinese bush-clover | Forb |
| Lobelia cardinalis | Cardinal flower | Forb |
| Lycopodium | Clubmoss | Forb |
| Lysimachia nummularia | Moneywort | Forb |
| Maianthemum canadense | Mayflower | Forb |
| Matteuccia struthiopteris | Ostrich fern | Forb |
| Oenothera biennis | Small flowered evening primrose | Forb |
| Onoclea sensibilis | Sensitive fern | Forb |
| Osmorhiza longistylis | Aniseroot | Forb |
| Osmunda cinnamomea | Cinnamon fern | Forb |
| Oxalis corniculata | Creeping wood sorrel | Forb |
| Oxalis stricta | Upright yellow wood sorrel | Forb |
| Phytolacca americana | Pokeweed | Forb |
| Pilea pumila | Canadian clearweed | Forb |
| Plantago | Plantain | Forb |
| Plantago lanceolata | English plantain | Forb |
| Plantago rugelii | Black-seed plantain | Forb |
| Podophyllum peltatum | May-apple | Forb |
| Polygonatum | Solomon’s seal | Forb |
| Polygonatum biflorum | King Solomon’s seal | Forb |
| Polygonum cuspidatum | Japanese knotweed | Forb |
| Polygonum persicaria | Spotted ladysthumb | Forb |
| Polygonum virginianum | Jumpseed | Forb |
| Polystichum acrostichoides | Christmas fern | Forb |
| Potentilla canadensis | Dwarf cinquefoil | Forb |
| Rudbeckia laciniata | Green-head coneflower | Forb |
| Saururus cernuus | Lizard’s tail | Forb |
| Smallanthus uvedalius | Hairy leafcup | Forb |
| Solanum carolinense | Carolina horse nettle | Forb |
| Solidago | Goldenrod | Forb |
| Symphyotrichum racemosum | Fragile-stem American-aster | Forb |
| Symplocarpus foetidus | Skunk cabbage | Forb |
| Taraxacum officinale | Common dandelion | Forb |
| Thelypteris noveboracensis | New York fern | Forb |
| Veronica arvensis | Speedwell | Forb |
| Viola sororia | Common blue violet | Forb |
| Yucca | Yucca | Forb |
| Ammophila breviligulata | American beach grass | Graminoid |
| Carex | Sedge | Graminoid |
| Cyperus esculentus | Nut grass | Graminoid |
| Dichanthelium clandestinum | Deer-tongue rosette grass | Graminoid |
| Digitaria | Crabgrass | Graminoid |
| Lolium perenne | Perennial rye grass | Graminoid |
| Microstegium vimineum | Japanese stilt grass | Graminoid |
| Phragmites australis | Common reed | Graminoid |
| Poa pratensis | Kentucky bluegrass | Graminoid |
| Poaceae | Grass | Graminoid |
| Ampelopsis brevipedunculata | Amur peppervine | Vine |
| Amphicarpaea bracteata | American hog-peanut | Vine |
| Calystegia sepium | Western hedge bindweed | Vine |
| Campsis radicans | Trumpet creeper | Vine |
| Celastrus orbiculatus | Asian bittersweet | Vine |
| Clematis terniflora | Sweet autumn virginsbower | Vine |
| Convolvulus | Bindweed | Vine |
| Echinocystis lobata | Wild cucumber | Vine |
| Euonymus fortunei | Winter creeper | Vine |
| Hedera helix | English ivy | Vine |
| Ipomoea purpurea | Common morning glory | Vine |
| Lonicera japonica | Japanese honeysuckle | Vine |
| Mitchella repens | Partridge-berry | Vine |
| Parthenocissus quinquefolia | Virginia creeper | Vine |
| Persicaria perfoliata | Mile-a-minute | Vine |
| Polygonum perfoliatum | Asiatic tearthumb | Vine |
| Pueraria | Kudzu | Vine |
| Sicyos angulatus | One-seed burr-cucumber | Vine |
| Smilax | Greenbrier | Vine |
| Smilax bona-nox | Fringed greenbrier | Vine |
| Smilax glauca | Sawbrier | Vine |
| Smilax rotundifolia | Horsebrier | Vine |
| Toxicodendron radicans | Eastern poison ivy | Vine |
| Vinca major | Greater periwinkle | Vine |
| Vinca minor | Common periwinkle | Vine |
| Vitis | Grape | Vine |
| Vitis aestivalis | Summer grape | Vine |
| Vitis riparia | River-bank grape | Vine |
| Vitis rotundifolia | Muscadine | Vine |
| Wisteria floribunda | Japanese wisteria | Vine |


References
- Hopper, T.; Meixler, M.S. Modeling Coastal Vulnerability through Space and Time. PLoS ONE 2016, 11, e0163495. [Google Scholar] [CrossRef]
- Menéndez, M.; Woodworth, P.L. Changes in extreme high water levels based on a quasi-global tide-gauge data set. J. Geophys. Res. Oceans 2010, 115. [Google Scholar] [CrossRef]
- Needham, H.F.; Keim, B.D.; Sathiaraj, D. A review of tropical cyclone-generated storm surges: Global data sources, observations, and impacts. Rev. Geophys. 2015, 53, 545–591. [Google Scholar] [CrossRef]
- Reed, A.J.; Mann, M.E.; Emanuel, K.A.; Lin, N.; Horton, B.P.; Kemp, A.C.; Donnelly, J.P. Increased threat of tropical cyclones and coastal flooding to New York City during the anthropogenic era. Proc. Natl. Acad. Sci. 2015, 112, 12610–12615. [Google Scholar] [CrossRef] [PubMed]
- Grimmond, C. Urban climate in the coastal zone: Resilience to weather extremes. In Megacities and the Coast: Transformation for Resilience. A Preliminary Review of Knowledge, Practice and Future Research; Pelling, M., Ed.; LOICZ: Chennai, India, 2011. [Google Scholar]
- Hugo, G. Future demographic change and its interactions with migration and climate change. Glob. Environ. Chang. 2011, 21, S21–S33. [Google Scholar] [CrossRef]
- Kowarik, I. On the Role of Alien Species in Urban Flora and Vegetation. In Urban Ecology; Marzluff, J.M., Shulenberger, E., Endlicher, W., Alberti, M., Bradley, G., Ryan, C., Simon, U., ZumBrunnen, C., Eds.; Springer: New York, NY, USA, 2008; pp. 321–338. ISBN 978-0-387-73411-8. [Google Scholar]
- Zipperer, W.C.; Guntenspergen, G.R. Vegetation composition and structure of forest patches along urban-rural gradients. In Ecology of Cities and Towns: A Comparative Approach; McDonnell, M.J., Hahs, A.K., Breuste, J.H., Eds.; Cambridge University Press: New York, NY, USA, 2009. [Google Scholar]
- McDonnell, M.J.; Pickett, S.T.A.; Groffman, P.; Bohlen, P.; Pouyat, R.V.; Zipperer, W.C.; Parmelee, R.W.; Carreiro, M.M.; Medley, K. Ecosystem processes along an urban-to-rural gradient. Urban Ecosyst. 1997, 1, 21–36. [Google Scholar] [CrossRef]
- Matlack, G.R. Sociological edge effects: Spatial distribution of human impact in suburban forest fragments. Environ. Manag. 1993, 17, 829–835. [Google Scholar] [CrossRef]
- Lehvävirta, S.; Vilisics, F.; Hamberg, L.; Malmivaara-Lämsä, M.; Kotze, D.J. Fragmentation and recreational use affect tree regeneration in urban forests. Urban For. Urban Green. 2014, 13, 869–877. [Google Scholar] [CrossRef]
- Nassauer, J.I. Messy ecosystems, orderly frames. Landsc. J. 1995, 14, 161–170. [Google Scholar] [CrossRef]
- Nassauer, J.I.; Wang, Z.; Dayrell, E. What will the neighbors think? Cultural norms and ecological design. Landsc. Urban Plan. 2009, 92, 282–292. [Google Scholar] [CrossRef]
- Grimm, N.B.; Sheibley, R.W.; Crenshaw, C.L.; Dahm, C.N.; Roach, W.J.; Zeglin, L.H. N retention and transformation in urban streams. J. North Am. Benthol. Soc. 2005, 24, 626–642. [Google Scholar] [CrossRef]
- Groffman, P.M.; Boulware, N.J.; Zipperer, W.C.; Pouyat, R.V.; Band, L.E.; Colosimo, M.F. Soil Nitrogen Cycle Processes in Urban Riparian Zones. Environ. Sci. Technol. 2002, 36, 4547–4552. [Google Scholar] [CrossRef] [PubMed]
- Hughes, R.M.; Dunham, S.; Maas-Hebner, K.G.; Yeakley, J.A.; Schreck, C.; Harte, M.; Molina, N.; Shock, C.C.; Kaczynski, V.W.; Schaeffer, J. A Review of Urban Water Body Challenges and Approaches: (1) Rehabilitation and Remediation. Fisheries 2014, 39, 18–29. [Google Scholar] [CrossRef]
- Desantis, L.R.G.; Bhotika, S.; Williams, K.; Putz, F.E. Sea-level rise and drought interactions accelerate forest decline on the Gulf Coast of Florida, USA. Glob. Chang. Biol. 2007, 13, 2349–2360. [Google Scholar] [CrossRef]
- Williams, K.; Ewel, K.C.; Stumpf, R.P.; Putz, F.E.; Workman, T.W. Sea-Level Rise and Coastal Forest Retreat on the West Coast of Florida, Usa. Ecology 1999, 80, 2045–2063. [Google Scholar] [CrossRef]
- Solomon, S.; Matthews, D.; Raphael, M.; Steffen, K. Climate Stabilization Targets: Emissions, Concentrations, and Impacts over Decades to Millennia; National Academies Press: Washington, DC, USA, 2011. [Google Scholar]
- Nicholls, R.J. Impacts of and Responses to Sea-Level Rise. In Understanding Sea-Level Rise and Variability; John Wiley & Sons, Ltd.: Hoboken, NJ, USA, 2010; pp. 17–51. ISBN 978-1-4443-2327-6. [Google Scholar]
- Rosenzweig, C.; Solecki, W.; Hammer, S.A.; Mehrotra, S. Cities lead the way in climate-change action. Nature 2010, 467, 909–911. [Google Scholar] [CrossRef]
- Aronson, M.F.J.; Nilon, C.H.; Lepczyk, C.A.; Parker, T.S.; Warren, P.S.; Cilliers, S.S.; Goddard, M.A.; Hahs, A.K.; Herzog, C.; Katti, M.; et al. Hierarchical filters determine community assembly of urban species pools. Ecology 2016, 97, 2952–2963. [Google Scholar] [CrossRef]
- Niemiera, A.X.; Holle, B.V. Invasive Plant Species and the Ornamental Horticulture Industry. In Management of Invasive Weeds; Inderjit, Ed.; Springer: Dordrecht, The Netherlands, 2009; pp. 167–187. ISBN 978-1-4020-9202-2. [Google Scholar]
- Reichard, S.H.; White, P. Horticulture as a Pathway of Invasive Plant Introductions in the United States Most invasive plants have been introduced for horticultural use by nurseries, botanical gardens, and individuals. BioScience 2001, 51, 103–113. [Google Scholar] [CrossRef]
- Horvitz, C.C.; Pascarella, J.B.; McMann, S.; Freedman, A.; Hofstetter, R.H. Functional Roles of Invasive Non-Indigenous Plants in Hurricane-Affected Subtropical Hardwood Forests. Ecol. Appl. 1998, 8, 947–974. [Google Scholar] [CrossRef]
- Kuebbing, S.E.; Souza, L.; Sanders, N.J. Effects of co-occurring non-native invasive plant species on old-field succession. For. Ecol. Manag. 2014, 324, 196–204. [Google Scholar] [CrossRef]
- Ehrenfeld, J.G. Effects of Exotic Plant Invasions on Soil Nutrient Cycling Processes. Ecosystems 2003, 6, 503–523. [Google Scholar] [CrossRef]
- Dassonville, N.; Vanderhoeven, S.; Gruber, W.; Meerts, P. Invasion by Fallopia japonica increases topsoil mineral nutrient concentrations. Écoscience 2007, 14, 230–240. [Google Scholar] [CrossRef]
- Heneghan, L.; Steffen, J.; Fagen, K. Interactions of an introduced shrub and introduced earthworms in an Illinois urban woodland: Impact on leaf litter decomposition. Pedobiologia 2007, 50, 543–551. [Google Scholar] [CrossRef]
- von der Lippe, M.; Kowarik, I. Do cities export biodiversity? Traffic as dispersal vector across urban–rural gradients. Divers. Distrib. 2008, 14, 18–25. [Google Scholar] [CrossRef]
- Smith, I.A.; Hutyra, L.R.; Reinmann, A.B.; Marrs, J.K.; Thompson, J.R. Piecing together the fragments: Elucidating edge effects on forest carbon dynamics. Front. Ecol. Environ. 2018, 16, 213–221. [Google Scholar] [CrossRef]
- Trammell, T.L.E.; Carreiro, M.M. Vegetation composition and structure of woody plant communities along urban interstate corridors in Louisville, KY, U.S.A. Urban Ecosyst. 2011, 14, 501–524. [Google Scholar] [CrossRef]
- Matthews, E.R.; Schmit, J.P.; Campbell, J.P. Climbing vines and forest edges affect tree growth and mortality in temperate forests of the U.S. Mid-Atlantic States. For. Ecol. Manag. 2016, 374, 166–173. [Google Scholar] [CrossRef]
- Aronson, M.F.J.; Handel, S.N. Deer and Invasive Plant Species Suppress Forest Herbaceous Communities and Canopy Tree Regeneration. Nat. Areas J. 2011, 31, 400–407. [Google Scholar] [CrossRef]
- Mackun, P.; Wilson, S.; Fischetti, T.; Goworowska, J. Population Distribution and Change: 2000 to 2010; 2010 Census Briefs; Census Bureau, U.S, Department of Commerce, Economics and Statistics Administration: Suitland, MD, USA, 2011; p. 12. Available online: http://www.census.gov/prod/cen2010/briefs/c2010br-01.pdf (accessed on 7 February 2020).
- Nowak, D.; Walton, J. Projected Urban Growth (2000-2050) and Its Estimated Impact on the US Forest Resource. J. For. 2005, 103, 383–772. [Google Scholar]
- Jantz, P.; Goetz, S.; Jantz, C. Urbanization and the Loss of Resource Lands in the Chesapeake Bay Watershed. Environ. Manag. 2005, 36, 808–825. [Google Scholar] [CrossRef]
- Titus, J.G.; Hudgens, D.E.; Hershner, C.; Kassakian, J.M.; Penumalli, P.R.; Berman, M.; Nuckols, W.H. Virginia; The Likelihood of Shore Protection along the Atlantic Coast of the United States; Mid-Atlantic: Washington, DC, USA, 2010. [Google Scholar]
- U.S. Global Change Research Program. Global Climate Change Impacts in the United States; Cambridge University Press: Cambridge, UK, 2009; ISBN 978-0-521-14407-0. [Google Scholar]
- ESRI. ArcGIS Desktop; Environmental Systems Research Institute: Redlands, CA, USA, 2017. [Google Scholar]
- NRCS. Watershed Boundary Dataset; United States Department of Agriculture-Natural Resources Conservation Service (USDA-NRCS), the United States Geological Survey (USGS), and United States Environmental Protection Agency (EPA): Washington, DC, USA, 2019.
- USGS. NLCD 2011 Land Cover (2011 Edition, amended 2014)—National Geospatial Data Asset (NGDA) Land Use Land Cover; U.S. Geological Survey: Sioux Falls, SD, USA, 2014.
- Avins, M. Baltimore’s Forest Patches: Emerald Assets for Ecosystem Services; Baltimore Greenspace: Baltimore, MD, USA, 2013; p. 34. [Google Scholar]
- Jelesnianski, C.P.; Chen, J.; Shaffer, W.A. SLOSH: Sea, Lake, and Overland Surges from Hurricanes; National Oceanic and Atmospheric Administration, U.S. Department of Commerce: Washington, DC, USA, 1992; p. 71.
- NOAA Sea, Lake, and Overland Surges from Hurricanes (SLOSH). Available online: https://www.nhc.noaa.gov/surge/slosh.php (accessed on 15 October 2016).
- Barth, J.; Drzyzga, S.A. Modeling the extent of future storm surge inundation under two sea level rise scenarios. Poster Presented at the US International Association for Landscape Ecology 2017 Annual Meeting, Baltimore, MD, USA, 9–13 April 2017. [Google Scholar]
- NOAA National Oceanic and Atmospheric Administration Coastal Services Center Coastal Inundation Digital Elevation Model. Available online: https://coast.noaa.gov/slrdata/ (accessed on 15 October 2016).
- USGS National Elevation Dataset (NED). Available online: https://www.usgs.gov/core-science-systems/ngp/3dep/about-3dep-products-services (accessed on 15 October 2016).
- USGS National Hydrography Dataset. Available online: https://www.usgs.gov/core-science-systems/ngp/national-hydrography/national-hydrography-dataset (accessed on 15 October 2016).
- Lautar, K.; Yesilonis, I.; Schumaker, N.; Baker, M. Schumaker Vine Invasion Index. In Baltimore Greenspace Forest Surveying Project Revised Field Protocol; Baltimore Greenspace, Ed.; Baltimore Greenspace: Baltimore, MD, USA, 2017. [Google Scholar]
- USDA, N. The PLANTS Database; National Plant Data Team: Greensboro, NC, USA, 2019. [Google Scholar]
- PA-DCNR Invasive Plant Fact Sheets. Available online: https://www.dcnr.pa.gov:443/Conservation/WildPlants/InvasivePlants/InvasivePlantFactSheets/Pages/default.aspx (accessed on 22 October 2019).
- MISC Maryland Invasive Species Council Species of Concern. Available online: http://mdinvasives.org/species-of-concern/ (accessed on 22 October 2019).
- McAvoy, W.A. Non-Native Invasive Plants of Delaware; Species Conservation and Research Program, Delaware Division of Fish and Wildlife, Delaware Department of Natural Resources and Environmental Control: Smyrna, Turkey, 2018; p. 7. [Google Scholar]
- Heffernan, K.; Engle, E.; Richardson, C. Virginia Invasive Plants Species List; Natural Heritage Technical Document; Virginia Department of Conservation and Recreation, Division of Natural Heritage: Richmond, BC, Canada, 2014. [Google Scholar]
- State of New Jersey Department of Environmental Protection; NJ Fortest Service. Invasive Species. Available online: https://www.state.nj.us/dep/parksandforests/forest/invasive_species.html (accessed on 22 October 2019).
- Gleason, H.A.; Cronquist, A. Manual of Vascular Plants of Northeastern United States and Adjacent Canada; 2 Sub.; New York Botanical Garden: New York, NY, USA, 1991; ISBN 0-89327-365-1. [Google Scholar]
- Holmgren, N.H.; Holmgren, P.K.; Gleason, H.A. Illustrated companion to Gleason and Cronquist’s manual: Illustrations of the vascular plants of northeastern United States and adjacent Canada; New York Botanical Garden: New York, NY, USA, 1998. [Google Scholar]
- Weakley, A.S.; Ludwig, J.C.; Townsend, J.F. Flora of Virginia, 1st ed.; Botanical Research Inst of Texas: Fort Worth, TX, USA, 2012; ISBN 978-1-889878-38-6. [Google Scholar]
- Rhoads, A.F.; Block, T.A. The Plants of Pennsylvania: An Illustrated Manual, 2nd ed.; University of Pennsylvania Press: Philadelphia, PA, USA, 2007; ISBN 978-0-8122-4003-0. [Google Scholar]
- Mid-Atlantic Wetlands Workgroup. MidTRAM: Mid-Atlantic Tidal Wetland Rapid Assessment Method, Version 3.0; Delaware Department of Natural Resources and Environmental Control, Division of Water Resources; Maryland Department of Natural Resources, Riparian and Wetland Restoration Services; Virginia Institute of Marine Science, Center for Coastal Resources Management; Mid-Atlantic Wetlands Workgroup: Gloucester, VA, USA, 2010; p. 55. [Google Scholar]
- Bourdaghs, M. Development of a Rapid Floristic Quality Assessment 2012. Available online: https://www.pca.state.mn.us/sites/default/files/wq-bwm2-02a.pdf (accessed on 7 February 2020).
- Harrison, J.W. The Natural Communities of Maryland 2016 Natural Community Classification Framework 2016. Available online: https://dnr.maryland.gov/wildlife/Documents/Natural_Communities%20_Maryland_2016_Framework.pdf (accessed on 7 February 2020).
- PA DEP. Pennsylvania Riverine Condition Level 2 Rapid Assessment Protocol, Version 1.0; Pennsylvania Department of Environmental Protection, Bureau of Waterways Engineering and Wetlands, Division of Wetlands, Encroachments and Training: Washington, DC, USA, 2016; p. 33. [Google Scholar]
- Pregitzer, C.C.; Charlop-Powers, S.; Bibbo, S.; Forgione, H.M.; Gunther, B.; Hallett, R.A.; Bradford, M.A. A city-scale assessment reveals that native forest types and overstory species dominate New York City forests. Ecol. Appl. 2019, 29, e01819. [Google Scholar] [CrossRef] [PubMed]
- Natural Resources Group. UFEP Protocol for Plot Establishment; New York City Department of Parks and Recreation: New York, NY, USA, 1992.
- Amrein, D.; Rusterholz, H.-P.; Baur, B.; Fraser, L. Disturbance of suburban Fagus forests by recreational activities: Effects on soil characteristics, above-ground vegetation and seed bank. Appl. Veg. Sci. 2005, 8, 175–182. [Google Scholar]
- Grimm, N.B.; Pickett, S.T.A.; Hale, R.L.; Cadenasso, M.L. Does the ecological concept of disturbance have utility in urban social–ecological–technological systems? Ecosyst. Health Sustain. 2017, 3. [Google Scholar] [CrossRef]
- Johnson, L.R.; Handel, S.N. Restoration treatments in urban park forests drive long-term changes in vegetation trajectories. Ecol. Appl. 2016, 26, 940–956. [Google Scholar] [CrossRef]
- Hobbs, R.J. Disturbance, diversity, and invasion: Implications for conservation. Conserv. Biol. 1992, 6, 324–337. [Google Scholar] [CrossRef]
- The Ecology of Natural Disturbance and Patch Dynamics; Pickett, S.T.A., White, P.S., Eds.; Academic Press: San Diego, CA, USA, 1985; ISBN 978-0-12-554521-1. [Google Scholar]
- Beauchamp, V.B.; Ghuznavi, N.; Koontz, S.M.; Roberts, R.P. Edges, exotics and deer: The seed bank of a suburban secondary successional temperate deciduous forest. Appl. Veg. Sci. 2013, 16, 571–584. [Google Scholar] [CrossRef]
- Russell, M.B.; Woodall, C.W.; Potter, K.M.; Walters, B.F.; Domke, G.M.; Oswalt, C.M. Interactions between white-tailed deer density and the composition of forest understories in the northern United States. For. Ecol. Manag. 2017, 384, 26–33. [Google Scholar] [CrossRef]
- Robertson, D.J. Trees, deer and non-native vines: Two decades of northern piedmont forest restoration. Ecol. Restor. 2012, 30, 59–70. [Google Scholar] [CrossRef]
- Ward, J.S.; Williams, S.C.; Linske, M.A. Independent Effects of Invasive Shrubs and Deer Herbivory on Plant Community Dynamics. Forests 2017, 8, 2. [Google Scholar] [CrossRef]
- Walsh, C.J.; Roy, A.H.; Feminella, J.W.; Cottingham, P.D.; Groffman, P.M.; Morgan, R.P.I. The urban stream syndrome: Current knowledge and the search for a cure. J. North Am. Benthol. Soc. 2005, 24, 706–723. [Google Scholar] [CrossRef]
- Botequilha Leitão, A.; Miller, J.; Ahern, J.; McGarigal, K. Measuring Landscapes: A Professional Planner’s Manual; Island Press: Washington, DC, USA, 2006. [Google Scholar]
- McCabe, T.; McCabe, R. Recounting whitetails past. In The Science of Overabundance: Deer Ecology and Population Managment; McShea, W., Underwood, H., Rappole, J., Eds.; Smithsonian Institution: Washington, DC, USA, 1997; pp. 11–26. [Google Scholar]
- Magnuson, J.J. Long-Term Ecological Research and the Invisible Present. BioScience 1990, 40, 495–501. [Google Scholar] [CrossRef]
- Turner, M.G.; Gardner, R.H. (Eds.) Landscape Ecology in Theory and Practice: Pattern and Process; Springer: New York, NY, USA, 2015; ISBN 978-1-4939-2794-4. [Google Scholar]


| Land Cover Type | Area (ha) | % |
|---|---|---|
| Forest | 3,292,290 | 41.4% |
| Cultivated Crops | 1,338,872 | 16.8% |
| Developed, Open Space | 936,933 | 11.8% |
| Hay/Pasture | 837,969 | 10.5% |
| Developed, Low Intensity | 506,997 | 6.4% |
| Developed, Medium and High Intensity | 361,724 | 4.5% |
| Emergent Herbaceous Wetlands | 301,778 | 3.8% |
| Shrub/Scrub | 284,936 | 3.6% |
| Herbaceous | 59,406 | 0.7% |
| Barren Land | 40,217 | 0.5% |
| Total | 7,961,121 | 100% |
| Disturbance Category | Proportion of Sites |
|---|---|
| Vegetation manipulation | 64 |
| Dumping | 63 |
| Garbage | 62 |
| Deer signs 1 | 46 |
| Trail | 32 |
| Canopy gap due to fallen canopy tree | 29 |
| Other human activity | 18 |
| Gully erosion | 15 |
| Digging / Earth moving | 13 |
| Fencing | 13 |
| Trampling | 11 |
| Road | 9 |
| Recreational equipment | 5 |
| Building | 4 |
| Camping | 3 |
| None | 3 |
| Fire | 2 |
| Shoreline alteration 2 | 2 |
| Livestock grazing | 1 |
© 2020 by the authors. Licensee MDPI, Basel, Switzerland. This article is an open access article distributed under the terms and conditions of the Creative Commons Attribution (CC BY) license (http://creativecommons.org/licenses/by/4.0/).
Share and Cite
Johnson, L.R.; Trammell, T.L.E.; Bishop, T.J.; Barth, J.; Drzyzga, S.; Jantz, C. Squeezed from All Sides: Urbanization, Invasive Species, and Climate Change Threaten Riparian Forest Buffers. Sustainability 2020, 12, 1448. https://doi.org/10.3390/su12041448
Johnson LR, Trammell TLE, Bishop TJ, Barth J, Drzyzga S, Jantz C. Squeezed from All Sides: Urbanization, Invasive Species, and Climate Change Threaten Riparian Forest Buffers. Sustainability. 2020; 12(4):1448. https://doi.org/10.3390/su12041448
Chicago/Turabian StyleJohnson, Lea R., Tara L. E. Trammell, Tracie J. Bishop, Joshua Barth, Scott Drzyzga, and Claire Jantz. 2020. "Squeezed from All Sides: Urbanization, Invasive Species, and Climate Change Threaten Riparian Forest Buffers" Sustainability 12, no. 4: 1448. https://doi.org/10.3390/su12041448
APA StyleJohnson, L. R., Trammell, T. L. E., Bishop, T. J., Barth, J., Drzyzga, S., & Jantz, C. (2020). Squeezed from All Sides: Urbanization, Invasive Species, and Climate Change Threaten Riparian Forest Buffers. Sustainability, 12(4), 1448. https://doi.org/10.3390/su12041448