Article

The Impact of Global Protectionism on Port Logistics Demand

1
Program in FTA Policy and Business Consulting, Graduate School, Inha University, Incheon 22212, Korea
2
Program in International Relations, Department of Political Science, Graduate School, New York University, New York, NY 10016, USA
3
Trade, Investment and Innovation Division, UN ESCAP, Bangkok 10200, Thailand
4
Department of International Trade, Inha University, Incheon 22212, Korea
*
Author to whom correspondence should be addressed.
Sustainability 2020, 12(4), 1444; https://doi.org/10.3390/su12041444
Submission received: 26 December 2019 / Revised: 5 February 2020 / Accepted: 12 February 2020 / Published: 15 February 2020
(This article belongs to the Special Issue Sustainable Maritime Transportation Management and Policies)

Abstract

:
Various risks and uncertainties are strengthening the downside of the global economy. This paper aims to estimate the impact of the US–China conflict and the World Trade Organization (WTO) Appellate Body’s shutdown on global logistics demand and to show the seriousness of the situation. Existing literature studies on protectionism or the US–China trade conflict were considered, with a focus on the effects of specific issues or impact on bilateral relations. No research has quantitatively considered the adverse effects of the Appellate Body’s shutdown. In this situation, questions can be raised whether the current global shipping logistics system can be sustainable or not. This paper attempts to estimate the shrinking demand for shipping logistics due to global protectionism. Using a dynamic general equilibrium model and trade-cargo-container conversion methodology, which differentiates this paper from previous studies, the paper suggests that the combination of tariffs and NTBs can severely reduce international trade and the demand for maritime logistics services. Depending on the scenario, port cargo is expected to decrease by 3.95 to 6.9 trillion tons, which can be half of the global cargo. Based on these estimates, this paper suggests that a catastrophe could occur in global trade order as well as global maritime logistics. Finally, underlining that the international trade order should not be severely damaged, this paper proposes that countries around the world should seriously discuss this issue at the 12th WTO Trade Ministers’ Meeting in Kazakhstan in June 2020.

1. Introduction

The issues of sustainability in maritime transport and logistics services have been considered in terms of environment, economy, and society. Recently, a substantial amount of research has been conducted on the improvement of energy efficiency and the use of cutting-edge technology [
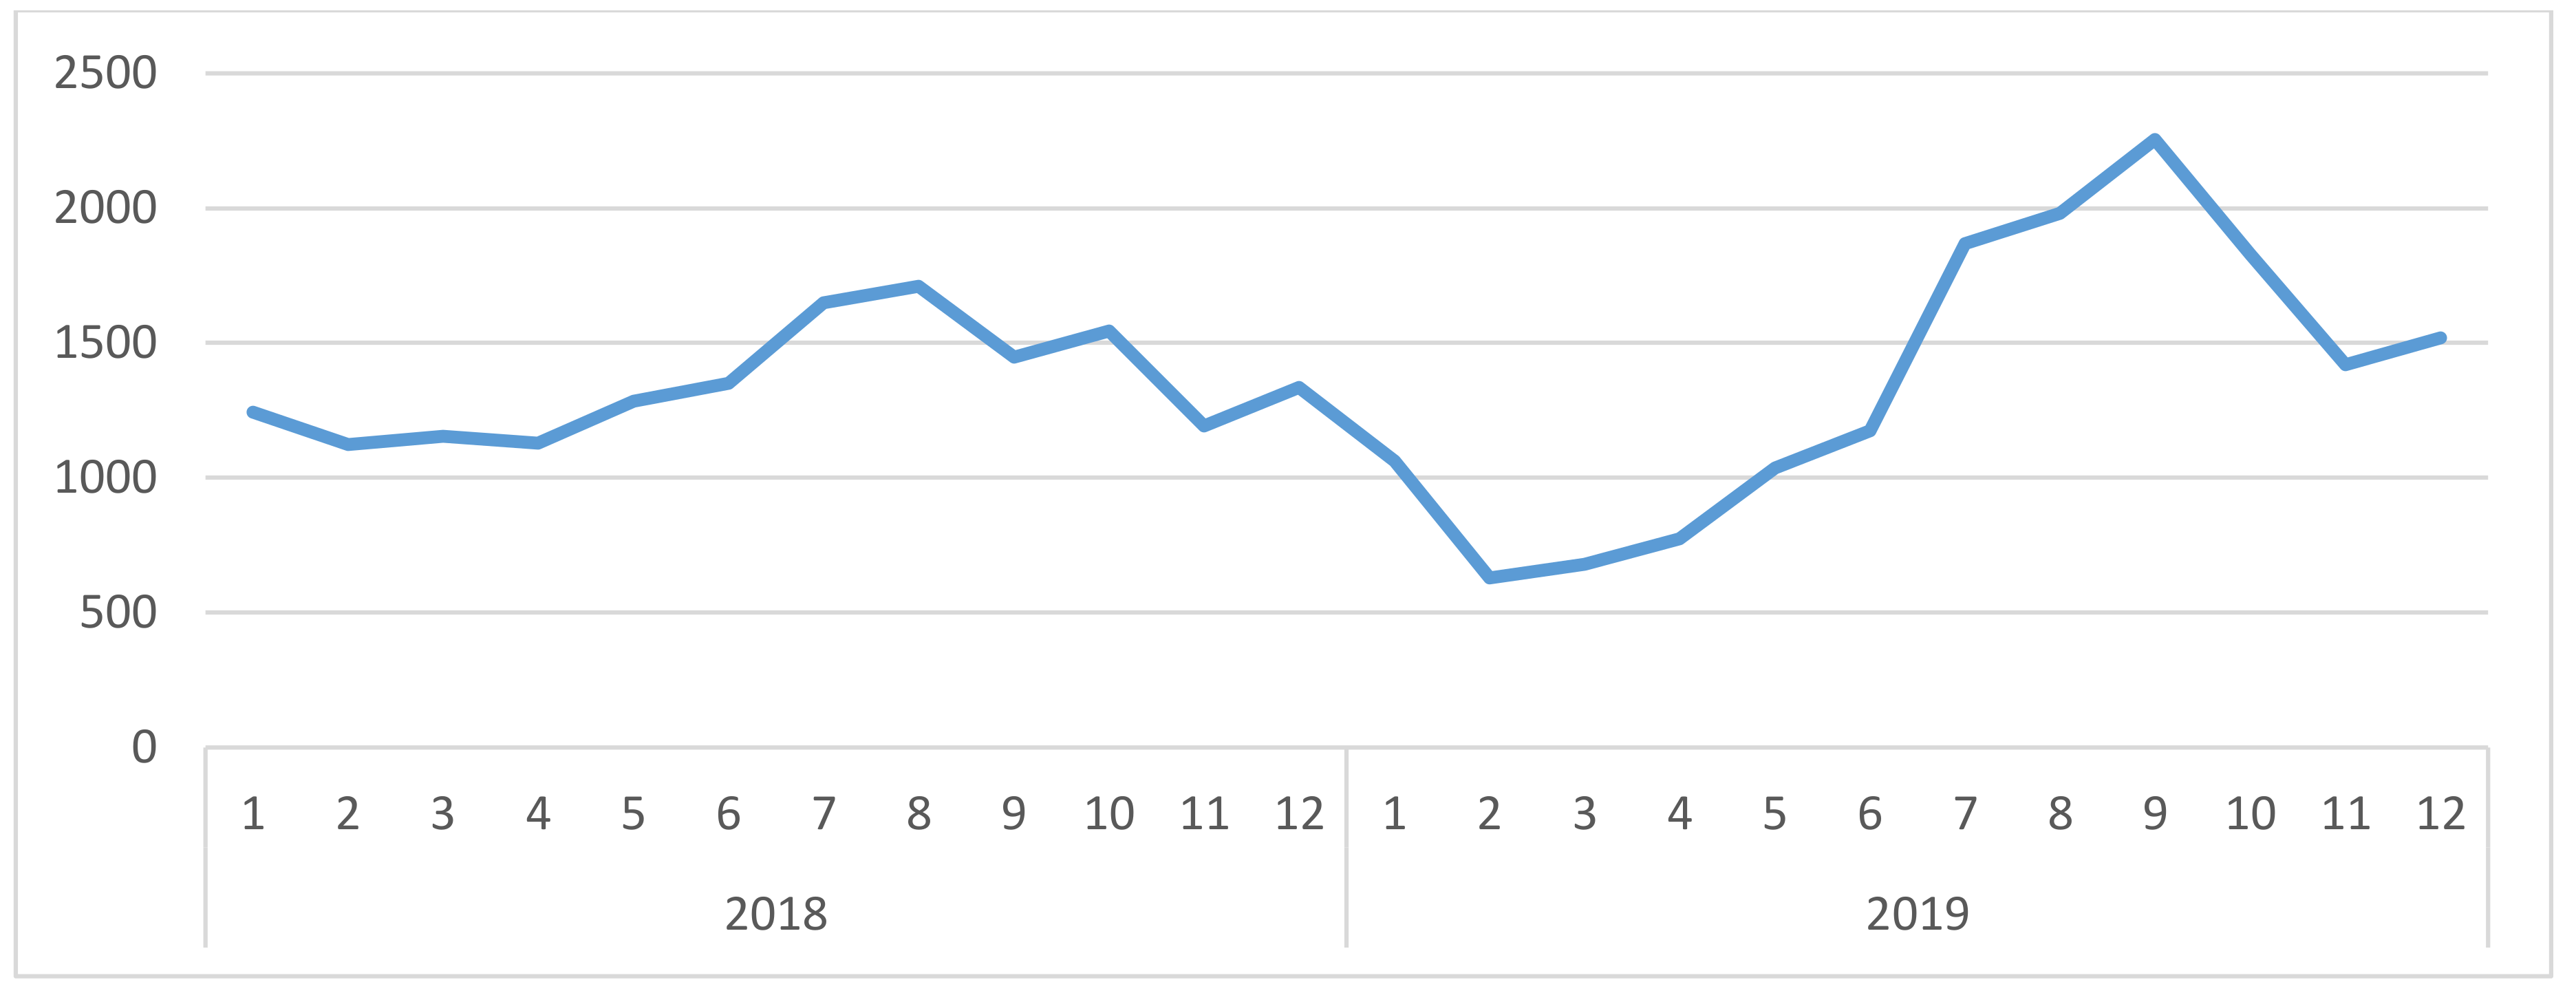
1]. While there are many concerns about the ongoing US–China trade conflict and the proliferation of global protectionism, in-depth research is lacking. Trade volume and maritime logistics services are closely linked, and sea freight prices have fluctuated widely since January 2018, as illustrated by the trend of the Baltic Dry Index (BDI) in Figure 1. The BDI is a shipping cost index, which is used to be a leading indicator of future economic growth.
The Trump administration has denied the appointment of new judges for the Appellate Body, which is the WTO’s Supreme Court. The Supreme Court was closed on 11 December 2019, and this caused the WTO to face an existential crisis. [2]. This means that the WTO cannot impose sanctions on any country which violates the WTO rules. The US’ WTO paralysis is directly related to trade sanctions against China.
What would be the impact on international trade and maritime logistics if the US continues to push the “decoupling” strategy against China and the WTO’s ability to govern the world trade ceased? Imposing new tariffs on China is a clear violation of the WTO rules, but the US is not concerned about the WTO rules, because the Appellate Body has stopped working until an appropriate number of judges is secured [3]. Many countries find their own means of trade protection as they watch over protectionism of the great powers. This has become a concern in several WTO reports [3,4,5,6].
The US imposed an additional tariff of 10–25% on most of the goods imported from China. China retaliated against the US as much as it could, leaving it in a typical tariff war. The 25% of tariffs imposed by the US, with an average tariff rate of 3%, is meant to block the imports from China. Although negotiations have been settled in some areas recently, the prospect is not optimistic.
No country except the US and China dares to unilaterally impose new tariffs. Obviously, nobody wants to be finger-pointed by violating the WTO rules. However, non-tariff trade barriers (NTBs) are difficult to determine the violation of the WTO, and NTBs are therefore often subject to disputes. The WTO member countries tend to be less cautious in adopting new NTBs since violation can be determined through a dispute settlement process. Now, the Appellate Body, the final judging body of the WTO, cannot operate due to the lack of judges, which will be the reason for the expansion of NTBs from next year.
Global protectionism, consisting of tariffs and NTBs, can seriously damage the world economy and global logistics services. According to UNCTAD [7], global maritime trade expanded at a slower pace of 2.7% and 2.8% in 2018 and 2019 respectively, down from 4.1% in 2017, but it is expected to grow by 3.4% between 2019–2024. However, UNCTAD [7] seems to be optimistic, assuming that the current WTO system would regulate global trade, although it considers several downside risks in trade tensions and protectionism, and the Brexit (UK’s withdrawal from the EU). It does not take into account the combined effects of high tariffs and NTBs on global port cargo-handling business and containerized global port throughput. The G2 accounts for 40.0% of the global GDP and 22.6% of the world trade, and these two are the core countries of the global value chain (GVC). The impact of the tariff war on international trade and logistics demand can be immense. Considering tariffs and NTBs at the same time, the adverse effects will be magnified.
This paper tries to consider that the US-China conflict and the weakened WTO function may lead to installation of new NTBs in other countries and suggests that the combination of tariffs and NTBs can severely reduce the volume of international trade and the demand for maritime logistics services. This paper differs from previous studies in several aspects. Although the world trade system is fundamentally shaken, previous studies mostly scrutinize specific issues and do not analyze the impact on the demand for international shipping services. Around 80% of current global trade comes from the GVC which consists of China and the United States as the key pillars. If the WTO collapses and tariffs and NTBs increase around the world, trade will shrink significantly. In this regard, a question can be raised whether the current international shipping logistics system can be sustained or not. This study aims to estimate the impact of global protectionism on global shipping and logistics, in order to examine whether the industry will be sustainable or not. In this paper, we use various quantitative techniques to estimate the impact of global protectionism from the perspective of trade and logistics services, using a dynamic computational general equilibrium (CGE) model and trade-cargo-container conversion methodology. Based on the simulation results, the paper seeks to draw policy implications.

2. Literature Review on Trade Conflict, NTBs and Logistics

The world has experienced trade and economic growth as a result of trade liberalization under the multilateral trade system of the WTO, but now protectionist trade policies are spreading around the world. Thus, the world trade has been reduced by heightened trade tensions [8]. WTO [3,4,5] and CGTN [9] discuss the risk of the WTO, and Mr. Azevêdo, Director-General of the WTO, states “A well-functioning, impartial and binding dispute settlement system is a core pillar of the WTO system.” Ms. Georgieva [10], IMF Managing Director, confirms that “unfortunately, this time growth is decelerating” due to protectionism. The prolonged period of trade conflict will cause a periodic slowdown of the world economy [4,11].
Johnson [12] performed the modern economic analysis of trade conflict, based on a two-person non-cooperative game in order to select their optimal tariffs considering the partner’s retaliatory tariffs. Tariff wars were analyzed with various approaches by Kennan and Riezman [13], Eggert and Haufler [14] and Syropoulos [15]. Kennan and Riezman [13] and Syropoulos [15] tried to identify the significance of economic size in trade models, that consider the terms of trade. Baldwin [16] and Grossman and Helpman [17] tried to theorize domestic politics in forming a protective trade policy. Breuss [18] analyzed the effects of retaliatory tariffs, showing more efficient and accessible instruments than a tariff war.
Based on the relationship between tariffs and the terms of trade, Zissimos [19] showed the importance of multilateral trade liberalization and region-wide free trade agreements (FTAs). Ossa [20] developed a quantitative evaluation methodology of trade conflict, estimating Nash-equilibrium tariffs of 56.6% for the US and 62.9% for China, assuming the two-country model and optimal retaliation strategy. A similar approach was performed in Nicita et al. [21], of which they re-estimated Nash tariffs, drawing that trade conflict would increase the world’s average tariffs by 32%.
Analyzing traditional trade theory and the global trade model, a tariff war and protection trade policy cause economic losses not only in the dispute parties, but also in the world economy. However, strategic approaches by Zissimos [19], Ossa [20], and Kee and Nicita [22], and Nicita et al. [21] demonstrate the optimal tariffs for large economies in the context of strategic response and long-term gains. It could be one of the backgrounds for the US to enter into a tariff war with China.
A close relationship between logistic efficiency improvements and export performance can be found in substantial literature, including Hummels [23], Limao and Venables [24], Wei and Yi [25], Redding and Venables [26], Wilson et al. [27], Anderson and Banomyong [28], Tongzon [29], Tongzon and Cheong [30], Cheong and Suthiwartnarueput [31], Arvis et al. [32], and others. These existing studies analyzed the ripple impact of the reduction of logistics costs due to technical and institutional improvements, while this paper analyzes the adverse effects when the trade cost increases due to the increase in tariffs and the expansion of NTBs. CIF-based import costs include trade-related costs such as freight, tariffs and insurance, as well as commodity prices, but the additional costs to overcome NTBs must also be included in the total cost of trade.
Existing research on NTBs is abundant. Examples are Carrère and De Melo [33], Beghin et al. [34], Ghodsi and Stehrer [35] and McCallum and Lincoln [36]. Many literatures, such as Kee et al. [37], Disdier and Marette [38] and Khouilid and Echaoui [39], used the gravity model in order to estimate the effect of protectionist trade policies on international trade. Researches such as Arkolakis [40], Hummels and Klenow [41], and Steingress [42] approached the NTBs as an additional entry cost to international trade.
The global logistics industry is very concerned about the current international situation and the deterioration of the international trade environment. They expect the US-China trade conflict would distort the supply chain and shrink international trade and logistics demand. This can be found in various sources such as The Financial Times [43], Supply Chain Digital [44], Inbound Logistics [45], Supply Chain Brain [46], The Asian Banker [47], Forbes [48], DHL [49], Supply Chain Quarterly [50], and Logistics Management [51,52]. They see a serious shock to the recovering global logistics market. According to Supply Chain Digital [44], CEOs of the world’s major logistics companies believe that trade conflicts affect the global economy as a whole and will cause a severe recession for logistics industries. Forbes [48] argues that the US’ policy of “decoupling” scrambles the GVC and freezes investment minds. The ‘geopolitical bridges’ between the G2, which have been built over the past 40 years, will burn down. Logistics Management [52] predicts that Trump’s China policy will also cause significant losses to the US logistics industry, citing that in October 2019, inquiries about ships in the Port of Los Angeles decreased by 25% year-on-year and cargo volume decreased by 19.1%. These studies are merely descriptive assessments and do not quantitatively estimate the impact of global protectionism. Moreover, no literature mentions the increase in NTBs due to the collapse of the WTO.
Regarding the costs of the US-China trade conflict, Ciuriak and Xiao [53] estimated a 0.062~0.07% decline of global GDP, and Abiad et al. [54] found 0.2%~1.0% GDP losses for the G2 countries. Carvalho et al. [55] predicted the welfare losses of 39–43 billion dollars to China and 19–24 billion dollars to the US. Global GDP and trade volume were to be reduced by 1.96% and 17%, respectively, according to Bekkers and Teh [56]. Trade conflict is hurting China more, but supply chain disruption causes the US to lose its GDP [57,58,59], and the US exports to China up to 71% [60].
Most of the existing descriptive studies analyze specific issues related to the US-China trade friction, and studies using quantitative models mainly estimate the impact of the protectionist trade measures employed by the US and China on global economic growth or trade losses. Additional tariffs are reflected in the estimate, but do not consider the possibility of the collapse of the WTO and any related risks the global economy faces today. Moreover, quantitative analysis of this on global logistics demand is difficult to find. There is no research that the collapse of the WTO could lead to a new wave of protectionism with NTBs. In this situation, a question can be whether the global trade and logistics industry will be sustainable or not. There arise concerns that the world economy may face a systemic crisis beyond the recession. Furthermore, no debate has taken into account the impact of the combined action of the US–China trade conflict between the G2 and the protectionism of other countries on global trade and logistics. The global logistics industry is also unaware that the suspension of the Appellate Body will have a decisive impact on the international trade system itself under the WTO. This paper focuses on the impact of protectionism on the global logistics industry including fundamental changes in the international trade environment that are not currently drawing enough attention.

3. Research Design and Methodology

3.1. Outline of the Research and Research Design

The protectionism triggered by the US–China trade friction will spread around the world in forms of NTBs. It is said that global trade is exposed to protectionism more frequently and with higher strength, as envisioned by Foreign Policy [61], WTO [3,4,5], and the UN [11]. This paper tries to take these issues into account in a scientific approach, as demonstrated in Figure 2. Based on previous studies, the levels of global protectionism as a tariff and non-tariff trade barrier (tariff equivalent) are assumed, which will be assigned to the dynamic CGE model to estimate the impact on the global trade flow. Trade-cargo-container conversion explored by Lee et al. [62] for the first time in academic papers, as well as Cheong and Suthiwartnarueput [31] and Cheong and Cho [63] will be applied to trade estimates to calculate the impact on global logistics demand. Major findings using the trade-cargo-container conversion approach is summarized in Table 1.
Although there are some studies on the impact of protectionism on trade and economic growth, there is little research on the effect of protectionism on global maritime logistics (container) demand (The magazine of A plus (2018, p.13) states that “As one of the world’s leading logistic service providers, we are expecting a direct hit on our business, mainly in the trade lane between China and U.S., in both exports and imports.”). Based on the preceding research, the authors try to calculate two types of trade barriers: the tariff hikes between the US and China; the tariff equivalents of NTBs by remaining countries. A series of simulations will be developed with a dynamic CGE model, which is widely used in trade policy analysis, to simulate the impact of global protectionism. This study establishes scenarios for the spread of protectionism and estimates the effect of protectionism on world trade. By using the trade-container conversion coefficients by industries based on the approach in existing research, the impact of current global protectionism on the demand for global maritime services is estimated for the first time, and policy implications are drawn.

3.2. CGE Model and Data

Trade tension, protective trade policy and related uncertainty have increased sharply, and surveys suggest that investors regard the current trade conflict as the top risk and that global protectionism will distort the GVC [64]. The collapse of the WTO will make global business environment worse over time.
This paper uses a dynamic CGE model of the Global Trade Analysis Project (GTAP), which is called as the GDyn, whose structure is described in Ianchovichina and Walmsley [65]. This model is run with a well-balanced global database of multiple sectors and regions. Among primary production factors, capital is allowed to move across industries in a region as well as between regions, but labor forces are only mobile across industries in a region. International trade is modeled with the traditional Armington structure, and a market structure of perfect competition is assumed for all industries and production factors Further, production sectors decide intermediate goods with constant return to scale (CRS) production structure.
The left figure of Figure 3a summarizes the model structure of GTAP, while the right Figure 3b shows regional investment adaptation mechanism with a complicated structure of equations, coefficients and database. There may be temporary imbalances in investment, but simulations continue to converge until the model arrives at another full equilibrium. If, for some reason, the rate of return (ROR) on investments of an area rises, the world’s inflow of investment increases according to the adaptation coefficient. A detailed explanation is given by Ianchovichina and Walmsley [65].
A database is needed along with the quantitative simulation model. In this study, we will use the GTAP database version 10 released in 2019. The GTAP database breaks down the global economy into 141 countries, each of which consists of 65 industries. This study aggregates the global economy into five regions (US, China, EU, and developed and developing countries) and the industries into ten. Nine industries except services are equivalent to the conversion index in Table 2.

3.3. Conversion Coefficients of Trade-Container Shipping in TEU (Twenty-Foot Equivalent Unit)

Since there is no data available on conversion coefficients of trade-container, the approach by Cheong and Suthiwartnarueput [31] and Cheong and Cho [63] was employed in this research. During the customs clearance, information such as the name of an item, HS code, amount, weight and number of items is collected. This information could be used to capture the relationship between trade and maritime cargo logistics services. This paper focuses on maritime transportation that covers about 80% of global trade by volume. Maritime cargo can be transported in bulk forms or in containers. Only the weight of the export/import cargo arriving at the port is known, and there is no information on whether the forms of bulk or container are used for a specific trade or not.
The dynamic CGE model estimates the impact of global protectionism in terms of the trade value, and this will be converted into the cargo weight equivalents and the demand for containerized cargo (in TEUs) based on the containerization conversion coefficients. In order to formulate the estimates for the impact of global protectionism into the demand for containerized logistics services, four stages of coefficient calculation should be done. First, the average weights of the cargo by industry per US $1 million classified in this study should be calculated. Second, the ratio of port transportation by industry should be calculated in order to find the demand for port throughput, since a part of total cargo will be transported via port. Third, the containerization ratio is derived based on the data of the trade values and the cargo in TEU. Finally, the conversion coefficients for containerized cargo are needed.
Trade-cargo-container conversion was studied in a few studies, such as by Cheong and Suthiwartnarueput [31], because of the difficulties in collecting data for many countries to calculate conversion coefficients. Although this study requires an abundant amount of data as it estimated the impact on the global trade, the coefficients are drawn based on the data of Cheong and Suthiwartnarueput [31] due to the data accessibility (Cheong and Suthiwartnarueput [31] used the port trade database provided by Korea’s Shipping and Port Internet Data Center (SP-IDC)). These results are shown in Table 3. The average weight of exports or imports of US $1 million is 785 tons, and 73% of all international cargo is transported by sea on average. Further, the proportion of container freight is 61% across all industries. The conversion coefficient for containerized cargo is to be 13.87 tons per container calculated with the information of the UNCTAD [7]. According to the UNCTAD [7], total volumes of 11 billion tons were handled in 793.26 million TEUs. A simple average of Cheong and Suthiwartnarueput [31] for Korea and Lee et al. [62] for Taiwan was 16 tons, which is heavier than this paper. For reference, the gross weight of a loaded container should be less than 25 tons).

4. Simulation Scenarios and Result Interpretation

The last section presented a CGE model for estimating the impact of these trade barriers on world trade and analyzed what forms of global protectionism would appear and the conversion coefficients from trade volume to TEUs. This section sets up the scenarios of quantitative analysis and present the estimation result, using the methodology in Section 3.

4.1. Tariff War Between China and the US

In December 2019, the US and China agreed on a “phase I out of phase IV’’ (as President Trump claims) 17 months after the US imposed high tariffs on China in July 2018. The agreement is a “small deal," corresponding to only a few of the controversial issues between the two parties. Although the expansion of the G2 trade conflict was avoided, it is not optimistic that the G2 countries will establish a sound trade relationship in the near future. With the idea of ‘decoupling’ between the US and China, the US is “burning down the geopolitical bridges that were built over the past four decades between Washington and Beijing [48].”
The U.S. charges an additional 25% of tariffs on the Chinese exports worth of $250 billion and 15% on $115 billion dollars, while China imposes a 5–25% tariff on the US exports worth of $110 billion, as of November 2019, as summarized in Table 4. As the negotiations were sluggish in mid-2019, President Trump threatened to raise tariffs against China. In the early days of the tariff war, China imposed retaliatory tariffs at the same level as the United States, but abandoned its direct confrontation to the US’s huge tariff imposition and proposed to negotiate with the US. The key to Phase I negotiations is as follows. Instead of raising additional tariffs (15% to $110.5 billion to 30%) by the US, China promised to import US agricultural products worth of $40–50 billion with some measures about intellectual property rights, financial service market, exchange rate transparency, and others.
Many issues such as forced technology transfers, subsidies by the Chinese government, and state-owned enterprise reform, that will be covered in the second phase of negotiations, are not easily concluded. These are directly related to the structural reform of the Chinese economy. Phase III negotiations could be China’s mechanism for implementing the details of the agreements. The first phase of negotiations is only an outpost, and the second and third stages of negotiations are the main game. The US’ sanction against Huawei, a Chinese tech giant, is deeply linked with its goal to disturb China’s technological hegemony. The US is referring to Hong Kong, Taiwan and Xinjiang Uyghur in intentionally irritating the “One China” policy in order to pressure China, which may make the US-China relationship more tangible in the future. The US could also seek a new multilateral trading system to replace the current WTO, pushing for global solidarity to contain China’s unfair trade. As Zeihan [67] analyzes, the US is either out of the WTO or excludes China from international trade.
The US-China will approach these issues in the context of hegemonic competition and may lead to uncompromising disputes. It will be difficult to reach a second phase agreement, and in the process, the US may issue a new tariff card. The first stage agreement should not be overestimated, and the possibility of a tariff war still exists.
As of November 2019, an additional tariff of 15–25% is imposed on US $366.5 billion, covering 72.13% of the US’ imports from China, and 49.41% of those are required to pay additional 25% tariffs. In 2018, China’s imports from the US were $122.3 billion, with 89.43% of the total imports being levied at 5–25%. This reduced US imports from China by more than 10%, and China’s import from the US by about 20%.
However, the impact of the increase in tariffs was not fully reflected in trade this year, as companies rush trade before tariffs, making the Chinese logistics companies to enjoy an unexpected boom this year. In the future, however, the increased tariff rates will put a heavy burden on trade. High tariffs between the US and China have worked against global growth, “both via the direct effects on trade flows, supply chains and import costs, and via the wider indirect effects on business sentiment, uncertainty, and investment around the world [64] (p.32).”

4.2. Paralysis of the Appellate Body and NTBs by Other Countries

The impact of the US-China trade friction is not limited to bilateral relations. The US believes that the current WTO rules do not properly regulate China in many aspects such as protecting intellectual property rights and regulating subsidy. Although there are a number of reasons for this, the US decided to make the Appellate Body come to a halt in order to put China in check. The US’ approach to deactivate the WTO is to prevent the appointment of a new judge. New member of the Appellate Body cannot be appointed with the agreement by all member countries.
There is only one member of the Appellate Body after 11 December 2019. Since the Appellate committee cannot be formed with one member, the WTO completely lost its ability to resolve disputes among its members [9,61]. This situation extends beyond dispute resolution and affects other member countries in the compliance with the WTO rules since the Appellate Body cannot determine the violation of the WTO rules. This is a part of the reasons why the fact that NTBs have risen to the highest level ever in 2019, as analyzed by the WTO, which reports the highest level of trade restrictions by WTO members this year. “The trade coverage of import-restrictive measures implemented by members was estimated at USD 747 billion. This is the highest trade coverage recorded since October 2012 [4].”
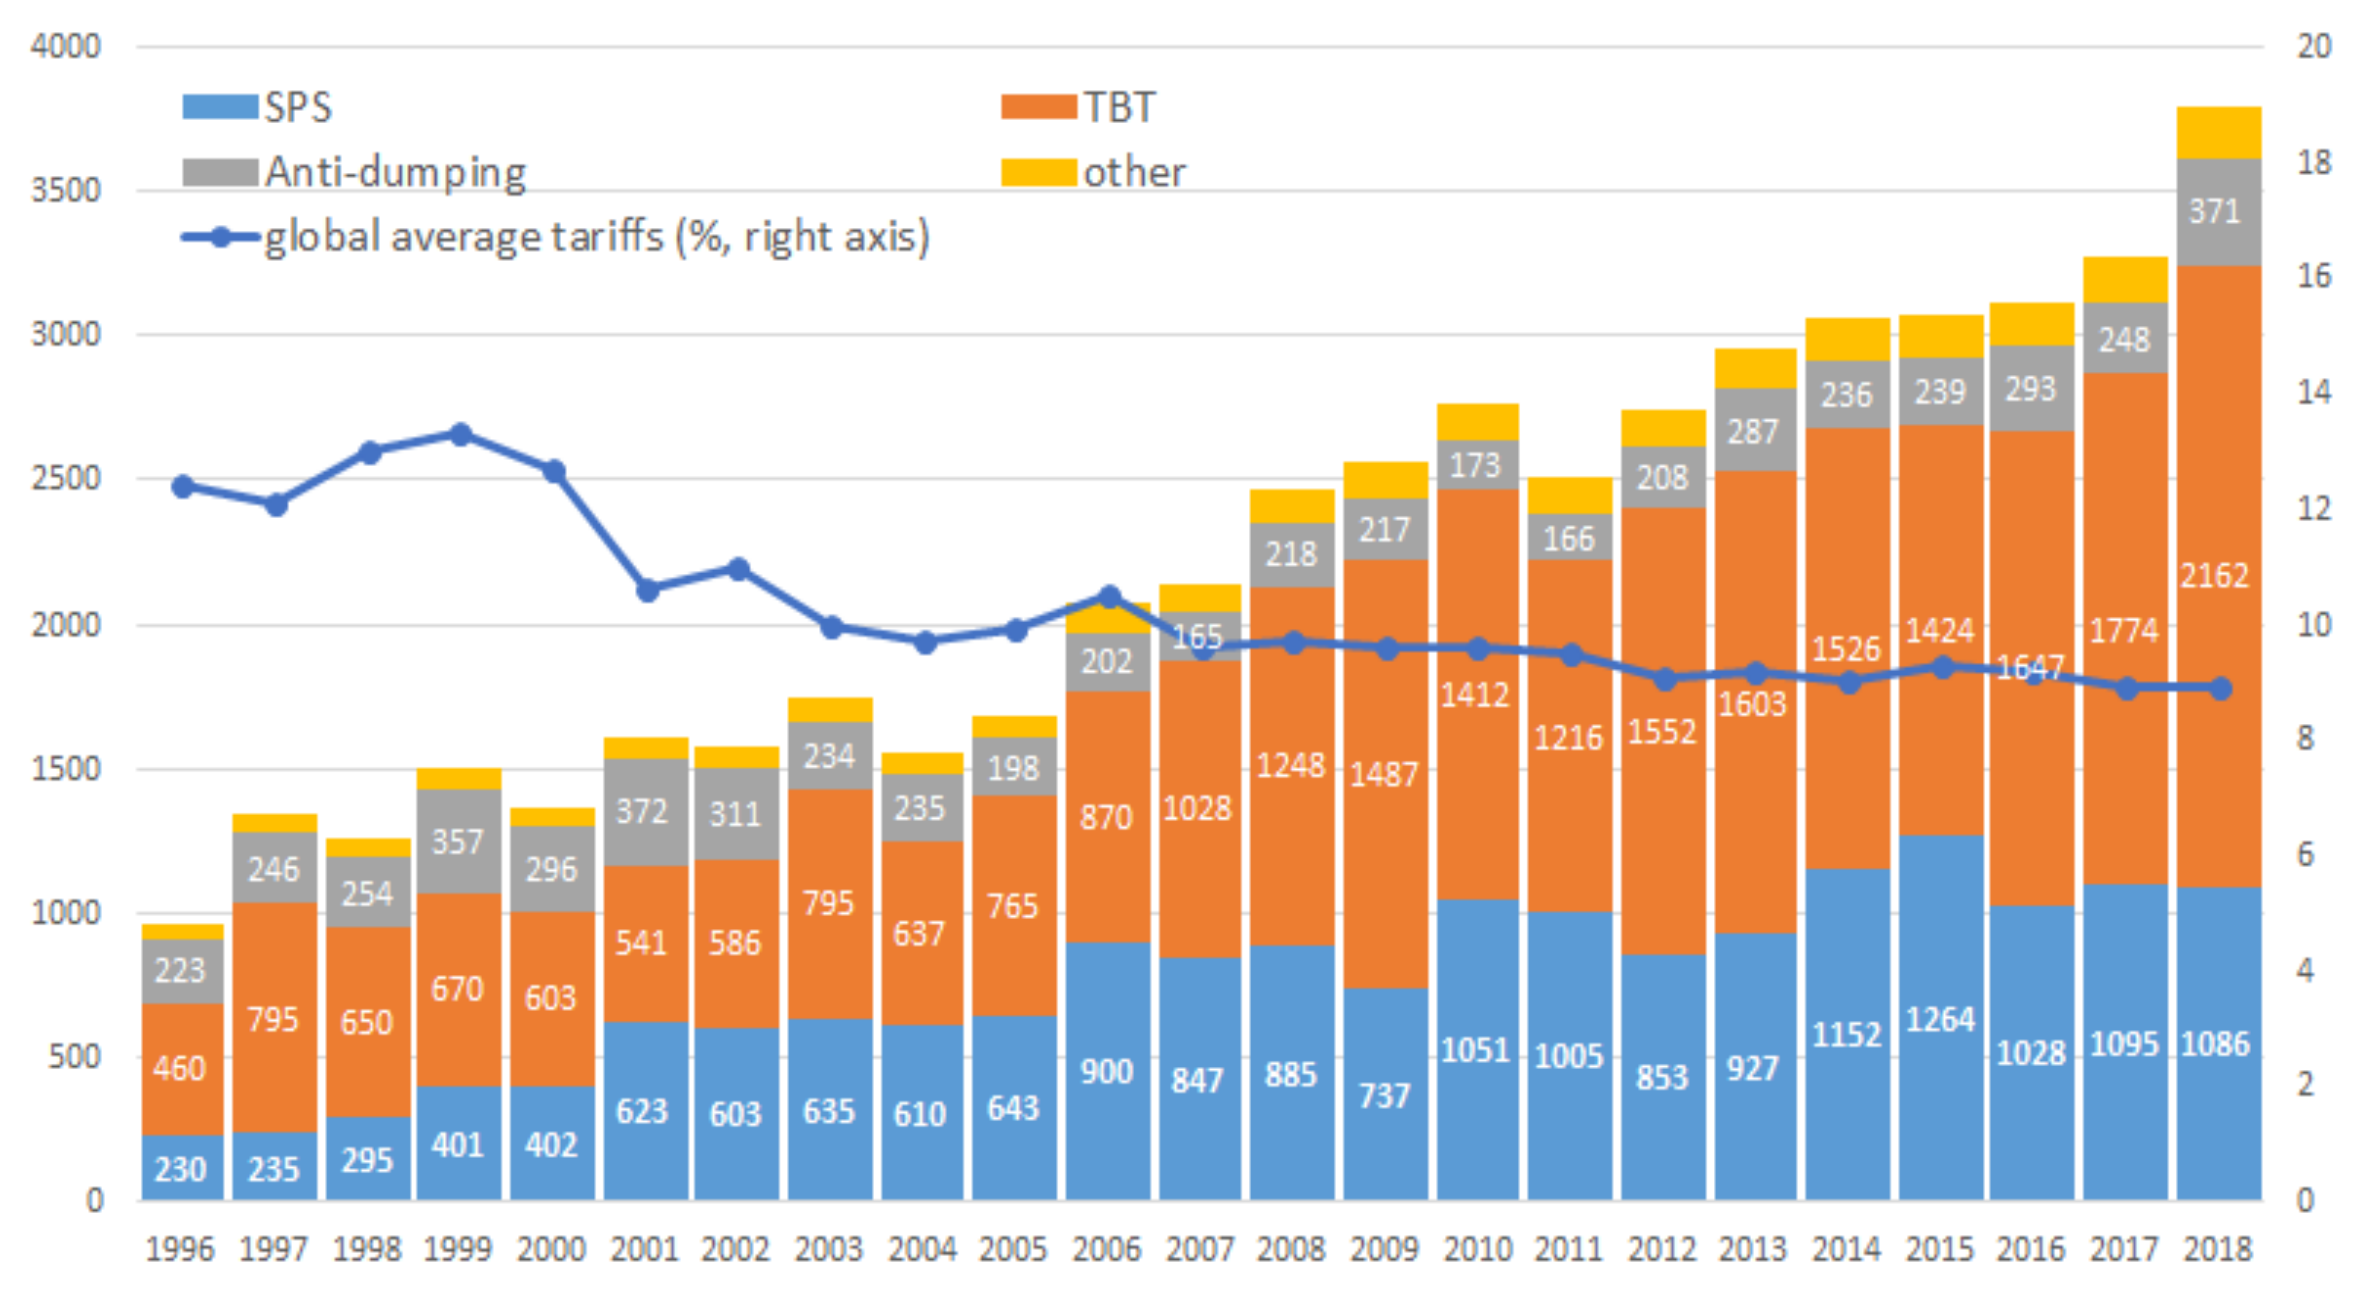
Tariff barriers have been steadily falling due to trade liberalization under the multilateral trading system after World War II, while NTBs have recently increased rapidly. In addition, most of the NTBs are Technical Barrier to Trade (TBT) and Sanitary and Phytosanitary measures (SPS) measures, and the proportion of TBT and SPS are increasing. The average world tariff rate is 8.9% in 2017, falling from 13.34% in 1999. Nevertheless, the world has seen a reversed trend in the NTBs since mid-2018. Especially the escalation of bilateral tariffs between China and the US raised the average global tariff rates (not reflected in Figure 4).
Even if the WTO became ineffective, as only a few countries except the US and China would impose additional tariffs, since this can lead to trade retaliation by the other country. The protectionist trade policy using NTBs tends to have a gray measure, which is less repulsive to counterparts than tariffs. In addition, it is expected that many countries will use it as a means of a protectionist trade policy because it is possible to tailor differentiated measures aimed at specific countries and companies, and it is easy to establish trade barriers without the recognition of other countries due to changes in domestic institutions and practices [68]. Despite the fact that the WTO regulates the adoption of unfair TBT and SPS, the rapid increase of these in recent years (Figure 4) suggests that trade barriers by TBT and SPS will increase more rapidly if the WTO’s monitoring of NTBs is weakened.

4.3. Simulation Scenarios

As discussed in Chapter 2, global protectionism consists of the US-China trade conflict and the proliferation of NTBs by the rest of the world. It is difficult to predict future US-China relations under the hegemonic struggle and the US’ decoupling strategy. Although suspended by negotiations, in 2019, the US pushed for a 30% surcharge on China. 15% and 25% are imposed on many items now. As a baseline scenario, we assume that the US set a 20% surcharge on all items imported from China. An optimistic scenario can be an addition of a 10% tariff, while a pessimistic scenario is that of 30% (Nicita, Olarreaga and Silva [21] predicted that US-China trade war would increase average tariffs by 32%). Considering such multifaceted measures against China, including heavy sanctions against the Chinese firms such as Huawei, investment regulations, and exchange rate transparency, are going on or under planning, the scenarios are set to capture these effects as tariff barriers. Despite the disadvantaged conflict structure compared to the US, it is assumed that China corresponds to the US trade sanctions.
It is very difficult to set NTBs scenarios for the rest of the world. This is because it has to be converted to tariff equivalents (TEs) rather than non-tariff barriers themselves. According to Cadot, Gourdon and Tongeren [69], which estimated the trade effects of NTB measures in more than 80 countries using the OECD METRO model, the TEs of NTBs, taking into account frequency, was the highest at 28.7% in processed foods, followed with 26.8% in wood and furniture, 22.3% in motor vehicles. The industries with relatively low barriers are 8.3% for shoes, 7.7% for paper, and 6.4% for metal products.
A study analyzing the effects of Korea’s non-tariff measures on imported beef shows that non-tariff barriers were as much as the prices of imported beef between 2000 and 2014, when a high level of non-tariff measures was applied (Figure 5). In response to Korea’s SPS action, Canada filed a dispute case in the WTO (dispute case: DS391), and Korea withdrew its measure in response to the claim from the exporting country. This can be regarded as an exemplary case, demonstrating the result of a well-functioning dispute settlement system in the WTO.
TEs can be over 100% depending on the measures as seen in the case of Korea, but the TEs in Cadot, et al. [69] were taken for this paper. It may be controversial, but for the sake of convenience, we will set TEs 15% as the baseline scenario and 10% and 15% as alternative scenarios. The tariff and NTBs scenarios are summarized in Table 5.
As suggested above, NTBs are mainly TBT- and SPS-related measures, and they are gray in nature, making it difficult to quantify the effects of NTBs. In particular, Carrère, Céline and De Melo [33] point out that NTBs are the most difficult to model because of the grey characteristics. According to Crivelli and Groeschl [70], SPS itself provides high flexibility for importing countries, so many countries use it as the most effective means of protecting domestic producers. These obstacles make it more difficult to calculate the TEs of NTBs in this study. Therefore, a set of scenarios by integrating the results of the existing research was established for simulations.

4.4. Simulation Results

Table 6 summarizes the impact on international trade, global cargo and container logistics under the scenarios set out in this paper. The impact on the global logistics industry could be significant. In Scenario 1, international trade would shrink by $7.2 trillion, and if Scenario 3 is realized, $12.8 trillion of trade is anticipated to disappear. Considering that the world’s total trade volume in 2018 is $39.3 trillion [5], 32.5% will be reduced under Scenario 3, and the impact on the international logistics industry can be enormous.
Global cargo losses are expected to be between 6.2 and 10.8 trillion tons by weight, and port cargo is expected to decrease by 3.95 to 6.9 trillion tons, depending on the scenario. Under Scenario 2, which is the baseline scenario, the reduction in containerized cargo is expected to be 2.97 trillion tons, while the non-container cargo is expected to be reduced by 2.56 trillion tons. The reduced weight of containerized cargo in terms of TEUs translates into 153–267 million TEUs across the scenarios. Considering that the annual container throughput of Shanghai Port, the world’s largest container port in 2018, is 42 million TEUs. If Scenario 3 is realized, the impact on the global logistics industry will have the same impact as the lost volume that is six times larger than that of Shanghai. This must be a huge shock.
Table 7, Table 8 and Table 9 present the contents of Table 6 by each scenario and industry. It is suggested that the industry with the most trade and logistics losses throughout the scenarios will be petrochemicals and chemicals. Following petrochemicals, electrical goods could be hit hard. The steel and transportation equipment industries are expected to have moderate impact and the impact on the rest of the industry to be relatively modest.
Looking at the estimates under Scenario 1, more than a half of the total trade and volume losses are in the petrochemical industry, but the losses in the textile and apparel industry are likely to be small, less than 1% of the total. Non-container cargo losses in the petrochemical industry are expected to decrease by 1.06 trillion tons and to lose 71 million TEUs of cargo handling opportunities. Container cargo losses in steel and agriculture are also expected to exceed 20 million TEUs.
If scenarios change to 2 and 3, the estimates will increase more than in Scenario 1, suggesting that the adverse effects of global trade protection will deepen. Still, the proportion of petrochemicals in non-container and container cargo losses is overwhelmingly high. The industry with the weakest container cargo loss across all the scenarios is machinery, with container cargo losses between 1.59 and 2.8 million TEUs.

5. Conclusions

Various risks and uncertainties are strengthening the downside of the global economy [71]. The industry of financial and international trade services is cheering on the fragmentary news of positive discussions between the US and China, probably because of the anticipation of avoiding the worst situation. However, the US-China conflict cannot be resolved within 1–2 years (Mr. Jack Ma of Alibaba said that “the US-China relationship will be in some turbulence for the next 20 years” in his interview with Bloomberg 14 November 2019). The US sees China in the context of a security-trade nexus, while China is trying to resolve it in the trade landscape.
This paper estimates international port cargo losses from the current global protectionism to range from 3.95 to 6.9 billion tons, depending on the scenarios. Considering the 2018 global maritime cargo was 11 billion tons according to UNCTAD [7], global logistics demand is expected to decrease by half if Scenario 3 becomes a reality. This must be a huge shock to logistics industries. This paper underlines that if the world trade order is not normalized, a catastrophe may occur in the world economy as well as the logistics industry.
Academics and the industry have not fully considered the adverse effects of the shutdown of the WTO Appellate Body. The WTO itself will remain, and the trade environment will gradually deteriorate due to invisible non-tariff barriers, but the cumulative effect can be enormous. As reviewed in Chapter 2, no prior quantitative research on the impact of global protectionism on maritime logistics sector can be found.
Reasonable dispute settlement procedures are of paramount importance in the WTO’s function, ensuring that each member country complies with the WTO trade rules and prevents trade conflicts from escalating into a war such as World War I and World War II. This is why the 12th WTO Ministerial Conference (Nur-Sultan, Kazakhstan in June 2020) will be critical in restoring the global trade order. The international community should re-establish the status of the WTO by agreeing to a well-functioning dispute settlement system and discontinuing its protectionist policies.
Overall, this paper suggests that the global logistics industry may have a shocking impact. In this regard, the limitations in this estimation can also be pointed out. First, the question of the adequacy of the scenario setting can be raised. A partially relaxed level of global trade protection can be established, but the international trade environment should never be taken lightly when the WTO system becomes incapacitated. Second, the refinement of the conversion coefficient by region will increase the accuracy of the estimates. Since it is difficult to secure data and is a task that requires a lot of effort, it should be balanced with importance. Third, the petrochemical industry accounts for more than half of the overall impact in Table 7, Table 8 and Table 9. There are many different types of petrochemicals. While dry products can be transported in containerized cargo, a large portion of liquid petrochemicals are transported in tank ships. These characteristics of the petrochemical industry need to be reflected more precisely in research. While estimates may change as new conversion factors become available, the conclusion that a serious impact is expected for the global logistics industry remains.

Author Contributions

Methodology, trade-cargo-container coefficients, J.C. and I.C.; literature survey, E.K.H. and J.Y.; editing, E.K.H.; Trade estimation, conceptualization and supervision, I.C., J.C., J.Y., and E.K.H. All authors have read and agreed to the published version of the manuscript.

Funding

This research received no external funding.

Acknowledgments

The authors would like to thank the anonymous reviewers for reviewing this paper. They are also grateful to Chang-soo Lee (Kyunghee University), and Lurong Chen (ERIA) for their discussion and advice during the writing process. They would like to thank Inha University graduate students majoring FTA Policy for their help in organizing the data.

Conflicts of Interest

The authors declare no conflict of interest.

References

  1. Lee, P.T.-W.; Kwon, O.K.; Ruan, X. Sustainability Challenges in Maritime Transport and Logistics Industry and Its Way Ahead. Sustainability 2019, 11, 1331. [Google Scholar] [CrossRef] [Green Version]
  2. Council on Foreign Relations. A Reset of the World Trade Organization’s Appellate Body; CFR: New York, NY, USA, 2020. [Google Scholar]
  3. WTO. DG Azevêdo to Launch Intensive Consultations on Resolving Appellate Body Impasse; WTO: Geneva, Switzerland, 2019. [Google Scholar]
  4. WTO. Twenty-Fourth Annual Review of the Implementation and Operation of the TBT Agreement, G/TBT/42; WTO: Geneva, Switzerland, 2019. [Google Scholar]
  5. WTO. Global Trade Growth Loses Momentum as Trade Tensions Persist; WTO: Geneva, Switzerland, 2019. [Google Scholar]
  6. WTO. Potential Economic Effects of a Global Trade Conflict; WTO ERSD Report; WTO: Geneva, Switzerland, 2019. [Google Scholar]
  7. UNCTAD. Review of Maritime Transport 2019; United Nations: New York, NY, USA, 2019. [Google Scholar]
  8. European Central Bank. The Economic Implications of Rising Protectionism: A Euro Area and Global Perspective; ECB Economic Bulletin: Frankfurt, Germany, 2019. [Google Scholar]
  9. China Global Television Network (CGTN). Who’s killing the WTO; Geneva, Switzerland, 2019. Available online: https://news.cgtn.com/news/2019-12-13/Who-s-killing-the-WTO--MmWyIh8wfe/index.html (accessed on 13 February 2020).
  10. Georgieva, K. Decelerating Growth Calls for Accelerating Action; IMF Webcast: Washington, DC, USA, 2019. [Google Scholar]
  11. UN. Global Issue: Trade Conflict a Threat to Global Growth; World Economic Situation and Prospects No. 130; UN: New York, NY, USA, 2019. [Google Scholar]
  12. Johnson, H.G. Optimum tariffs and retaliation. In International Trade and Economic Growth; World Scientific: Singapore, 1953; pp. 31–62. [Google Scholar]
  13. Kennan, J.; Riezman, R. Do big countries win tariff wars. In International Trade Agreements and Political Economy; World Scientific: Singapore, 1988; pp. 45–51. [Google Scholar]
  14. Eggert, W.; Haufler, A. When do small countries win tax wars? Public Financ. Rev. 1998, 26, 327–361. [Google Scholar] [CrossRef]
  15. Syropoulos, C. Optimum tariffs and retaliation revisited: How country size matters. Rev. Econ. Stud. 2002, 69, 707–727. [Google Scholar] [CrossRef]
  16. Baldwin, R.E. Political Economy of US Import Policy; MIT Press: Cambridge, MA, USA, 1985. [Google Scholar]
  17. Grossman, G.M.; Helpman, E. Trade wars and trade talks. J. Polit. Econ. 1995, 103, 675–708. [Google Scholar] [CrossRef] [Green Version]
  18. Breuss, F. WTO Dispute Settlement: An Economic Analysis of Four EU–US Mini Trade Wars—A Survey, Journal of Industry. Compet. Trade 2004, 4, 275–315. [Google Scholar] [CrossRef]
  19. Zissimos, B. Optimum tariffs and retaliation: How country numbers matter. J. Int. Econ. 2009, 78, 276–286. [Google Scholar] [CrossRef] [Green Version]
  20. Ossa, R. Trade wars and trade talks with data. Am. Econ. Rev. 2014, 104, 4104–4146. [Google Scholar] [CrossRef] [Green Version]
  21. Nicita, A.; Olarreaga, M.; da Silva, P. A Trade War Will Increase Average Tariffs by 32 Percentage Points; VOX EU: London, UK, 2018. [Google Scholar]
  22. Kee, H.L.; Nicita, A. Trade Frauds, Trade Elasticities and Non-tariff Measures. In Proceedings of the 5th IMF-World Bank-WTO Trade Research Workshop, Washington, DC, USA, 30 November 2016. [Google Scholar]
  23. Hummels, D. Have International Transport. Costs Declined; Purdue University: West Lafayatte, IN, USA, 2000. [Google Scholar]
  24. Limao, N.; Venables, A.J. Infrastructure, geographical disadvantage, transport costs, and trade (English). World Bank Econ. Rev. 2001, 15, 451–479. [Google Scholar] [CrossRef]
  25. Wei, S.-J.; Wu, Y. Globalization and Inequality: Intra-China Evidence; IMF Research Department New York: New York, NY, USA, 2001. [Google Scholar]
  26. Redding, S.; Venables, A.J. Explaining Cross-Country Export Performance: International Linkages and Internal Geography; London School of Economics: London, UK, 2002. [Google Scholar]
  27. Wilson, J.S.; Mann, C.; Otsuki, T. Trade Facilitation and Economic Development; Policy Research Working Paper 2988; The World Bank: Washington, DC, USA, 2003. [Google Scholar]
  28. Anderson, M.; Banomyong, P. The implications of deregulation and liberalization on the logistics service industry in Lao PDR. Int. J. Prod. Econ. 2009, 128, 68–76. [Google Scholar] [CrossRef]
  29. Tongzon, J.L. Liberalisation of logistics services: The case of ASEAN. Int. J. Logist. Res. Appl. 2011, 14, 11–34. [Google Scholar] [CrossRef]
  30. Tongzon, J.; Cheong, I. The challenges of developing a competitive logistics sector in the era of regionalism: The case of ASEAN countries. Int. J. Logist. Res. Appl. 2013, 16, 1–16. [Google Scholar]
  31. Cheong, I.; Suthiwartnarueput, K. ASEAN’s initiatives for regional economic integration and the implications for maritime logistics reforms. Int. J. Logist. Manag. 2015, 26, 479–493. [Google Scholar] [CrossRef]
  32. Arvis, J.-F.; Ojala, L.; Wiederer, C.; Shepherd, B.; Anasuya, D.; Kiiski, T. Connecting to Compete 2018: Trade Logistics in the Global Economy; The World Bank: Washington, DC, USA, 2018. [Google Scholar]
  33. Carrère, C.; De Melo, J. Non-Tariff Measures: What Do We Know, What Might Be Done? J. Econ. Integr. 2011, 26, 169–196. [Google Scholar] [CrossRef] [Green Version]
  34. Beghin, J.C. (Ed.) Nontariff Measures and International Trade; World Scientific Studies in International Economics: Singapore, 2017; pp. 13–38. [Google Scholar]
  35. Ghodsi, M.; Julia, G.; Robert, S. Estimating Importer-Specific ad Valorem Equivalents of Non-Tariff Measures; Verein Wiener Institut für Internationale Wirtschaftsvergleiche: Vienna, Austria, 2016. [Google Scholar]
  36. McCallum, A.H.; Lincoln, W.F. The Rise of Exporting by U.S. Firms; FRB International Finance Discussion Paper No. 1157; FRB: Washington, DC, USA, 2016. [Google Scholar]
  37. Kee, H.L.; Nicita, A.; Olarreaga, M. Estimating Trade Restrictiveness Indices. Econ. J. 2009, 119, 172–199. [Google Scholar]
  38. Disdier, A.-C.; Marette, S. The Combination of Gravity and Welfare Approaches for Evaluating Non-Tariff Measures; CEPREMAP Working Papers (Docweb) 1004; CEPREMAP: Paris, France, 2010. [Google Scholar]
  39. Khouilid, M.; Echaoui, A. The impact of Non-Tariff Measures (NTMs) on Moroccan foreign trade: Comparison between developed and developing countries. Iosr J. Econ. Financ. 2017, 8, 48–57. [Google Scholar] [CrossRef]
  40. Arkolakis, C. Market Penetration Costs and the New Consumers Margin in International Trade. J. Polit. Econ. 2010, 118, 1151–1199. [Google Scholar] [CrossRef] [Green Version]
  41. Hummels, D.; Klenow, P.J. The variety and quality of a nation’s exports. Am. Econ. Rev. 2005, 95, 704–723. [Google Scholar] [CrossRef] [Green Version]
  42. Steingress, W. Specialization Patterns in International Trade; Banque de France Working Paper No. 542; Banque de France: Paris, France, 2015. [Google Scholar]
  43. Financial Times, US-China Trade War Prompts Rethink on Supply Chains. Available online: https://www.ft.com/content/03e4f016-aa9a-11e8-94bd-cba20d67390c (accessed on 20 December 2019).
  44. Supply Chain Digital. Turbulent Times in 2019: The Year of the Supply Chain. Available online: https://www.supplychaindigital.com/supply-chain-management/turbulent-times-2019-year-supply-chain (accessed on 23 December 2019).
  45. Inbound Logistics. Tariffs Sting U.S. Supply Chains. Available online: https://www.inboundlogistics.com/cms/article/tariffs-sting-us-supply-chains/ (accessed on 10 December 2019).
  46. Supply Chain Brain. Impact of the US-China Trade War on Global Supply Chains. Available online: https://www.supplychainbrain.com/articles/30554-impact-of-the-us-china-trade-war-on-global-supply-chains?v=preview (accessed on 5 December 2019).
  47. The Asian Banker. US-China Trade War Highlights Shifting Global Terrain for Financial Services. Available online: http://www.theasianbanker.com/updates-and-articles/us-china-trade-war-highlights-shifting-global-terrain-for-financial-services (accessed on 10 December 2019).
  48. Forbes. Beyond ‘Decoupling’: How China Will Reshape Global Trade in 2020. Available online: https://www.forbes.com/sites/siminamistreanu/2019/12/03/beyond-decoupling-how-china-will-reshape-global-trade-in-2020/#77973f0c65b7 (accessed on 5 December 2019).
  49. DHL. The Resilience360 Annual Risk Report; DHL: Bonn, Germany, 2018. [Google Scholar]
  50. Supply Chain Quarterly. The Top 10 Supply Chain Risks of 2019: Second Quarter; CSCMP: Massachusetts, MA, USA, 2019. [Google Scholar]
  51. Logistics Management. Ocean Carrier Trends: Containing Capacity while Remaining Poised for Growth. Available online: https://www.logisticsmgmt.com/article/ocean_carrier_trends_containing_capacity_while_remaining_poised_for_growth (accessed on 5 December 2019).
  52. Logistics Management. Lose-lose’ Trade War Threatens 1.5 Million Jobs, $186 Billion in Economic Activity, New Study Shows. Available online: https://www.logisticsmgmt.com/article/lose_lose_trade_war_threatens_1.5_million_jobs_186_billion_in_economic_acti (accessed on 1 December 2019).
  53. Ciuriak, D.; Xiao, J. Quantifying the Impacts of the US Section 232 Steel and Aluminum Tariffs; C.D. Howe Institute Working Paper; Howe Institute: Toronto, ON, Canada, 2018. [Google Scholar]
  54. Abiad, A.; Baris, K.; Bernabe, J.A.; Bertulfo, D.J.; Camingue, S.; Feliciano, P.N.; Mercer-Blackman, V. The Impact of Trade Conflict on Developing Asia; Asian Development Bank Economics Working Paper Series No. 566; ADB: Manila, Philippines, 2018. [Google Scholar]
  55. Carvalho, M.; Azevedo, A.; Massuquetti, A. Emerging Countries and the Effects of the Trade War between US and China. Economies 2019, 7, 45. [Google Scholar] [CrossRef] [Green Version]
  56. Bekkers, E.; Teh, R. Potential Economic Effects of a Global Trade Conflict: Projecting the Medium-Run Effects with the WTO Global Trade Model; WTO Staff Working Paper No. ERSD-2019–04; WTO: Geneva, Switzerland, 2019. [Google Scholar]
  57. Bown, C.P.; Kolb, M. Trump’s Trade War Timeline: An. Up-to-Date Guide; Peterson Institute for International Economics: Washington, DC, USA, 2019. [Google Scholar]
  58. Amiti, M.; Redding, S.; Weinstein, D. The Impact of the 2018 Trade War on US Prices and Welfare; CEPR Discussion Paper 13564; CEPR: London, UK, 2019. [Google Scholar]
  59. Felbermayr, G.; Steininger, M. Trump’s trade attack on China− who will have the last laugh? Cesifo Forum 2019, 20, 27–32. [Google Scholar]
  60. Bellora, C.; Fontagné, L. Trade Wars and Global Value Chains: Shooting Oneself in the Foot; VOX CEPR Policy Portal: London, UK, 2019. [Google Scholar]
  61. Foreign Policy. How Trump May Finally Kill the WTO; Graham Holdings Company: Washington, DC, USA, 2019. [Google Scholar]
  62. Lee, T.C.; Wu, C.H.; Lee, P.T.W. Impacts of the ECFA on seaborne trade volume and policy development for shipping and port industry in Taiwan. Marit. Policy Manag. 2011, 38, 1–21. [Google Scholar] [CrossRef]
  63. Cheong, I.; Cho, J. The impact of Korea’s FTA network on seaborne logistics. Marit. Policy Manag. 2013, 40, 146–160. [Google Scholar] [CrossRef]
  64. Bank of England. Available online: https://www.bankofengland.co.uk/monetary-policy-report/2019/november-2019/in-focus-trade-protectionism-and-the-global-outlook (accessed on 23 November 2019).
  65. Ianchovichina, E.; Walmsley, T.L. (Eds.) Dynamic Modeling and Applications for Global Economic Analysis; Cambridge University Press: New York, NY, USA, 2012. [Google Scholar]
  66. Hertel, T.W. Global Trade Analysis: Modeling and Applications; Cambridge University Press: New York, NY, USA, 1997. [Google Scholar]
  67. Zeihan, P. The Absent Superpower: The Shale Revolution and a World Without America; Zeihan on Geopolitics: Charlottesville, VA, USA, 2016. [Google Scholar]
  68. KITA. 2020 Trade Strategy; Korea International Trade Association: Seoul, Korea, 2019. [Google Scholar]
  69. Cadot, O.; Gourdon, J.; van Tongeren, F. Estimating Ad Valorem Equivalents of Non-Tariff Measures: Combining Price-Based and Quantity-Based Approaches; OECD Trade Policy Papers, No. 215; OECD Publishing: Paris, France, 2018. [Google Scholar]
  70. Crivelli, P.; Gröschl, J. The impact of sanitary and phytosanitary measures on market entry and trade flows. World Econ. 2016, 39, 444–473. [Google Scholar] [CrossRef] [Green Version]
  71. US News. Available online: https://www.usnews.com/news/economy/articles/2019-10-07/protectionism-trade-uncertainty-are-biggest-threat-to-economy-analysts-say (accessed on 20 November 2019).
Figure 1. The trend of cargo freight (Unit: US$).
Sustainability 12 01444 g001
Figure 2. Outline of the research.
Sustainability 12 01444 g002
Figure 3. The basic structure of the GTAP and the specification of dynamism. (a) Basic structure of the GTAP. Source: Modification of Hertel [66]; (b) The specification of dynamism in GTAP. Source: Cheong and Cho [63].
Sustainability 12 01444 g003
Figure 4. The trend of global average tariff rates and NTBs.
Sustainability 12 01444 g004
Figure 5. The trend of beef prices in Korea during 2000–2014.
Sustainability 12 01444 g005
Table 1. Summary of existing researches using trade-cargo-container conversion.
AuthorsMajor FindingsJournal Published
Lee, Wu and Lee [62]The Economic Cooperation Framework Agreement (ECFA) between China and Taiwan would induce a trade creation effect of more than US$ 30 billion between two parties, creating 0.49 million TEUs.Maritime Policy & Management 2011, 38, 1–21.
Cheong and Cho [63]The implementation of Korea’s major FTAs with US, EU, ASEAN and others would increase containerized cargoes by 0.79 million TEUs in the short run and 0.89 million TEUs in the long run.Maritime Policy and Management 2013, 40, 146–160.
Cheong and Suthiwartnarueput [31]Among ASEAN countries, Thailand was expected to collect the highest growth of seaborne containerized logistics (371,000 TEUs as of 2028) due to efficiency improvement in logistics.International Journal of Logistics Management 2015, 26, 479–493.
Table 2. Classification of industry and country/region.
No.Industry ClassificationGTAP Country/Region
1AgricultureThe US
2Food, Beverages and tobaccoChina
3Textiles and apparel, leatherEU
4Petrochem., chemical productDeveloped countriesAll OECD countries except the US and EU
High income countries
5Iron and steel, metal
6Transportation and parts
7Electrical goodsDeveloping countriesAll remaining countries
8Machinery, metal products
9Other manufacturing
10Services
Table 3. Conversion Coefficients from Trade Volume to Cargo and TEUs.
Weight per Million Dollars ($)Port Transportation Ratio (%) Containerization Ratio (%)
Agriculture28198356
Processed food, Beverages and tobacco3719663
Textiles and apparel, leather989487
Petrochemicals15715848
Iron and steel, non-ferrous metal8726761
Transportation and parts1316968
Electrical goods4686360
Machinery, metal products1415747
Other manufacturing5947259
Total average7857361
Source: Based on the modification of Cheong and Suthiwartnarueput [31].
Table 4. Summary of the tariff war between the US and China.
US’s Tariffs on China’s ExportsChina’s Tariffs on US’ Exports
Date of raising tariffs2018.72018.82019.62019.92018.72018.82019.62019.9
Amount ($ billion)341620011534166075 1
Accumulation ($ billion)34502503653450110
Share of exports (%) 26.729.8849.4172.1327.6440.6589.43
Tariff rates2525251525255~255~10
Major items under high tariffsIndustrial goods, food, othersConsumer goods, car partsAgriculture, othersIndustrial, consumer goods
Notes: 1 China’s Ministry of Commerce announced additional tariffs of 5% or 10% covering a total of 5,078 items from the US, but no details were presented. China suspended this after the conclusion of phase I. 2 Share of the US’s exports to China out of US’ total exports to China. Source: Assembled from various sources such as the USTR and China’s Ministry of Commerce.
Table 5. Scenarios for tariffs and TEs of NTBs.
ScenarioTariffs for US and ChinaTEs for Other CountriesNote
110%10%Optimistic scenario
220%15%Baseline scenario
330%20%Pessimistic scenario
Table 6. Impact of global protectionism (summary).
Change in Trade VolumeCargo WeightsPort CargoNon-Container CargoContainer Cargo
WeightsTEU
Unitmillion $1000 tons1000 tons1000 tons1000 tons1000 TEU
Scenario 1−7,256,896 −6,168,140 −3,950,485 −1,829,943 −2,120,542 −152,887
Scenario 2−10,220,218 −8,655,309 −5,537,248 −2,565,407 −2,971,841 −214,264
Scenario 3−12,774,384 −10,800,260 −6,902,482 −3,199,116 −3,703,366 −267,005
Table 7. Impact of global protectionism (Scenario 1).
Cargo WeightsPort CargoNon-Container CargoContainer Cargo
WeightsTEU
Unit1000 tons1000 tons1000 tons1000 tons1000 TEU
Agriculture−619,024 −513,790 −226,067 −287,722 −20,744
Food, Beverages and tobacco−147,778 −141,867 −52,491 −89,376 −6444
Textiles and apparel, leather−40,138 −37,730 −4905 −32,825 −2367
Petrochem., chemical prod−3,536,594 −2,051,225 −1,066,637 −984,588 −70,987
Iron and steel, metal−761,343 −510,100 −198,939 −311,161 −22,434
Transportation and parts−99,917 −68,943 −22,062 −46,881 −3380
Electrical goods−604,327 −380,726 −152,290 −228,436 −16,470
Machinery, metal products−82,590 −47,076 −24,950 −22,126 −1595
Other manufacturing−276,429 −199,029 −81,602 −117,427 −8466
Total−6,168,140 −3,950,485 −1,829,943 −2,120,542 −152,887
Table 8. Impact of global protectionism (Scenario 2).
Cargo WeightsPort CargoNon-Container CargoContainer Cargo
WeightsTEU
Unit1000 tons1000 tons1000 tons1000 tons1000 TEU
Agriculture−844,603 −701,021 −308,449 −392,572 −28,304
Food, Beverages and tobacco−205,835 −197,602 −73,113 −124,489 −8975
Textiles and apparel, leather−56,204 −52,832 −6868 −45,964 −3314
Petrochem., chemical prod−4,974,717 −2,885,336 −1,500,375 −1,384,961 −99,853
Iron and steel, metal−1,066,558 −714,594 −278,692 −435,902 −31,428
Transportation and parts−141,852 −97,878 −31,321 −66,557 −4799
Electrical goods−863,897 −544,255 −217,702 −326,553 −23,544
Machinery, metal products−116,346 −66,317 −35,148 −31,169 −2247
Other manufacturing−385,296 −277,413 −113,739 −163,674 −11,801
Total−8,655,309 −5,537,248 −2,565,407 −2,971,841 −214,264
Table 9. Impact of global protectionism (Scenario 3).
Cargo WeightsPort CargoNon-Container CargoContainer Cargo
WeightsTEU
Unit1000 tons1000 tons1000 tons1000 tons1000 TEU
Agriculture−1,028,664 −853,792 −375,668 −478,123 −34,472
Food, Beverages and tobacco−255,582 −245,359 −90,783 −154,576 −11,145
Textiles and apparel, leather−70,045 −65,843 −8560 −57,283 −4130
Petrochem., chemical prod−6,230,682 −3,613,795 −1,879,174 −1,734,622 −125,063
Iron and steel, metal−1,327,045 −889,120 −346,757 −542,363 −39,103
Transportation and parts−178,385 −123,086 −39,387 −83,698 −6034
Electrical goods−1,087,110 −684,879 −273,952 −410,928 −29,627
Machinery, metal products−145,124 −82,721 −43,842 −38,879 −2803
Other manufacturing−477,623 −343,888 −140,994 −202,894 −14,628
Total−10,800,260 −6,902,482 −3,199,116 −3,703,366 −267,005

