Article

Effects of Strategy Characteristics for Sustainable Competitive Advantage in Sharing Economy Businesses on Creating Shared Value and Performance

1
School of Business Administration, Chung-Ang University, 84 Heukseok-ro, Dongjak-gu, Seoul 06974, Korea
2
Department of Art & Culture Research Institute, Chung-Ang University, 84 Heukseok-ro, Dongjak-gu, Seoul 06974, Korea
*
Author to whom correspondence should be addressed.
Sustainability 2020, 12(4), 1397; https://doi.org/10.3390/su12041397
Submission received: 13 January 2020 / Revised: 6 February 2020 / Accepted: 11 February 2020 / Published: 13 February 2020
(This article belongs to the Section Economic and Business Aspects of Sustainability)

Abstract

:
This study aimed to identify strategy characteristics for sustainable competitive advantage in businesses utilizing the sharing economy (SE) and to investigate whether such strategy characteristics are related to creating shared value (CSV) and performance. A total of 631 participants who had used goods and services of SE businesses were selected as the unit of analysis in reference to the components of business-to-peer (B2P) and peer-to-peer (P2P) SE business models. Reliability, validity, and goodness-of-fit tests and path analysis were performed using SPSS and AMOS statistical packages. The following results were obtained. First, regarding the relationship between strategy characteristics for sustainable competitive advantage and “social congruence,” which is related to creating shared value, this variable was significantly influenced by “value network” in the B2P model and “strategic innovation” and “strategic resources” in the P2P model. Second, regarding relationship with the aforementioned strategy characteristics and “value of information sharing,” the latter variable was significantly influenced by “moment of truth,” “strategic innovation,” and “value network” in the B2P model, and “moment of truth,” “strategic resources,” and “value network” in the P2P model. Third, regarding the relationship among variables related to CSV and their contribution to performance, “social value congruence” was affected by “value of information sharing,” and these variables had significant effects on “value of participation” in both models. Only “value of participation” made a significant contribution to “performance.”

1. Introduction

A sharing economy (SE) is an economic system based on collaborative consumption in which goods, when produced, are shared by different parties [1,2]. SE is also considered to have an instrumental value when contributing to the development of large communities in the social space [3]. That is, the core concept of SE is consumer culture that embraces and produces community values to be shared by many people beyond individual ownership. Under this SE framework, consumers are motivated to share their own resources with others to promote a virtuous circle for utilizing resources, reproducing value, and to resolve social issues, in favor of alternative consumption that is voluntary and rational.
In particular, as the formation of digital culture capital eventually expands the SE framework and increases the number of consumers participating in collaborative consumption, SE companies create new business models to strategically compete against their peers [4]. In addition, the variety of shared resources and business models are becoming more diverse in response to the demand in the information and communication era beyond tangible goods, services, and labor force to include data, information and knowledge, ideas, and digital content. Under such conditions, the establishment of cultural settings and movement towards social benefits and welfare infrastructure through SE requires a better understanding of the market and patterns of consumer behavior, which can be obtained through an empirical investigation of the characteristics of consumers participating in collaborative consumption and other variables [5].
Furthermore, today’s corporations share the importance of customer value management, through which they have to create differentiated customer value and to deliver it efficiently to their customers, thereby gaining competitive advantage beyond improved customer satisfaction. To achieve competitive advantage and set the directions of associated activities, these companies need to establish strategies, and once established, the strategies serve as decision-making processes required to realize goals in a specific environment and contribute to business performance when harmoniously incorporated into company characteristics [6]. Thus, corporate strategic management refers to the process of establishing and implementing strategies for competitive survival with the ultimate goal of maintaining a competitive advantage.
Specifically, the core competence of companies lies in the development of competitive internal capabilities through an organic integration of value chain activities in a way that is different from that of competitors. Therefore, the role of platforms, a core element of value chains, is increasingly expanding [7]. Similarly, consumers are motivated to be conscious of the impact of their personal consumption through social responsibility and community-oriented perspectives, separate from the economic role they have on corporations as buyer and user of goods. In this context, companies and consumers can cooperate with each other to reflect the latter’s preference in product development and eventually co-create value. As a result, the former can gain a competitive advantage from consumer value products and improve their performance [8]. Thus, creating shared value (CSV) is characterized by the process of seeking ways to boost revenue and profitability through social contribution activities and aligning attention to and resolution of social issues with corporate activities [9].
Furthermore, CSV is intended to promote a win-win situation as performance sharing and competitiveness increase through the creation of value throughout the entire management process, including production, distribution, and marketing for both companies and communities. It is considered a sustainable management activity involved in identifying beneficiary needs, sharing value, and consequently contributing to companies’ core competence and continuous growth [10]. Another study claimed that value co-created in SE businesses is based on autonomy and efficiency of a new production method described as social sharing, which takes place in a more dispersed and relaxed social environment than conventional communities [11,12].
In the context of the importance of social value and the relative importance of participants who can have direct effects on the business in relation to the operation and evaluation factors of the sharing economy business, in addition to the importance of social resources taking into account the efficiency and effectiveness of social objectives, social ownership, and social capital, there is a need to increase sustainability through a network formed by cooperation and interaction between various stakeholders.
However, the previous studies on the business of sharing economy, in general, have only the factors that influence the evaluation of companies, and they have limitations that cannot suggest various methods in explaining the CSV of consumers. In this study, the competition from a competitive business that creates better-shared value for consumers by providing the integrated economic business strategy characteristics and shared value service elements by providing the integrated economic business strategy characteristics beyond the initial research that mentioned only the value and potential of services. It can be treated as an academic and social methodology for developing a superior strategic model. In particular, the paradigm of the social value of the sharing economy business can be expressed in the form of shared creation branding based on the basic value of the social contribution. CSV, which combines these economic values with social values for the public interest, can be understood as a concept of a sustainable business model [9].
In this way, environmental consumption factors, social relations factors, and service resources and innovative factors in terms of competitive advantage strategy of sharing economy business must be expressed in consumer behavior in order to be connected to a long-term relationship with consumers. Further, consumers need to act as a mechanism for behavioral change through the process of strategic value creation with respect to CSV.
Taken together, this study aimed to identify strategy characteristics implemented by SE businesses to secure sustainable competitive advantage and to investigate the impacts of such strategy characteristics on creating shared value (social value congruence, the value of information sharing, and value of participation), and performance.

2. Theoretical Background and Hypotheses

2.1. SE and Collaborative Consumption

The current optimistic prospects for SE growth stem from the core value that SE ultimately delivers to consumers. SE is clearly distinguished from the traditional economic mechanism involving consumer behaviors, particularly repeat purchases and possession, which are consistently performed in an effort to satisfy self-desire and necessity. According to Kim and Kim [2], the basic principle of SE is to pursue value and benefits of utility rather than ownership. Rifkin [13] asserted that SE develops in the form of networked commons rather than a market as it requires more social trust and capital than market forces that existed prior to the advent of SE.
Aigrain [14] claimed that, when compared with traditional economic activities, SE (where a greater number of social entities are involved through resource sharing) is more efficient and cost-effective given the ability to satisfy the needs of many consumers simultaneously, when compared with traditional economic activities. That is, SE can be denoted as collaborative consumption or community economy. The former is described as behavioral intention for consumers because it utilizes unused resources efficiently, facilitating new product development and reducing raw material use [5]. SE-based collaborative consumption, as a new form of consumption, makes an important contribution to improving economic efficiency [15]. Hence, collaborative consumption sites and social media communities continuously increase, expanding the boundaries of business-to-peer (B2P) and business to business (B2B) models of SE framework beyond individual sharing and collaboration of peer-to-peer (P2P) model [16]. At the time when SE models enter the growth stage, developing SE business models suitable to Korean consumers and market environment is considered a meaningful venture.

2.2. Strategy Characteristics for Sustainable Competitive Advantage and Value Creation

In today’s market, competition is intensified amid consistently changing customer desire. To actively adapt to the rapidly changing business environment, the efforts to maintain and improve operational performance through continuous innovation are necessary [17]. Business performance is said to vary depending on how management tactics regarding competitive advantage are designed and executed [18]. More importantly, the understanding of corporations pursuing fundamental innovation to achieve an advantage in an intensively competitive environment is a prerequisite factor for businesses [19,20]. In this paper, we identified the sustainable competitive advantage of SE-based services with business perspectives.
First, given that the success of business models partly depends on how product marketing strategies are implemented [21,22], the alignment of minimally required constituent factors is necessary to make the entire business understood. When business models were applied to strategic management in previous studies, they served as key explanatory factors of value creation and achievement of performance goals with the focus on identifying various consumer activities associated with the two components [23]. Similarly, Afuah and Tucci [19] defined the components of their strategic business models as target customers, customer value, price setting, revenue sources, connected activities, execution, business capabilities, and sustainability, while Magretta [24] suggested target customers, value proposition, delivery method, and revenue generation techniques. Johnson et al. [25] stated customer value (target customers, customer needs, value propositions, profit formula, revenue model, cost structure, margin model, and resource deployment), core competence (human resources, technology, facility, information, channels, partnership, and brand), and processes (business, principles, and norms). Chesbrough and Rosenbloom [26] classified model components into six factors of value proposition, target market, value chain, revenue potential, value network, and competitive strategies. Zott and Amit [22,23] addressed how to establish transaction relationships with the company itself, partners, and customers in a strategic value chain and the importance of structural templates to describe such a method. These early studies, when connecting business models with revenue generation in a strategic context, suggested that business models for customers among stakeholders are closely connected with considerable complexity without a linear relationship. Moreover, it has been emphasized that the model components are not constructed through a single decision regarding strategy implementation, but rather built through structural and continuous activities [27]. In fact, the effectiveness of business models is increasingly achieved through novelty-centered models aiming at customer value, indicating a departure from efficiency-centered model designs aiming at cost reduction [22,23].
Thus, SE businesses ultimately strive to secure a competitive advantage because it allows them to create greater value than their competitors. In light of this, we identified SE businesses’ strategy characteristics as “moment of truth,” “strategic innovation,” “strategic resources,” and “value network.” First, from “moment of truth” viewpoint, a path to service interaction is effective for tacit knowledge sharing [28]. In particular, moment of truth service, as a dynamic mutual interaction between service provider and customer, is at the center of service marketing strategy and is recognized as an important factor determining service differentiation, quality control, and customer satisfaction. Duncan and Majority [29] determined the need for maximizing interaction between companies and consumers through a moment of truth strategy to enable value co-creation with consumers for specific corporate activities. Jung and Lee [30] stated that such strategy is able to turn human resources into strategic assets because it allows companies to both improve the value of their internal resources and gain a competitive advantage.
Second, in terms of strategic innovation, strategy implementation represents the distribution/redistribution of all company resources, whether tangible or intangible [31]. Hence, strategic innovation is distinguished from a dominant strategy or the rules of the game in industry, and constitutes a new strategy capable of creating higher value [32]. The importance of innovation is evident when it comes to competitive advantage aimed at marketing innovation, showing a positive correlation between the degree of innovation and operational performance [33]. In addition, Marinova [34] reported the importance of changing or sharing knowledge as part of the effort to achieve innovation, given that knowledge, itself, may be less useful.
Third, strategic resources are defined as resources that are strategically important to gain a competitive advantage, while sustainable competitive advantage within a company is determined by internal resources and its competitive position within the respective industry [35]. In relation to that claim, Lee and Suh [36] based on the resource-based view theory of strategic management stated that valuable and rare resources and competence, when both are well combined and utilized, can facilitate the establishment of competitive advantage. Furthermore, in the case that the combination of resources and competence is inimitable and non-substitutable, the established competitive advantage can be maintained and exert a positive effect on corporate performance. In addition, the uniqueness, synergy, and dynamics of resources in companies can boost sustainable competitive advantage, leading to performance improvements. Non-resource variables, such as marketing strategies, product development, and product reliability also have significant effects on corporate performance [37]. Managers should select measured values to provide appropriate information on potential strategic resources and critical success factors, and when those fundamental factors are properly maintained and measured, corporate performance can be positively affected [38]. Their findings underscore that resources, when utilized effectively, can create a competitive advantage and consequently improve corporate performance, although their retention is important.
Fourth, in terms of the value network, consumers are the most important source of supply to companies in the digital environment, and they can be actively invited to join in value co-creation [39]. The role of consumers is no longer limited to adopting value offered by companies because consumers can actively engage in all production activities as partners and co-create “value” through interaction with companies [8]. For young consumers, widespread Internet-based platforms have promoted their social connections. Currently, the effects of their word-of-mouth communication as consumers are so overwhelming that there is a need to construct consumer value networks [40]. The level of customer value network activities will be determined by how well companies meet customer needs. Based on the abovementioned, we established Hypothesis 1 and 2 as follows:
Hypothesis 1 (H1).
Strategy characteristics for sustainable competitive advantage in SE businesses will have positive effects on social value congruence.
Hypothesis 2 (H2).
Strategy characteristics for sustainable competitive advantage in SE businesses will have positive effects on the value of information sharing.

2.3. CSV and Performance

Although it is a comprehensive concept, SE can be understood in the context of CSV. This CSV represents core activities of companies and consumers to create value and build mutual consensus, and it is also defined as a collaborative system established among stakeholders in the value chain for value co-creation [41]. Thus, CSV is described as a crucial element of sustainable corporate management with the aim of strengthening win-win situations, performance sharing, and competitiveness of stakeholders by co-creating value for both companies and communities throughout the entire process, including production, distribution, and marketing [42]. As it is possible for companies to sustain their growth through CSV, all value chain activities for goods and services are linked to business goals and contribute to market development and sustainability. In line with these changes in the business environment, according to some researchers, the company goals also need to focus on shared value creation [9]. In this paper, we identified the core factors of CSV as social value congruence, the value of information sharing, and value of participation.
First, according to the initial theory of self-image and product image concerning social value congruence, product attributes, including images generally activate a self-schema involving the same images [43]. The consumers who display a greater level of congruence between self-image and service (goods) image are said to be more motivated to spend money and purchase products [44]. Furthermore, consumers who consider the congruence between self-image and brands or products as self-congruence tend to prefer brands that are congruent to their own images and personality [44]. Zhang and Bloemer [45] stated that value congruence plays an important role in relation to key components of relationship marketing (customer satisfaction, trust, affectional devotion, and preference), while it also has an impact on the service sector. The congruence between corporate image and consumer’s self-image can become an important variable of customer satisfaction and loyalty toward companies. In the case of SE, the effects of the congruence between social value image and consumer’s self-image may be worth exploring given the differences in images and symbolism of SE businesses compared with traditional counterparts.
Second, in terms of the value of information sharing, the evolving value network enables collaborative consumption on the basis of SE and expands platforms for information exchange or social connection network in the virtual space [2]. With the ultimate goal of yielding output, knowledge sharing leads to the ability to resolve both potential problems and increase productivity, making it an important factor for improving strategic effectiveness [46]. Knowledge sharing is also useful in enhancing quality and preservation of knowledge owned by organizations by allowing the integration of heterogeneous information developed at the individual level and the utilization and storage of such information among members of the organizations [47]. On the other hand, organizations encourage sharing of tacit knowledge obtained at an individual level with support and rewards.
Knowledge sharing promotes the sharing of explicit knowledge owned by individuals with their peers to boost knowledge of members as a whole and to introduce new information. That is, the sharing of explicit knowledge can also contribute to organizational performance by improving members’ competence [48]. Lee [49] stated that knowledge sharing activities were affected by interpersonal relationships, knowledge process, and knowledge management strategies, and that sharing organizational members’ activities showed a positive correlation with customer loyalty and the ability to attract new customers. According to Yun et al. [50], knowledge transfer that occurs through interaction between buyers and suppliers helps companies resolve issues and improve performance, suggesting a positive impact of knowledge transfer on corporate performance.
Third, in terms of the value of participation, service-dominant logic (SDL) suggests that value is not derived from product exchange, but rather from use of products (value-in-use) [51]. In SDL, customers play a central role, and the value of services created through the interaction between service providers and customers is prioritized, and the participation of those who regard customers as co-creation partners is encouraged [52]. This theory indicates the value created through the interaction process rather than anything exclusive from in service offerings [53].
Similarly, customer engagement is demonstrated as a simultaneousness between production and consumption, which arises due to the intangible nature of services [54]. As a prerequisite for successful value co-creation, it indicates in-role behaviors of customers [55]. According to Yoon [56], customer engagement is essential for service offering and distribution, and a shift in thinking is necessary to admit that improvement in customer perceptions and attitudes elevates customer value of services. This type of customer engagement is closely related to value co-creation in service settings. In addition, Shaw et al. [57] reported that special customer co-creation based on experience included customer participation and a connection that links the customer to experience, and that value co-creation and customer engagement behaviors have emerged as important research topics in marketing and service areas. Koo and Rha [8] claimed that the validity of consumer participation in service businesses because consumers’ direct participation in service delivery increases companies’ productivity. Song and Yoo [58] reported that value fit between individuals and organizations has a positive impact on organizational devotion and contextual performance. We established Hypothesis 3, 4, 5, and 6 as follows:
Hypothesis 3 (H3).
Social value congruence in SE businesses will have positive effects on the value of information sharing.
Hypothesis 4 (H4).
Social value congruence in SE businesses will have positive effects on the value of participation.
Hypothesis 5 (H5).
Value of information sharing in SE businesses will have positive effects on the value of participation.
Hypothesis 6 (H6).
Value of participation in SE businesses will have positive effects on performance.

3. Research Method and Procedure

3.1. Research Model

Based on the discussion of the research hypotheses in the previous sections, we present the following research model in Figure 1.

3.2. Measurement Tools

The instrument used in this study consisted of a series of questions regarding strategy characteristics for sustainable competitive advantage in SE businesses, creating shared value factors (social value congruence, the value of information sharing, and value of participation), performance, and demographic characteristics. Following previous studies of Afuah and Tucci [19], De Luca and Atuahene-Ginma [33], Duncan and Majority [29], Jung and Lee [30], Kalaignanam and Varadarajan [39], Lee and Suh [36], Kwon and Lim [17], Marinova [34], Koo and Rha [8], Morris et al. [23], and Zott and Amit [21,22], strategy characteristics for sustainable competitive advantage were further divided into “moment of truth,” “strategic innovation,” “strategic resources,” and “value network” as strategic means of establishing sustainable competitive advantage, leading to a total of 12 questions. Following previous studies of Choi et al. [41], Etgar [53], Lawson et al. [48], Lee and Park [43], Oyemomi et al. [47], Shaw et al. [57], Vargo and Lusch [51], Yi et al. [55], Yoon [56], Yun et al. [50], and Zhang and Bloemer [45], factors of creating shared value included social value congruence, the value of information sharing, and value of participation to reflect the mutually dependent relationship between SE businesses and consumers and creative value creation, resulting in a total of nine questions. Based on previous studies of Choi and Lee [16], Harvey et al. [15], Kim et al. [7], Kloninger [31], Porter and Kramer [9], Son and Kim [12], Tussyadiah [5], and Veliyath and Fitzgerald [6], three questions were used for performance, which was defined as consumers’ degree of expectation as to sustainable service in SE business is achieved, attaining the desired level of corporate accomplishments.

3.3. Data Collection and Analysis

A questionnaire was used as an instrument for data collection, and a 5-point Likert scale was used to assess each item in the questionnaire. The relevance of the survey instrument was verified as follows. A preliminary study was conducted with internal experts in local SE businesses, and we created a market orientation scale of SE businesses using the Delphi technique. For the main survey, those who had used goods and services of SE businesses were selected as the unit of analysis, a questionnaire survey with open-ended questions was conducted to collect data on their real experiences in value relationships within the components of the B2P and P2P SE business models. Critical incident technique (CIT) analysis was performed to analyze collected data and to derive specific information regarding sustainable competitive advantage and performance. After conducting the assessment of the survey instrument, we carried out the questionnaire survey, which was divided into a preliminary study and main survey, using a convenience sampling technique to collect reliable and valid data on participants who had experienced goods and services (campaign) offered by SE businesses at each stage of their operation. In particular, since this study has to understand the strategy characteristics of competitive advantage, CSV behaviors, and performance pattern through empirical studies of consumers who participate in cooperative consumption of sharing economy business, the data collection was carefully administered in two different stages by applying the questionnaire method. Moreover, this study focused on proactive market orientation of sharing economy business activities, and tried to identify potential needs of consumers through a close relationship with innovative consumers.
In June 2018, after a series of consultations and reviews with relevant experts, we defined appropriate survey questions and conducted a preliminary study in July 2018. Based on the results of the preliminary study, the items in the questionnaire were revised and clarified. The main survey was conducted from 16 August to 5 October 2018 with a convenience sample of people who had used services offered by SE businesses at least once. While the survey population includes mainly college students and working people, data were collected via an external survey company, online SE communities (message board), and emails, which were sent out after obtaining the consent of recipients. A total of 640 completed questionnaires were collected, and 631 of them were used for analysis after excluding those containing missing values. Reliability, validity and goodness-of-fit tests, and path analysis were performed using SPSS 23.0 and AMOS 23.0 statistical software.

3.4. Evaluation of Common Method Bias

Common method bias may have occurred because all the variables were measured using the same respondents, since this study was conducted using the self-report survey method. The common method bias can also be caused by the convenience of the measurement method used (such as surveys) or the measurement situation rather than the respondents [59,60]. Controls for avoiding the common method bias include the preliminary method (research design/survey composition) and posterior method (statistical analysis) [61]. To minimize the recall cues and coherence motivation used by the respondents in the research design stage, we separated the survey into the first and second stages. The first-stage survey was conducted with questionnaire items excluding the dependent variable(s), and the second-stage survey was conducted with time lag using the questionnaire items regarding dependent variables. During the survey development stage, we verified the items’ simplicity, objectivity, and clarity by considering the opinions of experts from SE business companies. We also conducted a preliminary survey on the sample to enrich its relevance and specificity.
We also conducted a non-rotation factor analysis using the principal component method. A single factor test showed that the variance among the factors with the largest explanatory power among the items with eigenvalues greater than 1.000 was 24.79%. Therefore, the common method bias was not a problem in this study [62]. The results of a confirmatory factor analysis supported the construct validity of all the study’s estimation variables.

4. Results

4.1. Demographic Characteristics of Research Subjects

The demographic characteristics of the study sample are presented in Table 1.

4.2. Reliability and Validity Tests

Prior to the assessment of measurement models, the reliability of each construct in the models was reviewed by calculating internal consistency (Cronbach’s α). First, factor analysis was performed for 12 items regarding strategy characteristics for sustainable competitive advantage using a Varimax rotation. As shown in Table 2, the results revealed four factors with an eigenvalue ≥1.000: “moment of truth” (three items), “strategic innovation” (three items), “strategic resources” (three items), and “value network” (three items). These factors explained 71.033% of variances, and the Cronbach’s α was 0.735 or higher, showing high reliability. The factor analysis of nine items regarding creating shared value yielded three factors with an eigenvalue ≥1.000: “social value congruence” (three items), “value of information sharing” (three items), and “value of participation” (three items) was shown in Table 3. These factors explained 68.474% of variances, and the Cronbach’s α was 0.702 or higher, showing high reliability. The dimensionality of performance-related variables in SE businesses was verified, as shown in Table 4. The values of factor loading of a single factor were all above 0.815. The Cronbach’s α coefficients was above 0.778, showing high reliability.

4.3. Confirmatory Factor Analysis

The results of the confirmatory factor analysis are presented in Table 5. Non-standardized coefficient, standardized coefficient, standard error (S.E.), critical ratio (C.R.), construct reliability, and average variance extraction (AVE) values were computed, and the resulting standardized coefficient was 0.6 or higher, supporting construct validity. The AVE value of every variable was 0.5 or higher, supporting convergent validity. Construct reliability of every variable was 0.7 or higher, supporting internal consistency and convergent validity.

4.4. Discriminant Validity Analysis

In this paper, discriminant validity test was performed by assessing whether or not each estimate of correlation coefficients between the constructs contains the value of 1.000. Most correlation coefficients were less than 1.000 (p < 0.05, p < 0.01, p < 0.001), showing statistically significant levels, rejecting the hypothesis that the constructs are correlated (φ = 1.0) and supporting discriminant validity (Table 6).

4.5. Path Analysis and Hypothesis Testing

4.5.1. Goodness-of-fit of Path Analysis Models

The goodness-of-fit and parameters of path analysis models were estimated using the maximum likelihood method. The B2P and P2P SE businesses models showed satisfactory fit, explaining the relationships between constructs within these proposed models. (see Table 7).

4.5.2. Hypothesis Testing on B2P SE Business Model

Figure 2 and Table 8 present the results of structural model-based hypothesis testing performed for the relationships among strategy characteristics for sustainable competitive advantage, creating shared value, and performance in the B2P SE business model.
The results of the B2P model analysis revealed the following results. First, in the path analysis of relationships between strategy characteristics for sustainable competitive advantage in SE businesses and social congruence, “value network” had significant effects on “social value congruence” (β = 0.342, CR = 4.483, p = 0.000). However, “moment of truth,” “strategic innovation,” and “strategic resources” showed no significant effects on “social value congruence” (β = 0.066, CR = 0.806, p = 0.421, β = 0.032, CR = 0.445, p = 0.657, and β = 0.113, CR = 1.229, p = 0.220, respectively). Second, in the analysis of the relationships between the aforementioned strategy characteristics and “value of information sharing,” “moment of truth,” and “strategic innovation,” “value network” had significant effects on “value of information sharing” (β = 0.178, CR = 2.256, p = 0.025, β = 0.191, CR = 2.745, p = 0.006, and β = 0.285, CR = 3.890, p = 0.000, respectively). However, “strategic resources” had no significant effects on “value of information sharing” (β = 0.109, CR = 1.231, p = 0.219) Third, in the analysis of the relationships among variables related to creating shared value (social value congruence, the value of information sharing, and value of participation) and their contribution to performance, “social value congruence” exerted significant effects on “value of information sharing” (β = 0.377, CR = 7.157, p = 0.000) and “value of participation” (β = 0.540, CR = 11.717, p = 0.000), while “value of information sharing” had significant effects on “value of participation” (β = 0.230, CR = 4.999, p = 0.000), which in turn significantly contributed to “performance” (β = 0.370, CR = 6.997, p = 0.000).

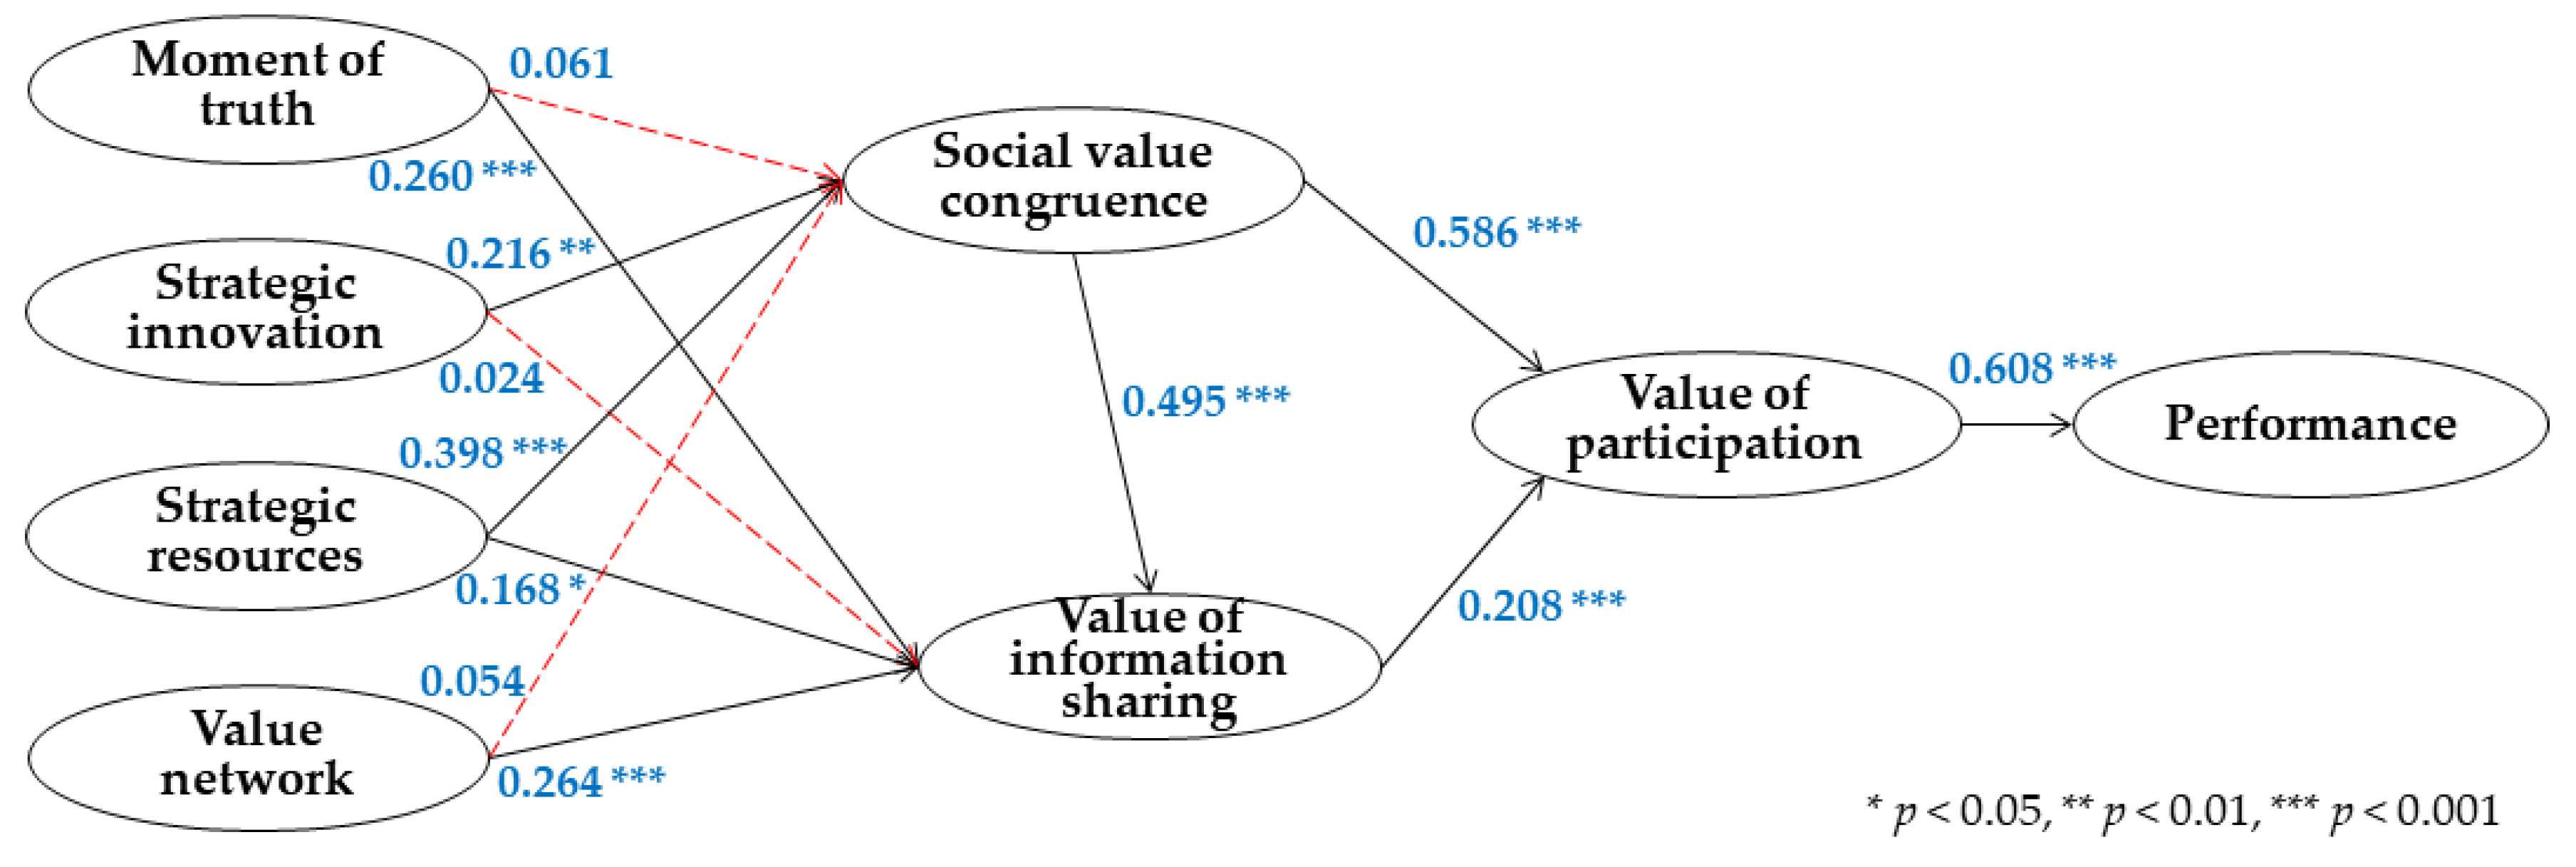
4.5.3. Hypothesis Testing on P2P SE Business Model

Figure 3 and Table 9 present the results of structural model-based hypothesis testing performed for the relationships of strategy characteristics for sustainable competitive advantage, creating shared value, and performance in the P2P SE business model.
The results of the P2P model analysis revealed the following results: First, among strategy characteristics of SE businesses, “strategic innovation” and “strategic resources” exhibited significant effects on “social value congruence” (β = 0.216, CR = 3.355, p = 0.001 and β = 0.398, CR = 5.729, p = 0.000). However, “moment of truth” and “value network,” had no effect on “social value congruence” (β = 0.061, CR = 0.824, p = 0.410 and β = 0.054, CR = 0.774, p = 0.439, respectively). Second, in terms of the relationships between SE businesses’ strategy characteristics and “value of information sharing,” “moment of truth,” “strategic resources,” and “value network” had significant effects on “value of information sharing” ([β = 0.260, CR = 3.586, p= 0.000], [β = 0.168, CR = 2.462, p = 0.014], and [β = 0.264, CR = 3.846, p = 0.000], respectively). However, “strategic innovation” had no significant effect on “value of information sharing” (β = 0.024, CR = 0.389, p = 0.698). Third, with respect to the relationships among variables related to creating shared value and their contribution to performance, “social value congruence” exhibited significant effects on “value of information sharing” (β = 0.495, CR = 10.146, p = 0.000) and “value of participation” (β = 0.586, CR = 12.927, p = 0.000), while “value of information sharing” exerted significant effects on “value of participation” (β = 0.208, CR = 4.593, p = 0.000), which in turn significantly contributed to “performance” (β = 0.608, CR = 13.651, p = 0.000).

4.5.4. Summary Results of Hypothesis Testing

Table 10 shows the results of hypothesis testing for both the B2P model and P2P model. The summary results show the differences in the outcome of causal relationships between the relevant research variables, differentiating the models used in the study.

4.6. Discussion of Research Findings

When the results of this study are analyzed in comparison with earlier studies, the following points can be articulated. First, the significant effect of “value network” on “social value congruence” in the BP2 model is supported by previous findings: (1) Customer co-creation of value for products in collaboration with corporations is required to reflect consumer preference on goods [8]; (2) continuous behavioral elements may lead to the formation of favorable feelings or attachment to a specific object in a consistent manner [63]. In the P2P model, “strategic innovation” and “strategic resources” showed the same positive effects on “social congruence”. This result can be interpreted similarly, with the view that the maintenance of better efficiency and effectiveness in producing goods and services than that of its competitors is crucial to sustaining competitive advantage in industry [64], and that corporate value is created through the various business contents and strategically systematic processes [65]. The aforementioned results are also supported by another study that claims that the competitive advantage, once established, should be maintained with a firm’s own value congruence for a substantial period of time to turn the edge into corporate competitiveness [66].
Second, in the relationship between the aforementioned strategy characteristics and “value of information sharing,” “moment of truth” and “value network” exhibited significant effects on “value of information sharing” in both the B2P and P2P models. This result can be interpreted similarly to previous findings that greater positive experience at moments of truth results in higher customer satisfaction [67], and that knowledge sharing activities are influenced by work competence, interpersonal relationship, knowledge process, and knowledge management strategies, and a greater customer loyalty and ability to attract new customers lead to a higher level of knowledge sharing among organizational members [49]. In the B2P model, “strategic innovation” significantly affected “value of information sharing,” supporting previous findings that strategic innovation of marketing activities, aimed at establishing competitive advantage, such as customer value proposition, brand construction, communication, distribution, etc., poses important variables for implementation of such strategies [68]; knowledge itself, which is not effective, should, therefore, be altered or shared to boost strategic innovation [34]. In the P2P model, “strategic resources” significantly affected “value of information sharing.” This result is consistent with the views that strategic assets are important because the rise in internal assets can contribute to competitive advantage [30], and that sustainable competitive advantage is associated with strategic resources and the ability to allocate authority required to integrate technologies and product knowledge within a company and to promptly respond to surrounding changes at lower levels [36].
Third, the relationship with CSV and performance revealed significant effects between three CSV variables (“social value congruence,” “value of information sharing,” and “value of participation”) and performance in both models. These results are in line with previous findings: (1) a variety of activities are needed to deliver value propositions to different stakeholders and value to customers [22]; and (2) consumers’ self-images congruent with corporate image can become an important variable for customer satisfaction with and loyalty to a company, and the “future of competition” claims that a paradigm shift for value occurs under a new concept of future collaboration in which corporations and customers make strenuous efforts to co-create value [69]. The results of this study can also be interpreted similarly: (1) When personality and emotional intelligence act as adjustment variables, individual-organization value congruence can have effects on organizational loyalty and performance [58]; (2) value congruence realized by consumers via the Internet has a positive effect on the quality of customer relationship and behavioral intention [70]; (3) consumers are the most valuable source of supply for corporations in the digital environment, and they can be actively invited to participate in value co-creation in an effort to expand SE [39]; and (4) the knowledge scattered among individuals and groups within an organization can further spread through organization-wide sharing and boost overall competence [71].
Other findings suggested that customer engagement is demonstrated as simultaneousness between production and consumption [54], and that the variables related to participation, familiarity, information utilization, attention, and altruism help consumers develop a positive attitude toward SE [16]. In light of these changes in the business environment, the need for including shared value creation along with profitability as company goals were highlighted [9].

5. Conclusions

Amid increasing attention toward SE in social and cultural contexts, the need to develop business models suitable for the Korean market and ways to promote such models, once completed, has been suggested. Under this situation, SE companies apply their strategic management process to the models in an effort to actively adapt to changing consumption. In particular, these companies are eager to establish and implement strategies that can improve the effectiveness and efficiency level of shared value on the basis of customer relationships. This approach is aimed at establishing sustainable competitive advantage with the ultimate goal of strengthening win-win situation, performance sharing, and competitiveness throughout the entire management process by co-creating value for all parties involved. That is, CSV, a process of creating mutually beneficial value for consumers and corporations, is required. In this paper, we identified strategy characteristics for sustainable competitive advantage in SE businesses and investigated whether such strategy characteristics were related to creating shared value (social value congruence, the value of information sharing, and value of participation) and performance by comparing components of the B2P and P2P SE business models. The results of this study suggest the direction of research that can be approached from the perspective of consumer behavior and social network on the strategic advantage of sharing economy business. Through this effect relationship, this study aims to develop a more explanatory sharing economy business and network strategy model by presenting a research framework related to the strategy characteristics and CSV roles that derive the performance (outcome) of sharing economy business.
The following marketing implications are derived from the results. First, to increase social congruence between SE businesses (service) and consumers, the reliable relationship between these two parties should be emphasized in the B2P model, and collaboration activities for consumers should be continuously developed. The two parties should improve their value network with an awareness of their need satisfaction relationship required for joint value. The P2P model requires further improvement in the brand value of SE-based services, specifically, the defined extent of the market for services (goods), including associated and strategic innovation through constantly differentiated services. In addition, the model requires strategies to develop the competence of SE businesses and to increase strategically important resources needed to develop a service process. Second, to improve the value of information sharing between SE businesses (services) and consumers in the B2P and P2P models, marketing strategies are required to promote the importance of the interaction with users and the value consumption experience, increase moment of truth services by offering future-oriented value to users, utilize the reliable relationship and collaboration with users, and build value networks where the need satisfaction relationship is created for joint value. Separately, the intrinsic value of SE services should be similar to users’ value, represent functional value pursued by users in the society, and improve social value congruence, which could boost users’ self-esteem. The B2P model, in particular, requires strategies to increase the interaction between SE-based services and users, their experience in value consumption and moment of truth services through future-oriented value offerings. The P2P model requires the development of the competence of the SE service, possession of strategic assets, and an increase in strategic resources based on process development. Third, to enhance “value of participation” for users in SE businesses (services), both models require actions to announce user value, represent functional value in the society, and improve users’ self-esteem in order to increase social value congruence. In addition, service providers need to ensure that the information shared by users in relation to SE services and their sharing activities should be useful and valuable, and to find ways of improving the value of information sharing to make sharing activities effective. Fourth, to improve outcomes related to business (service) image, business (service) competitiveness, and business (service) growth of SE businesses, the two models require strategic methods to help users increase their self-consciousness, while participating in SE services, to demonstrate the social and public value of such participation, and eventually to increase the value of participation.
Based on the above, an important part of the strategic utilization of the competitive advantage of the practical sharing economy is to focus on developing differentiated services and communication for value relations and participation. To this end, it is necessary to expand service processes, such as collaboration of various sharing economy categories, service expansion through familiar brand alliances, and exotic events and promotions. Furthermore, it is necessary to make social connections higher through strategies, such as customer support for active experience improvement, communityization beyond commerce, provision of members’ participation activities, purchase method, and product redistribution in the community.
In this way, by sharing their own resources with others, the members seek to solve social problems through the virtuous cycle of resource utilization and the pursuit of value reproduction, and pursue voluntary and rational alternative consumption. Therefore, future research should focus on identifying various activities in the organization for value creation and achievement in the sharing economy business. In particular, it should be studied to reflect the problems and approaches in the various contextual aspects of the relationship network for cooperative consumption of members.
Furthermore, it is necessary to extend the characteristics of consumers embracing SE to include rationality, reasonableness, and maturity of individuals associated with the trust and connection within a community, beyond the stereotype of “rational human” defined in economics. Further studies are needed to address various social and psychological factors not covered by this study both gradually and systematically. Given that this study focused on the B2P and P2P models to discuss integrated SE businesses, it is impossible to generalize the results to all SE business types. To verify more detailed influence and differentiation, the scope of future research needs to expand in terms of SE business type and product characteristics. In addition, this study sought to expand the academic scope and practical application of variables through in-depth interviews with business professionals and experienced consumers in sharing economy to develop measurement tools. However, in the future, it will be necessary to expand the research to business practitioners for detailed field opinions and strategy proposals, including the results from this study.

Author Contributions

S.K. and Y.K.N. wrote the paper and designed the survey. S.K. suggested research ideas and contributed to the majority of writing and revision of the paper. Y.K.N. contributed to the writing of the paper and conducted the survey and data analysis. All authors have read and agreed to the published version of the manuscript.

Funding

This work was supported by the Ministry of Education of the Republic of Korea and the National Research Foundation of Korea (NRF-2016S1A5A2A03926167).

Conflicts of Interest

The authors declare no conflicts of interest.

References

  1. Lessig, L. Remix: Marketing Art and Commerce Thrive in the Hybrid Economy; Penguin: New York, NY, USA, 2008; pp. 1–327. [Google Scholar]
  2. Kim, K.Y.; Kim, H.K. A study on consumer preference typologing toward sharing economy service models based on collaborative consumption: A strategic approach to marketing communications. J. Korean Soc. Sci. Stud. Subj. 2013, 27, 23–40. [Google Scholar]
  3. Lorna, G. New Financial Horizons: The Emergence of an Economy of Communication; New City Press: New York, NY, USA, 2010; pp. 1–224. [Google Scholar]
  4. Möhlmann, M. Collaborative consumption: Determinants of satisfaction and the likelihood of using a sharing economy option again. J. Consum. Behav. 2015, 14, 193–207. [Google Scholar] [CrossRef]
  5. Tussyadiah, I. An Exploratory on Drivers and Deterrents of Collaborative Consumption on Travel. In Information & Communication Technologies in Tourism 2015. Proceedings of the International Conference in Lugano, Switzerland, 3–6 February 2015; Tussyadiah, I., Inversini, A., Eds.; Springer International Publishing: Heidelberg, Switzerland, 2015. [Google Scholar]
  6. Veliyath, R.; Fitzgerald, E. Firm capabilities, business strategies, and hyper-competitive arenas: The sustainability of competitive advantages with implications for firm competitiveness. Compet. Rev. 2000, 10, 56–82. [Google Scholar]
  7. Kim, C.Y.; Kang, M.H.; Kang, H.S.; Youn, Y.S.; Han, I.Y. Business ecosystem & platform strategies. Samsung Economic Research Institute. 2012. Available online: https://www.seri.org/db/dbReptV.html?g_menu=02&s_menu=0201&pubkey=db20120206001 (accessed on 13 February 2020).
  8. Koo, H.G.; Rha, J.H. How can we facilitate co-creation of value?: Findings from expert panel interviews. J. Consump. Cult. 2012, 15, 159–186. [Google Scholar]
  9. Porter, M.E.; Kramer, M.R. Creating shared value. Harv. Bus. Rev. 2011, 89, 62–77. [Google Scholar]
  10. Cho, H.R.; Jeon, J.Y.; Jung, S.Y. Innovative business model for the sustainable creating shared values. J. Sustain. Res. 2011, 2, 57–80. [Google Scholar]
  11. Benkler, Y. Sharing Nicely: On Shareable Goods and the Emergence of Sharing as a Modality of Economic Production. Yale Law J. 2004, 114, 273. [Google Scholar] [CrossRef] [Green Version]
  12. Son, S.Y.; Kim, S.H. Business Models of the Sharing Economy and New Economic Norms. Ministry of Science, ICT and Future Planning. KISDI Report. 2015. Available online: http://m.kisdi.re.kr/mobile/repo/res_view.m?key1=13855&key2=0&key3=&category=4 (accessed on 13 February 2020).
  13. Rifkin, J. The Rise of the Sharing Economy. Los Angeles Times, 6 April 2014. Available online: https://www.latimes.com/opinion/op-ed/la-xpm-2014-apr-06-la-oe-rifkin-airbnb-20140406-story.html (accessed on 20 July 2018).
  14. Aigrain, P. Sharing: Culture and the Economy in the Internet Age; Amsterdam University Press: Amsterdam, The Netherlands, 2012; pp. 1–242. [Google Scholar]
  15. Harvey, C.R.; Liu, Y.; Zhu, H. … and the cross-section of expected returns. Rev. Financ. Stud. 2016, 29, 5–68. [Google Scholar] [CrossRef] [Green Version]
  16. Choi, Y.; Lee, J.K. Effects of digital cultural capital on the perception of sharing economy. Korean J. Commun. Stud. 2013, 21, 89–110. [Google Scholar]
  17. Kwon, H.J.; Lim, H.C. The effect of corporate social responsibility activity on brand image, management performance and recontracting intention in foodservice industry. Tour. Res. 2017, 42, 85–107. [Google Scholar]
  18. Kim, J.H.; Kim, J.T. A business model-based study on the sustainability of internet-newcomer: The case of Amazon.com. J. Eurasian Stud. 2013, 19, 239–261. [Google Scholar]
  19. Afuah, A.; Tucci, C. Internet Business Models and Strategies: Text and Cases; Irwin/McGraw-Hill: New York, NY, USA, 2001; pp. 1–384. [Google Scholar]
  20. Hensmans, M.; Bosch, F.A.V.D.; Volberda, H.W. Clicks vs. Bricks in the Emerging Online Financial Services Industry. Long Range Plan. 2001, 34, 231–247. [Google Scholar] [CrossRef]
  21. Zott, C.; Amit, R. Business Model Design and the Performance of Entrepreneurial Firms. Organ. Sci. 2007, 18, 181–199. [Google Scholar] [CrossRef]
  22. Zott, C.; Amit, R. The fit between product market strategy and business model: Implications for firm performance. Strateg. Manag. J. 2008, 29, 1–26. [Google Scholar] [CrossRef] [Green Version]
  23. Morris, M.; Schindehutte, M.; Allen, J. The entrepreneur’s business model: Toward a unified perspective. J. Bus. Res. 2005, 58, 726–735. [Google Scholar] [CrossRef]
  24. Magretta, J. Why business models matter. Harv. Bus. Rev. 2002, 80, 86–92. [Google Scholar]
  25. Johnson, M.W.; Christensen, C.M.; Kagermann, H. Reinventing your business model. Harv. Bus. Rev. 2008, 86, 50–59. [Google Scholar]
  26. Chesbrough, H.; Rosenbloom, R.S. The role of the business model in capturing value form innovation: Evidence from Xerox corporation’s technology spin-off companies. Ind. Corp. Chang. 2002, 11, 529–555. [Google Scholar] [CrossRef] [Green Version]
  27. Speculand, R. Strategy implementation: We got the people factor wrong!: How to lead your saboteurs, groupies, double agents and mavericks. Hum. Resour. Manage. Int. Dig. 2006, 14, 34–37. [Google Scholar] [CrossRef]
  28. Cho, S.E. Factors Affecting Performance of the Activities Promoting Knowledge Exchanges in Industrial Clusters. J. Econ. Geogr. Soc. Korea 2012, 15, 515–533. [Google Scholar]
  29. Duncan, T.; Majority, S. How integrated marketing communication’s ‘touchpoints’ can operationalize the service dominant logic. In The Service Dominant Logic of Marketing: Dialogue, Debate and Directions; Vargo, S.L., Lusch, R.F., Eds.; Routledge: New York, NY, USA, 2006; pp. 236–244. [Google Scholar]
  30. Jung, B.Y.; Lee, C. Relationship between types of strategic human resource development activity and individual and organizational characteristics perceived by HRD practitioners in large corporations. J. Corp. Educ. Talent Res. 2014, 16, 25–56. [Google Scholar]
  31. Kloninger, S.M. Drivers of Strategy Implementation Success: The Effects of Middle Management Behavior, Administrative Mechanisms and Environmental Uncertainty. Ph.D. Thesis, Department of Economics, The Free University of Berlin, Berlin, Germany, June 2010. [Google Scholar]
  32. Markides, C. All the Right Move: A Guide to Crafting Breakthrough Strategy; Harvard Business School Press: Boston, MA, USA, 2000; pp. 1–219. [Google Scholar]
  33. De Luca, L.M.; Atuahene-Ginma, K. Market knowledge dimensions and cross functional collaboration: Examining the different routes to product innovation performance. J. Mark. 2007, 71, 95–112. [Google Scholar] [CrossRef]
  34. Marinova, D. Actualizing Innovation Effort: The Impact of Market Knowledge Diffusion in a Dynamic System of Competition. J. Mark. 2004, 68, 1–20. [Google Scholar] [CrossRef]
  35. Porter, M.E. Competitive Advantage of Nations Creating and Sustaining Superior Performance; The Free Press: New York, NY, USA, 2011; pp. 1–857. [Google Scholar]
  36. Lee, Y.J.; Suh, W.S. The influence of competitive advantage on hospital performance: Focused on resource-based view(RBV). Korean J. Hosp. Manag. 2016, 21, 53–64. [Google Scholar]
  37. Yang, Y.I. The effects of resource orientation on marketing innovation, sustained competitive advantage and performance. J. Mark. Stud. 2012, 20, 33–52. [Google Scholar]
  38. Kaplan, R.S.; Norton, D.P. The balanced scorecard - Measures that drive performance. Harv. Bus. Rev. 1992, 70, 71–79. [Google Scholar]
  39. Kalaignanam, K.; Varadarajan, P.R. Customers as co-producers: Implications for marketing strategy effectiveness and marketing operations efficiency. In The Service Dominant Logic of Marketing: Dialogue, Debate and Directions; Lusch, R.F., Vargo, S.L., Eds.; M.E. Sharpe: Armonk, NY, USA, 2006; pp. 166–179. [Google Scholar]
  40. Choi, W.J. The typology of consumers’ perception on online word-of-mouth communication: Based on a case study of the North Face. J. Korean Soc. Sci. Stud. Subj. 2012, 25, 5–20. [Google Scholar]
  41. Choi, D.W.; Kim, K.B.; Lee, S.M. Impact of the creating shared value’s motivation and performance on the stakeholders. Korean Corp. Manage. Rev. 2015, 22, 153–174. [Google Scholar]
  42. Park, J.H.; Choi, J.H.; Jeong, Y.A. Relationship of personal and organizational value with job performance: The mediating role of organizational commitment and organizational citizenship behavior. Korean Corp. Manage. Rev. 2014, 56, 207–226. [Google Scholar]
  43. Lee, S.H.; Park, S.Y. Congruity effects of self-image, functions and values of customers on the satisfaction and loyalty to social enterprise based on the beautiful store. J. Eurasian Stud. 2015, 12, 33–60. [Google Scholar]
  44. Park, S.Y.; Lee, Y.K. Effect of the congruence between brand personality and self-image on customer satisfaction, consumer-brand relationship and brand loyalty in Korean culture. Korean J. Advert. 2006, 17, 7–24. [Google Scholar]
  45. Zhang, J.; Bloemer, J.M. The impact of value congruence on consumer-service brand relationships. J. Serv. Res. 2008, 11, 161–178. [Google Scholar] [CrossRef] [Green Version]
  46. Zang, P.; Hong, K.S. The moderating effect of external knowledge transfer on the antecedents and performance of knowledge sharing. J. Financ. Knowl. Stud. 2010, 8, 117–147. [Google Scholar]
  47. Oyemomi, O.; Liu, S.; Neaga, I. The contribution of knowledge sharing to organizational performance and decision making: A literature review. In Decision Support System IV-Information and Knowledge Management in Decision Process; Linden, I., Liu, S., Dargam, F., Hernández, J.E., Eds.; Springer: New York, NY, USA, 2015; pp. 1–12. [Google Scholar]
  48. Lawson, B.; Petersen, K.J.; Cousins, P.D.; Handfield, R.B. Knowledge sharing in interorganizational product development teams: The effect of formal and informal socialization mechanisms. J. Prod. Innovat. Manag. 2009, 26, 156–172. [Google Scholar] [CrossRef]
  49. Lee, D.Y. A Study on the Relation among Knowledge Assets, Knowledge Sharing, and Organizational Effectiveness. Ph.D. Thesis, The Graduate School of Chonbuk National University, Jeonju, Korea, February 2007. [Google Scholar]
  50. Yun, C.H.; Choe, J.G.; Jung, S.H. The causal relationship between knowledge sharing and performance: The determinants of knowledge sharing and their impact on performance using structural equation model. Korean J. Local Gov. Stud. 2017, 21, 231–259. [Google Scholar] [CrossRef]
  51. Vargo, S.L.; Lusch, R.F. Toward a Better Understanding of the Role of Value in Markets and Marketing; Emerald Group: Bingley, UK, 2012; pp. 1–151. [Google Scholar]
  52. Nam, G.C.; Kim, Y.J.; Nam, J.T.; Bae, Y.W.; Byeon, H.S.; Lee, N.H. Service science: Theory review and development of analytical framework. Inf. Syst. Rev. 2008, 10, 213–235. [Google Scholar]
  53. Etgar, M. A descriptive model of the consumer co-production process. J. Acad. Mark. Sci. 2008, 36, 97–108. [Google Scholar] [CrossRef]
  54. Suh, M.S.; Chun, M.H.; Ahn, J.W. A study on the influence of customer participation behavior and customer citizenship behavior by technological and functional customers’ roles on service quality. J. Mark. Manag. Res. 2009, 14, 91–126. [Google Scholar]
  55. Yi, Y.; Nataraajan, R.; Gong, T. Customer participation and citizenship behavioral influences on employee performance, satisfaction, commitment and turnover intention. J. Bus. Res. 2011, 64, 87–95. [Google Scholar] [CrossRef]
  56. Yoon, S.M. The impact of customer participation and expertise on the co-creation of value and customer trust of hotel users. Tour. Res. 2017, 42, 131–150. [Google Scholar] [CrossRef]
  57. Shaw, G.; Bailey, A.; Williams, A. Aspects of service-dominant logic and its implications for tourism management: Examples from the hotel industry. Tour. Manag. 2011, 32, 207–214. [Google Scholar] [CrossRef] [Green Version]
  58. Song, J.S.; Yoo, T.Y. The effects of person-organization value fit on person’s attitude and behavior. Korean J. Ind. Organ. Psychol. 2005, 18, 361–384. [Google Scholar]
  59. Podsakoff, P.M.; MacKenzie, S.B.; Lee, J.; Podsakoff, N.P. Common methods biases in behavioral research: A critical review of the literature and recommended remedies. J. Appl. Psychol. 2003, 88, 879–903. [Google Scholar] [CrossRef]
  60. MacKenzie, S.B.; Podsakoff, P.M. Common method bias in marketing: Causes, mechanisms, and procedural remedies. J. Retail. 2012, 88, 542–555. [Google Scholar] [CrossRef]
  61. Park, W.W.; Kim, M.S.; Jeong, S.M.; Huh, K.M. Causes and remedies of common method bias. Korean J. Manag. 2007, 15, 89–133. [Google Scholar]
  62. Podsakoff, P.M.; Organ, D.W. Self-reports in organizational research: Problems and prospects. J. Manag. 1986, 12, 531–544. [Google Scholar] [CrossRef]
  63. Kim, K.J. The relative effects of three dimensions of family restaurants service quality through mediating customer satisfaction on loyalty. J. Foodserv. Manag. 2010, 13, 103–121. [Google Scholar]
  64. Vorhies, D.W.; Morgan, N.A. Benchmarking marketing capabilities for sustainable competitive advantage. J. Mark. 2005, 69, 80–94. [Google Scholar] [CrossRef]
  65. Weerawardena, J. The role of marketing capability in innovation-based competitive strategy. J. Strat. Market. 2003, 11, 15–35. [Google Scholar] [CrossRef]
  66. Chung, D.S.; Park, T.H. A study on the competitive advantage of corporate strategy through strategic innovation. J. Hum. Resour. Manage. Res. 2004, 8, 265–283. [Google Scholar]
  67. Cha, J.B.; Lee, H.Y. Effect of MOT medical service failure factors on dissatisfaction and customer complaint behaviors: Focusing on patient-visit (first/second) types. Acad. Cust. Satisf. Manag. 2016, 18, 25–43. [Google Scholar]
  68. Keller, K.L.; Lehman, D.R. How do brands create value? Mark. Manag. 2003, 12, 27–31. [Google Scholar]
  69. Prahalad, C.K.; Ramaswamy, V. Co-creating unique value with customers. Strat. Leader. 2004, 32, 4–9. [Google Scholar] [CrossRef]
  70. Sim, J.B. Study on Value-congruence, Relationship Quality and Relationship Performance in the On-line Environment. Ph.D. Thesis, The Graduate School of Chungnam National University, Daejeon, Korea, February 2006. [Google Scholar]
  71. Kim, I.H.; Kim, J. A study on the effect of knowledge sharing on organizational performance. J. Welf. Adm. 2008, 24, 1–26. [Google Scholar]
Figure 1. Research model.
Sustainability 12 01397 g001
Figure 2. Path analysis model testing for B2P sharing economy (SE) business.
Sustainability 12 01397 g002
Figure 3. Testing the path analysis model for P2P SE business.
Sustainability 12 01397 g003
Table 1. Demographic characteristics of participants.
CharacteristicsNumber of Participants (%)CharacteristicsNumber of Participants (%)
GenderMale357(56.6)Education4-year college (attending/degree)492(78.0)
Female274(43.4)Master’s or higher education (attending/degree)69(10.9)
Age20–29237(37.6)2-year college (attending/degree)39(6.2)
30–39212(33.6)High school or lower (attending/degree)31(4.9)
40–49113(17.9) Monthly household income *Less than 1 mil. won20(3.2)
50–5962(9.8)1 mil–less than 3 mil. won87(13.8)
60 or older7(1.1)3 mil–less than 5 mil. won244(38.7)
OccupationUnemployed27(4.3)5 mil–less than 7 mil. won153(24.2)
Homemaker41(6.5)7 mil–less than 9 mil. won79(12.5)
Student98(15.5)9 mil. won or more48(7.6)
Professional84(13.3)Service
model
B2P 311(49.3)
Management, administration49(7.8)P2P320(50.7)
Professional technician53(8.2)Service
type
Space (accommodation, office, and conference room)179(28.4)
Office worker202(32.0)Transportation (car, carpool)197(31.2)
Salesperson19(3.0)Goods (clothing, tools, and books)195(30.9)
Government employee32(5.1)Experience (including knowledge)41(6.5)
Other27(4.3)Financial (funding and loan)19(3.0)
Note: * $1 is equal to approximately 1189.00 won as of 1 August 2018. Thus, 1 mil. won is about $841.04. B2P, business-to-peer; P2P, peer-to-peer.
Table 2. Reliability and validity of strategy characteristics for sustainable competitive advantage.
VariablesItemsEigen-
Values
ComponentVarianceCronbach’s α
Moment of truthExtent to which interaction is viewed as important
Extent to which experience in value consumption is viewed as important
Extent to which future-oriented value is offered
2.3270.876
0.803
0.777
19.3930.751
Strategic innovationExtent to which innovative brand value is increased
Extent to which service (goods) market is innovated
Extent to which service differentiation is sustained
2.3220.818
0.807
0.772
19.3520.717
Strategic resourcesExtent to which competence development is viewed as important
Extent to which the possession of strategic assets is viewed as important
Extent to which the development of the service process is viewed as important
2.1090.845
0.844
0.818
17.5790.782
Value networkExtent to which reliable relationship is viewed as important
Extent to which collaboration is viewed as important
Extent to which need satisfaction in the relationship is achieved
1.7650.843
0.806
0.776
14.7080.735
Table 3. Reliability and validity of creating shared value.
VariablesItemsEigen-
Values
ComponentVarianceCronbach’s α
Social
value congruence
Extent of similarity with intrinsic service value
Extent to which social and functional value of service is presented
Extent to which intrinsic service value and self-esteem are improved
2.2310.826
0.812
0.740
24.7890.702
Value of information sharingExtent of usefulness in information sharing
Extent to which the sharing of experience-based information is considered valuable
Extent to which engagement activities in information are considered valuable
2.0910.850
0.835
0.804
23.2330.773
Value of participationExtent of improvement in self-consciousness about participation
Extent to which participation is considered socially valuable
Extent to which participation is considered valuable for public interests
1.8410.866
0.859
0.733
20.4520.751
Table 4. Reliability and validity of performance.
VariablesItemsEigen-
Values
ComponentCronbach’s α
PerformanceExtent to which business (service) image is improved
Extent to which business (service) competitiveness is increased
Extent to which business (service) growth is expected
2.0870.868
0.818
0.815
0.778
Table 5. Results of confirmatory factor analysis.
VariableNon-standardized
Coefficient
Standardized
Coefficient
S.E.C.R.Construct
Reliability
AVE
Strategy characteristics for sustainable competitive advantage
Moment of truth
11.0000.724--0.7970.654
20.9170.7570.06120.303
30.8870.8370.03812.489
Strategic innovation
11.0000.766--0.7620.674
20.9870.8040.05819.629
30.9430.7990.04916.526
Strategic resources
11.0000.846--0.8110.702
20.9980.7690.04816.218
30.9680.7510.04113.904
Value network
11.0000.814--0.7620.673
20.9560.7620.05919.654
30.9200.8300.04814.920
Creating shared value
Social value congruence
11.0000.803 --0.7490.659
20.9830.7490.06321.316
30.8950.8110.04715.768
Value of information sharing
11.0000.765--0.8030.694
20.9820.7800.05117.282
30.9450.7970.04113.849
Value of participation
11.0000.892 --0.7950.654
20.9910.7770.06220.982
30.8460.8650.03411.458
Performance
11.0000.861 --0.8040.689
20.9420.7630.05717.572
30.9380.7620.03812.872
Note: S.E., standard error; C.R., critical ratio; AVE, average variance extraction.
Table 6. Results of the discriminant validity analysis.
Variables12345678
Moment of truth1.000
Strategic innovation0.533 **1.000
Strategic resources0.691 **0.634 **1.000
Value network0.667 **0.547 **0.639 **1.000
Social value congruence0.330 **0.400**0.437 **0.366 **1.000
Value of information sharing0.452 **0.365 **0.412 **0.501 **0.445 **1.000
Value of participation0.296 **0.408 **0.396 **0.326 **0.666 **0.4641.000
Performance0.442 **0.397 **0.462 **0.466 **0.521 **0.4790.489 **1.000
Note: 1–8: Pearson Cross-Correlation, ** p < 0.01.
Table 7. Goodness-of-fit of path analysis models.
ModelGoodness-of-Fit Index
X2dfp-ValueGFIAGFIRMRNFICFIRMSEA
B2P Model40.27850.0000.9380.9180.0760.9150.9390.031
P2P Model73.24940.0000.9520.9210.0450.9360.9600.048
Note: GFI, goodness of fit index; AGFI, adjusted goodness of fit index; RMR, root mean square residual; NFI, normed fit index; CFI, comparative fit index; RMSEA, root mean square error of approximation.
Table 8. Results of hypothesis testing (B2P model).
TypePathwayEstimateS.E.C.R.p-ValueResults
H1-1Moment of truthSocial value congruence0.0660.0820.8060.421Rejected
H1-2Strategic innovationSocial value congruence0.0320.0720.4450.657Rejected
H1-3Strategic resourcesSocial value congruence0.1130.0921.2290.220Rejected
H1-4Value networkSocial value congruence0.3420.0764.4830.000Accepted
H2-1Moment of truthValue of information sharing0.1780.0792.2560.025Accepted
H2-2Strategic innovationValue of information sharing0.1910.0702.7450.006Accepted
H2-3Strategic resourcesValue of information sharing0.1090.0881.2310.219Rejected
H2-4Value networkValue of information sharing0.2850.0733.8900.000Accepted
H3Social value congruenceValue of information sharing0.3770.0537.1570.000Accepted
H4Social value congruenceValue of participation0.5400.04611.7170.000Accepted
H5Value of information sharingValue of participation0.2300.0464.9990.000Accepted
H6Value of participationPerformance0.3700.0536.9970.000Accepted
Table 9. Results of hypothesis testing (P2P model).
TypePathwayEstimateS.E.C.R.p-ValueResults
H1-1Moment of truthSocial value congruence0.0610.0740.8240.410Rejected
H1-2Strategic innovationSocial value congruence0.2160.0643.3550.001Accepted
H1-3Strategic resourcesSocial value congruence0.3980.0695.7290.000Accepted
H1-4Value networkSocial value congruence0.0540.0700.7740.439Rejected
H2-1Moment of truthValue of information sharing0.2600.0723.5860.000Accepted
H2-2Strategic innovationValue of information sharing0.0240.0630.3890.698Rejected
H2-3Strategic resourcesValue of information sharing0.1680.0682.4620.014Accepted
H2-4Value networkValue of information sharing0.2640.0693.8460.000Accepted
H3Social value congruenceValue of information sharing0.4950.04910.1460.000Accepted
H4Social value congruenceValue of participation0.5860.04512.9270.000Accepted
H5Value of information sharingValue of participation0.2080.0454.5930.000Accepted
H6Value of participationPerformance0.6080.04513.6510.000Accepted
Table 10. Results of hypothesis testing.
TypePathwayResults
B2P ModelP2P Model
H1-1Moment of truthSocial value congruenceRejectedRejected
H1-2Strategic innovationSocial value congruenceRejectedAccepted
H1-3Strategic resourcesSocial value congruenceRejectedAccepted
H1-4Value networkSocial value congruenceAcceptedRejected
H2-1Moment of truthValue of information sharingAcceptedAccepted
H2-2Strategic innovationValue of information sharingAcceptedRejected
H2-3Strategic resourcesValue of information sharingRejectedAccepted
H2-4Value networkValue of information sharingAcceptedAccepted
H3Social value congruenceValue of information sharingAcceptedAccepted
H4Social value congruenceValue of participationAcceptedAccepted
H5Value of information sharingValue of participationAcceptedAccepted
H6Value of participationPerformanceAcceptedAccepted

