Article

Integration of Boosted Regression Trees and Cellular Automata—Markov Model to Predict the Land Use Spatial Pattern in Hotan Oasis

1
College of Water Conservancy, Yunnan Agricultural University, Kunming 650201, China
2
College of Agricultural Engineering, Hohai University, Nanjing 210098, China
3
State Key Laboratory of Hydrology-Water Resources and Hydraulic Engineering, Hohai University, Nanjing 210098, China
*
Author to whom correspondence should be addressed.
Sustainability 2020, 12(4), 1396; https://doi.org/10.3390/su12041396
Submission received: 20 January 2020 / Revised: 6 February 2020 / Accepted: 7 February 2020 / Published: 13 February 2020
(This article belongs to the Special Issue Modelling Land Use Change and Environmental Impact)

Abstract

:
The simulation and prediction of the land use changes is generally carried out by cellular automata—Markov (CA-Markov) model, and the generation of suitable maps collection is subjective in the simulation process. In this study, the CA-Markov model was improved by the Boosted Regression Trees (BRT) to simulate land use to make the model objectively. The weight of ten driving factors of the land use changes was analyzed in BRT, in order to produce the suitable maps collection. The accuracy of the model was verified. The outcomes represent a match of over 84% between simulated and actual land use in 2015, and the Kappa coefficient was 0.89, which was satisfactory to approve the calibration process. The land use of Hotan Oasis in 2025 and 2035 were predicted by means of this hybrid model. The area of farmland, built-up land and water body in Hotan Oasis showed an increasing trend, while the area of forestland, grassland and unused land continued to show a decreasing trend in 2025 and 2035. The government needs to formulate measures to improve the utilization rate of water resources to meet the growth of farmland, and need to increase ecological environment protection measures to curb the reduction of grass land and forest land for the ecological health.

1. Introduction

The over-utilization of land resources with the increase of population has caused a series of ecological and environmental problems, such as forest reduction, soil erosion, climate change, etc., which have made the unmatched contradiction of the population, resources and global environmental change more prominent [1,2]. Currently, the simulation and prediction of land use changes are mainly carried out by establishing mathematical models [3], which mainly include the Markov model [4], Cellular Automata model [5,6,7], System Dynamics model [8,9], and Artificial Neural Networks [10,11]. The Cellular Automata-Markov (CA-Markov) combines the ability to simulate the spatial variation of complex systems of CA model and the long-term prediction of the Markov model. Therefore, it has been used in land use simulation [12,13,14], species distribution [15], and ecological environment [16,17].
Currently, the issue of the use of the CA-Markov model for land use is given more attention [18,19]. The research of application of the CA-Markov model for land use in a wide range of regions, and the related research is increasing year-by-year. The CA-Markov model, which has been calibrated for the local area, was used to predict of land use in most of the studies. Only a few studies improved the CA-Markov model, mainly included the combination of this model and other models or methods, such as the combination of the logistic model and the CA-Markov model [20], the CA-Markov model based on frequency ratio and Analytical Hierarchy Process (AHP) [21], the combination of the ant colony optimization and CA-Markov model [22], etc. At present, the Analytical Hierarchy Process, that is based on asking a number of “experts”, was generally used to determine the weight of each adaptability chart to create the suitability atlas in the CA-Markov model in the previous researches, which had strong subjectivity. How to reduce the impact of subjectivity in the creation of suitability maps collection is very important to the use of the CA-Markov model.
In recent years, with the intensification of human activities, the land use of Hotan Oasis, located in the desert area of southern Xinjiang, has been ever changing in the past period, and the farmland area has been increasing [23,24]. In the basin, the natural vegetation gradually declined, the groundwater level dropped dramatically, and the desertification intensified. On the other hand, the climate change has become one of the most important global environmental challenges in the 21st century. Since the 1980s, the impact of global climate change on Xinjiang has been obvious [25]. The runoff of Hotan River, the only source of water to Hetian Oasis, also showed uncertainty [26]. Previous researches indicated that the runoff decreases continuously with the increase of temperature and precipitation [27,28]. The increasing trend of the farmland area posed a greater challenge to us, under that background of limited water resources from Hotan River. Therefore, it is of great significance to study the factors of the land use change in Hotan Oasis, and to predict the potential future distribution of land use.
Overall, the objectives of this study were: (1) to improve the CA-Markov model by using the Boosted Regression Trees (BRT) to simulate the land use to make the CA-Markov model objective (the weight of driving factors of the land use changes in Hotan Oasis was analyzed in BRT, and the accuracy of the CA-Markov model was verified); (2) to use the improved model to predict the future land use distribution of Hotan Oasis, to provide scientific support for the rational allocation of the water and land resources in the Hotan River Basin under climate change conditions, and to promote the stability, health and sustainable development of the regional economy and society.

2. Study Area

The study area is the oasis of the Hotan River basin (39°38′–41°45′ N, 85°42′–89°17′ E). The Hotan River flows for 1127 km, with a mean annual water discharge of 4.478 × 10⁹ m3 [29], which is the second largest river on the northern slope of the Kunlun Mountains of southern Xinjiang. The river comes from the Yulongkasi River and the Kalakasi River, where are confluent at Kushlash, then passes through the Taklimakan Desert from south to north before flowing into the Tarim river.
Hotan River Basin is located at southwest of Tarim Basin, in the south of Xinjiang Uygur Autonomous Region. It is adjacent to the Keriya River Basin in the east, Karakunlun Mountains and Kunlun Mountains in the south, Yerqiang River Basin in the west, and the southern margin of the Tarim Basin in the north. The administrative regions were Hotan City, Hotan County, Moyu County, Luopu County, Cele County, Pishan County, and a part of Avati County in Aksu District in the basin.
The research area of Hotan Oasis is determined by two steps in the ArcGIS (Figure 1). First, the Hotan River Basin watershed boundary was extracted by elevation. Then combined the sub-basins boundary, which have the utilized land (i.e., the land use types except unused land) in 1995–2015. The study area is located between the downstream of Tongguziluoke and Uruwati stations in Hotan River, and the upstream of the Kushlash station. The studied area was 18,337.59 km2.

3. Methodology

3.1. Input Data

The remote sensing monitoring data of the land use in Hotan Oasis in 1995, 2000, 2005, 2010, and 2015 were downloaded from the Resource and Environment Data Cloud Platform (http://www.resdc.cn), for that the data before 1995 has larger error due to technical reasons, such as the accuracy of the remote sensing data, the data missing in a year which was derived from the fusion of other nearby years. The digital grid is 30 m × 30 m. The data was generated by manual visual interpretation, based on each period of remote sensing images of the Landsat TM/ETM as the data source.
Six primary land use types were divided into in this study: farmland, forestland, grassland, water body, built-up land, and unused land. The secondary catalogue and explanation of land use classification can be queried through the above website. The farm land includes dry land and paddy field; grassland includes natural grassland with coverage of 5–20%, the mixed grassland of natural grassland and improved grassland with total coverage of 20–50%, and the mixed grassland of natural grassland, improved grassland and mowed grassland with total coverage of more than 50%; unused land including sand, Gobi, saline–alkali land, swampland, bare land, bare rock texture land, etc. For analyzing the factors that affect the land use distribution in Hotan Oasis, ten factors were selected according to the previous studies [30], such as the elevation, slope, annual precipitation, annual temperature, groundwater depth, population density, gross domestic product density, distance to water body, distance to roads, and distance to the village centers (Table 1), the data were obtained from the Resource and Environment Data Cloud Platform (http://www.resdc.cn).

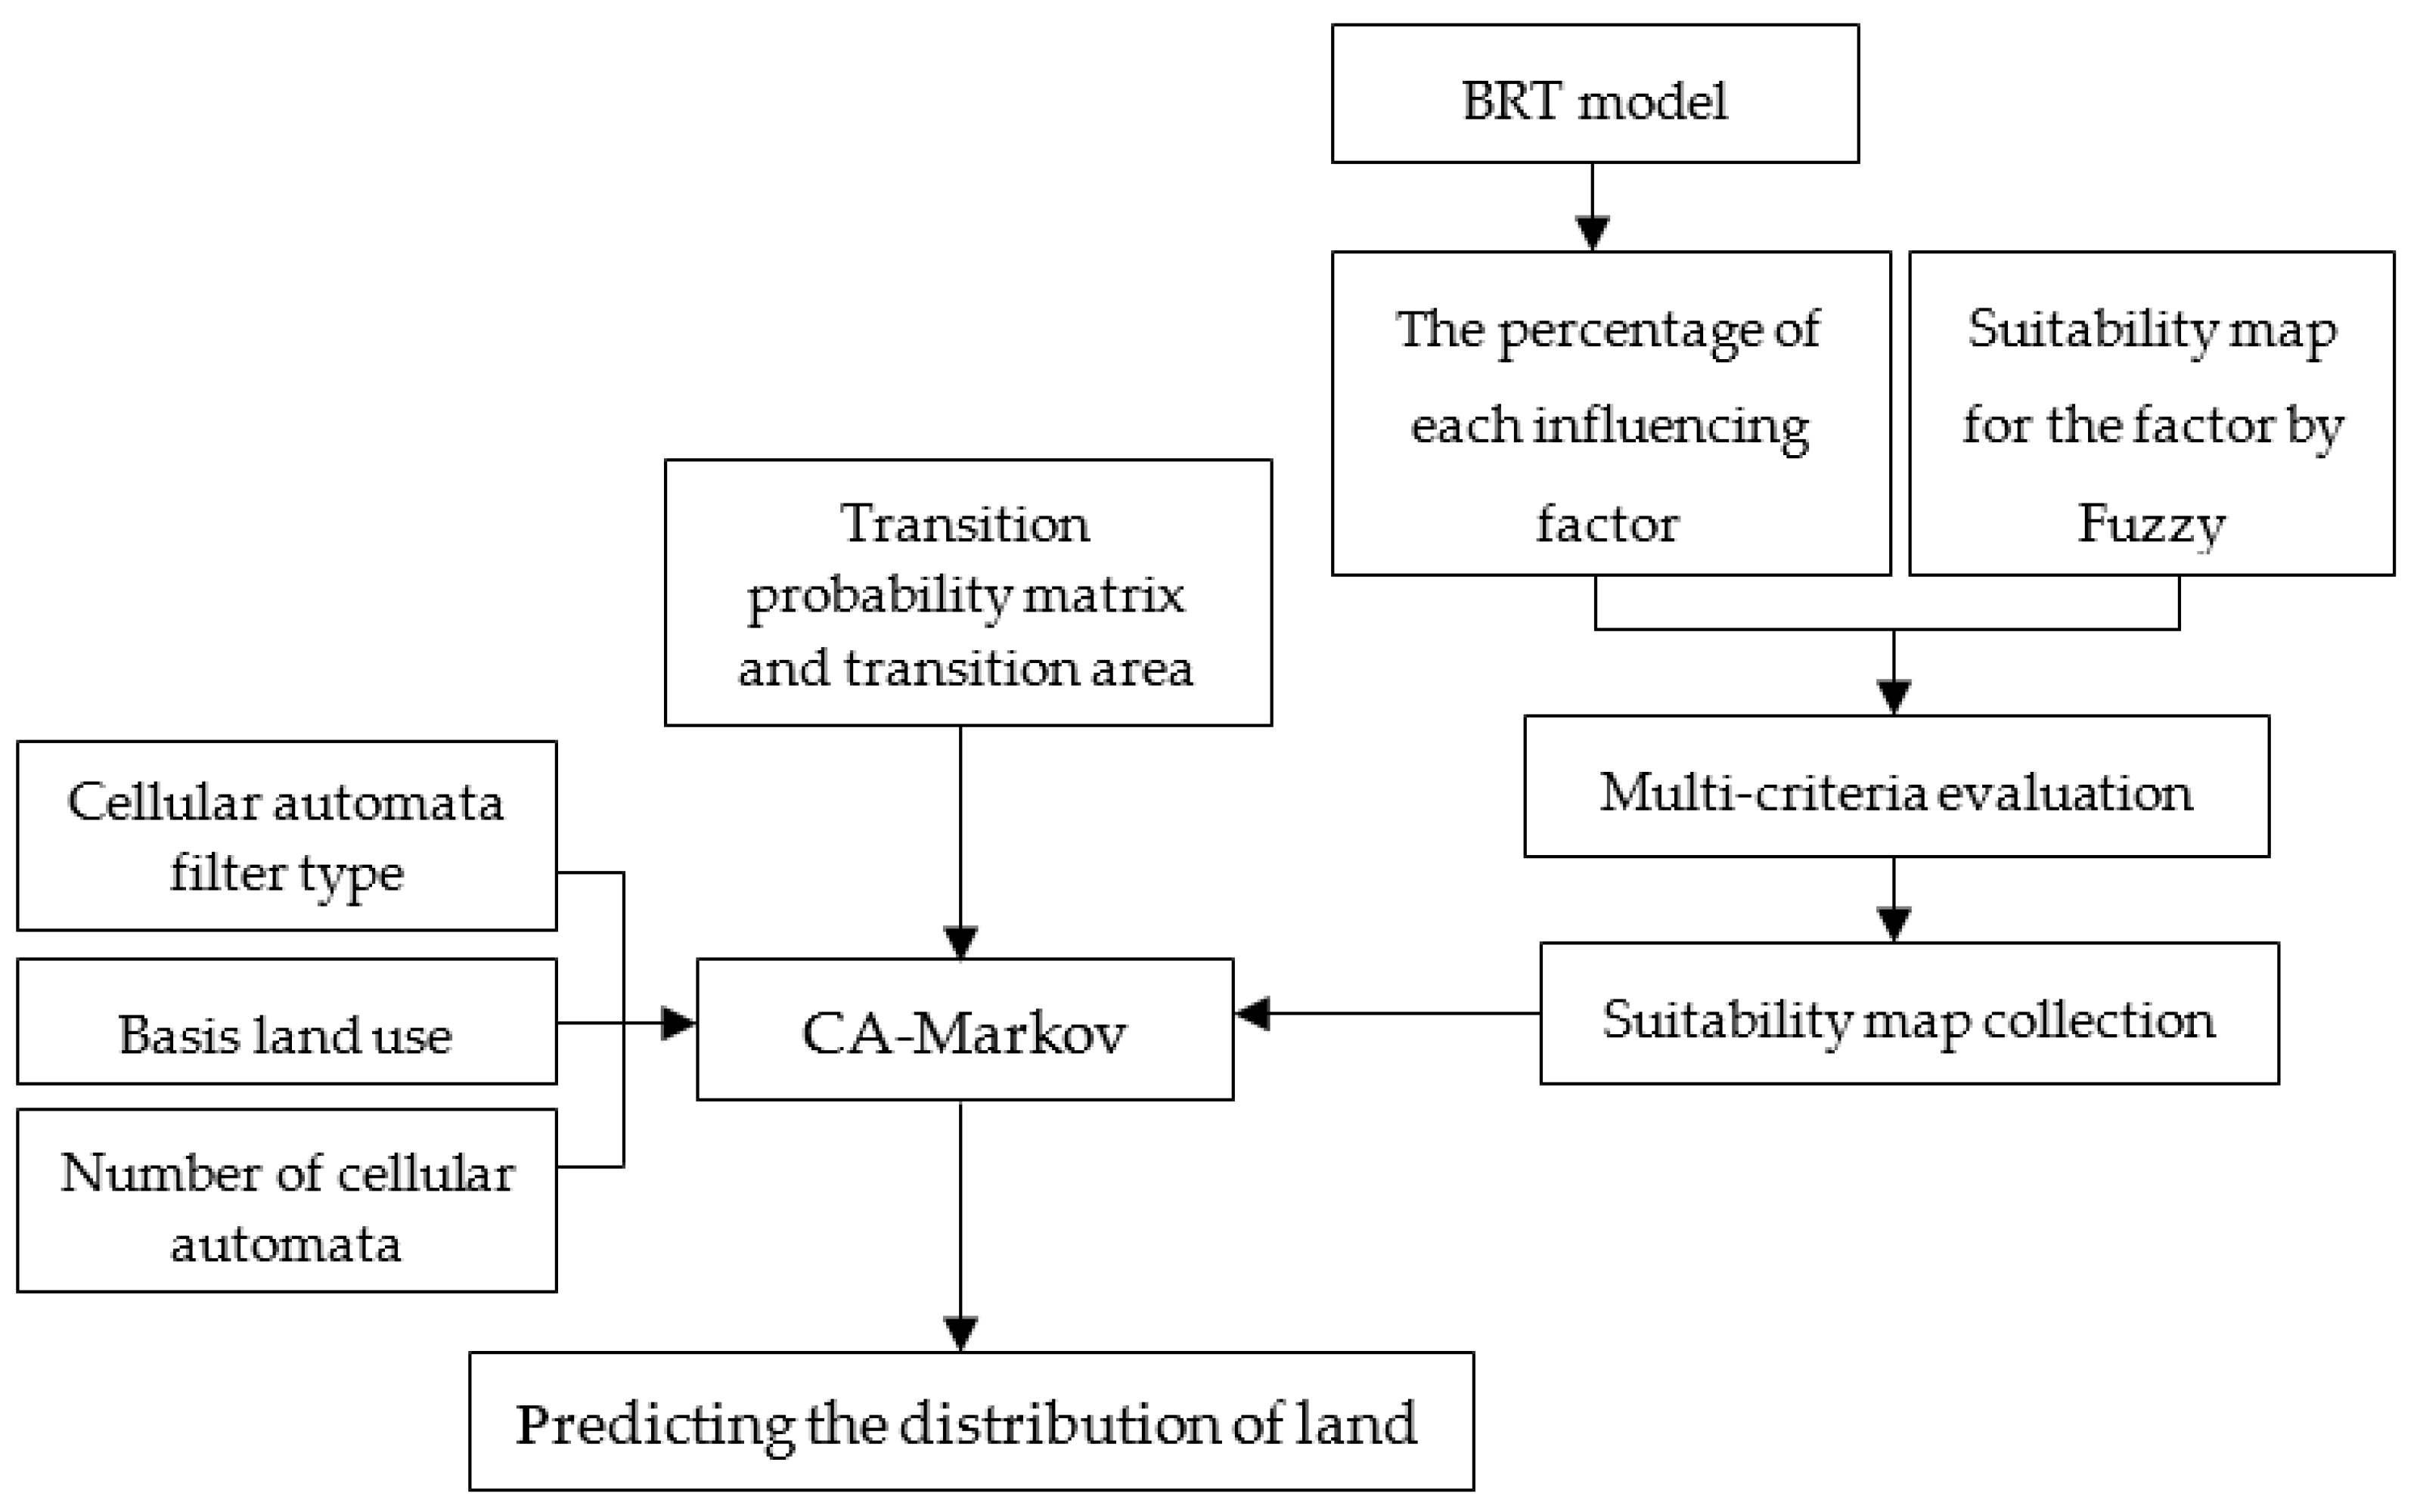
3.2. BRT-CA-Markov Model

3.2.1. BRT Model

BRT is a self-learning method based on Classified And Regression Trees (CART). The BRT combines the strengths of two algorithms: regression trees (models that relate a response to their predictors by recursive binary splits) and boosting (an adaptive method for combining many simple models to give improved predictive performance). It generates multiple regression trees by random selection and self-learning, which can improve the stability and prediction accuracy of the model [31,32]. The BRT model in R can be downloaded from the previous research [32].
At present, the BRT has been well applied to the driving force of the environmental pollution and land use change [33,34]. The BRT can calculate the percentage of influence of the independent variable on the dependent variable, as well as the relationship between the independent variable and the dependent variable when the other independent variables are considered as mean value or constant value [35]. The interaction between independent variables was not need to be considered in BRT, while the output is visible and easy to be understood.
Generally, the receiver-operating curve (ROC) is used to evaluate the classification accuracy of the model [36]. The ROC value (area under the curve) is a common criterion for evaluating the predictive performance of the predictive model. It is generally considered that when the ROC value is greater than 0.75, the independent variable results in a good explanatory power for the dependent variable [37]. The analysis used R language package of the BRT can be downloaded from the previous research [32].
In the study, 1 × 10⁴ sample points are randomly selected by ArcGIS. The land use value is assigned to be as the binary structure (zero, one) in the BRT model. That means, “one” is for the area of one unchanged land use type from 1995 to 2015, and “zero” is for the rest area during the years. The bagging fraction is 0.75, the learning rate is 0.005, and the tree complexity is 5 in BRT.

3.2.2. CA-Markov Model

The CA model and Markov model are discrete dynamic models of time and state. They are widely used in the simulation and prediction of land use [38]. According to the previous studies [12,14,38,39], the CA model can be expressed as:
S ( t , t + 1 ) = f ( ( S t ) , N )
where S is states of discrete cellular, t is the time instant, t + 1 is the coming future time instant respectively, f is the transformation rule of local space, N is the cellular field.
The Markov model for predicting land use changes can be presented using the conditional probability equation as:
S ( t + 1 ) = S ( t ) × P i j
P i j = [ p 11 p 12 p 1 n p 21 p 22 p 2 n p n 1 p n 2 p n n ]   ( 0 p i j 1 , j = 1 n p i j = 1 , i , j = 1 , 2 , , n )
where St and St+1 is land use status at time of t and t + 1, respectively, Pij is the transition probability matrix, i and j are the land use type at time of t and t + 1, respectively, n is the number of land use types.
The CA-Markov model can not only predict accurately in quantity, but also visually express the results in spatial distribution [14,40,41]. However, in the CA-Markov model, when the suitability map collection of the type of land use was making, the Analytical Hierarchy Process was generally used to determine the weight of each suitability map for the factor to create the suitability map collection of the type of land use, which is strong subjective.

3.2.3. BRT-CA-Markov Model

In this study, BRT-CA-Markov model combines BRT model with CA-Markov model to simulate land use, which is more objective. The BRT-CA-Markov model is based on the percentage value of the influencing factors of each type of land use, calculated by BRT, as the pretreatment of the model, which was used to calculate the weights of each corresponding suitability map collection. The suitability raster map value was standardized from 0 to 255 as the CA transition parameters by fuzzy membership function (e.g., J-shaped monotonically decreasing, Sigmoidal monotonically decreasing and linear function), with higher values indicating greater suitability. The suitability raster map for each factor was multiplied by each corresponding weight, so as to create the suitability maps collection by the superposition operation of the MCE (multi-criteria evaluation) to run the CA-Markov model in IDRISI 17.0 (Clark Labs, Clark University, Worcester, MA, USA) [6]. The suitability map of the CA-Markov model is more objective and reasonable, due to the quantitative analysis results of the BRT are directly applied to the production of suitability maps collection as the weights of the influencing factors.
The main implementation of processing architecture of the BRT–Markov–CA model is shown in Figure 2.
The Kappa coefficient can be used to analyze the accuracy assessment of the land use classification by comparing the actual classification results. In addition, it can also be used to measure the similarity of two images, which can be applied to assess the stationarity of the landscape [6,42,43]. The Kappa coefficient (Kc) is calculated as
K c = p 1 p 2 1 p 2
where P1 is the percentage of the observed agreement, and P2 is the percentage of the expected agreement.
When K ≤ 0.4, the number of grids overlapping between the simulated map and the actual map is small, the similarity between the two maps is low, the difference is high, and the simulation accuracy is low. When 0.4 < Kappa < 0.75, it is considered good, and Kappa ≥ 0.75 is better [44].
The simulated land use spatial distribution map of Hotan Oasis was compared to the actual map in 2015 by “Cross-Tabulation” in IDRISI 17.0 using the Kappa coefficient to test the spatial simulation accuracy of the model.

4. Results

4.1. The Influence of Factors on the Distribution of Land Use

Table 2 shows that the factors have good explanatory power for land use distribution, where all the values of ROC greater than 0.75. The weights of influence of the factors on the land use types can be seen in Table 3. The factor of distance from the village centers had the greatest influence on the distribution of the farm land, the factor of distance from roads had the greatest influence on the forestland, and the factor of population density, factor of distance to water body and factor of gross domestic product density had the greatest influence on the grassland, water body and built-up land, respectively. It indicated that the human factors that affected the land use distribution was major. Human activities such as the urban construction, irrigation projects construction, and road construction, etc., mainly changed the types of the land use.

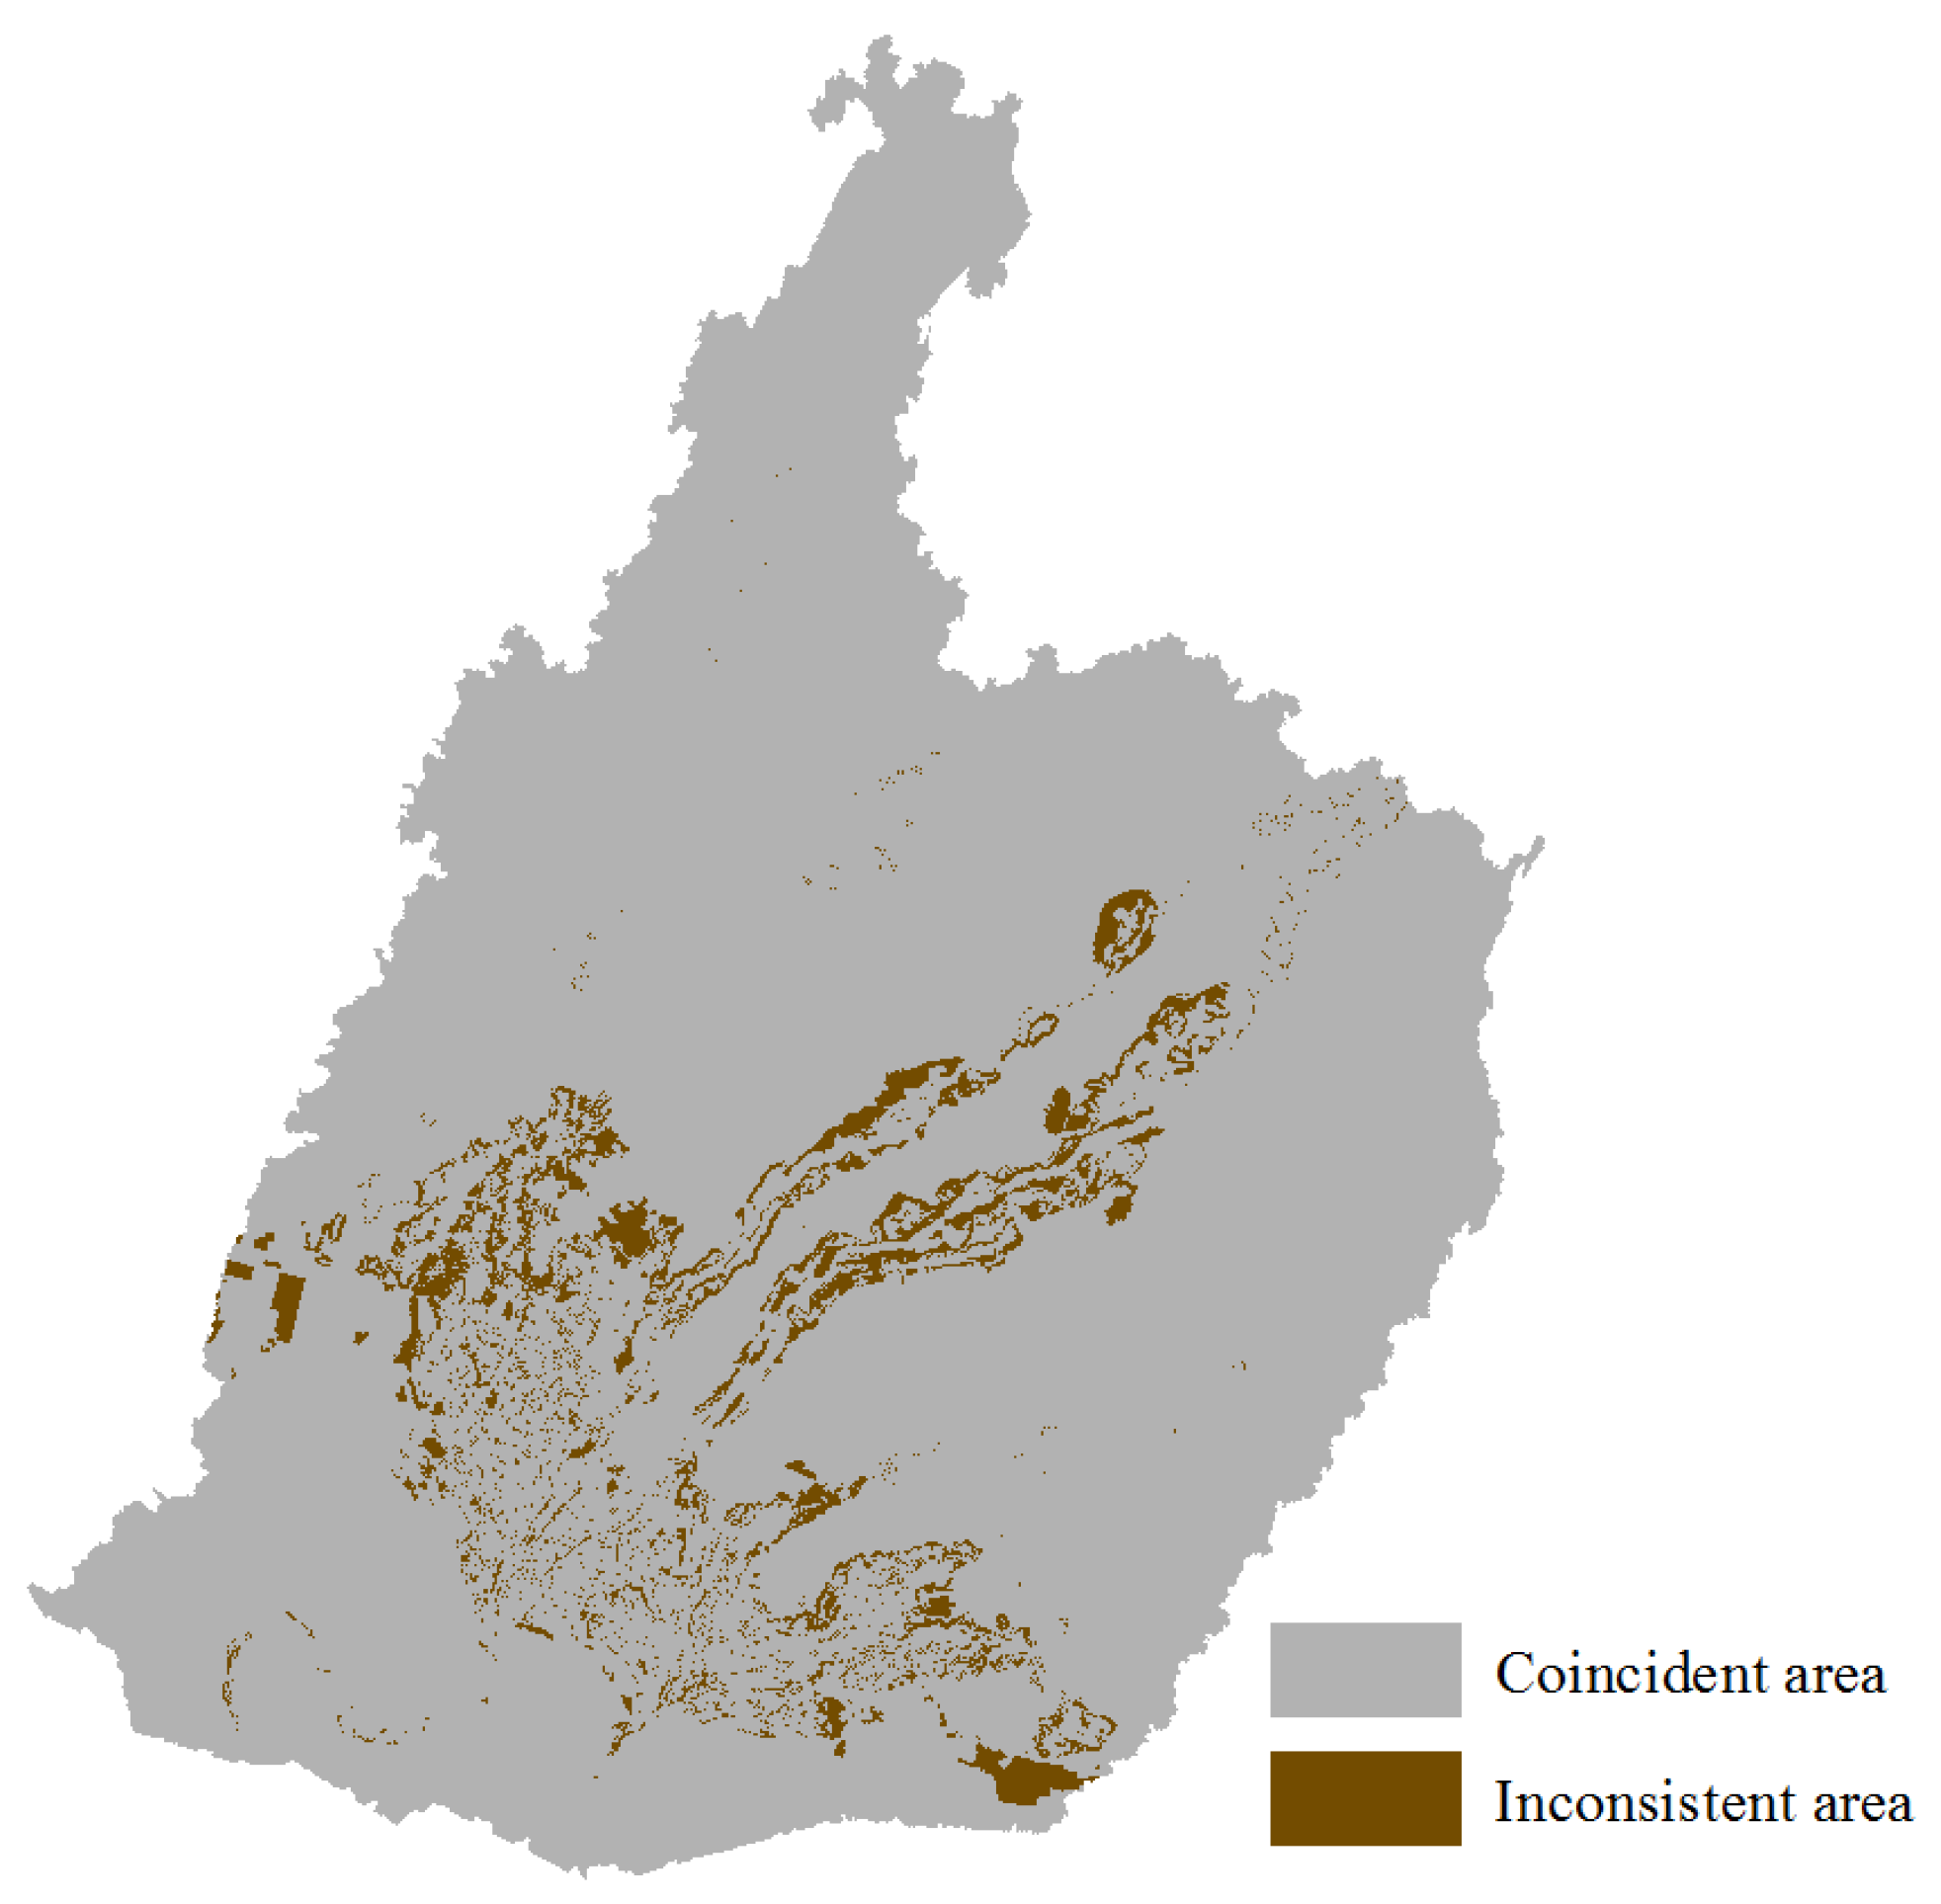
4.2. BRT-CA-Markov Model Validation

The BRT-CA-Markov model was used to predict the land use in 2015. Transition probability matrix and transition area between 1995 and 2005 were obtained by the IDRISI. The suitability raster map value was standardized by the fuzzy membership functions including J-shaped monotonically decreasing and Sigmoidal monotonically decreasing/increasing. Suitability maps collection was produced (Figure 3) considered the influence of factors (Table 3). A standard 5 × 5 contiguity filter [6] was used as the neighborhood definition in this study. The land use in 2005 was considered as a starting point, and selected ten CA iterations to simulate the predicted land use in 2015.
The distribution of the simulation land use in 2015 can be seen in Figure 4. Spatial error between simulation and actual land use in 2015 also can be seen in Figure 5. From the accuracy assessment for the simulation used by ArcGIS 10.2 (ESRI, Redlands, CA, USA) (Table 4), the Percentage Error of the spatial distribution of each land use was less than 16% and the Kc was 0.89. Therefore, it is practicable to use the BRT-CA-Markov model to predict land use in 2025 and 2035.

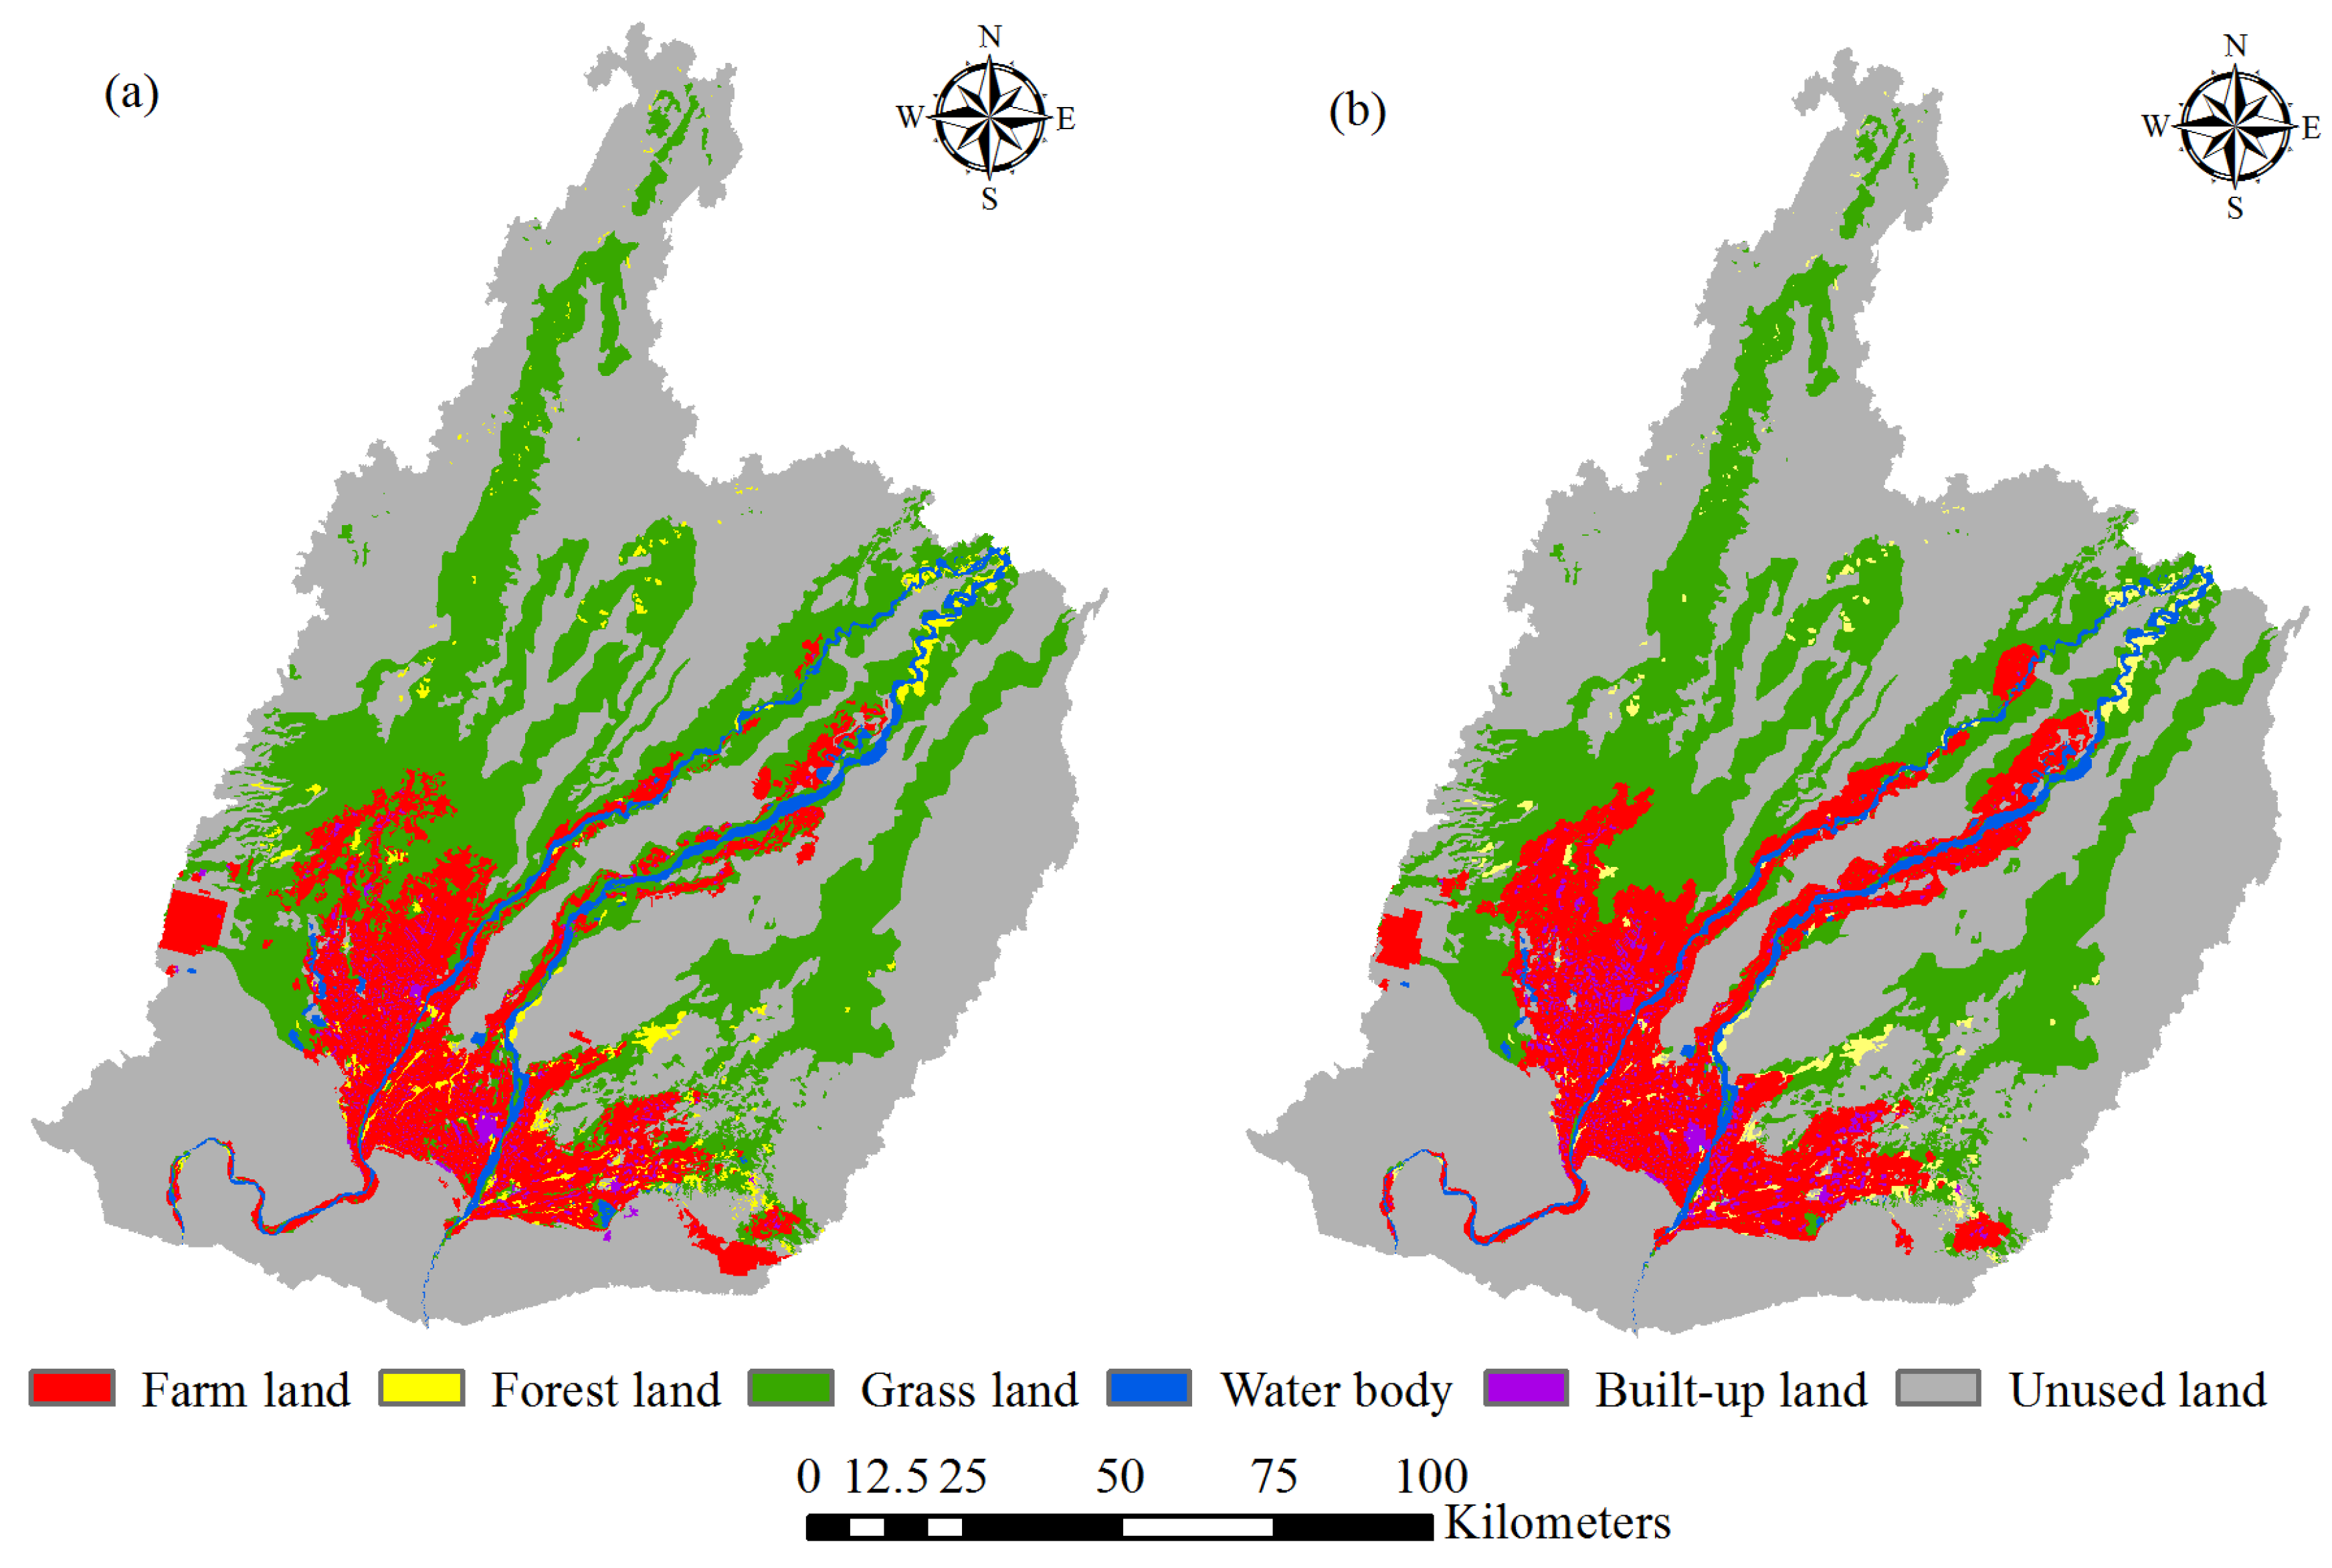
4.3. Land Use in 2025 and 2035

In this study, the land use in 2015 was considered as the initial year, the relative influence of factors on land use distribution, the suitability map collections of the land use, the transition probability matrix and transition area of the land use from 2005 to 2015 and ten CA iterations were input into the BRT-CA-Markov model to predict the spatial distribution of land use in 2025. Similarly, according to the previous study [14], the prediction of land use in 2035 should be set up 2025 as the initial year, and the transition probability matrix and transition area of land use from 2005 to 2015 and ten CA iterations should be input into the BRT-CA-Markov model.
The land use areas of each type were calculated by ArcGIS 10.2 (Table 5), from the simulation in 2025 and 2035 (Figure 6). The areas of the farmland, forestland, grassland, water area, built-up land and unused land in Hotan Oasis were 2175.65, 220.21, 4751.00, 399.65, 176.82 and 10,614.26 km2 in 2025, respectively. These areas would be 2321.46, 216.36, 4659.58, 404.46, 181.03 and 10,554.71 km2 in 2035, respectively.
The areas of farmland, built-up land and water body increased by 145.80, 4.22 and 4.84 km2 in 2025, respectively, compared with 2015. The areas of grassland, unused land and forestland continued to decrease by 91.44, 59.57 and 3.85 km2, respectively. Similarly, the area of farmland, built-up land and water body increased by 291.61, 8.43 and 9.56 km2 in 2035, respectively, compared with 2015, while the area of grassland, unused land and forestland continued to decrease by 182.86, 119.12 and 7.70 km2, respectively.

5. Discussion

There are many factors affect the accuracy of the CA-Markov model, such as the grid size, the selection of influencing factors and the processing methods of the suitable maps collection [3]. In this study, the grid of 30 m × 30 m was selected, and as many as ten factors that affect the land changes were analyzed for the simulation. The driving factor of the land use considered was more than other studies, even such as the factor of groundwater depth was assessed [14,45]. Many studies generally used the CA-Markov model based on the Analytic Hierarchy Process in operating of the MCE, which was been integrated in the IDRISI [22,41,46]. However, the simulation would be affected by the variance in expert opinions in the AHP, for that was usually relies on subjective standards in obtaining the weights of factors used. In recent years, the model was improved based on Frequency Ratio, which had yielded a good performance and accuracy. However, analyzing the factors was also artificial in generating suitable maps collection in that method [21]. In this study, the CA-Markov model based on the BRT model achieved a high satisfactory accuracy, and the simulation process was objective in the generation of the suitable maps collection due to the BRT. In order to verify the advantages of the BRT-CA-Markov further, the CA-Markov model based on the other models such as Analytic Hierarchy Process in the Hotan River Basin should be studied, and the accuracy of results will be compared.
For the total research area, the simulation has achieved a high satisfactory accuracy. However, the inconsistency in the land use seems to be in particular at some areas, such as the 224th regiment field in the southwest of the study area. The inconsistency of farmland is mainly because that Xinjiang Construction Corps is large-scale reclaiming the unused land, used the irrigation projects, to meet the planning of regional agricultural development during the periods. The prediction and simulation of future land use is based on the existing policies for all the land use models. The major policy adjustments made by the governments will cause more inconsistency in the simulation, which needs further discussion.
The increase tendency of the area of farmland indicated that the scope of reclaim wasteland was increase according to the study, although the China’s Grains for Green Policy (GGP) has driven one of the world’s largest conservation projects which was intended to sacrifice farmland for the amenity and environmental values provided by forestland, grassland and wetland [47]. The increasing area of farmland would need more water. On the other hand, water resources for the Hotan Oasis is scarce. Therefore, it is necessary for the government to formulate policies to increase the popularization and implementation of water-saving irrigation technology, and to improve the water use efficiency to meet the growth of farmland. Although the water body was probably increased due to the construction of hydraulic projects, that might not meet the requirements of water for the expansion of the farmland.
The decreasing trend of area of forestland and grassland indicates that the ecological environment is degenerating gradually, and it is necessary to strengthen water and soil conservation measures to curb this trend. The tendency of area of built-up land was increased, which was indicated that the residents demand for urbanization level increased continuously with the continuous development of economy and population, furthermore, the governments needs to make plans to prevent urban disorder expanding.

6. Conclusions

The creation process of suitability maps collection in the Boosted Regression Trees-cellular automata-Markov (BRT-CA-Markov) model is more objective to the CA-Markov model based on Analytical Hierarchy Process (AHP), also the BRT-CA-Markov model has yielded a good performance and accuracy. That will be useful in the research on land use prediction. The prediction of the land use in Hotan Oasis in 2025 and 2035 used the model is feasible. From the simulation, the areas of farmland, built-up land and water body in Hotan Oasis showed an increasing trend, while the areas of forestland, grassland and unused land continued to show a decreasing trend in 2025 and 2035. The government needs to formulate measures to improve the utilization rate of the water resources to meet the growth of farmland in such an arid and water-scarce area in Hotan Oasis. Meanwhile they need to monitor and control disorder expanding of farmland and increase ecological environment protection measures to curb the reduction of grassland and forestland for the ecological health.
Furthermore, the spatial-temporal pattern and optimal allocation of water–land resources under a changing environment in the Hotan River Basin will be studied, according to the results of this study and the spatial distribution of water resources in Hotan River Basin in the future.

Author Contributions

Conceptualization, S.W.; Project administration, X.J.; Software, L.W.; Validation, H.S.; Writing—original draft, S.W.; Writing—review & editing, A.G., M.K.S. & L.Z. All authors have read and agreed to the published version of the manuscript.

Funding

This work was financially supported by the National Key Research and Development Program of China (No. 2016YFC0400200 & No. 2017YFC0403303) and National Natural Science Foundation of China (No. 51669035).

Conflicts of Interest

The authors declare no conflict of interest.

References

  1. Luo, G.P.; Zhou, C.H.; Chen, X.; Li, Y. A methodology of characterizing status and trend of land changes in oases: A case study of Sangong River watershed, Xinjiang, China. J. Environ. Manag. 2008, 88, 775–783. [Google Scholar] [CrossRef]
  2. Wang, Z.Y.; Xu, D.Y.; Yang, H.; Ding, X.; Li, D.J. Impacts of climate change and human activities on vegetation dynamics in Inner Mongolia, 1981-2010. Prog. Geogr. 2017, 36, 1025–1032. [Google Scholar]
  3. Aburas, M.M.; Ho, Y.M.; Ramli, M.F.; Ash’aari, Z.H. The simulation and prediction of spatio-temporal urban growth trends using cellular automata models: A review. Int. J. Appl. Earth Obs. 2016, 52, 380–389. [Google Scholar] [CrossRef]
  4. Zhong, G.M.; Zhang, X.L.; Duan, J.L. Prediction of land use dynamic change in Zhengzhou using Markov process. J. Henan Agric. Univ. 2011, 45, 696–700. [Google Scholar]
  5. Nouri, J.; Gharagozlou, A.; Arjmandi, R.; Faryadi, S.; Adl, M. Predicting Urban Land Use Changes Using a CA–Markov Model. Arab. J. Sci. Eng. 2014, 39, 5565–5573. [Google Scholar] [CrossRef]
  6. Gong, W.F.; Yuan, L.; Fan, W.Y.; Stott, P. Analysis and simulation of land use spatial pattern in Harbin prefecture based on trajectories and cellular automata—Markov modelling. Int. J. Appl. Earth Obs. 2015, 34, 207–216. [Google Scholar] [CrossRef]
  7. Wang, S.Q.; Zheng, X.Q.; Zang, X.B. Accuracy assessments of land use change simulation based on Markov-cellular automata model. Procedia Environ. Sci. 2012, 13, 1238–1245. [Google Scholar] [CrossRef] [Green Version]
  8. Tian, H.; Liang, X.; Li, X.; Liu, X.P.; Ou, J.P.; Hong, Y.; He, Z.J. Simulating Multiple Land Use Scenarios in China during 2010–2050 Based on System Dynamic Model. Trop. Geol. 2017, 37, 547–561. [Google Scholar]
  9. Tang, Y.P. The applications of system dynamics model to the comprehensive land use planning of Shaanxi Province. J. Northwest Univ. (Nat. Sci. Ed.) 2012, 42, 1007–1010. [Google Scholar]
  10. Ou, Z.K.; Tang, N.Q.; Zhang, L.M. Evaluation of intensive land use in development zone based on BP artificial neural network—A case of Fujian Province. J. Fujian Agric. For. Univ. (Nat. Sci. Ed.) 2014, 43, 424–429. [Google Scholar]
  11. Zhang, X.Y.; Wu, S.D. Explore and Analysis of Regional Land Use Intensity Evaluation Based on BP Neural Network-A Case of Zhangzhou. J. Ningxia Univ. (Nat. Sci. Ed.) 2010, 31, 93–97. [Google Scholar]
  12. Mondal, B.; Das, D.N.; Bhatta, B. Integrating cellular automata and Markov techniques to generate urban development potential surface: A study on Kolkata agglomeration. Geocarto Int. 2016, 32, 401–419. [Google Scholar] [CrossRef]
  13. Durmusoglu, Z.O.; Tanriover, A.A. Modelling land use/cover change in Lake Mogan and surroundings using CA-Markov Chain Analysis. J. Environ. Biol. 2017, 38, 981–989. [Google Scholar] [CrossRef]
  14. Guan, D.; Li, H.; Inohae, T.; Su, W.; Nagaie, T.; Hokao, K. Modeling urban land use change by the integration of cellular automaton and Markov model. Ecol. Model. 2011, 222, 3761–3772. [Google Scholar] [CrossRef]
  15. Louca, M.; Vogiatzakis, I.N.; Moustakas, A. Modelling the combined effects of land use and climatic changes: Coupling bioclimatic modelling with Markov-chain Cellular Automata in a case study in Cyprus. Ecol. Inform. 2015, 30, 241–249. [Google Scholar] [CrossRef] [Green Version]
  16. Mondal, P.; Southworth, J. Evaluation of conservation interventions using a cellular automata-Markov model. Forest Ecol. Manag. 2010, 260, 1716–1725. [Google Scholar] [CrossRef]
  17. Adhikari, S.; Southworth, J. Simulating forest cover changes of Bannerghatta national park based on a CA-Markov Model: A remote sensing approach. Remote Sens. 2012, 4, 3215–3243. [Google Scholar] [CrossRef] [Green Version]
  18. Sang, L.L.; Zhang, C.; Yang, J.Y.; Zhu, D.H.; Yun, W.J. Simulation of land use spatial pattern of towns and villages based on CA-Markov model. Math. Comput. Model. 2011, 54, 938–943. [Google Scholar] [CrossRef]
  19. Vaz, E.; Arsanjani, J.J. Predicting Urban Growth of the Greater Toronto Area-Coupling a Markov Cellular Automata with Document Meta-Analysis. J. Environ. Inform. 2015, 25, 71–80. [Google Scholar] [CrossRef]
  20. Jokar Arsanjani, J.; Helbich, M.; Kainz, W.; Darvishi Boloorani, A. Integration of logistic regression, Markov chain and cellular automata models to simulate urban expansion. Int. J. Appl. Earth Obs. 2013, 21, 265–275. [Google Scholar] [CrossRef]
  21. Aburas, M.M.; Ho, Y.M.; Ramli, M.F.; Ash’aari, Z.H. Improving the capability of an integrated CA-Markov model to simulate spatio-temporal urban growth trends using an Analytical Hierarchy Process and Frequency Ratio. Int. J. Appl. Earth Obs. 2017, 59, 65–78. [Google Scholar] [CrossRef]
  22. Yang, X.; Zheng, X.Q.; Lv, L.N. A spatiotemporal model of land use change based on ant colony optimization, Markov chain and cellular automata. Ecol. Model. 2012, 233, 11–19. [Google Scholar] [CrossRef]
  23. Dou, Y.; Chen, X.; Bao, A.M. Eco-environmental responses of land use and cover change in nearly 40 years in the Hotan River Basin. Arid Land Geol. 2008, 31, 449–455. [Google Scholar]
  24. Chen, Z.S.; Chen, Y.N.; Li, H.W. Land use/cover change and their driving forces in hotan river basin of xinjiang. J. Desert Res. 2010, 30, 326–333. [Google Scholar]
  25. Liu, W.; Xu, Y.P.; Huang, Y. Effects of Global Warming on Precipitation and Runoff Volume in Xinjiang. Arid Land Geol. 2005, 28, 597–602. [Google Scholar]
  26. Wang, S.F.; Jiao, X.Y.; Wang, L.P.; Sang, H.H.; Salahou, M.K.; Maimaitiyiming, A. Assessing climate change impacts on water resources of the Hotan Oasis using SWAT Model, Northwest China. Fresen. Environ. Bull. 2019, 28, 1801–1810. [Google Scholar]
  27. Shen, B.; Huang, L.M.; Ruan, B.Q.; Luo, G.M. Influence of discharge variation on fluvial process of the Lower Yellow River. J. Hydraul. Eng. 2003, 34, 78–83. [Google Scholar]
  28. Zhang, X.W.; Shen, B.; Huang, L.M. Study on the Variation Law of the Annual Runoff in Hotan River. J. Nat. Res. 2007, 22, 974–979. [Google Scholar]
  29. Luo, M.; Meng, F.H.; Liu, T.; Duan, Y.C.; Frankl, A.; Kurban, A.; Maeyer, P.D. Multi–model ensemble approaches to assessment of effects of local climate change on water resources of the hotan river basin in Xinjiang, China. Water 2017, 9, 5840. [Google Scholar] [CrossRef]
  30. Chen, Y.N. Study on eco-hydrological problems of Tarim River Basin in Xinjiang, 1st ed.; Science Press: Beijing, China, 2010; pp. 0–865. [Google Scholar]
  31. De’Ath, G. Boosted trees for ecological modeling and prediction. Ecology. 2007, 88, 243–251. [Google Scholar] [CrossRef]
  32. Elith, J.; Leathwick, J.R.; Hastie, T. A working guide to boosted regression trees. J. Anim Ecol. 2008, 77, 802–813. [Google Scholar] [CrossRef]
  33. Yin, C.; Liu, M.; Sun, F.Y.; Li, C.L.; Xiang, W.N. Influencing factors of non-point source pollution of watershed based on boosted regression tree algorithm. Chin. J. Appl. Ecol. 2016, 27, 911–919. [Google Scholar]
  34. Li, C.L.; Liu, M.; Hu, Y.M.; XU, Y.Y.; Sun, F.Y. Driving forces analysis of urban expansion based on boosted regression trees and Logistic regression. Acta Ecol. Sin. 2014, 34, 727–737. [Google Scholar]
  35. Cai, W.H.; Yang, J.; Lv, Z.H.; Hu, Y.M.; Lv, S.J.; Xing, G.Z.; Zhao, Z.F. Controls of post-fire tree recruitment in Great Xing’an Mountains in Heilongjiang Province. Acta Ecol. Sin. 2012, 32, 3303–3312. [Google Scholar]
  36. Pontius, R.G.; Schneider, L.C. Land-cover change model validation by an ROC method for the Ipswich watershed, Massachusetts, USA. Agric. Ecosyst. Environ. 2001, 85, 239–248. [Google Scholar] [CrossRef]
  37. Wang, Y.H.; Yu, Q.; Yue, D.P.; Zhang, Q.B.; Ma, H. Simulation of Land use Based on BRT_DC_Pd Model. Trans. Chin. Soc. Agric. Machinery 2018, 49, 225–234. [Google Scholar]
  38. Al-sharif, A.A.; Pradhan, B. Monitoring and predicting land use change in Tripoli Metropolitan City using an integrated Markov chain and cellular automata models in GIS. Arab. J. Geosci. 2014, 7, 4291–4301. [Google Scholar] [CrossRef]
  39. Munthali, M.G.; Mustak, S.; Adeola, A.; Botai, J.; Singh, S.K.; Davis, N. Modelling land use and land cover dynamics of Dedza district of Malawi using hybrid Cellular Automata and Markov model. Remote Sens. Appl.: Soc. Environ. 2020, 17, 100276. [Google Scholar] [CrossRef]
  40. Derya, O. Urban Growth Simulation of Atakum (Samsun, Turkey) Using Cellular Automata-Markov Chain and Multi-Layer, Perceptron-Markov Chain Models. Remote Sens. 2015, 7, 5918–5950. [Google Scholar]
  41. Kityuttachai, K.; Tripathi, N.K.; Tipdecho, T.; Shrestha, R. CA-Markov Analysis of Constrained Coastal Urban, Growth Modeling: Hua Hin Seaside City, Thailand. Sustainability 2013, 5, 1480–1500. [Google Scholar] [CrossRef] [Green Version]
  42. Ozturk, D. Modelling spatial changes in coastal areas of Samsun (Turkey) using a Cellular Automata-Markov chain method. Teh. Vjesn. 2017, 241, 99–107. [Google Scholar]
  43. Luo, G.P.; Amuti, T.; Zhu, L.; Mambetov, B.T.; Maisupova, B.; Zhang, C. Dynamics of landscape patterns in an inland river delta of Central Asia based on a cellular automata-Markov model. Reg. Environ. Chang. 2015, 15, 277–289. [Google Scholar] [CrossRef]
  44. Donker, D.K.; Hasman, A.; Geijn, H.P.V. Interpretation of low kappa values. Int. J. Biomed Comput. 1993, 33, 55–64. [Google Scholar] [CrossRef]
  45. Yang, Y.Y.; Zhang, S.W.; Yang, J.C.; Xing, X.S.; Wang, D.Y. Using a Cellular Automata-Markov Model to Reconstruct Spatial Land-Use Patterns in Zhenlai County, Northeast China. Energies 2015, 8, 3882–3902. [Google Scholar] [CrossRef]
  46. Kamusoko, C.; Aniya, M.; Adi, B.; Manjoro, M. Rural sustainability under threat in Zimbabwe–simulation of future land use/cover changes in the Bindura district based on the Markov-cellular automata model. Appl. Geogr. 2009, 29, 435–447. [Google Scholar] [CrossRef]
  47. Ye, L.; Ranst, E.V. Production scenarios and the effect of soil degradation on long-term food security in China. Global Environ. Chang. 2009, 19, 464–481. [Google Scholar] [CrossRef]
Figure 1. The research location of Hotan Oasis.
Sustainability 12 01396 g001
Figure 2. The main implementation of processing architecture of the Boosted Regression Trees (BRT)-CA-Markov.
Sustainability 12 01396 g002
Figure 3. Suitability maps collection in Hotan Oasis.
Sustainability 12 01396 g003
Figure 4. Distribution of the land use in 2015 (a: actual land use, b: simulation land use).
Sustainability 12 01396 g004
Figure 5. Spatial error between simulation and actual land use in 2015.
Sustainability 12 01396 g005
Figure 6. Distribution of the simulation land use ((a) 2025, (b) 2035).
Sustainability 12 01396 g006
Table 1. The scale of each factor.
FactorsFactors AttributeUnitScale
ElevationNatural Factorsm1095.00–2858.00
Slopedegree0–76.32
Annual Precipitationmm52.67–233.85
Annual Temperature5.43–13.52
Groundwater Depthm0.22–0.43
Population DensityHuman Factorsperson/km22.09–3800.25
Gross domestic Product Densityyuan/km20.2–5833.57
Distance to Water Bodykm0–105.95
Distance to Roadskm0–82.09
Distance to the Village Centerskm0–120.62
Table 2. Results of the receiver-operating curve (ROC) analysis.
DateFarmlandForestlandGrasslandWater BodyBuilt-Up LandUnused Land
Training Data0.9840.9730.9900.9980.9920.996
Validation Data0.9840.9700.9860.9980.9920.994
Table 3. The weights of influence of factors on land use distribution (%).
FactorsFarmlandForestlandGrasslandWater BodyBuilt-Up LandUnused Land
Elevation1.66.415.38.64.13.1
Slope1.13.01.23.47.70.7
Annual Precipitation1.66.02.86.46.91.6
Annual Temperature1.95.83.45.37.62.3
Groundwater DEPTH2.15.54.09.85.73.4
Population density4.18.634.410.811.120.4
Gross Domestic Product Density31.020.328.97.327.158.7
Distance to Water Body2.95.13.626.78.27.5
Distance to Roads17.628.43.216.06.40.8
Distance to the Village Centers36.110.83.25.715.21.5
Table 4. Accuracy assessment for simulation of the land use in 2015.
DateFarmlandForestlandGrasslandWater BodyBuilt-Up LandUnused Land
Actual Pixels2,255,384248,9615,380,486438,675191,77911,859,811
Simulation Pixels2,638,4442512754,796,339417,759278,02811,993,251
Percentage Error15.5215.4613.417.346.240.01
Kc0.89
Table 5. Each land classification area in 2025 and 2035 (km2).
Land Classification2015 2025 Change of 2015 to 2025 2035 Change of 2015 to 2035
Farmland2029.852175.65145.802321.46 291.61
Forestland224.06220.21−3.85216.36 −7.70
Grassland4842.444751.00−91.444659.58 −182.86
Water Body394.81399.654.84404.46 9.65
Built-Up Land172.60176.824.22181.03 8.43
Unused Land10,673.8310,614.26−59.5710,554.71 −119.12

