Lean Tools, Knowledge Management, and Lean Sustainability: The Moderating Effects of Study Conventions


Abstract
1. Introduction
2. Related Work
3. Theoretical Background and Research Hypothesis
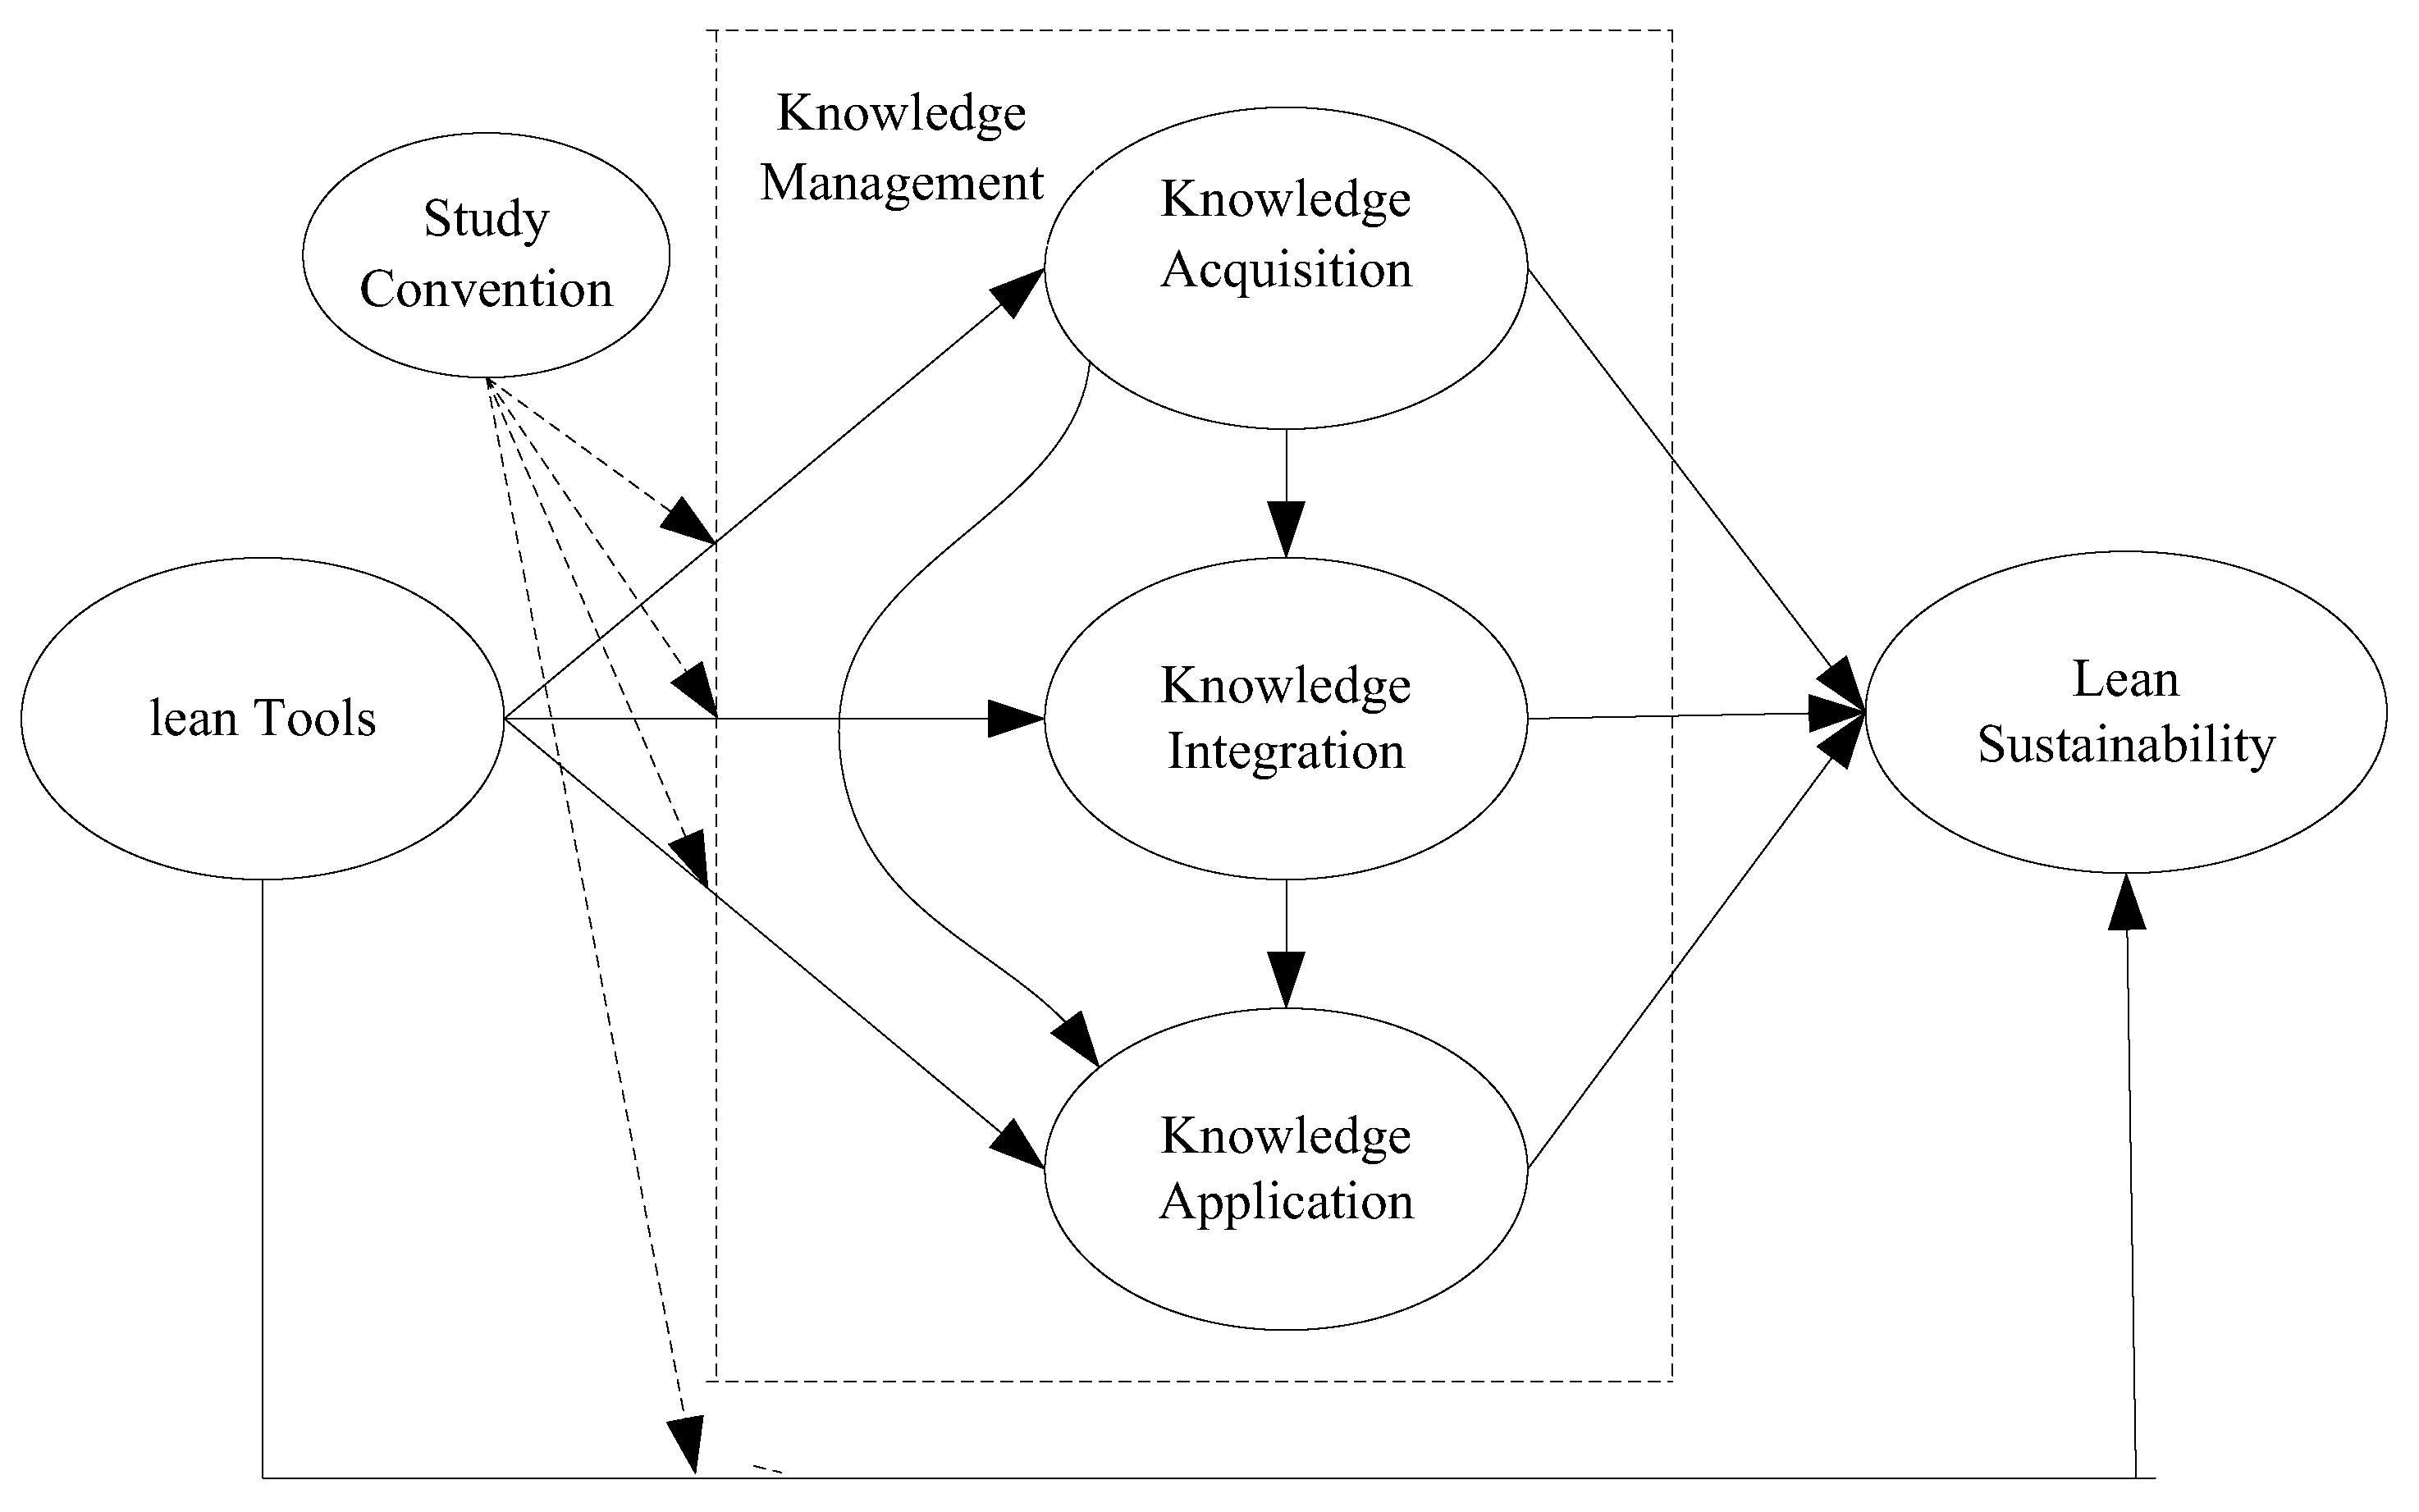
3.1. Lean Tools and Knowledge Management
- Hypothesis 1a: The application of lean tools has a positive effect on knowledge acquisition
- Hypothesis 1b: The application of lean tools has a positive effect on knowledge integration
- Hypothesis 1c: The application of lean tools has a positive effect on knowledge application
3.2. The Basic Process and Interaction of Knowledge Management
- Hypothesis 2a: knowledge acquisition has a positive impact on knowledge integration
- Hypothesis 2b: knowledge integration has a positive impact on knowledge application
- Hypothesis 2c: knowledge acquisition has a positive impact on knowledge application
3.3. Knowledge Management and Lean Sustainability
- Hypothesis 3a: Knowledge acquisition has a positive effect on lean sustainability
- Hypothesis 3b: Knowledge integration has a positive impact on lean sustainability
- Hypothesis 3c: Knowledge applications have a positive impact on lean sustainability
3.4. Lean Tools and Lean Sustainability
- Hypothesis 4a: The use of lean tools has a positive effect on lean sustainability
3.5. The Moderating Effect of Study Convention
- Hypothesis 5a: Study conventions positively modulate the relationship between lean tools and knowledge acquisition
- Hypothesis 5b: Study conventions positively modulate the relationship between lean tools and knowledge integration.
- Hypothesis 5c: Study conventions positively modulate the relationship between lean tools and knowledge application.
- Hypothesis 5d: Study conventions positively modulate the relationship between lean tools and lean sustainability.
4. Research Methods
4.1. Samples Election and Data Collection
4.2. Variable Measurement
4.2.1. Lean Tools
4.2.2. Knowledge Management
4.2.3. Lean Sustainability
4.2.4. Study Convention
5. Research Results
5.1. Descriptive Statistics
5.2. Reliability Analysis
5.3. Validity Analysis
5.3.1. Exploratory Factor Analysis
5.3.2. Confirmatory Factor Analysis
5.4. Structural Equation Model
5.5. Multi-Group Structural Equation Model
6. Conclusions
Author Contributions
Funding
Conflicts of Interest
References
- Honarpour, A.; Jusoh, A.; Long, C.S. Knowledge management and total quality management: A reciprocal relationship. Knowl. Manag. Tqm 2017, 34, 91–102. [Google Scholar]
- Anand, G.; Ward, P.T.; Tatikonda, M.V. Role of explicit and tacit knowledge in six sigma projects: An empirical examination of differential project success. J. Oper. Manag. 2010, 28, 303–315. [Google Scholar] [CrossRef]
- Acar, M.F.; Tarim, M.; Zaim, H.; Zaim, S.; Delen, D. Knowledge management and ERP: Complementary or contradictory? Int. J. Inf. Manag. 2017, 37, 703–712. [Google Scholar] [CrossRef]
- Ataseven, C.; Nair, A. Assessment of supply chain integration and performance relationships: A meta-analytic investigation of the literature. Int. J. Prod. Econ. 2017, 185, 252–265. [Google Scholar] [CrossRef]
- Tregear, A. Progressing knowledge in alternative and local food networks: Critical reflections and a research agenda. J. Rural Stud. 2011, 27, 419–430. [Google Scholar] [CrossRef]
- Blay-Palmer, A.; Santini, G.; Dubbeling, M.; Renting, H.; Taguchi, M.; Giordano, T. Validating the city region food system approach: Enacting inclusive, transformational city region food systems. Sustainability 2018, 10, 1680. [Google Scholar] [CrossRef]
- Azadegan, A.; Patel, P.C.; Zangoueinezhad, A. The effect of environmental complexity and environmental dynamism on lean practices. J. Oper. Manag. 2013, 31, 193–212. [Google Scholar] [CrossRef]
- Belekoukias, I.; Garza-Reyes, J.A.; Kumar, V. The impact of lean methods and tools on the operational performance of manufacturing organisations. Int. J. Prod. Res. 2014, 52, 5346–5366. [Google Scholar] [CrossRef]
- Becker, M.C. A framework for applying organizational routines in empirical research: Linking antecedents, characteristics and performance outcomes of recurrent interaction patterns. Ind. Corp. Chang. 2005, 14, 817–846. [Google Scholar] [CrossRef]
- Atkinson, R.; Dörfler, T.; Hasanov, M.; Rothfuss, E.; Smith, I. Making the case for self-organisation: Understanding how communities make sense of sustainability & climate change through collective action. Int. J. Sustain. Soc. 2017, 9, 193–209. [Google Scholar]
- Arumugam, V.; Antony, J.; Kumar, M. Linking learning and knowledge creation to project success in Six Sigma projects: An empirical investigation. Int. J. Prod. Econ. 2013, 141, 388–402. [Google Scholar] [CrossRef]
- Bhasin, S. Performance of lean in large organisations. J. Manuf. Syst. 2013, 31, 349–357. [Google Scholar] [CrossRef]
- Staats, B.R.; Brunner, D.J.; Upton, D.M. Lean principles, learning, and knowledge work: Evidence from a software services provider. J. Oper. Manag. 2011, 29, 376–390. [Google Scholar] [CrossRef]
- Hasanov, M.; Zuidema, C. The transformative power of self-organization: Towards a conceptual framework for understanding local energy initiatives in the Netherlands. Energy Res. Soc. Sci. 2018, 37, 85–93. [Google Scholar] [CrossRef]
- Loebbecke, C.; van Fenema, P.C.; Powell, P. Managing inter-organizational knowledge sharing. J. Strateg. Inf. Syst. 2016, 25, 4–14. [Google Scholar] [CrossRef]
- Lin, H. Knowledge sharing and firm innovation capability: An empirical study. Int. J. Manpow. 2007, 28, 315–332. [Google Scholar] [CrossRef]
- Ritala, P.; Husted, K.; Olander, H.; Michailova, S. External knowledge sharing and radical innovation: The downsides of uncontrolled openness. J. Knowl. Manag. 2018, 22, 1104–1123. [Google Scholar] [CrossRef]
- Inkpen, A.C.; Tsang, E.W. Reflections on the 2015 decade award—Social Capital, networks, and knowledge transfer: An emergent stream of research. Acad. Manag. Rev. 2016, 41, 573–588. [Google Scholar] [CrossRef]
- Albrecht, C.; Smithers, J. Reconnecting through local food initiatives? Purpose, practice and conceptions of ‘value’. Agric. Hum. Values 2018, 35, 67–81. [Google Scholar] [CrossRef]
- Breschi, S.; Lissoni, F. Localised knowledge spillovers vs innovative milieu: Knowledge ‘tacitness’ reconsidered. Pap. Reg. Sci. 2001, 80, 255–273. [Google Scholar] [CrossRef]
- Browning, T.R.; Heath, R.D. Reconceptualizing the effects of lean on production costs with evidence from the F-22 Program. J. Oper. Manag. 2009, 27, 23–44. [Google Scholar] [CrossRef]
- Camacho-Miñano, M.M.; Moyano-Fuentes, J.; Sacristán-Díaz, M. What can we learn from the evolution of research on lean management assessment? Int. J. Prod. Res. 2013, 51, 1098–1116. [Google Scholar] [CrossRef]
- Carlile, P.R. Transferring, translating and transforming: An integrative framework for managing knowledge across boundaries. Organ. Sci. 2004, 15, 555–568. [Google Scholar] [CrossRef]
- Carlile, P.R. A pragmatic view of knowledge and boundaries: Boundary objects in new product development. Organ. Sci. 2002, 13, 442–455. [Google Scholar] [CrossRef]
- Carlile, P.R.; Rebentisch, E.S. Into the black box: The knowledge transformation cycle. Manag. Sci. 2003, 49, 1180–1195. [Google Scholar] [CrossRef]
- Phong, L.B.; Hui, L.; Son, T.T. How leadership and trust in leaders foster employees’ behavior toward knowledge sharing. Soc. Behav. Pers.: Int. J. 2018, 46, 705–720. [Google Scholar] [CrossRef]
- Lynch, R.; Jin, Z. Knowledge and innovation in emerging market multinationals: The expansion paradox. J. Bus. Res. 2016, 69, 1593–1597. [Google Scholar] [CrossRef]
- Delery, J.E.; Roumpi, D. Strategic human resource management, human capital and competitive advantage: Is the field going in circles? Hum. Res. Manag. J. 2017, 27, 1–21. [Google Scholar] [CrossRef]
- Prajogo, D.I.; Oke, A. Human capital, service innovation advantage, and business performance: The moderating roles of dynamic and competitive environments. Int. J. Oper. Prod. Manag. 2016, 36, 974–994. [Google Scholar] [CrossRef]
- Ritala, P.; Olander, H.; Michailova, S.; Husted, K. Knowledge sharing, knowledge leaking and relative innovation performance: An empirical study. Technovation 2015, 35, 22–31. [Google Scholar] [CrossRef]
- Boadu, F.; Xie, Y.; Du, Y.F.; Dwomo-Fokuo, E. MNEs subsidiary training and development and firm innovative performance: The moderating effects of tacit and explicit knowledge received from headquarters. Sustainability 2018, 10, 4208. [Google Scholar] [CrossRef]
- Chavez, R.; Gimenez, C.; Fynes, B. Internal lean practices and operational performance: The contingency perspective of industry clockspeed. Int. J. Oper. Prod. Manag. 2013, 33, 562–588. [Google Scholar] [CrossRef]
- Chavez, R.; Yu, W.; Jacobs, M. Internal lean practices and performance: The role of technological turbulence. Int. J. Prod. Econ. 2015, 160, 157–171. [Google Scholar] [CrossRef]
- Cil, I.; Turkan, Y.S. An ANP-based assessment model for lean enterprise transformation. Int. J. Adv. Manuf. Technol. 2013, 64, 1113–1130. [Google Scholar] [CrossRef]
- Demeter, K.; Matyusz, Z. The impact of lean practices on inventory turnover. Int. J. Prod. Econ. 2011, 133, 154–163. [Google Scholar] [CrossRef]
- Frank, A.G.; Ribeiro, J.L.D. Influence factors and process stages of knowledge transfer between NPD teams: A model for guiding practical improvements. Int. J. Qual. Reliab. Manag. 2014, 31, 222–237. [Google Scholar] [CrossRef]
- Fullerton, R.R.; Wempe, W.F. Lean manufacturing, non-financial performance measures and financial performance. Int. J. Oper. Prod. Manag. 2009, 29, 214–240. [Google Scholar] [CrossRef]
- Xie, Y.; Du, Y.F.; Boadu, F.; Shi, X.Y. Executives assessments of evolutionary and leapfrog modes: An ambidexterity explanation logic. Sustainability 2018, 10, 2893. [Google Scholar] [CrossRef]
- Chowhan, J.; Pries, F.; Mann, S. Persistent innovation and the role of human resource management practices, work organization, and strategy. J. Manag. Organ. 2017, 23, 456–471. [Google Scholar] [CrossRef]
- Garud, R.; Nayyar, P.R. Transformative capacity: Continual structuring by intertemporal technology transfer. Strateg. Manag. J. 1994, 15, 365–385. [Google Scholar] [CrossRef]
- Garrick, J.; Chan, A.; Carayannis, E.; Bedford, D. Knowledge management and professional experience: The uneasy dynamics between tacit knowledge and performativity in organizations. J. Knowl. Manag. 2017, 21, 872–884. [Google Scholar] [CrossRef]
- Maravilhas, S.; Martins, J. Strategic knowledge management in a digital environment: Tacit and explicit knowledge in Fab Labs. J. Bus. Res. 2019, 94, 353–359. [Google Scholar] [CrossRef]
- Kaabi, A.A.A.; Elanain, H.A.; Ajmal, M.M. HRM practices and innovation performance with the mediating effect of knowledge sharing: Empirical evidence from Emirati ICT companies. Int. J. Innov. Learn. 2018, 24, 41–61. [Google Scholar] [CrossRef]
- Ahmad, A.; Bosua, R.; Scheepers, R. Protecting organizational competitive advantage: A knowledge leakage perspective. Comput. Secur. 2014, 42, 27–39. [Google Scholar] [CrossRef]
- Furlan, A.; Vinelli, A.; Dal Pont, G. Complementarity and lean manufacturing bundles: An empirical analysis. Int. J. Oper. Prod. Manag. 2011, 31, 835–850. [Google Scholar] [CrossRef]
- Hales, M.; Tidd, J. The practice of routines and representations in design and development. Ind. Corp. Chang. 2009, 18, 551–574. [Google Scholar] [CrossRef]
- Jansen, J.J.P.; Van den Bosch, F.A.J.; Volberda, H.W. Managing Potential and Realized Absorptive Capacity: How do Organizational Antecedents matter? Acad. Manag. J. 2005, 48, 999–1015. [Google Scholar] [CrossRef]
- Yusr, M.M.; Mokhtar, S.S.M.; Othman, A.R.; Sulaiman, Y. Does interaction between TQM practices and knowledge management processes enhance the innovation performance? Int. J. Qual. Reliab. Manag. 2017, 34, 955–974. [Google Scholar] [CrossRef]
- Arnett, D.B.; Wittmann, C.M. Improving marketing success: The role of tacit knowledge exchange between sales and marketing. J. Bus. Res. 2014, 67, 324–331. [Google Scholar] [CrossRef]
- Teng, L.; Huang, D.; Pan, Y. The performance of MNE subsidiaries in China: Does it matter to be close to the political or business hub? J. Int. Manag. 2017, 23, 292–305. [Google Scholar] [CrossRef]
- Barkema, H.G.; Chen, X.P.; George, G.; Luo, Y.; Tsui, A.S. West meets east: New concepts and theories. Acad. Manag. J. 2015, 58, 460–479. [Google Scholar] [CrossRef]
- Maryam, A.; Dorothy, E.L. Review knowledge management and knowledge management systems: Conceptual foundations and research issues. Mis Q. 2001, 25, 107–136. [Google Scholar]
- Nair, A. Meta-analysis of the relationship between quality management practices and firm performance—Implications for quality management theory development. J. Oper. Manag. 2006, 24, 948–975. [Google Scholar] [CrossRef]
- Reich, B.H.; Gemino, A.; Sauer, C. How knowledge management impacts performance in project: An empirical study. Int. J. Proj. Manag. 2014, 32, 590–602. [Google Scholar] [CrossRef]
- Tyagi, S.; Cai, X.; Yang, K. Terrence chambers. Lean tools and methods to support efficient knowledge creation. Int. J. Inf. Manag. 2015, 35, 204–214. [Google Scholar] [CrossRef]
- Zaefarian, G.; Forkmann, S.; Mitręga, M.; Henneberg, S.C. A capability perspective on relationship ending and its impact on product innovation success and firm performance. Long Range Plan. 2017, 50, 184–199. [Google Scholar] [CrossRef]
- Shahram, T.; Cristian, M. The impact of lean operations on the Chinese manufacturing performance. J. Manuf. Technol. Manag. 2011, 22, 223–240. [Google Scholar]
- Shah, R.; Ward, P.T. Lean manufacturing: Context, practice bundles and performance. J. Oper. Manag. 2003, 21, 129–149. [Google Scholar] [CrossRef]
- Subramaniam, M.; Youndt, M.A. The influence of intellectual capital on the types of innovative capabilities. Acad. Manag. J. 2005, 48, 450–463. [Google Scholar] [CrossRef]
- Zheng, W.; Yang, B.; McLean, G.N. Linking organizational culture, structure, strategy, and organizational effectiveness: Mediating role of knowledge management. J. Bus. Res. 2010, 63, 763–771. [Google Scholar] [CrossRef]
- Ramadani, V.; Abazi-Alili, H.; Dana, L.P.; Rexhepi, G.; Ibraimi, S. The impact of knowledge spillovers and innovation on firm-performance: Findings from the balkans countries. Int. Entrep. Manag. J. 2017, 13, 299–325. [Google Scholar] [CrossRef]
- Liu, S.; Leat, M.; Moizer, J.; Megicks, P.; Kasturiratne, D. A decision-focused knowledge management framework to support collaborative decision making for lean supply chain management. Int. J. Prod. Res. 2013, 51, 2123–2137. [Google Scholar] [CrossRef]
- Tyagi, S.; Cai, X.; Yangk, K. Lean Tools and Methods to Support Efficient Kowledge Creation. Int. J. Inf. Manag. 2015, 35, 204–214. [Google Scholar] [CrossRef]
- Wiengarten, F.; Gimenez, C.; Fynes, B. Exploring the importance of cultural collectivism on the efficacy of lean practices: taking an organisational and national perspective. Int. J. Oper. Prod. Manag. 2015, 35, 370–391. [Google Scholar] [CrossRef]
- Zahra, S.A.; George, G. Absorptive capacity: A review, reconceptualization and extension. Acad. Manag. Rev. 2002, 27, 185–203. [Google Scholar] [CrossRef]
- Zwain, A.A.A.; Teong, L.K.; Othman, S.N. TQM practices and organisational knowledge creation: An empirical study of Iraqi higher education institutions. Asian J. Bus. Account. 2014, 7, 1–28. [Google Scholar]


| NO. | Time and Authors | Research Content | Sample | Research Methods |
|---|---|---|---|---|
| 1 | 2017 Amir Honarpour and Ahmad Jusoh | Propose a reciprocal causation between TQM and knowledge management [23]. | Joint variance analysis method | |
| 2 | 2017 Yiwei Gong and Vincent Blijleven | The role of Lean principles in supporting knowledge management in IT outsourcing relationships [24] | Six semistructured interviews at different organizational levels | Case study |
| 3 | 2017 M. FatihAcar, MerveTarim, HalilZaim, SelimZaim and DursunDelen | Find the level and direction of the relationship between ERP and knowledge Management in the context of operational and financial performance [25]. | In total 163 responses are collected from Turkish manufacturing companies | Structural equation modeling |
| 4 | 2017 MahaMohammed Yusr, SanySanuriMohd Mokhtar, Abdul Rahim Othman and YatySulaiman | Investigate the effect of applying total quality management (TQM) on enhancing knowledge management processes. They also examine the relationship between knowledge management and innovation performance in the Malaysian manufacturing sector [26] | In total 800 medium to large manufacturing companies listed in the Federation of Malaysian Manufacturers | Partial least square |
| 5 | 2015 Satish Tyagi, XianmingCai, Kai Yang and Terrence Chambers | Establishes a framework to create knowledge in the product development environment, and then systematically demonstrates how these 10 lean tools and methods conceptually fit into and play a significant role [27] | SECI model | |
| 6 | 2013 LudvigLindlof, Bjorn Soderberg and MagnusPersson | Establishes a link between the concept of lean product development and the field of knowledge management [28]. | SECI model | |
| 7 | 2013 Shaofeng Liu, Mike Leat, Jonathan Moizer, Phil Megicks and DulekhaKasturiratne | This paper proposes a decision-focused knowledge framework including a multi-layer knowledge model, a knowledge matrix for knowledge elicitation, and a decision tree for the design of the knowledge base. A knowledge system for lean supply chain management has been developed using artificial intelligence system shells VisiRule and Flex [29]. | Multi-layer knowledge model; | |
| 8 | 2011 Bradley R.Staats, David James Brunner, David M. Uptonc | Document the influence of the lean initiative on internal processes and examine how the techniques affect learning by improving both problem identification and problem resolution [30]. | An Indian software services firm | Case study |
| 9 | 2010 GopeshAnand, Peter T. Ward and Mohan V. Tatikonda | This research develops a conceptual model for predicting the success of process improvement projects as a result of knowledge-creation practices employed in the projects [31]. | Hierarchical regression |
| Capacity | Minimum | Maximum | Mean | Deviation | Skewness | Kurtosis | |
|---|---|---|---|---|---|---|---|
| WeL.T1 | 394 | 1.00 | 7.00 | 4.241 | 1.898 | −0.300 | −0.761 |
| LT2 | 394 | 1.00 | 7.00 | 4.447 | 1.829 | −0.342 | −0.755 |
| LT3 | 394 | 1.00 | 7.00 | 4.338 | 1.827 | −0.259 | −0.886 |
| LT4 | 394 | 1.00 | 7.00 | 4.365 | 1.923 | −0.213 | −1.019 |
| LT5 | 394 | 1.00 | 7.00 | 4.429 | 1.829 | −0.291 | −0.873 |
| LT6 | 394 | 1.00 | 7.00 | 4.459 | 1.849 | −0.315 | −0.891 |
| LT7 | 394 | 1.00 | 7.00 | 4.272 | 1.831 | −0.124 | −0.886 |
| LT8 | 394 | 1.00 | 7.00 | 4.124 | 1.735 | −0.084 | −0.703 |
| LT9 | 394 | 1.00 | 7.00 | 5.051 | 1.928 | −0.755 | −0.500 |
| SC1 | 394 | 1.00 | 7.00 | 4.091 | 2.013 | 0.081 | −1.101 |
| SC2 | 394 | 1.00 | 7.00 | 4.023 | 1.821 | 0.009 | −0.927 |
| SC3 | 394 | 1.00 | 7.00 | 4.010 | 1.687 | −0.163 | −0.770 |
| SC4 | 394 | 1.00 | 7.00 | 3.987 | 1.755 | 0.005 | −0.600 |
| KA1 | 394 | 1.00 | 7.00 | 4.728 | 1.817 | −0.394 | −0.809 |
| KA2 | 394 | 1.00 | 7.00 | 4.645 | 1.866 | −0.381 | −0.852 |
| KA3 | 394 | 1.00 | 7.00 | 3.066 | 1.755 | 0.509 | −0.631 |
| KA4 | 394 | 1.00 | 7.00 | 3.368 | 1.894 | 0.340 | −0.946 |
| KI1 | 394 | 1.00 | 7.00 | 3.332 | 1.831 | 0.234 | −0.907 |
| KI2 | 394 | 1.00 | 7.00 | 4.652 | 1.961 | −0.389 | −0.912 |
| KI3 | 394 | 1.00 | 7.00 | 4.485 | 2.083 | −0.348 | −1.104 |
| KI4 | 394 | 1.00 | 7.00 | 4.759 | 1.955 | −0.503 | −0.798 |
| KI5 | 394 | 1.00 | 7.00 | 4.858 | 1.886 | −0.546 | −0.695 |
| KU1 | 394 | 1.00 | 7.00 | 4.340 | 1.991 | −0.214 | −1.002 |
| KU2 | 394 | 1.00 | 7.00 | 4.914 | 1.713 | −0.348 | −0.709 |
| KU3 | 394 | 1.00 | 7.00 | 4.827 | 1.795 | −0.381 | −0.831 |
| KU4 | 394 | 1.00 | 7.00 | 4.685 | 1.944 | −0.355 | −0.992 |
| LP1 | 394 | 1.00 | 7.00 | 3.112 | 2.028 | 0.610 | −0.837 |
| LP2 | 394 | 1.00 | 7.00 | 4.909 | 2.113 | −0.655 | −0.888 |
| LP3 | 394 | 1.00 | 7.00 | 5.264 | 2.201 | −0.986 | −0.514 |
| LP4 | 394 | 1.00 | 7.00 | 5.058 | 2.196 | −0.773 | −0.831 |
| LP5 | 394 | 1.00 | 7.00 | 4.964 | 2.055 | −0.712 | −0.751 |
| LP6 | 394 | 1.00 | 7.00 | 4.756 | 1.959 | −0.535 | −0.827 |
| LP7 | 394 | 1.00 | 7.00 | 5.272 | 2.181 | −1.027 | −0.397 |
| LP8 | 394 | 1.00 | 7.00 | 3.480 | 1.947 | 0.311 | −0.924 |
| LP9 | 394 | 1.00 | 7.00 | 3.513 | 2.033 | 0.247 | −1.113 |
| LP10 | 394 | 1.00 | 7.00 | 3.924 | 2.105 | 0.029 | −1.225 |
| Variables | LT | SC | KA | KI | KU | LP | ALL |
|---|---|---|---|---|---|---|---|
| Cronbach α | 0.916 | 0.863 | 0.832 | 0.873 | 0.870 | 0.918 | 0.943 |
| KMO | Bartlett Sphere Test | ||
|---|---|---|---|
| 0.948 | Approximate chi-square, | degrees of freedom, | significance |
| 8098.095 | 630 | 0.000 | |
| Factor | Initial Eigenvalue | Sum of Extracted Load Square | Sum of Squared Rotation Loads | ||||||
|---|---|---|---|---|---|---|---|---|---|
| Total | Variance Percentage | Grand Total (%) | Total | Variance Percentage | Grand Total (%) | Total | Variance Percentage | Grand Total (%) | |
| 1 | 12.699 | 35.275 | 35.275 | 12.699 | 35.275 | 35.275 | 5.845 | 16.237 | 16.237 |
| 2 | 3.234 | 8.984 | 44.259 | 3.234 | 8.984 | 44.259 | 5.657 | 15.714 | 31.951 |
| 3 | 2.323 | 6.451 | 50.710 | 2.323 | 6.451 | 50.710 | 3.400 | 9.443 | 41.394 |
| 4 | 1.866 | 5.182 | 55.892 | 1.866 | 5.182 | 55.892 | 2.946 | 8.185 | 49.579 |
| 5 | 1.639 | 4.553 | 60.445 | 1.639 | 4.553 | 60.445 | 2.715 | 7.542 | 57.120 |
| 6 | 1.439 | 3.996 | 64.441 | 1.439 | 3.996 | 64.441 | 2.636 | 7.321 | 64.441 |
| 7 | 0.712 | 1.978 | 66.419 | ||||||
| 8 | 0.684 | 1.899 | 68.319 | ||||||
| 9 | 0.652 | 1.812 | 70.130 | ||||||
| 10 | 0.623 | 1.730 | 71.860 | ||||||
| 11 | 0.603 | 1.674 | 73.534 | ||||||
| 12 | 0.582 | 1.616 | 75.150 | ||||||
| 13 | 0.562 | 1.561 | 76.711 | ||||||
| 14 | 0.548 | 1.522 | 78.233 | ||||||
| 15 | 0.530 | 1.474 | 79.707 | ||||||
| 16 | 0.500 | 1.390 | 81.097 | ||||||
| 17 | 0.480 | 1.333 | 82.429 | ||||||
| 18 | 0.464 | 1.289 | 83.719 | ||||||
| 19 | 0.459 | 1.276 | 84.994 | ||||||
| 20 | 0.431 | 1.196 | 86.190 | ||||||
| 21 | 0.417 | 1.158 | 87.348 | ||||||
| 22 | 0.403 | 1.119 | 88.467 | ||||||
| 23 | 0.388 | 1.078 | 89.545 | ||||||
| 24 | 0.379 | 1.052 | 90.597 | ||||||
| 25 | 0.352 | 0.977 | 91.574 | ||||||
| 26 | 0.341 | 0.948 | 92.522 | ||||||
| 27 | 0.326 | 0.904 | 93.426 | ||||||
| 28 | 0.312 | 0.868 | 94.294 | ||||||
| 29 | 0.306 | 0.850 | 95.144 | ||||||
| 30 | 0.282 | 0.784 | 95.927 | ||||||
| 31 | 0.279 | 0.774 | 96.701 | ||||||
| 32 | 0.263 | 0.730 | 97.432 | ||||||
| 33 | 0.253 | 0.704 | 98.136 | ||||||
| 34 | 0.247 | 0.685 | 98.820 | ||||||
| 35 | 0.219 | 0.609 | 99.430 | ||||||
| 36 | 0.205 | 0.570 | 100.000 | ||||||
| Extraction method: Principal Component Analysis | |||||||||
| Dimensions | Topic | Component | |||||
|---|---|---|---|---|---|---|---|
| 1 | 2 | 3 | 4 | 5 | 6 | ||
| LT | LT1 | 0.074 | 0.706 | 0.121 | 0.037 | 0.173 | 0.063 |
| LT2 | 0.185 | 0.769 | 0.046 | 0.042 | 0.095 | 0.179 | |
| LT3 | 0.186 | 0.786 | 0.135 | 0.018 | 0.125 | 0.080 | |
| LT4 | 0.183 | 0.767 | 0.140 | 0.058 | 0.082 | 0.033 | |
| LT5 | 0.147 | 0.666 | 0.156 | 0.047 | 0.099 | 0.110 | |
| LT6 | 0.180 | 0.734 | 0.085 | −0.033 | 0.078 | 0.172 | |
| LT7 | 0.175 | 0.767 | 0.049 | 0.051 | 0.114 | 0.123 | |
| LT8 | 0.079 | 0.694 | 0.125 | 0.118 | 0.070 | 0.062 | |
| LT9 | 0.251 | 0.698 | 0.145 | 0.014 | 0.026 | 0.200 | |
| SC | SC1 | 0.157 | 0.038 | 0.169 | 0.781 | 0.127 | 0.063 |
| SC2 | 0.099 | 0.025 | 0.126 | 0.858 | 0.085 | 0.104 | |
| SC3 | 0.082 | 0.138 | 0.097 | 0.818 | 0.049 | 0.096 | |
| SC4 | 0.189 | 0.015 | 0.104 | 0.790 | 0.080 | 0.070 | |
| KA | KA1 | 0.219 | 0.131 | 0.105 | 0.095 | 0.783 | 0.101 |
| KA2 | 0.178 | 0.187 | 0.177 | 0.075 | 0.748 | 0.141 | |
| KA3 | 0.226 | 0.144 | 0.091 | 0.065 | 0.687 | 0.161 | |
| KA4 | 0.254 | 0.188 | 0.058 | 0.141 | 0.749 | 0.078 | |
| KI | KI1 | 0.265 | 0.235 | 0.767 | 0.107 | 0.144 | 0.153 |
| KI2 | 0.181 | 0.191 | 0.766 | 0.168 | 0.090 | 0.121 | |
| KI3 | 0.183 | 0.138 | 0.680 | 0.140 | 0.108 | 0.148 | |
| KI4 | 0.224 | 0.219 | 0.742 | 0.119 | 0.126 | 0.100 | |
| KI5 | 0.231 | 0.074 | 0.737 | 0.079 | 0.030 | 0.098 | |
| KU | KU1 | 0.233 | 0.196 | 0.187 | 0.095 | 0.166 | 0.764 |
| KU2 | 0.306 | 0.242 | 0.122 | 0.112 | 0.065 | 0.734 | |
| KU3 | 0.259 | 0.249 | 0.190 | 0.099 | 0.218 | 0.625 | |
| KU4 | 0.243 | 0.236 | 0.187 | 0.153 | 0.167 | 0.780 | |
| LP | LP1 | 0.691 | 0.195 | 0.281 | 0.029 | 0.165 | 0.109 |
| LP2 | 0.746 | 0.169 | 0.080 | 0.019 | 0.009 | 0.216 | |
| LP3 | 0.664 | 0.179 | 0.150 | 0.041 | 0.120 | 0.138 | |
| LP4 | 0.665 | 0.190 | 0.055 | 0.146 | 0.166 | 0.070 | |
| LP5 | 0.714 | 0.174 | 0.170 | 0.103 | 0.112 | 0.126 | |
| LP6 | 0.773 | 0.109 | 0.130 | 0.138 | 0.140 | 0.151 | |
| LP7 | 0.687 | 0.085 | 0.150 | 0.080 | 0.141 | 0.046 | |
| LP8 | 0.592 | 0.173 | 0.232 | 0.114 | 0.218 | 0.138 | |
| LP9 | 0.686 | 0.165 | 0.108 | 0.168 | 0.191 | 0.155 | |
| LP10 | 0.692 | 0.267 | 0.243 | 0.082 | 0.117 | 0.181 | |
| Extraction method: Principal Component Analysis. The rotation has converged after six iterations | |||||||
| Indicator | Statistic Value | Critical Value | Result | Model Fitting Judgment |
|---|---|---|---|---|
| Absolute fitting index | χ2 | 2015.493 | ||
| df | 1737 | |||
| P | ≥0.05 | 0.000 | NO | |
| SRMR | ≤0.05 | 0.036 | YES | |
| RMSEA | ≤0.08 | 0.014 | YES | |
| GFI | ≥0.90 | 0.880 | Close to 0.9 | |
| Value-added fitting index | NFI | ≥0.90 | 0.875 | Close to 0.9 |
| IFI | ≥0.90 | 0.981 | YES | |
| TLI | ≥0.90 | 0.979 | YES | |
| CFI | ≥0.90 | 0.981 | YES | |
| Simple fitting index | PGFI | ≥0.50 | 0.765 | YES |
| PNFI | ≥0.50 | 0.805 | YES | |
| PCFI | ≥0.50 | 0.901 | YES | |
| CN | ≥200 | 717 | YES | |
| χ2/df | ≤2.00 | 1.160 | YES |
| Estimate | S.E. | C.R. | P | Standardized Estimate | CR | AVE | |||
|---|---|---|---|---|---|---|---|---|---|
| LT1 | <--- | LT | 1.000 | 0.686 | 0.917 | 0.551 | |||
| LT2 | <--- | LT | 1.110 | 0.078 | 14.310 | *** | 0.790 | ||
| LT3 | <--- | LT | 1.141 | 0.077 | 14.743 | *** | 0.813 | ||
| LT4 | <--- | LT | 1.138 | 0.081 | 14.090 | *** | 0.770 | ||
| LT5 | <--- | LT | 0.945 | 0.076 | 12.392 | *** | 0.672 | ||
| LT6 | <--- | LT | 1.063 | 0.078 | 13.643 | *** | 0.748 | ||
| LT7 | <--- | LT | 1.094 | 0.077 | 14.125 | *** | 0.777 | ||
| LT8 | <--- | LT | 0.880 | 0.072 | 12.189 | *** | 0.660 | ||
| LT9 | <--- | LT | 1.113 | 0.082 | 13.618 | *** | 0.751 | ||
| KA1 | <--- | KA | 1.000 | 0.776 | 0.833 | 0.556 | |||
| KA2 | <--- | KA | 0.998 | 0.069 | 14.389 | *** | 0.755 | ||
| KA3 | <--- | KA | 0.832 | 0.067 | 12.475 | *** | 0.669 | ||
| KA4 | <--- | KA | 1.043 | 0.069 | 15.137 | *** | 0.777 | ||
| KI1 | <--- | KI | 1.000 | 0.867 | 0.876 | 0.588 | |||
| KI2 | <--- | KI | 0.975 | 0.054 | 18.205 | *** | 0.789 | ||
| KI3 | <--- | KI | 0.902 | 0.059 | 15.266 | *** | 0.688 | ||
| KI4 | <--- | KI | 0.961 | 0.054 | 17.794 | *** | 0.780 | ||
| KI5 | <--- | KI | 0.825 | 0.053 | 15.537 | *** | 0.695 | ||
| KU1 | <--- | KU | 1.000 | 0.805 | 0.874 | 0.634 | |||
| KU2 | <--- | KU | 0.833 | 0.050 | 16.751 | *** | 0.780 | ||
| KU3 | <--- | KU | 0.804 | 0.054 | 14.921 | *** | 0.718 | ||
| KU4 | <--- | KU | 1.060 | 0.055 | 19.286 | *** | 0.875 | ||
| LP1 | <--- | LP | 1.000 | 0.769 | 0.919 | 0.534 | |||
| LP2 | <--- | LP | 0.992 | 0.066 | 15.116 | *** | 0.732 | ||
| LP3 | <--- | LP | 0.969 | 0.069 | 14.065 | *** | 0.687 | ||
| LP4 | <--- | LP | 0.947 | 0.069 | 13.704 | *** | 0.673 | ||
| LP5 | <--- | LP | 0.984 | 0.064 | 15.484 | *** | 0.747 | ||
| LP6 | <--- | LP | 0.998 | 0.060 | 16.695 | *** | 0.795 | ||
| LP7 | <--- | LP | 0.931 | 0.069 | 13.595 | *** | 0.666 | ||
| LP8 | <--- | LP | 0.858 | 0.061 | 14.059 | *** | 0.687 | ||
| LP9 | <--- | LP | 0.968 | 0.063 | 15.434 | *** | 0.743 | ||
| LP10 | <--- | LP | 1.073 | 0.064 | 16.843 | *** | 0.795 | ||
| SC1 | <--- | SC | 1.000 | 0.768 | 0.866 | 0.618 | |||
| SC2 | <--- | SC | 1.005 | 0.061 | 16.572 | *** | 0.853 | ||
| SC3 | <--- | SC | 0.839 | 0.056 | 14.968 | *** | 0.770 | ||
| SC4 | <--- | SC | 0.850 | 0.058 | 14.779 | *** | 0.749 |
| Mean | Standard Deviation | LT | KA | KI | KU | LP | SC | |
|---|---|---|---|---|---|---|---|---|
| LT | 4.414 | 1.432 | 0.742 | |||||
| KA | 3.952 | 1.495 | 0.458 | 0.746 | ||||
| KI | 4.417 | 1.583 | 0.486 | 0.454 | 0.767 | |||
| KU | 4.692 | 1.581 | 0.551 | 0.528 | 0.557 | 0.796 | ||
| LP | 4.425 | 1.582 | 0.533 | 0.584 | 0.610 | 0.635 | 0.731 | |
| SC | 4.028 | 1.534 | 0.202 | 0.340 | 0.399 | 0.371 | 0.368 | 0.786 |
| AVE | 0.551 | 0.556 | 0.588 | 0.634 | 0.534 | 0.618 |
| Indicator | Statistic Value | Critical Value | Result | Model Fitting Judgment |
|---|---|---|---|---|
| Absolute fitting index | χ2 | 1602.150 | ||
| df | 1362 | |||
| P | ≥0.05 | 0.000 | NO | |
| SRMR | ≤0.05 | 0.036 | YES | |
| RMSEA | ≤0.08 | 0.015 | YES | |
| GFI | ≥0.90 | 0.891 | Close to 0.9 | |
| Value-added fitting index | NFI | ≥0.90 | 0.892 | Close to 0.9 |
| IFI | ≥0.90 | 0.982 | YES | |
| TLI | ≥0.90 | 0.980 | YES | |
| CFI | ≥0.90 | 0.982 | YES | |
| Simple fitting index | PGFI | ≥0.50 | 0.766 | YES |
| PNFI | ≥0.50 | 0.817 | YES | |
| PCFI | ≥0.50 | 0.899 | YES | |
| CN | ≥200 | 712 | YES | |
| χ2/df | ≤2.00 | 1.176 | YES |
| Estimate | S.E. | C.R. | P | Standardized Estimate | Corresponding Hypothesis | Result | |||
|---|---|---|---|---|---|---|---|---|---|
| KA | <--- | LT | 0.496 | 0.066 | 7.574 | *** | 0.458 | Hypothesis 1a | True |
| KI | <--- | LT | 0.431 | 0.074 | 5.842 | *** | 0.352 | Hypothesis 1b | True |
| KU | <--- | LT | 0.352 | 0.072 | 4.916 | *** | 0.285 | Hypothesis 1c | True |
| KI | <--- | KA | 0.33 | 0.069 | 4.801 | *** | 0.293 | Hypothesis 2a | True |
| KU | <--- | KI | 0.302 | 0.058 | 5.208 | *** | 0.299 | Hypothesis 2b | True |
| KU | <--- | KA | 0.299 | 0.067 | 4.47 | *** | 0.263 | Hypothesis 2c | True |
| LP | <--- | KA | 0.28 | 0.062 | 4.542 | *** | 0.253 | Hypothesis 3a | True |
| LP | <--- | KI | 0.273 | 0.054 | 5.059 | *** | 0.279 | Hypothesis 3b | True |
| LP | <--- | KU | 0.266 | 0.059 | 4.506 | *** | 0.274 | Hypothesis 3c | True |
| LP | <--- | LT | 0.157 | 0.063 | 2.492 | 0.013 | 0.131 | Hypothesis 4a | True |
| Indicator | Statistic Value | Critical Value | Restricted Model | Unconstrained Model |
|---|---|---|---|---|
| Absolute fitting index | χ2 | 1039.813 | 1062.819 | |
| df | 908.000 | 918.000 | ||
| P | ≥0.05 | 0.001 | 0.001 | |
| RMR | ≤0.05 | 0.177 | 0.260 | |
| SRMR | ≤0.05 | 0.054 | ||
| RMSEA | ≤0.08 | 0.019 | 0.020 | |
| GFI | ≥0.90 | 0.864 | 0.861 | |
| AGFI | ≥0.90 | 0.842 | 0.840 | |
| Value-added fitting index | NFI | ≥0.90 | 0.860 | 0.857 |
| RFI | ≥0.90 | 0.847 | 0.845 | |
| IFI | ≥0.90 | 0.980 | 0.978 | |
| TLI | ≥0.90 | 0.978 | 0.976 | |
| CFI | ≥0.90 | 0.980 | 0.977 | |
| Simple fitting index | PGFI | ≥0.50 | 0.743 | 0.749 |
| PNFI | ≥0.50 | 0.787 | 0.793 | |
| PCFI | ≥0.50 | 0.897 | 0.905 | |
| CN | ≥200 | 371.000 | 366.000 | |
| χ2/df | ≤2.00 | 1.145 | 1.158 |
| Model | DF | CMIN | P | NFI Delta−1 | IFI Delta−2 | RFI rho−1 | TLI rho2 |
|---|---|---|---|---|---|---|---|
| Structural weights | 10 | 23.006 | 0.011 | 0.003 | 0.004 | 0.002 | 0.002 |
| Path | Low SC | High SC | Critical Ratios (95%) | |||||
|---|---|---|---|---|---|---|---|---|
| Standardized Estimate | P | Standardized Estimate | P | T | Established or not | |||
| KA | <--- | LT | 0.256 | 0.002 | 0.585 | *** | 3.187 | YES |
| KI | <--- | LT | 0.245 | 0.002 | 0.496 | *** | 2.581 | YES |
| KI | <--- | KA | 0.228 | 0.007 | 0.193 | 0.039 | −0.171 | NO |
| KU | <--- | LT | 0.225 | 0.004 | 0.391 | *** | 1.968 | YES |
| KU | <--- | KI | 0.260 | 0.001 | 0.279 | *** | −0.173 | NO |
| KU | <--- | KA | 0.241 | 0.004 | 0.208 | 0.014 | −0.436 | NO |
| LP | <--- | KA | 0.278 | *** | 0.179 | 0.028 | −0.856 | NO |
| LP | <--- | KI | 0.289 | *** | 0.224 | 0.006 | −0.710 | NO |
| LP | <--- | KU | 0.286 | *** | 0.219 | 0.018 | −0.346 | NO |
| LP | <--- | LT | 0.064 | 0.350 | 0.303 | 0.001 | 2.257 | YES |
© 2020 by the authors. Licensee MDPI, Basel, Switzerland. This article is an open access article distributed under the terms and conditions of the Creative Commons Attribution (CC BY) license (http://creativecommons.org/licenses/by/4.0/).
Share and Cite
Zhang, B.; Niu, Z.; Liu, C. Lean Tools, Knowledge Management, and Lean Sustainability: The Moderating Effects of Study Conventions. Sustainability 2020, 12, 956. https://doi.org/10.3390/su12030956
Zhang B, Niu Z, Liu C. Lean Tools, Knowledge Management, and Lean Sustainability: The Moderating Effects of Study Conventions. Sustainability. 2020; 12(3):956. https://doi.org/10.3390/su12030956
Chicago/Turabian StyleZhang, Bo, Zhanwen Niu, and Chaochao Liu. 2020. "Lean Tools, Knowledge Management, and Lean Sustainability: The Moderating Effects of Study Conventions" Sustainability 12, no. 3: 956. https://doi.org/10.3390/su12030956
APA StyleZhang, B., Niu, Z., & Liu, C. (2020). Lean Tools, Knowledge Management, and Lean Sustainability: The Moderating Effects of Study Conventions. Sustainability, 12(3), 956. https://doi.org/10.3390/su12030956