Article

Determinants of Food Insecurity in Rural Households: The Case of the Paute River Basin of Azuay Province, Ecuador

by
Otilia Vanessa Cordero-Ahiman
1,*,
Jorge Leonardo Vanegas
1,2,
Pablo Beltrán-Romero
1 and
María Elena Quinde-Lituma
1
1
Grupo de Investigación en Economía Regional (GIER), Facultad de Ciencias Económicas y Administrativas, Universidad de Cuenca, Cuenca 010107, Ecuador
2
Facultad de Ciencias Agropecuarias, Universidad de Cuenca, Cuenca 010107, Ecuador
*
Author to whom correspondence should be addressed.
Sustainability 2020, 12(3), 946; https://doi.org/10.3390/su12030946
Submission received: 12 December 2019 / Revised: 22 January 2020 / Accepted: 22 January 2020 / Published: 28 January 2020

Abstract

:
Eliminating food insecurity is one of humanity’s greatest global challenges. Thus, the purpose of this research was to analyze the factors that determine food insecurity in households in the rural area of the Paute River Basin, Azuay Province, Ecuador. Stratified sampling was used as the sampling method, with proportional affixation. Moreover, we employed the Latin American and Caribbean Household Food Security Measurement Scale (ELCSA). We estimated the main determinants of household food insecurity using two binomial logit models and one ordered logit model. For the analysis of the data, the respective statistical and econometric tests were employed. The results show that housing size and access to food security information are the most important determinants of food insecurity in the three predictive models applied in this research. This research contributes to the existing literature on food insecurity and provides important information for policymakers, especially regarding food insecurity in rural areas, which has profound economic and social implications.

1. Introduction

It is a basic right of all people to have physical and economic access to sufficient, safe, and nutritious food to meet their dietary needs for an active and healthy life [1,2,3]. However, there are more than 820 million people in the world who are hungry [4]. The Food and Agriculture Organization of the United Nations (FAO) [5] warns that the number of people in the world suffering from hunger has increased by 11% in the last four years. In 2018, around 2 billion people experienced moderate or severe food insecurity due to poor access to nutritious and sufficient food [4,5]. With regard to Latin America and the Caribbean (LAC), hunger affects 42.5 million people, 90% of whom experience severe food insecurity [5]. In LAC, 30.7% of people live in a state of poverty [6]. Low-income countries in LAC face increases in hunger that are related to food insecurity as a result of the stagnation of economic growth [4,7]. In Ecuador between 2016 and 2018, there were 1.2 million people suffering from severe food insecurity and 3.9 million people suffering from moderate or severe food insecurity [5]. According to the National Statistics and Census Institute of Ecuador (INEC), the food problem in this country, where 23.9% of the population lives in poverty [8], is linked to the difficulty of accessing the basic food basket [6,8]. It has been shown that food insecurity affects many dimensions of well-being and is caused by factors such as macroeconomic imbalances, population growth, poverty, rural–urban migration, inequality, food supply [9], distribution networks [10], and even home interiors, among others [11,12]. Thus, the second sustainable development goal (SDG), known as Zero Hunger, seeks to end hunger, reduce food insecurity, improve nutrition, and promote sustainable agriculture [7,13]. Indeed, eliminating food insecurity is one of humanity’s greatest challenges [4,14,15,16].
Food insecurity is understood as the limited or uncertain availability of nutritionally adequate or sufficient food [4,14,16]. The inability to acquire or consume a sufficient amount of food is the greatest difficulty faced by many poor subpopulations, despite national economic growth [17]. For part of or the entire year, many people have insufficient food or face the possibility of an inadequate diet in the future [18]. People living in rural areas are at greater risk of food insecurity [19,20], unemployment, poverty, and lack of access to basic services [21,22]. In this context, the eradication of hunger requires a multisectoral public policy approach, due to the multidimensional nature of food insecurity [5]. The Inter-American Development Bank (IDB) [23] is promoting a modern, multisectoral approach that conceives of food insecurity from the perspective of demand and food systems to assess the nutritional status of the population. For this reason, analyzing food insecurity can facilitate the development of public policies for the benefit of vulnerable populations at both the regional and national level [24,25,26].
The FAO [27] has shown that the assessment and monitoring of household food insecurity can be undertaken through the use of “scales based on household experience” such as the Latin American and Caribbean Food Security Scale (ELCSA), which is a valid tool to assess household food insecurity [15]. Through different methods, food insecurity can be related to demographic, socioeconomic, and environmental variables, among others [28,29,30,31,32].
Some studies have determined the factors that have a significant impact on food insecurity through the assessment of individual, household, and socioeconomic characteristics [14,15,33,34,35,36]. In a study conducted by Assefa [37], three factors positively affected household food security in Ethiopia. These were average years of schooling of members of the household, proximity to service centers, and assets and availability of credit services; furthermore, with a logistic regression, the author found that investment in education and rural development could help improve household food insecurity. With a binary logit model, Agidew and Singh [33] found that shortage of farmland, poverty, recurrent drought and climate change, shortage of rainfall, and land degradation are determining factors for such food insecurity. Likewise, variables such as the age of the head of household, family size, number of agricultural labor force, off-farm income, relief support/food aid, farming experience, and agro-ecological zone were key determinants of rural household food insecurity. However, most of the studies that have been carried out so far on food insecurity issues focus on the national, regional, and district levels [38,39,40].
The main objective of this research was to analyze the determinants of food insecurity in rural households of the Paute River Basin in the province of Azuay, Ecuador, and consequently generate evidence to guide policymakers focused on reducing food insecurity in this area. The main research question posed is, what factors have a significant impact on food insecurity in rural households in this study? Thus, this research contributes to the existing literature on food insecurity, especially in rural areas, with the aim of guiding the implementation of policies to improve the lives of vulnerable populations facing food insecurity. After this introduction, this paper is divided into five sections. Section 2 presents the empirical materials and methods used. Section 3 describes the results. Section 4 presents a discussion of the results obtained, and finally, Section 5 offers some concluding remarks.

2. Materials and Methods

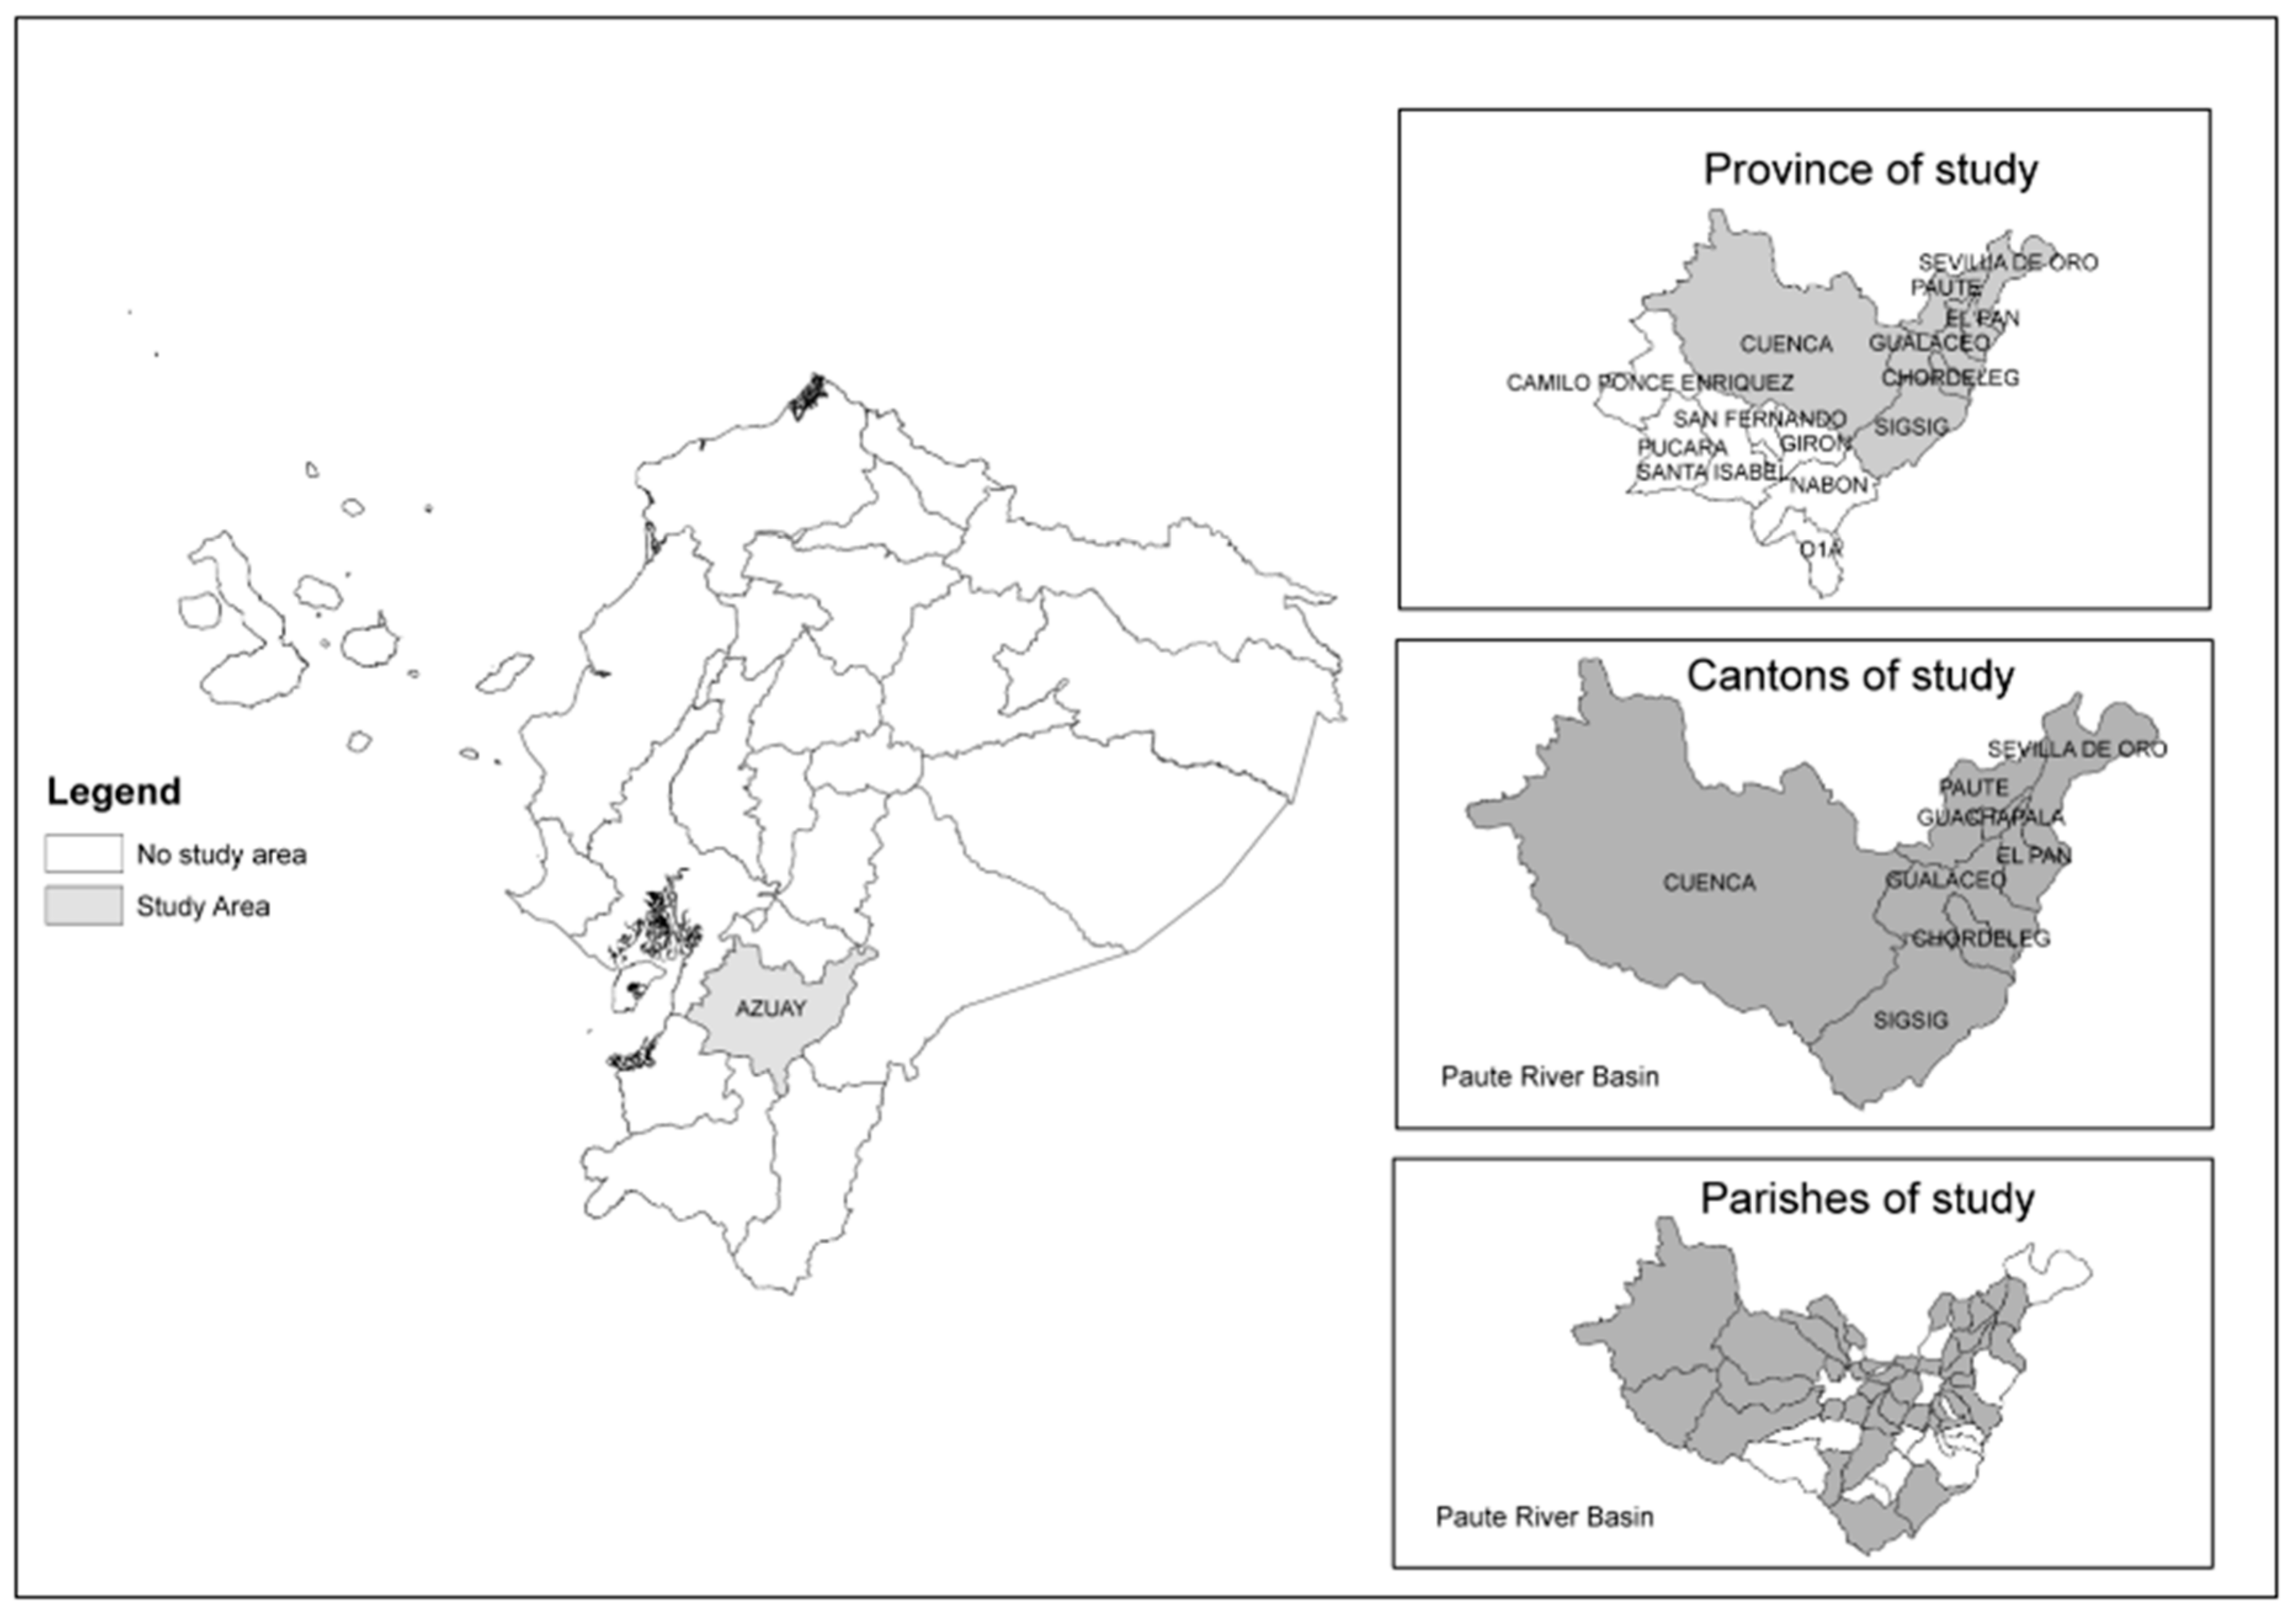
2.1. Location of the Study Area

This research was carried out in the rural area of the Paute River Basin, in the province of Azuay, Ecuador. The Paute River Basin is located between the eastern and western Andes mountain ranges of southern Ecuador. The area includes the provinces of Azuay, Cañar, and Morona Santiago. This inter-Andean region covers an area of approximately 6439 km2 that ranges between 440 and 4680 m above sea level [41]. The cantons in the province of Azuay selected for this study were Cuenca, Gualaceo, Paute, Sigsig, Chordeleg, EI Pan, Sevilla de Oro, and Guachapala (Figure 1). These cantons were selected because of their social, economic, demographic, and ecological importance and the different climatic conditions (drought, floods, and landslides, among other natural disasters) they have faced in recent years, which have an effect on food insecurity [42,43,44,45], particularly in rural areas [46].

2.2. Data Collection and Analysis

Communities in the rural area of the Paute River Basin in the province of Azuay were selected using a stratified random sampling method with proportional affixing, according to data from the last census conducted by the National Statistics and Census Institute of Ecuador (INEC) in 2010. The representative sample was made up of 383 surveys distributed in eight rural cantons, with a 95% confidence level and a 5% precision rate. In addition, surveys were distributed randomly within parishes and rural communities. The 383 surveys were distributed in the rural area as shown in Table 1. A pilot study was conducted before the final survey in order to refine the questions contained in the survey. The survey questionnaire was applied directly to ensure timely information and reliable results for the benefit of vulnerable rural communities. The data, collected at the household level, were from primary and cross-sectional sources. Prior to the collection and processing of data, it was essential to ensure the well-being and protection of the rights of participants. The respondents thus gave their consent to participate in the research through an informed consent form in which their full names were requested along with their signature. Moreover, the database of respondents will not be made public, in order to avoid conflicts between parties. The review, evaluation, and ethical approval for this research was granted by the Committee on Bioethics in Health Area Research (COBIAS) of the University of Cuenca, Ecuador.

2.3. Questionnaire

The survey questionnaire was based on socioeconomic, demographic, food, nutritional, and social aspects, among others. The Latin American and Caribbean Household Food Security Measurement Scale (ELCSA) questionnaire was also included in the survey. The questions that make up the ELCSA are related to the quality and quantity of food available and consumed over the three months prior to the date of the survey, according to the resources to which each household had access in that period [27]. It is important to mention than the term “resources” implies the possibility of obtaining or producing food for the household without the need to use money [15]. That is, there is the possibility of obtaining food from one’s own production and/or subsistence farming, something very common in rural communities in Ecuador. The ELCSA was used as a measure to construct the dependent variable and analyze the determinants of food insecurity for the rural households in the study area.

2.4. Analysis of the ELCSA

The ELCSA questionnaire (see Appendix Table A1) consists of 15 questions with dichotomous answers (“Yes” or “No”) that are divided into two sections: The first section is composed of eight questions (P1 to P8) aimed at adults and household members in general, and the second section is composed of seven questions (P9 to P15) related to the conditions that affect children and adolescents under 18 years of age in the home [7,27].
A food insecurity variable was constructed according to household perceptions for the estimation of the binomial logit model (BLM *). Food insecurity levels were then constructed using the cut-off points applied to the additive scores of the positive answers of the ELCSA questions: (0) Food security (0 positive responses); (1) mild insecurity (households with adults: 1–3 positive responses, households with individuals under the age of 18: 1–5 positive responses); (2) moderate insecurity (households with adults: 4–6 positive responses, households with individuals under the age of 18: 4–10 positive responses); and (3) severe insecurity (households with adults: 7–8 positive responses, households with individuals under the age of 18: 11–15 positive responses) [27]. The indicator of food insecurity constructed according to the ELCSA questions for the estimation of the binomial logit model (BLM) was a dichotomous variable (1: Mild, moderate, or severe insecurity; 0: Food security). The four levels of food insecurity were used in the ordinal logit model (OLM).

2.5. Evaluation of the Reliability of the ELCSA Using Cronbach’s Alpha

One of the measures used to evaluate the reliability and internal consistency of the ELCSA is Cronbach’s alpha [47]. The coefficient of this measurement may vary in the range of 0–1; with 0 indicating no internal consistency and 1 indicating perfect internal consistency. When Cronbach’s alpha is equal to or greater than 0.80, the answers are considered reliable and indicate good internal consistency of the ELCSA [48,49]. In this research, Cronbach’s alpha was approximately 0.87 (Table 2). The limitation of this measure is that it is based on a linear method that assumes that the change in intensity or difficulty between the questions is constant across the entire scale [27]. X is an n k matrix of the quantified responses of a questionnaire. Each row in X represents a topic, and each column represents a question. In this case, the quantified responses are on a scale of 0 to 1 [49].
The Cronbach’s alpha coefficient formula is expressed as follows:
  =   k k 1 i = 1 k σ t 2 i = 1 k σ i 2 σ t 2 = k k 1 i = 1 k σ i 2 σ t 2
where σ i 2 is the variance of each column of X , σ t 2 is the variance of the sum of each row of X , k should be greater than one to have a denominator other than zero, and n should be greater than one to have a non-zero denominator in the calculation of σ i 2 and σ t 2 . In Equation (1), k is a correction parameter. If there is consistency in the quantified responses, then σ t 2 will be relatively large, which will lead to α tending to one. Otherwise, the random answers will make σ t 2 comparable to the sum of the individual variances σ i 2 , which in turn will cause α to tend to zero [26,49].

2.6. Specification of Empirical Models

For the analysis of the determinants of food insecurity, a binomial logit model (BLM) and an ordinal logit model (OLM) were specified. In the estimation of each model, the dependent variable was different. First, for the BLM, a dichotomous variable was used and estimated in two moments: (1) According to household perceptions of food insecurity (FI); and (2) according to the questions of the ELCSA for the construction of an indicator of FI. For the estimation of the OLM, an ordinal variable was used according to the levels of food insecurity (FI) constructed from the ELCSA questions: Food security; mild insecurity; moderate insecurity; severe insecurity. In addition, independent variables were incorporated as determinants of food insecurity in rural households. Based on the literature and observations of the study area, 11 explanatory variables were selected and hypothesized for the estimation of the models. The cutoff value for statistical significance was 0.70 according to the calculation of the area under the ROC curve of the Stata output. In this context, the parameters of the models were estimated using the maximum likelihood estimation (MLE) method in the Stata/IC15.0® statistical program.

2.6.1. Specification of the BLM

The discrete-choice BLM has two categories, coded 0 and 1 [50,51]. In this modeling approach, food insecurity (FI) as a dependent variable was measured between 0 and 1; where 1 represents food insecurity (FI) (1 = No) and 0 represents food security (FS). The logistic binary specification is suitable for models when the endogenous variables are dichotomous [52]. The logistics distribution function is specified as follows [51,53]:
P Y i = 1 = 1 1 + e β 0 + β i X i = 1 1 + e z i = e z 1 + e z
where P Y i = 1 is the probability that a household experiences food insecurity (FI) and z i is the function of a vector of n explanatory variables Z i = β 0 + β 1 x 1 . If P Y i = 1 is the probability of experiencing food insecurity (FI), then 1 P Y i = 1 is the opposite. In this sense, it is easy to verify that as Z i varies from −∞ to +∞, P i varies between 0 and 1 [51]. On the other hand, when transformed into the possibilities of success (ODD), the probabilities are no longer in the range of 0 to 1 but of 0 to positive infinity [54]. In this case, the odds ratios are expressed as:
o i = P i 1 P i = 1 + e z i 1 + e z i = e z i
Equation (3) constitutes the ratio or probability coefficient. These coefficients show the relationship between the odds of the explanatory variables in relation to the probability of occurrence of the dependent variable [54]. Then, from Equation (3), the natural logarithm is taken as shown below
L i = l n P i 1 P i = Z i = β 0 + β 1 x 1 + β 2 x 2 + + β n x n + u i
where L i is the natural logarithm of the odds ratios; it is linear in the explanatory variables and also in the parameters (from the point of view of the estimate). β 0 is an intercept, β 1 ,   β 2   β n are vectors of unknown parameters to be estimated, x i is a vector of relevant explanatory variables of the household, and u i is the stochastic error term. The parameters were estimated using MLE.

2.6.2. Specification of the OLM

In the OLM, the dependent variable is multinomial and ordered in nature [50]. In this case, the ordinary regression analysis is based on a latent regression of ordinal scales, where there is a clear classification between the categories of the dependent variable [53]. The categorical dependent variable (level of food insecurity) takes the values 0 ,   1 ,   2 , ,   j for some known integer J [55]. In addition, it is a function of a set of explanatory variables.
The latent regression of the level of food insecurity Y i * is expressed as [56]:
Y i * = X i β + ε i
where Y i * is the latent unobservable variable that has more than two ordered or classified categories and denotes the level of FI observed in the home i , X i is the matrix of a set of explanatory variables that determine the choice made by the household i , β is the vector of parameters to be estimated, and ε i is a random error term distributed identically and independently.
In the OLM, the ordinal variable Y i is a function of another variable Y i * , according to household choice i between the alternatives 0 ,   1 ,   2 , ,   j and in relation to several threshold points µ j   μ 0 =   y   μ j = , as demonstrated in the following formulas [55]:
Y i = 0   si   Y * µ 1   1   si   µ 1 Y * µ 2   2   si   µ 2 Y * µ 3   3   si   Y * > µ 3  
The FI variable is divided into four categories of increasing order and is coded as: 0 = food security, 1 = mild insecurity, 2 = moderate mild insecurity, and 3 = severe mild insecurity. The logistic distribution function of the model is considered by Moon [56]. In this case, the probability of a response for a given household i according to the number of categories j is expressed as:
P Y i = j | X i = P µ j 1 < Y * µ j = F μ j X i β F μ j 1 X i β = e α j + X i β 1 + e α j + X i β
where F represents the standard logistic cumulative distribution function (cdf) of ε i , β are the regression coefficients for X i , and α j is the intercept for j logit. The empirical application of the regression of the OLM, following Grimaccia and Naccarato [14], is expressed as:
g Y = l o g i t Y = α j + β 1 x 1 + β 2 x 2 + + β n x n + ε i
The vector of the model parameters was estimated by MLE. The categorical dependent variable (FI levels), measured by the ELCSA score, is analyzed based on observable exogenous variables. The α j parameters, called thresholds or breakpoints, are in increasing order ( α 1 < α 2 < ) . Their number is j = 1 ,   2 ,   ,   j 1 , where j is the number of categories of the ordinal variable [14]. In this research, j = 4 .

3. Results

In this section, a descriptive and econometric analysis of the continuous and descriptive variables used in the research is presented (Table 3, Table 4 and Table 5). The original sample consisted of 383 surveys, from which surveys that contained incomplete information were excluded for the estimation of the logistic regression models. Therefore, after taking into account the availability of data on demographic variables, the final sample used for the analysis consisted of 321 surveys, representing 84% of the original sample. Inferential statistics were applied to determine the association between dependent and independent variables of the determinants of food insecurity in rural households.

3.1. Descriptive Analysis

Table 3 and Table 4 show summary statistics for the demographic variables for the entire sample, as well as for the different food insecurity scenarios. On average, a household is made up of 3.84 members, with an average age of 47 years. The average house size is five rooms. The level of education of the heads of households is low (8% have no education, and 67.36% have primary education). Of the heads of household, 60% are men, while 40% are women, and the majority report their marital status as married (61.88%). With respect to the economic situation, the total monthly income and expenditure of households, on average, is approximately 300.00 and 226.00 US dollars, respectively. The standard deviations for these variables were 203.99 and 166.25, respectively.
According to the results, the provision of basic services in this rural area is low. In terms of water availability, 62.66% of households receive water through a water board or project, 32.38% of households use public network water, and only 1.83% use a well. As for sanitation, 64.23% of people have a sanitation service connected to a public sewer network, 31.85% have a septic tank connected, and 1.57% do not have access to this service. In reference to electricity and internet services, 98.17% of households have access to electricity, and 53.26% of households do not have access to internet services. In addition, only 12.89% of people are beneficiaries of conditional cash transfers through the human development bonus (BDH) program. The BDH payments are conditional on the fulfillment of co-responsibilities by households in terms of health, education, housing, eradication of child labor, and family support. It is worth highlighting that only 11.35% of people surveyed in this research are self-employed agricultural workers, 63.97% sow corn, and on average, 74.73% save and consume the seeds of the last sowing. For 57% of self-employed agricultural workers, the land area for crops is less than one hectare.
According to the perceptions of households in the rural area of the Paute River Basin of Azuay province, Table 4 shows that food insecurity is low at the household level (37.86%). However, when calculating the FI indicator according to the ELCSA questions, this result changes (71.54%). It seems that there is an increase in the level of FI when moving from the perception of households to the construction of an FI indicator. In the analysis of FI levels, most of the rural households (56.66%) have slight food insecurity, and 14.88% have a moderate level of insecurity or severe insecurity. Therefore, 71.54% of households are food insecure.

3.2. Econometric Estimation Analysis

Table 5 shows the coefficients of the different determinants of food insecurity at the household level, odds ratios, their standard errors, and cut-off thresholds. The estimated models were specified according to household perceptions of food insecurity (FI) and by the construction of an indicator of FI according to the questions of the ELCSA. In general, the main social and economic determinants of food insecurity investigated were the size of housing (number of rooms in the house), the size of the household (number of household members), primary and secondary education, age of the head of household, self-employed agricultural worker status, information on food security, corn production, consumption of seeds, and the human development bonus (BDH) program. With these results, the determinants significantly related to food insecurity at the level of perception and at the level of the FI indicator are compared between the estimated models.
The results of the binary logistic regression of perception show that food insecurity is associated with the following variables: The size of the house, size of the household, level of education of the head of the household (primary and secondary), self-employed agricultural worker status, corn production, access to information on food security, and the BDH program. However, total income, total expenditure, age of the head of the household, and the consumption of seeds from the last planting were not statistically significant in the estimation of the model. Household size and type of employment are the only variables that have a positive impact with respect to food insecurity. The results show that the correctly classified values of the estimated model represent 71.03%. On the other hand, the results of the binary logistic regression of the FI indicator, constructed in accordance with the ELCSA questions, show that the determinants of food insecurity are the size of the dwelling, age of the head of household, access to information on food security, and the consumption of seeds from the last planting. The correctly classified values of this model represent 72.90%. In the estimated robust ordered logistic regression model, it can be observed that the size of the house, age of the head of household, access to information on food security, and consumption of seeds from the last planting are statistically significant and important determinants of the level of household food insecurity. The results of the latter two models also show that the consumption of seeds from the last planting have a significant and positive relationship (p < 0.01) with food insecurity. However, total income, total expenditure, and the level of education of the head of household (higher education) were not statistically significant in the estimation of all predictive models.
Specifically, the results of the BLM of perception show that housing size and access to information on food security had a negative and significant effect. This means than the odds of being food insecure for those with larger homes compared to those smaller homes is decreased. Moreover, the same goes for households with greater access to information on food security. The BLM from the construction of the FI indicator also shows that when households have a larger home and have access to information on food security, the odds of FI decrease 0.75 and 0.57 times (p < 0.05 and p < 0.10), respectively. Similarly, the OLM shows that the probability of presenting FI was 0.73 and 0.64 times (p < 0.01 and p < 0.10) lower for households with a larger home and for those with access to information on food security, respectively. Table 5 shows the values of cut1, cut2, and cut3, which are the cutoff values that separate the different levels of FI in the OLM. The predicted cumulative likelihoods when the independent variables are equal to zero are indicated by the cutoff thresholds. None of the confidence intervals for the three cutoff thresholds overlapped, demonstrating that the four different levels of food insecurity were significantly different from each other.

4. Discussion

This research analyzed the determinants of food insecurity in households in the rural area of the Paute River Basin, in the Azuay province of Ecuador. Economic variables (income, expenditure, and BDH program), as independent variables, alone do not explain food insecurity since there are also social, demographic, and environmental variables that can explain food insecurity in the estimation of a model. Consequently, there are some studies that analyze the association between dependent and independent variables of the common determinants of food insecurity, which include individual, household, and socioeconomic characteristics [2,14,15,33,34,40,57].
Productive activities in rural areas are not included in official statistics [58]. The results of this research show that the average income of rural households (USD 300.00) is below the unified basic remuneration (RBU) of USD 394.00. The RBU in Ecuador is a minimum wage that, by law, is set annually and must be paid to workers by an employer. The results indicate that low-income families are forced to cut their food budgets, being more likely to experience chaotic living conditions [59,60,61]. Furthermore, in Ecuador, a market family basket that contains the products required to meet the basic needs of a household had a cost of USD 718.18 for a four-member household with 1.6 income earners who earned the RBU of USD 394 in the year 2019 (that is, one person earns 1 RBU and another 0.6 of the RBU). These figures were presented by the National Institute of Statistics and Censuses (INEC) in October 2019 [8,62]. Our results indicate a reduction in the purchasing power of households to access and consume a set of goods and services (the 359 products that make up the basket) required to meet the basic needs of the household in terms of food and beverages, living space, clothing, and miscellaneous items [8].
Furthermore, it is important to note that in this rural area, the head of household is most often male. Kraus et al. [63] indicate that women place more importance on healthy and nutritional eating compared to men. Women are responsible for selecting and preparing food, although their efforts to reduce or eliminate household food insecurity is not yet recognized. Moreover, basic services in this rural area are scarce. Our results coincide with the statements of Mahlknecht and González-Bravo [64], who indicate that people living in rural areas tend to not have access to improved water sources and sanitation facilities. In recent years, rural populations have had greater access to electricity services but place a greater value on provisioning services (e.g., food and water) [65]. Likewise, the results of this research, with respect to the average number of members in a household, coincide with the study of Legwegoh and Hovorka [66], who found that the average household size is four, the smallest ones having only one member and the largest, eight. When there are more people to feed in a home, per capita income, per capita expenditure, and per capita food consumption are indirectly reduced, so demand can outstrip the supply of food from the household’s own production, which entails family food insecurity [33,35,36,67,68].
On the other hand, the results of the model estimation built according to the perceptions of households show that rural households are less likely to suffer food insecurity when they acquire new knowledge. Knowledge should favor nutritional education; the more educated the heads of the household are, the greater the likelihood of educating family members and improving living conditions [68,69]. Likewise, the highest level of educational attainment increases income and offers a better decision-making capacity for healthy eating [37]. The study of Olabiyi and Mcintyre [39] indicated that food insecurity was significantly lower for households with a baccalaureate education among people whose main income source was self-employment. Furthermore, the age of the head of the household was independent (in terms of sign and significance) with respect to the state of food insecurity [70]. In the current research, however, the age of the head of the household had a negative effect and was statistically significant only in the BLM and OLM models. A study conducted by Bogale and Shimelis [35] also revealed that the age of the head of household has a theoretically consistent and statistically significant effect.
We found that if a head of household is self-employed in agriculture and if the household consumes the seeds of the last sowing, this increases the likelihood of a household experiencing food insecurity. This is an indication that if a household sells its highest-quality agricultural products at market, there is a greater probability that the home will face food insecurity [23]. In part, this could be due to the lack of efficiency of the public sector and coordination between public sectors and local stakeholders [70]. Furthermore, in the current research, the main crop cultivated by the surveyed rural communities is maize. According to our results, when a home cultivates corn, this significantly decreases household food insecurity [71]. Corn is one of the staple foods in homes and is largely produced by small farmers who obtain their own food needs and supply local markets. Sustainable approaches are needed to ensure their future role in the fight against hunger, food insecurity, and poor nutrition. In general, governments indeed recognize the role that agriculture has in stimulating economic growth and reducing rural poverty [72]. Therefore, the authorities should develop sustainable agriculture and safety nets for the most vulnerable sections of rural populations [26], as agriculture is one of the least-productive sectors but typically involves obtaining food from one’s own production and/or subsistence farming [15,73].
The estimation of all econometric models indicated that access to information on food security is a statistically significant variable with a negative effect. Households are less likely to experience food insecurity when they have access to information on how to feed and nourish themselves effectively within the home. This information can be provided through workshops, the training of professionals [74,75], and other activities that may be related to food and nutrition. According to the perceptions of households, our research also found that being a beneficiary of the human development bonus (BDH) program decreases the likelihood of a household experiencing food insecurity. According to Vahabi et al. [38], household food insecurity is highly related to obtaining social assistance and the use of food banks. The results regarding formal economic aid and food and social assistance programs found here are consistent with empirical findings made in many parts of the world [22,76].
As shown by the analysis of the data with the respective statistical and econometric tests, housing size and access to information on food security were the most important determinants of food insecurity in the three predictive models estimated in this research. The goodness-of-fit to the data was better for the binomial logit model built with the ELCSA indicator. Therefore, the results of this model provide a better understanding of the determinants of food insecurity in the rural area of the Paute River Basin in the Ecuadorian province of Azuay. These findings can help policymakers develop effective public policies, plans, programs, and projects to combat food insecurity.
However, there are also some limitations to this research. First, information gathering was only carried out in a specific area in the province of Azuay. Second, the econometric models applied to the survey results only provide an evaluation of positive or negative effects of the determinants of FI and do not provide a monetary evaluation. Therefore, it is difficult to make any generalizations to other rural areas in Ecuador.

5. Conclusions

This research analyzed the determinants of household food insecurity in the rural area of the Paute River Basin in the Azuay province of Ecuador. Information related to household composition, household income, access to resources, and food production was collected. It is crucial to convert policies for reducing household food insecurity into effective and sustainable actions. According to the subjective declaration of the households participating in this research, the average monthly income is approximately USD 300.00, which is below the unified basic remuneration (RBU) of USD 394.00. Households with food insecurity have low incomes, which limits access to food, portion sizes, the number of meals in a day, etc.
Eliminating or reducing food insecurity continues to be a challenge for rural communities. For this reason, eradicating hunger must be a key commitment of local authorities and should be strived for through the management of public policy at all levels and the development of a comprehensive strategic framework focused on promoting greater social inclusion, reducing food insecurity, and improving rural community nutrition. To this aim, this research provides a better understanding of the determinants of food insecurity in rural areas, which has profound sociodemographic implications. The findings obtained here reveal that food insecurity is present in the rural communities of the Paute River Basin, and several determining factors were identified that could improve the food insecurity situation in the study area. These include the size of the house, the age of the head of the household, access to information on food security, and the consumption of seeds from the last sowing. Moreover, the education of the head of the household is an additional key factor for reducing or eliminating food insecurity.
This research contributes to the literature on food insecurity and provides important information for policymakers regarding food insecurity in rural areas, which has profound economic and social implications. In this challenging scenario, these results allow for the identification of groups of rural households that should be the targeted by public programs and policies implemented by local authorities in order to ensure sustainable development through the availability, access, and stability of the resources of the area and in turn generate inclusive economic development. In addition, public policies, plans, programs, and projects should focus on teaching the importance of leading an active and healthy life, in addition to providing social security subsidies to rural households.
This analysis constitutes a baseline for future research, and for investigations into the determinants of food insecurity in the other cantons of the Azuay province of Ecuador and in other Ecuadorian provinces, with an emphasis on local communities and indigenous people.

Author Contributions

Methodology, conception, design, O.V.C.-A., M.E.Q.-L., and P.B.-R. Data acquisition, O.V.C.-A., J.L.V., M.E.Q.-L., and P.B.-R. Statistical analysis, O.V.C.-A., M.E.Q.-L., P.B.-R., and J.L.V. Technical, administrative, material support, O.V.C.-A., M.E.Q.-L., J.L.V., and P.B.-R. Paper writing, O.V.C.-A., M.E.Q.-L., J.L.V., and P.B.-R. Paper revision, O.V.C.-A. and J.L.V. All authors read and approved the final version of the manuscript.

Funding

This research was a winning research project in the XVII Research Projects Competition of the Research Department of the University of Cuenca (DIUC), conducted from September 2018 to March 2020.

Acknowledgments

We would like to express our sincere gratitude to the authorities of the University of Cuenca, Ecuador, for the Research Department’s (DIUC) support of this research. In addition, we would like to thank the Economist Luis Rodrigo Mendieta Muñoz PhD, Director of GIER and Dean of the Faculty of Economics and Administration Sciences of the University of Cuenca, for his academic and administrative support throughout this research. Finally, we would also like to take this opportunity to thank all of the surveyed communities from the rural area of the Paute River basin in Azuay Province, Ecuador, whose kind participation made a decisive contribution to the completion of the fieldwork.

Conflicts of Interest

The authors declare no conflict of interest.

Appendix A

Table A1. Latin American and Caribbean Household Food Security Measurement (ELCSA) questions.
QuestionsIn the Past Three Months, Because of a Lack of Income or Other Resources:
Q1Did you ever worry about your household running out of food?
Q2Did your household ever run out of food?
Q3Was your household deprived of eating a healthy diet?
Q4Did you or any other adults in your household ever have an unbalanced diet?
Q5Did you or any other adults in your household miss breakfast, lunch, or dinner?
Q6Did you or any other adults in your household eat less than you should?
Q7Were you or any other adults in your household ever hungry and have nothing to eat?
Q8Did you or any other adults in your household not eat for a whole day or eat only once a day?
Q9Were any household members deprived of a healthy diet?
Q10Did any household members under 18 have an unbalanced diet?
Q11Did any household members under 18 ever miss breakfast, lunch, or dinner?
Q12Did any household members under 18 not have enough to eat?
Q13Did you ever have to cut the size of the meals prepared for any household members under 18?
Q14Were any household members under 18 ever hungry and have nothing to eat?
Q15Did any household members under 18 ever not eat for a whole day or eat only once a day?
Source: Food and Agriculture Organization of the United Nations (FAO) [29].

References

  1. Food and Agriculture Organization of the United Nations (FAO). Food Security and Agricultural Mitigation in Developing Countries: Options for Capturing Synergies; FAO: Rome, Italy, 2009. [Google Scholar]
  2. Smith, M.D.; Kassa, W.; Winters, P. Assessing food insecurity in Latin America and the Caribbean using FAO’s Food Insecurity Experience Scale. Food Policy 2017, 71, 48–61. [Google Scholar] [CrossRef] [Green Version]
  3. Cafiero, C.; Viviani, S.; Nord, M. Food security measurement in a global context: The food insecurity experience scale. Measurement 2018, 116, 146–152. [Google Scholar] [CrossRef]
  4. Organización de las Naciones Unidas para la Alimentación y la Agricultura (FAO); Fondo Internacional de Desarrollo Agrícola (FIDA); Programa Mundial de Alimentos (PMA); Organización Mundial de la Salud (OMS); Fondo de las Naciones Unidas para la Infancia (UNICEF). El Estado de la Seguridad Alimentaria y la Nutrición en el Mundo 2019. Protegerse Frente a la Desaceleración y el Debilitamiento de la Economía; FAO, FIDA, PMA, OMS y UNICEF: Rome, Italy, 2019. [Google Scholar]
  5. Organización de las Naciones Unidas para la Alimentación y la Agricultura (FAO); Organización Panamericana de la Salud (OPS); Programa Mundial de Alimentos (WFP); Fondo de las Naciones Unidas para la Infancia (UNICEF). Panorama de la Seguridad Alimentaria y Nutrición en América Latina y el Caribe 2019; FAO, OPS WFP y UNICEF: Santiago, Chile, 2019. [Google Scholar]
  6. Instituto Nacional de Estadísticas y Censos (INEC). Encuesta Nacional de Empleo, Desempleo y Subempleo (ENEMDU). Indicadores de Pobreza y Desigualdad Septiembre, 2019; INEC: Quito, Ecuador, 2019. [Google Scholar]
  7. Pérez-Escamilla, R.; Shamah-Levy, T.; Candel, J. Food security governance in Latin America: Principles and the way forward. Glob. Food Secur. 2017, 14, 68–72. [Google Scholar] [CrossRef]
  8. Instituto Nacional de Estadísticas y Censos (INEC). Informe Ejecutivo de las Canastas Analíticas: Básica y Vital; INEC: Quito, Ecuador, 2019. [Google Scholar]
  9. Hameed, M.; Ahmadalipour, A.; Moradkhani, H. Drought and food security in the middle east: An analytical framework. Agric. For. Meteorol. 2020, 281, 107816. [Google Scholar] [CrossRef]
  10. Bakker, C.; Zaitchik, B.F.; Siddiqui, S.; Hobbs, B.F.; Broaddus, E.; Neff, R.A.; Haskett, J.; Parker, C.L. Shocks, seasonality, and disaggregation: Modelling food security through the integration of agricultural, transportation, and economic systems. Agric. Syst. 2018, 164, 165–184. [Google Scholar] [CrossRef]
  11. Smith, L.C.; Subandoro, A. Measuring food security using household expenditure surveys. Int. Food Policy Res. Inst. 2007, 3, 1–147. [Google Scholar]
  12. Shariff, Z.M.; Khor, G.L. Household food insecurity and coping strategies in a poor rural community in Malaysia. Nutr. Res. Pr. 2008, 2, 26–34. [Google Scholar] [CrossRef] [Green Version]
  13. Assembly, U.G. Global Indicator Framework for the Sustainable Development Goals and Targets of the 2030 Agenda for Sustainable Development; United Nations Statistics Division: New York, NY, USA, 2017. [Google Scholar]
  14. Grimaccia, E.; Naccarato, A. Food Insecurity Individual Experience: A Comparison of Economic and Social Characteristics of the Most Vulnerable Groups in the World. Soc. Indic. Res. 2018, 143, 391–410. [Google Scholar] [CrossRef]
  15. Magaña-Lemus, D.; Ishdorj, A.; Rosson, C.P.; Lara-Álvarez, J. Determinants of household food insecurity in Mexico. Agric. Food Econ. 2016, 4, 474. [Google Scholar] [CrossRef] [Green Version]
  16. Ballard, T.J.; Kepple, A.W.; Cafiero, C. The Food Insecurity Experience Scale Development of a Global Standard for Monitoring Hunger Worldwide; FAO: Rome, Italy, 2013. [Google Scholar]
  17. Wu, C.H.; Lin, C.Y.; Hsieh, Y.P.; Strong, C.; Meshki, C.; Lin, Y.C.; Tsai, M.C. Dietary behaviors mediate the association between food insecurity and obesity among socioeconomically disadvantaged youth. Appetite 2019, 132, 275–281. [Google Scholar] [CrossRef]
  18. Phillips, T.P.; Taylor, D.S. Optimal Control of Food Insecurity: A Conceptual Framework. Am. J. Agric. Econ. 1990, 72, 1304–1310. [Google Scholar] [CrossRef]
  19. Organización de las Naciones Unidas para la Alimentación y la Agricultura (FAO); Organización Panamericana de la Salud (OPS); Programa Mundial de Alimentos (WFP); UNICEF. Panorama de la Seguridad Alimentaria y Nutricional en América Latina y el Caribe; FAO, OPS, WFP y UNICEF: Santiago, Chile, 2018. [Google Scholar]
  20. Gunter, K.B.; Jackson, J.; Tomayko, E.J.; John, D.H. Food insecurity and physical activity insecurity among rural Oregon families. Prev. Med. Rep. 2017, 8, 38–41. [Google Scholar] [CrossRef] [PubMed]
  21. Rukundo, P.M.; Rukooko, B.; Andreassen, B.A.; Iversen, P.O. Housing, water and sanitation implications on food insecurity and diet diversity in landslide affected communities: A cross-sectional survey of two districts in Uganda. Clin. Nutr. ESPEN 2019, 33, 47–56. [Google Scholar] [CrossRef] [PubMed]
  22. Chakona, G.; Shackleton, C.M. Food insecurity in South Africa: To what extent can social grants and consumption of wild foods eradicate hunger? World Dev. Perspect. 2019, 13, 87–94. [Google Scholar] [CrossRef]
  23. Banco Interamericano de Desarrollo (BID). Seguridad Alimentaria en América Latina y el Caribe; BID: Washington, DC, USA, 2019. [Google Scholar]
  24. Lo, Y.-T.; Chang, Y.-H.; Lee, M.-S.; Wahlqvist, M.L. Dietary diversity and food expenditure as indicators of food security in older Taiwanese. Appetite 2012, 58, 180–187. [Google Scholar] [CrossRef]
  25. Hinrichs, C.C. Regionalizing food security? Imperatives, intersections and contestations in a post-9/11 world. J. Rural. Stud. 2013, 29, 7–18. [Google Scholar] [CrossRef]
  26. Cordero-Ahiman, O.-V.; Santellano-Estrada, E.; Garrido, A. Explaining food insecurity among indigenous households of the Sierra Tarahumara in the Mexican state of Chihuahua. Span. J. Agric. Res. 2017, 15, e0106. [Google Scholar] [CrossRef] [Green Version]
  27. Wynne, B.; Zhang, Y. Food and Agriculture Organization of the United Nations (FAO). In Encyclopedia of Global Health; SAGE Publications: Thousand Oaks, CA, USA, 2012. [Google Scholar]
  28. Potochnick, S.; Perreira, K.M.; Bravin, J.I.; Castañeda, S.F.; Daviglus, M.L.; Gallo, L.C.; Isasi, C.R. Food Insecurity Among Hispanic/Latino Youth: Who Is at Risk and What Are the Health Correlates? J. Adolesc. Heal. 2019, 64, 631–639. [Google Scholar] [CrossRef]
  29. Koyanagi, A.; Stubbs, B.; Oh, H.; Veronese, N.; Smith, L.; Haro, J.M.; Vancampfort, D. Food insecurity (hunger) and suicide attempts among 179,771 adolescents attending school from 9 high-income, 31 middle-income, and 4 low-income countries: A cross-sectional study. J. Affect. Disord. 2019, 248, 91–98. [Google Scholar] [CrossRef]
  30. Caccavale, O.M.; Giuffrida, V. The Proteus composite index: Towards a better metric for global food security. World Dev. 2020, 126, 104709. [Google Scholar] [CrossRef]
  31. Alpha, A.; Fouilleux, E. How to diagnose institutional conditions conducive to inter-sectoral food security policies? The example of Burkina Faso. NJAS Wagening. J. Life Sci. 2018, 84, 114–122. [Google Scholar] [CrossRef]
  32. Ibok, O.W.; Osbahr, H.; Srinivasan, C. Advancing a new index for measuring household vulnerability to food insecurity. Food Policy 2019, 84, 10–20. [Google Scholar] [CrossRef]
  33. Agidew, A.-M.A.; Singh, K.N. Determinants of food insecurity in the rural farm households in South Wollo Zone of Ethiopia: The case of the Teleyayen sub-watershed. Agric. Food Econ. 2018, 6, 10. [Google Scholar] [CrossRef]
  34. Akinboade, O.A.; Adeyefa, S.A. An Analysis of Variance of Food Security by its Main Determinants Among the Urban Poor in the City of Tshwane, South Africa. Soc. Indic. Res. 2018, 137, 61–82. [Google Scholar] [CrossRef]
  35. Bogale, A.; Shimelis, A. Household level determinants of food insecurity in rural areas of Dire Dawa, Eastern Ethiopia. Afr. J. Food Agric. Nutr. Dev. 2009, 9, 1914–1926. [Google Scholar]
  36. Beyene, F.; Muche, M. Determinants of Food Security among Rural Households of Central Ethiopia: An Empirical Analysis. Q. J. Int. Agric. 2010, 49, 299–318. [Google Scholar]
  37. Assefa, T. Household Level Food Insecurity Assessment: Evidence from Panel Data, Ethiopia. Sci. Afr. 2020, e00262. [Google Scholar] [CrossRef]
  38. Vahabi, M.; Damba, C.; Rocha, C.; Cristina, E. Food Insecurity Among Latin American Recent Immigrants in Toronto. J. Immigr. Minor. Heal. 2011, 2, 929–939. [Google Scholar] [CrossRef]
  39. Olabiyi, O.M.; McIntyre, L. Determinants of Food Insecurity in Higher-Income Households in Canada. J. Hunger. Environ. Nutr. 2014, 9, 433–448. [Google Scholar] [CrossRef]
  40. Gregorio, M.J.; Rodrigues, A.M.; Graça, P.; De Sousa, R.D.; Dias, S.S.; Branco, J.C.; Canhão, H. Food Insecurity Is Associated with Low Adherence to the Mediterranean Diet and Adverse Health Conditions in Portuguese Adults. Front. Public Heal. 2018, 6, 1–9. [Google Scholar] [CrossRef]
  41. Campozano, L.; Tenelanda, D.; Sanchez, E.; Samaniego, E.; Feyen, J. Comparison of Statistical Downscaling Methods for Monthly Total Precipitation: Case Study for the Paute River Basin in Southern Ecuador. Adv. Meteorol. 2016, 2016, 1–13. [Google Scholar] [CrossRef]
  42. Celleri, R.; Willems, P.; Buytaert, W.; Feyen, J. Space–time rainfall variability in the Paute basin, Ecuadorian Andes. Hydrol. Process. 2007, 21, 3316–3327. [Google Scholar] [CrossRef]
  43. Guzmán, P.; Batelaan, O.; Huysmans, M.; Wyseure, G. Comparative analysis of baseflow characteristics of two Andean catchments, Ecuador. Hydrol. Process. 2015, 29, 3051–3064. [Google Scholar] [CrossRef] [Green Version]
  44. Shah, K.U.; Dulal, H.B.; Johnson, C.; Baptiste, A. Understanding livelihood vulnerability to climate change: Applying the livelihood vulnerability index in Trinidad and Tobago. Geoforum 2013, 47, 125–137. [Google Scholar] [CrossRef]
  45. Boukary, A.G.; Diaw, A.; Wünscher, T. Factors Affecting Rural Households’ Resilience to Food Insecurity in Niger. Sustainability 2016, 8, 181. [Google Scholar] [CrossRef] [Green Version]
  46. Tibesigwa, B.; Visser, M. Assessing Gender Inequality in Food Security among Small-holder Farm Households in urban and rural South Africa. World Dev. 2016, 88, 33–49. [Google Scholar] [CrossRef]
  47. Christmann, A.; Van Aelst, S. Robust estimation of Cronbach’s alpha. J. Multivar. Anal. 2006, 97, 1660–1674. [Google Scholar] [CrossRef] [Green Version]
  48. Cronbach, L.J. Coefficient alpha and the internal structure of tests. Psychometrika 1951, 16, 297–334. [Google Scholar] [CrossRef] [Green Version]
  49. Leontitsis, A.; Pagge, J. A simulation approach on Cronbach’s alpha statistical significance. Math. Comput. Simul. 2007, 73, 336–340. [Google Scholar] [CrossRef]
  50. Greene, W. Nonlinear Regression Models. In Econometric Analysis, 5th ed.; Prentice Hall: Upper Saddle River, NJ, USA, 2003. [Google Scholar]
  51. Gujarati, D.N. Qualitative Response Regression Models. In Basic Econometrics, 4th ed.; McGraw-Hill/Irwin: New York, NY, USA, 2003. [Google Scholar]
  52. Zakari, S.; Ying, L.; Song, B. Factors Influencing Household Food Security in West Africa: The Case of Southern Niger. Sustainability 2014, 6, 1191–1202. [Google Scholar] [CrossRef] [Green Version]
  53. Gujarati, D.N.; Porter, D.C. Qualitative Response Regression Models. In Basic Econometrics, 5th ed.; McGraw-Hill/Irwin: New York, NY, USA, 2009. [Google Scholar]
  54. Erráez, J.P. Estadística y Econometría: Aplicaciones con Datos Ecuatorianos Utilizando Stata; Gráficas Iberia: Quito, Ecuador, 2013; pp. 139–157. ISBN 9789942907752. [Google Scholar]
  55. Wooldridge, J.M. Discrete Response Model. In Econometric Analysis of Cross Section and Panel Data; MIT Press: London, UK, 2010; pp. 504–509. [Google Scholar]
  56. Moon, C. Simulataneous specicication test in a binary logit. Commun. Stat. Theory Methods 1988, 17, 3361–3387. [Google Scholar] [CrossRef]
  57. Cordero-Ahiman, O.V.; Santellano-Estrada, E.; Garrido, A. Food Access and Coping Strategies Adopted by Households to Fight Hunger among Indigenous Communities of Sierra Tarahumara in Mexico. Sustainability 2018, 10, 473. [Google Scholar] [CrossRef] [Green Version]
  58. Economic Commission for Latin America and the Caribbean (ECLAC). Social Panorama of Latin America 2018 (LC/PUB.2019/3-P); ECLAC: Santiago, Chile, 2019. [Google Scholar]
  59. Evans, G.W.; Gonnella, C.; Marcynyszyn, L.A.; Gentile, L.; Salpekar, N. The role of chaos in poverty and children’s socioemotional adjustment. Psychol. Sci. 2005, 16, 560–565. [Google Scholar] [CrossRef] [PubMed]
  60. Fiese, B.H.; Gundersen, C.; Koester, B.; Jones, B. Family chaos and lack of mealtime planning is associated with food insecurity in low income households. Econ. Hum. Boil. 2016, 21, 147–155. [Google Scholar] [CrossRef] [PubMed] [Green Version]
  61. Servan-Mori, E.; Torres-Pereda, P.; Orozco, E.; Sosa-Rubí, S.G. An explanatory analysis of economic and health inequality changes among Mexican indigenous people, 2000-2010. Int. J. Equity Heal. 2014, 13, 21. [Google Scholar] [CrossRef] [PubMed] [Green Version]
  62. Instituto Nacional de Estadísticas y Censos (INEC). Resultados Índice de Precios al Consumidor (IPC); INEC: Quito, Ecuador, 2019. [Google Scholar]
  63. Kraus, A.; Annunziata, A.; Vecchio, R. Sociodemographic Factors Differentiating the Consumer and the Motivations for Functional Food Consumption. J. Am. Coll. Nutr. 2017, 36, 1–11. [Google Scholar] [CrossRef] [Green Version]
  64. Mahlknecht, J.; González-Bravo, R. Measuring the Water-Energy-Food Nexus: The Case of Latin America and the Caribbean Region. Energy Procedia 2018, 153, 169–173. [Google Scholar] [CrossRef]
  65. Aguado, M.; González, J.A.; Bellott, K.; López-Santiago, C.; Montes, C. Exploring subjective well-being and ecosystem services perception along a rural–urban gradient in the high Andes of Ecuador. Ecosyst. Serv. 2018, 34, 1–10. [Google Scholar] [CrossRef]
  66. Legwegoh, A.F.; Hovorka, A.J. Assessing food insecurity in Botswana: The case of Gaborone, Development in Practice. Dev. Pract. 2013, 23, 346–358. [Google Scholar] [CrossRef]
  67. Amare, A.; Simane, B. Assessment of Household Food Security in the Face of Climate Change and Variability in the Upper Blue-Nile of Ethiopia. J. Agric. Sci. Technol. B 2017, 7, 285–300. [Google Scholar]
  68. De Cock, N.; D’Haese, M.; Vink, N.; Van Rooyen, C.J.; Staelens, L.; Schönfeldt, H.C.; D’Haese, L. Food security in rural areas of Limpopo province, South Africa. Food Secur. 2013, 5, 269–282. [Google Scholar] [CrossRef] [Green Version]
  69. Bukusuba, J.; Kikafunda, J.K.; Whitehead, R.G. Food security status in households of people living with HIV/AIDS (PLWHA) in a Ugandan urban setting. Br. J. Nutr. 2007, 98, 211–217. [Google Scholar] [CrossRef] [PubMed] [Green Version]
  70. Omonona, B.T.; Agoi, G.A. An analysis of food security situation among Nigerian urban households: Evidence from Lagos state, Nigeria. J. Cent. Eur. Agric. 2007, 8, 397–406. [Google Scholar]
  71. D’Haese, M.; Vink, N.; Nkunzimana, T.; Van Damme, E.; Van Rooyen, J.; Remaut, A.-M.; Staelens, L.; D’Haese, L. Improving food security in the rural areas of KwaZulu-Natal province, South Africa: Too little, too slow. Dev. South. Afr. 2013, 30, 468–490. [Google Scholar] [CrossRef]
  72. Tanumihardjo, S.A.; McCulley, L.; Roh, R.; Lopez-Ridaura, S.; Palacios-Rojas, N.; Gunaratna, N.S. Maize agro-food systems to ensure food and nutrition security in reference to the Sustainable Development Goals. Glob. Food Secur. 2019, 100327. [Google Scholar] [CrossRef]
  73. Mendieta Muñoz, R.; Pontarollo, N. Territorial growth in Ecuador: The role of economic sectors. Rom. J. Econ. Forecast. 2018, XXI, 124–139. [Google Scholar]
  74. Helton, J.J.; Moore, A.R.; Henrichsen, C. Food security status of mothers at-risk for child maltreatment. Child. Youth Serv. Rev. 2018, 93, 263–269. [Google Scholar] [CrossRef]
  75. Ragasa, C.; Aberman, N.-L.; Mingote, C.A. Does providing agricultural and nutrition information to both men and women improve household food security? Evidence from Malawi. Glob. Food Secur. 2019, 20, 45–59. [Google Scholar] [CrossRef] [Green Version]
  76. Mabli, J.; Ohls, J. The Journal of Nutrition Community and International Nutrition Supplemental Nutrition Assistance Program Participation Is Associated with an Increase in Household Food Security in a National Evaluation 1,2. J. Nutr. 2015, 145, 344–351. [Google Scholar] [CrossRef]
Figure 1. Location of the study area. Source: Authors’ own elaboration, 2019.
Sustainability 12 00946 g001
Table 1. Description of sample size.
Rural CantonsFrequencyPercentage
Cuenca25065.27
Gualaceo4110.70
Paute287.31
Sigsig359.14
Chordeleg133.39
El Pan41.04
Sevilla de Oro82.09
Guachapala41.04
Total383100.00
Source: Authors’ own calculations, 2019.
Table 2. Cronbach’s alpha for households assessed using the Latin American and Caribbean Food Security Scale (ELCSA).
Average Interitem Correlation:0.3021
Number of Items in the Scale:15
Scale Reliability Coefficient:0.8665
ItemObs.SignItem-Rest CorrelationItem-Rest CorrelationAverage Interitem CorrelationAlpha
Q_1383+0.40450.30380.32020.8683
Q_2382+0.31490.20820.32880.8728
Q_3383+0.43020.33160.31770.867
Q_4382+0.36520.26150.32390.8703
Q_5383+0.34580.24050.32580.8712
Q_6383+0.54210.45490.30680.861
Q_7382+0.5570.47130.30540.8602
Q_8383+0.38490.28270.32210.8693
Q_9383+0.80520.75950.28120.8456
Q_10383+0.80290.75670.28140.8457
Q_11383+0.78290.73270.28340.847
Q_12383+0.81060.76590.28070.8453
Q_13383+0.80450.75850.28130.8457
Q_14383+0.74840.69180.28670.8491
Q_15382+0.75690.70190.28590.8486
Test scale 0.30210.8665
Source: Authors’ own calculations, 2019.
Table 3. Descriptive statistics of the rural households.
Continuous VariablesDescriptionMeanSD/%
Quantitative
Total IncomeTotal household income in USD (monthly)299.79203.99
Total ExpenditureTotal household expenditure in USD (monthly)226.03166.25
Household sizeNumber of household members3.841.65
AgeAge of the head of household47.2016.25
Housing sizeNumber of rooms4.901.59
Discrete Variables
Qualitative
Gender:Gender of the head of household1.600.49
Female 39.69%
Male 60.31%
Marital status:Marital status of the head of household2.511.42
Single 13.05%
Married 61.88%
Widowed 9.40%
Divorced 2.35%
Consensual union 28.00%
Separated 2.35%
Single mother 3.66%
Education level:Educational level of the head of household1.190.60
Uneducated 7.83%
Primary 67.36%
Secondary 22.45%
Higher 2.35%
Access to water sources:Household’s source of water1.790.76
Public network 32.38%
Board or project water 62.66%
Water well 1.83%
Other (rain) 3.13%
Sanitation service:Housing sanitation services1.450.81
Connected to public sewage network 64.23%
Connected to water well—septic 31.85%
Connected to water well—blind 1.57%
Direct discharge to the river, lake, or ravine 0.52%
Latrine 0.26%
No access 1.57%
Energy for cooking:Source of fuel or energy for cooking1.020.18
Gas 98.96%
Electricity 0.26%
Firewood or coal 0.78%
Electricity:Electricity services1.020.13
Access 98.17%
No access 1.83%
Internet:Internet services1.530.50
Access 46.74%
No access 53.26%
Economic activityType of employment
Self-employed farm worker 0.110.32
Yes 11.35%
Employed, salaried farm worker 1.980.13
Yes 1.85%
Land measurements:Crop production by ha0.600.52
None 41.51%
< 1 ha 56.92%
> 1 ha 1.57%
Cultivate corn:Corn sowing0.640.48
Yes 63.97%
Seed saving:Household saves seeds0.730.45
Yes 72.83%
Seed consumption:Household consumes seeds0.770.42
Yes 76.63%
Human Development Bonus (BDH):Direct money transfer program to households in poverty and destitution0.130.34
Beneficiary 12.89%
Non-beneficiary 87.11%
Note: N = 383; SD: Standard deviation; SD/%: This column refers to the standard deviation (SD) unless otherwise noted (%). Source: Authors’ own elaboration from surveys, 2019.
Table 4. Descriptive statistics of food insecurity.
Dependent VariableDescriptionMeanPercentage
Food insecurity perception:Household perception of food insecurity (BLM *)0.38
Food insecurity0 = No
1 = Yes
37.86
Food security 62.14
Food insecurity indicator:Household food insecurity indicator (BLM)0.72
Food insecurity0 = No (mild, moderate, and severe insecurity) 71.54
Food security1 = Yes (Secure) 28.46
Food Insecurity levels:Household food insecurity level (OLM)0.89
Secure0 28.46
Mild insecure1 56.66
Moderate insecure2 12.53
Severe insecure3 2.35
Note: N = 383; BLM *: Binomial logit model-perception; BLM: Binomial logit model-indicator; OLM: Ordered logit model. Source: Authors’ own elaboration from surveys, 2019.
Table 5. Results of regression analyses (BLM *, BLM, and OLM), showing the determinants of food insecurity in rural households.
BLM *BLMOLM
Dependent VariableFIFIFI
Independent VariableCoefficientsOdds Ratio95% C.I. for O.R.CoefficientsOdds Ratio95% C.I. for O.R.CoefficientsOdds Ratio95% C.I. for O.R.
LowerUpperLowerUpperLowerUpper
Total income0.00131.00130.99871.0039−0.00110.99890.99651.0012−0.00060.99940.99781.0009
(−0.0013) (−0.0012) (−0.0008)
Total expenditure−0.00240.99760.99431.00080.00261.00260.99921.00590.00131.00130.99971.0028
(−0.0017) (−0.0017) (−0.0008)
Housing size−0.2426 ***0.78460.65430.9406−0.2905 **0.74790.61130.9149−0.3115 ***0.73240.61570.8710
(−0.0926) (−0.1029) (−0.0885)
Household size0.1664 **1.18110.98041.4227−0.02420.97610.79821.1935−0.00140.99860.83281.1973
(−0.095) (−0.1026) (−0.0926)
Age of head of household0.01191.01190.99291.0313−0.0233 **0.97690.95720.9970−0.0170 *0.98320.96651.0000
(−0.0097) (−0.0104) (−0.0087)
Primary education−0.9844 *0.37370.13801.01110.21471.23940.43493.5318−0.30860.73450.22642.3824
(−0.5079) (−0.5343) (−0.6004)
Secondary education−1.0785 *0.34010.10101.1445−0.3410.71110.19672.5706−0.80480.44720.11911.6778
(−0.6191) (−0.6557) (−0.6747)
Higher education1.06632.90470.484817.40280.00671.00670.12987.8030−0.81790.44140.09072.1473
(−0.9134) (−1.0448) (−0.8072)
Self−employed farm worker0.9554 ***2.59981.26655.33620.67621.96640.83884.60960.31261.3670.71982.5959
(−0.3669) (−0.4347) (−0.3272)
Corn production−0.6836 **0.50480.27760.9179−0.32530.72230.38251.3636−0.2960.74380.43931.2592
(−0.3051) (−0.3242) (−0.2687)
Food security information−0.9910 ***0.37120.21200.6497−0.5597 *0.57140.32361.0088−0.4419 *0.64280.39931.0347
(−0.2857) (−0.2900) (−0.2429)
Consumed seeds0.51091.66670.81893.39211.4298 ***4.1782.02598.61611.1152 ***3.05021.51486.1418
(−0.3625) (−0.3693) (−0.3571)
BDH program−0.7610 *0.46720.19721.1067−0.11160.89440.41131.9443−0.09970.90510.46941.7450
(−0.4400) (−0.3962) (−0.335)
_cons0.85912.36090.443112.57762.673214.48652.367688.6363
(−0.8535) (−0.9242)
cut1- -- −3.2008 −4.9728−1.4288
- -- (−0.9041)
cut2- -- −0.1385 −1.91351.6365
- -- (−0.9057)
cut3- -- 1.7984 −0.12193.7188
- -- (−0.9798)
Log pseudolikelihood =−187.34 −168.93 −305.42
Number of obs =321 321 321
Wald chi2 (13) =45.93 34.89 37.60
Prob > chi2 =0.000 0.0009 0.0003
Pseudo R2 =0.1191 0.0993 0.0596
Correctly classified (%) =71.03 72.90 -
Note: Significance levels: * p < 0.10, ** p < 0.05, ***p < 0.01. Robust standard errors are given in parentheses below the parameter estimates. FI: Food insecurity, BLM *: Binomial logit model—perception, BLM: Binomial logit model-indicator, OLM: Ordered logit model. Source: Authors’ own elaboration from surveys, 2019.

