Characteristics of Runoff Variations and Attribution Analysis in the Poyang Lake Basin over the Past 55 Years

Abstract
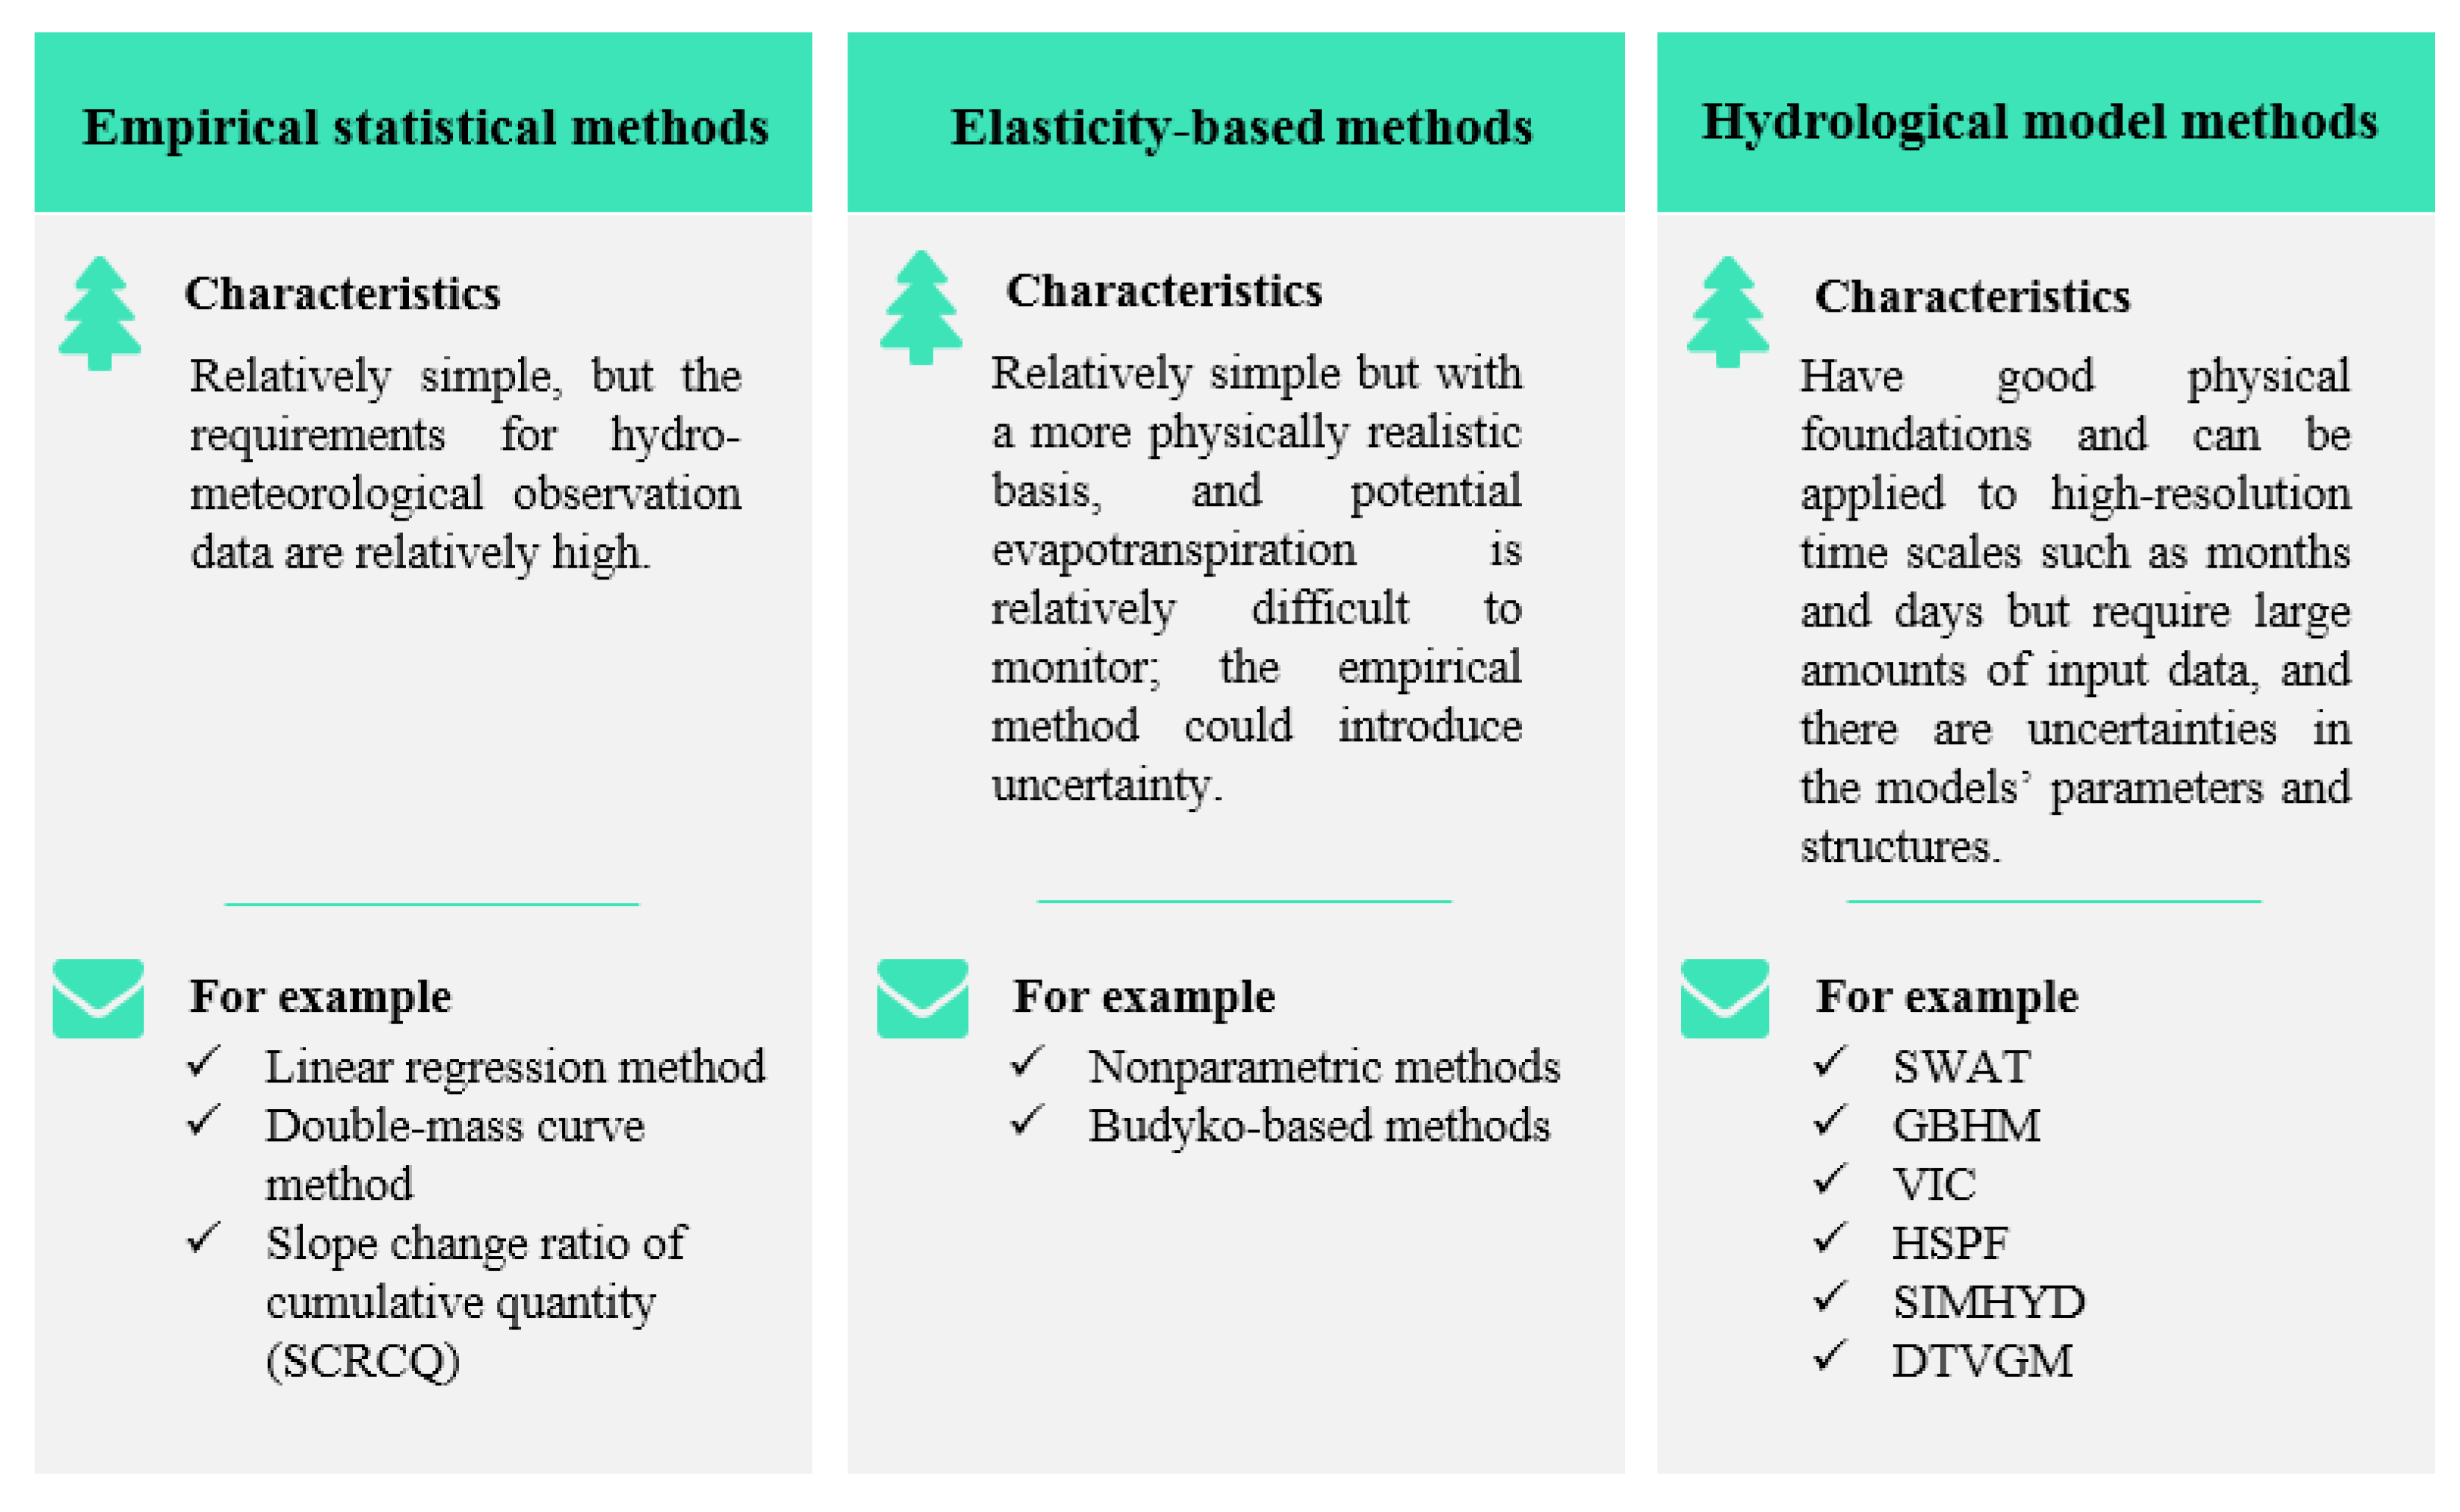
1. Introduction
2. Study Area and Data
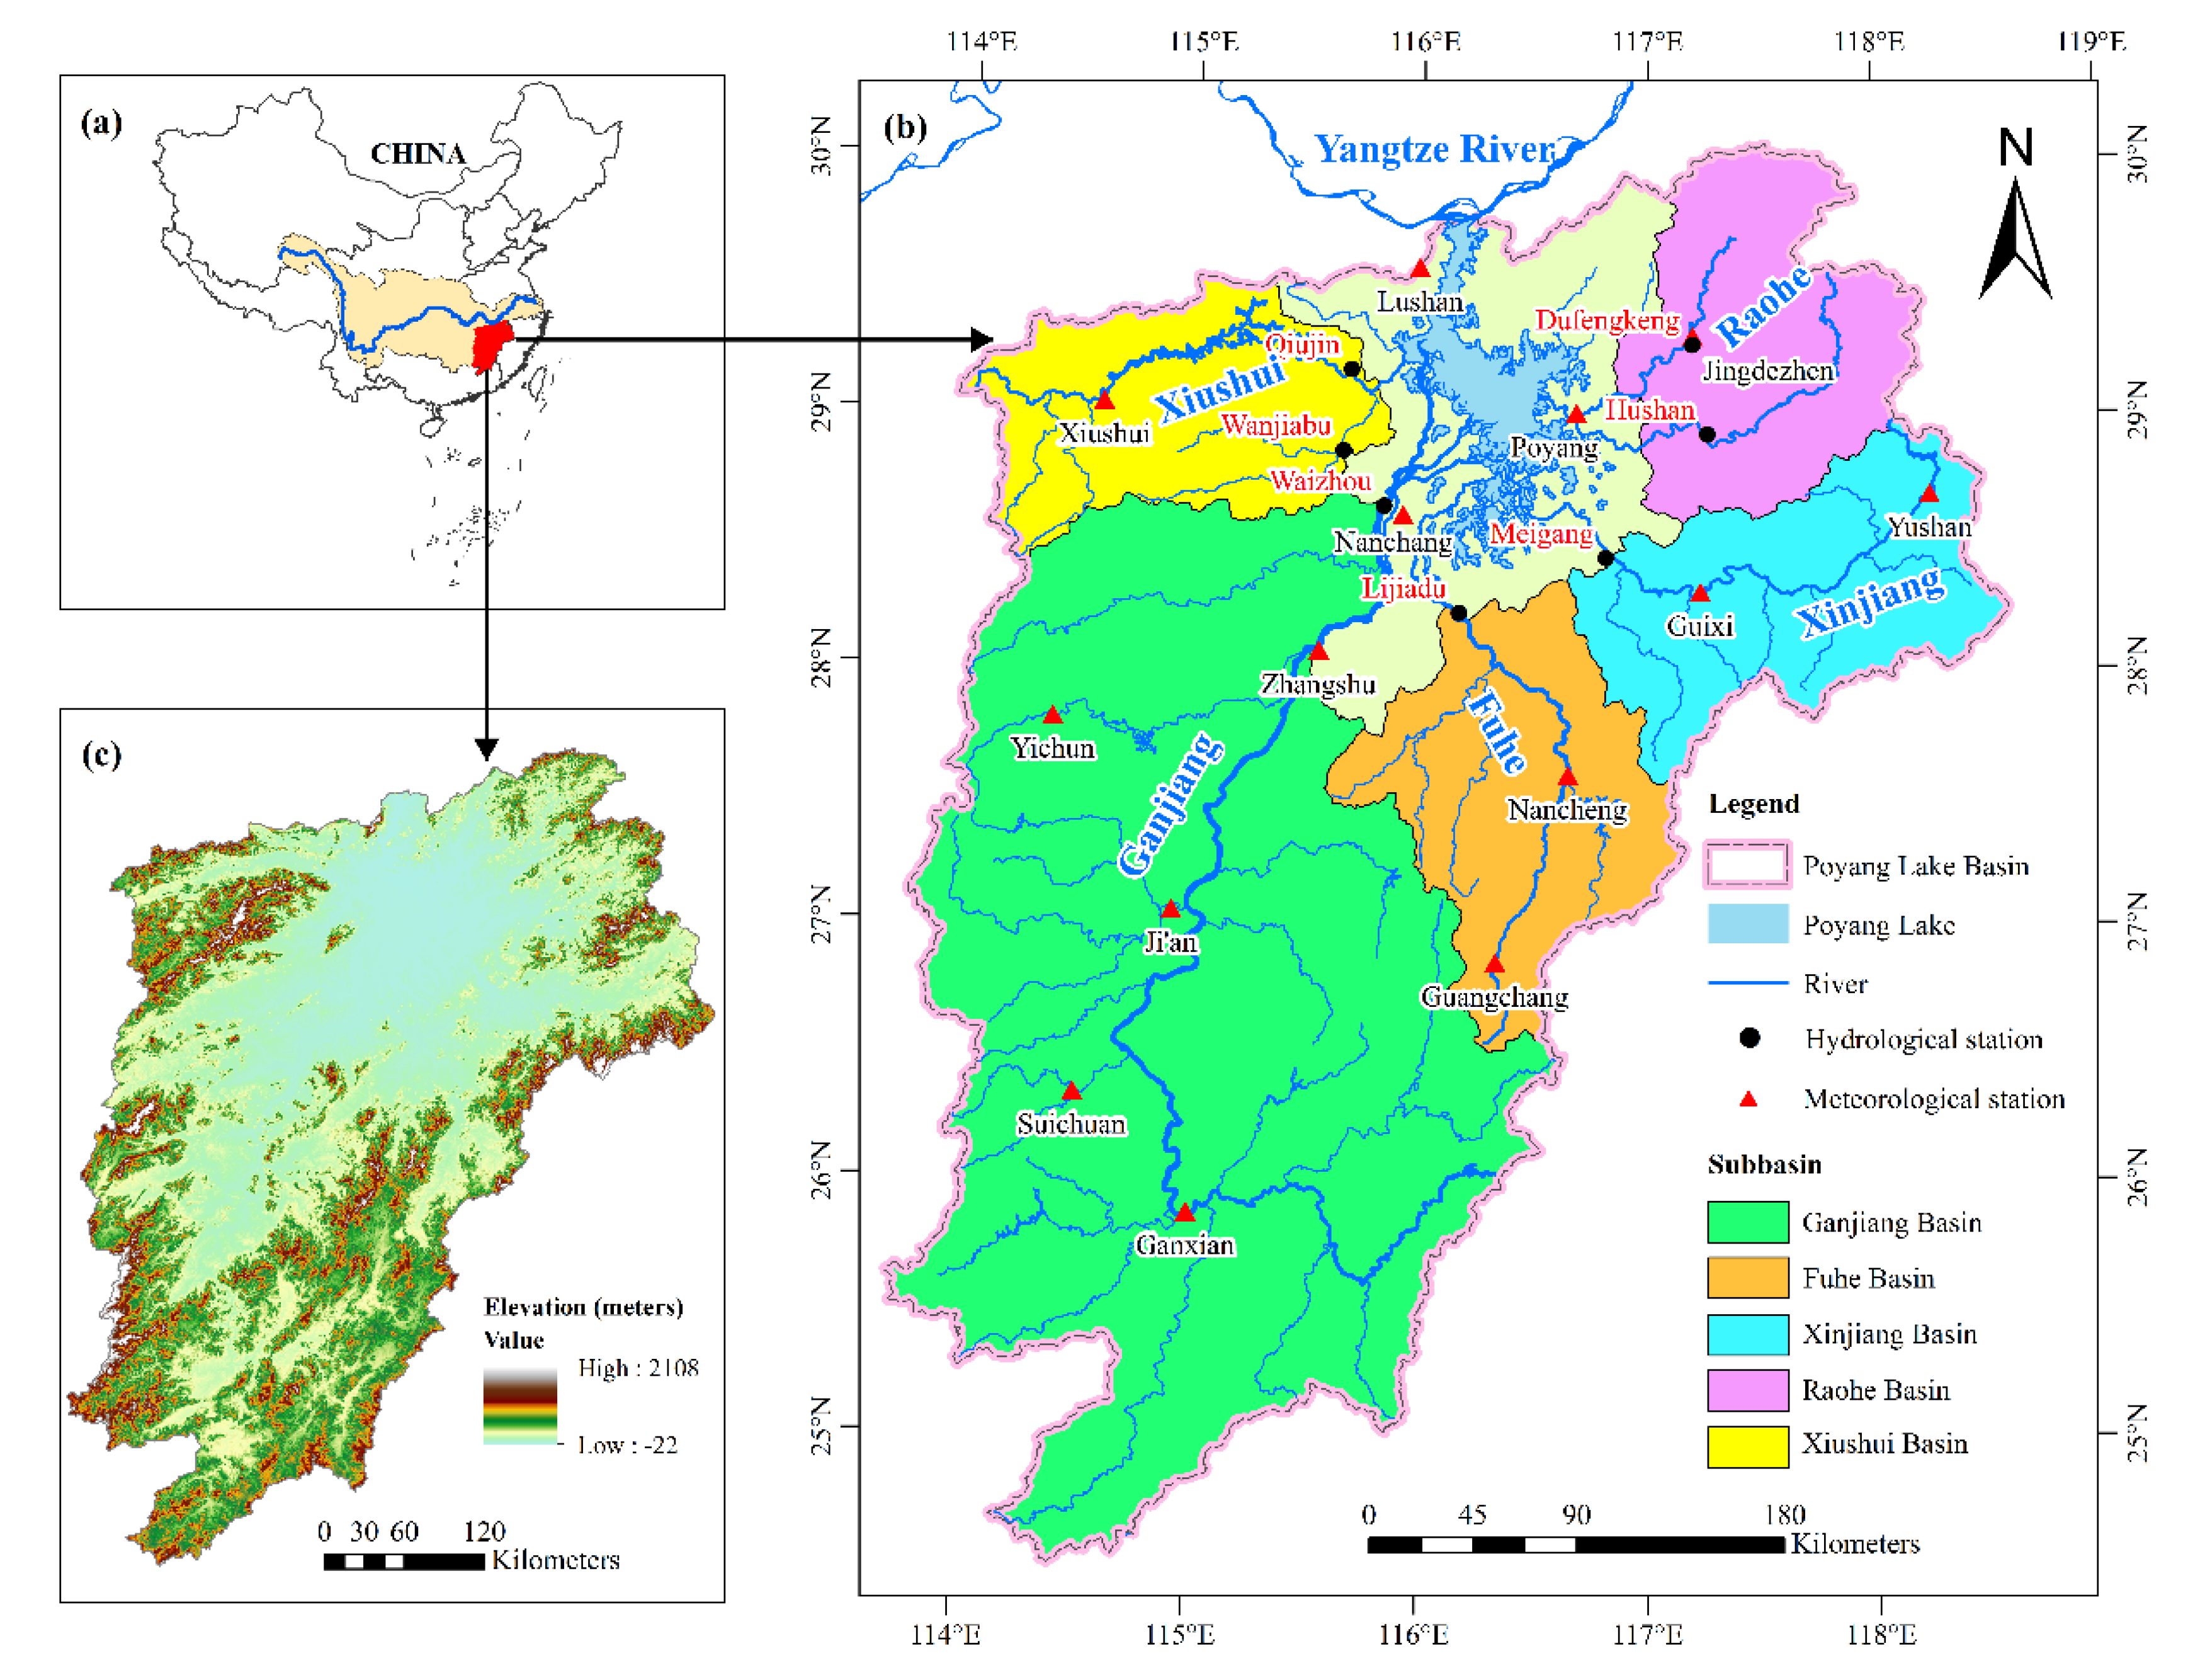
2.1. Study Area
2.2. Data
3. Methods
3.1. Mann-Kendall Trend Test
3.2. Cumulative Anomaly
3.3. Hurst Exponent Analysis
3.4. SCRCQ Method
4. Results
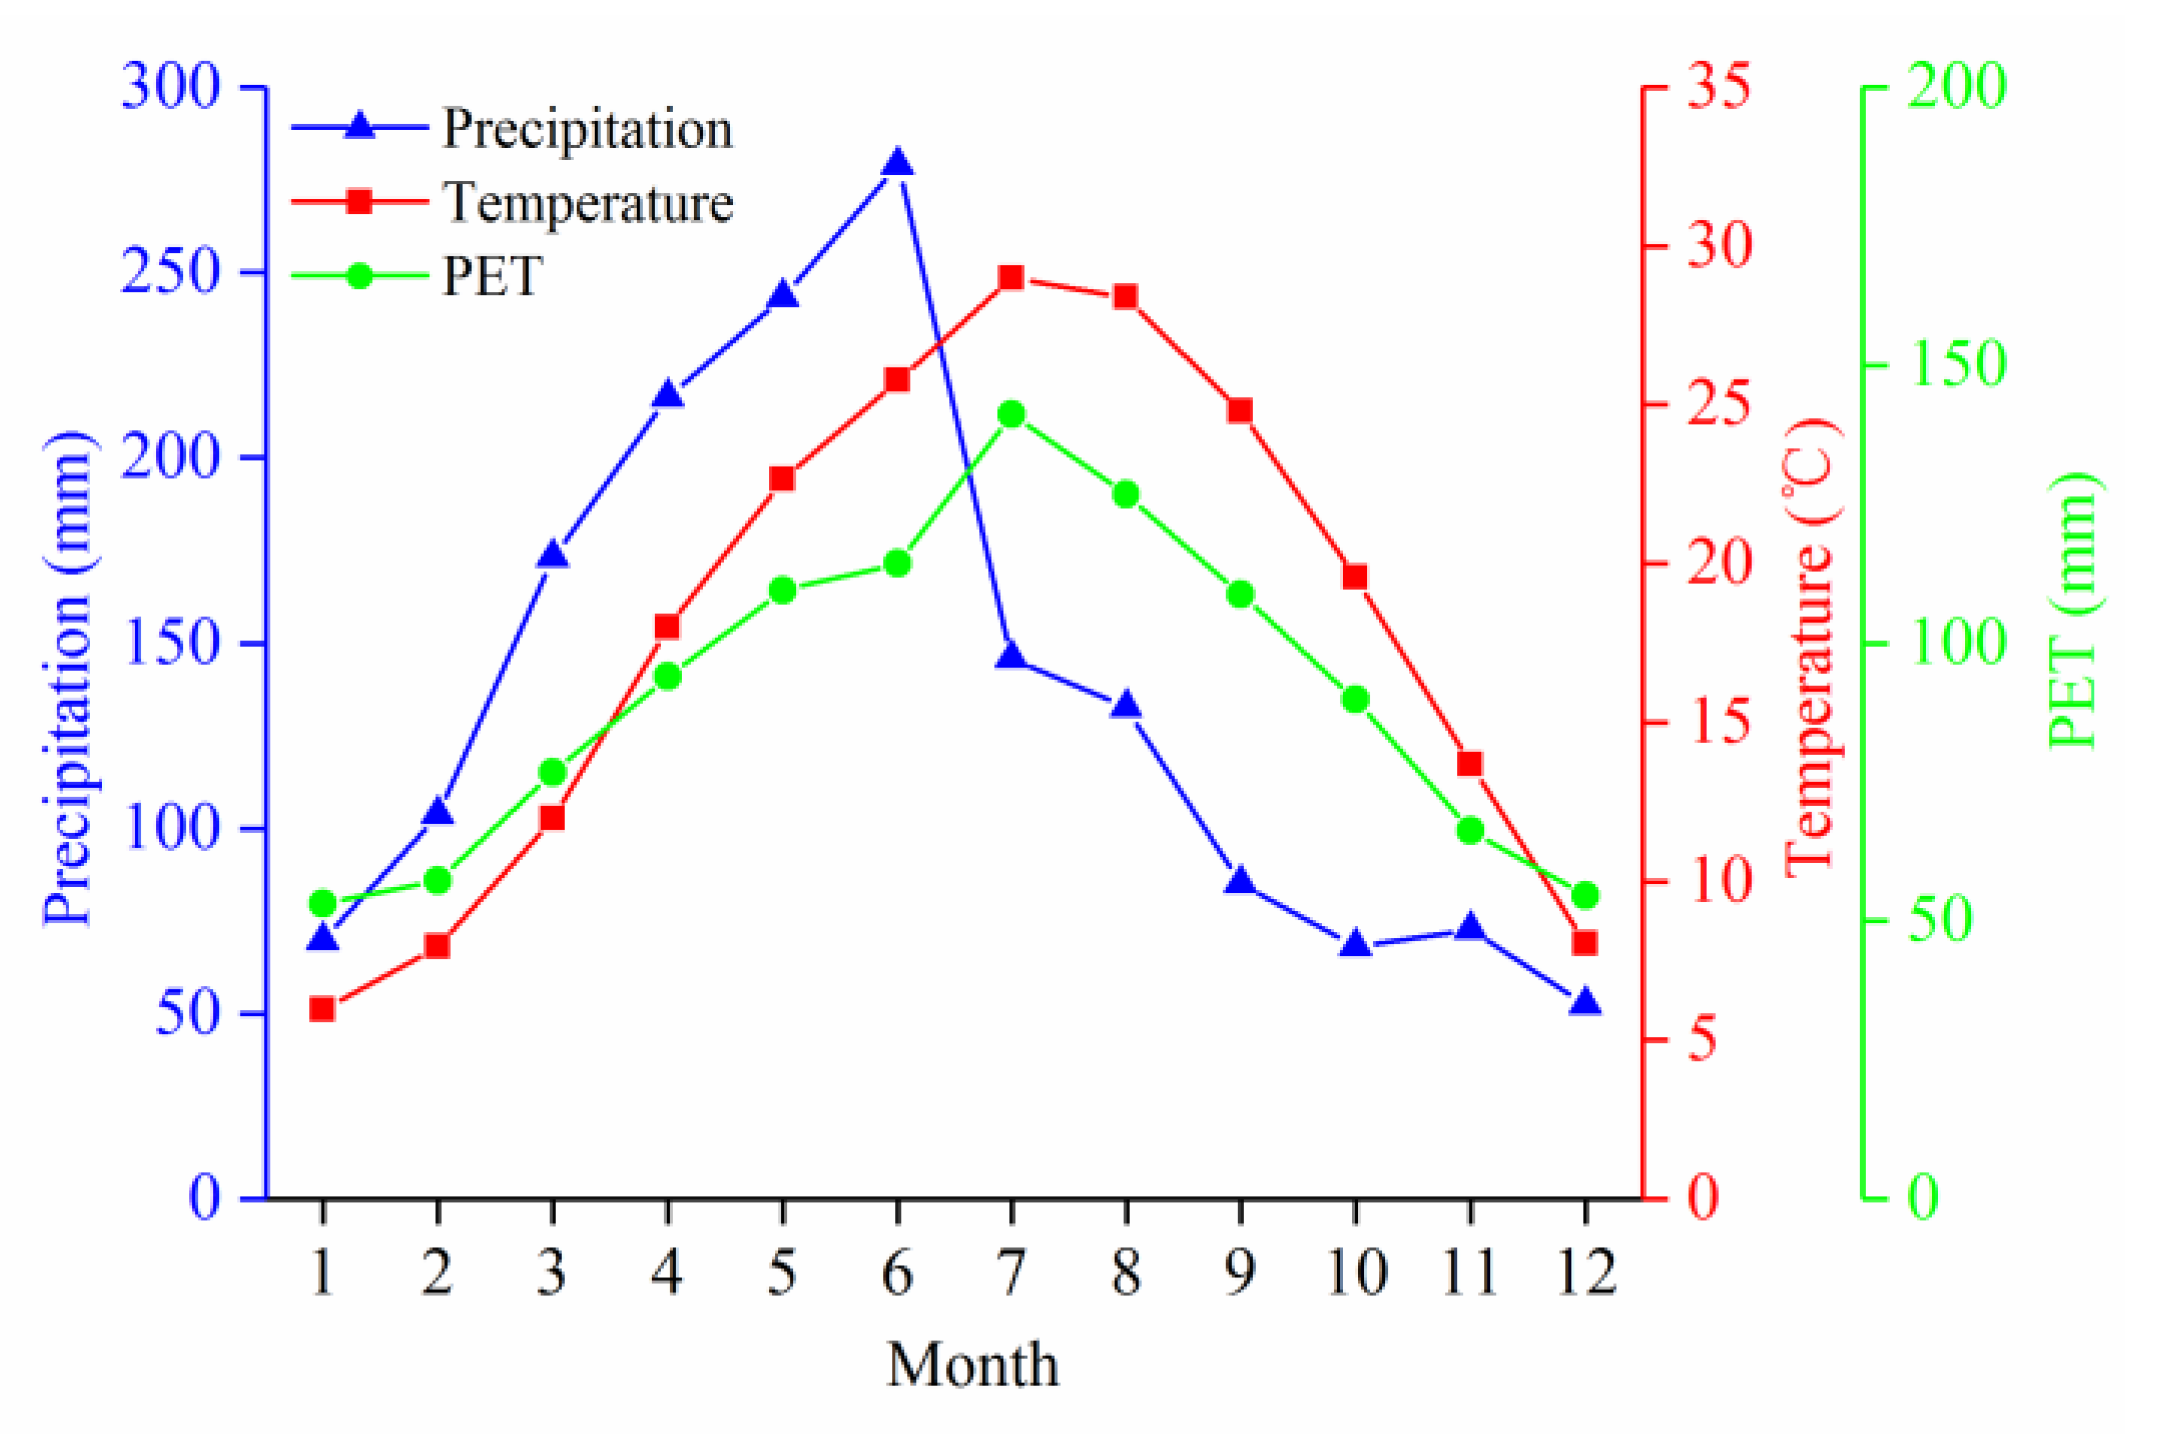
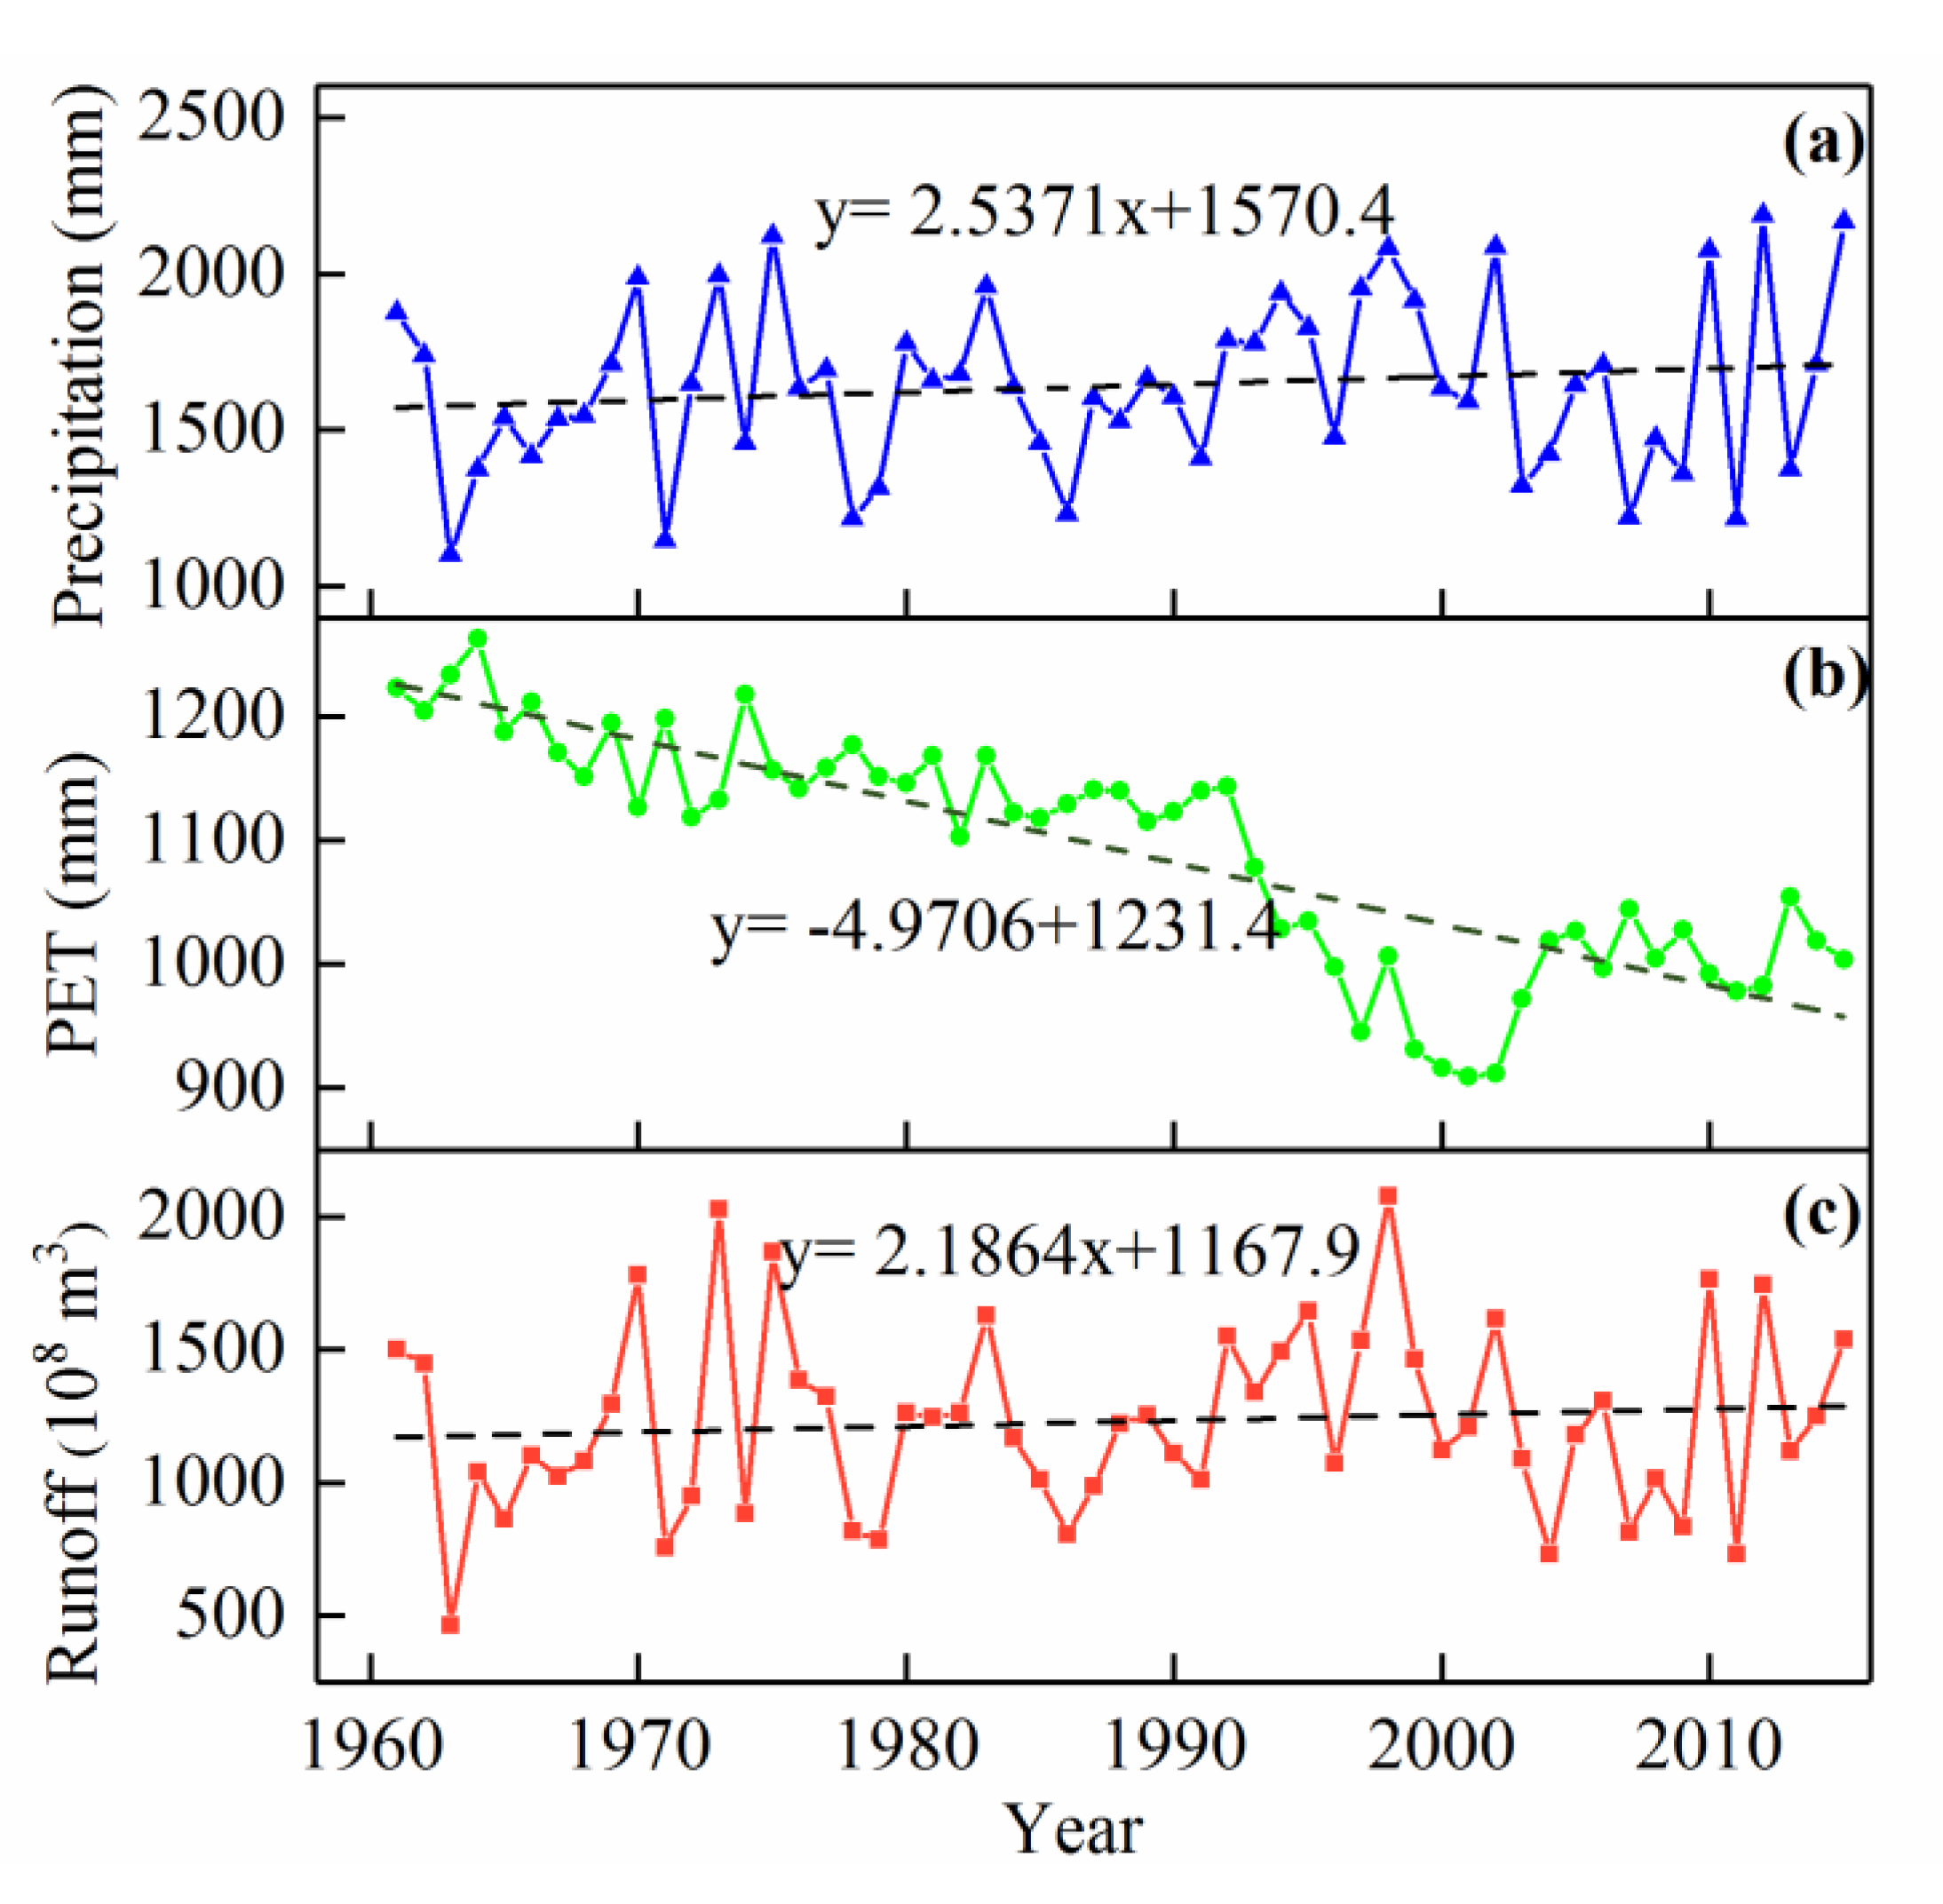
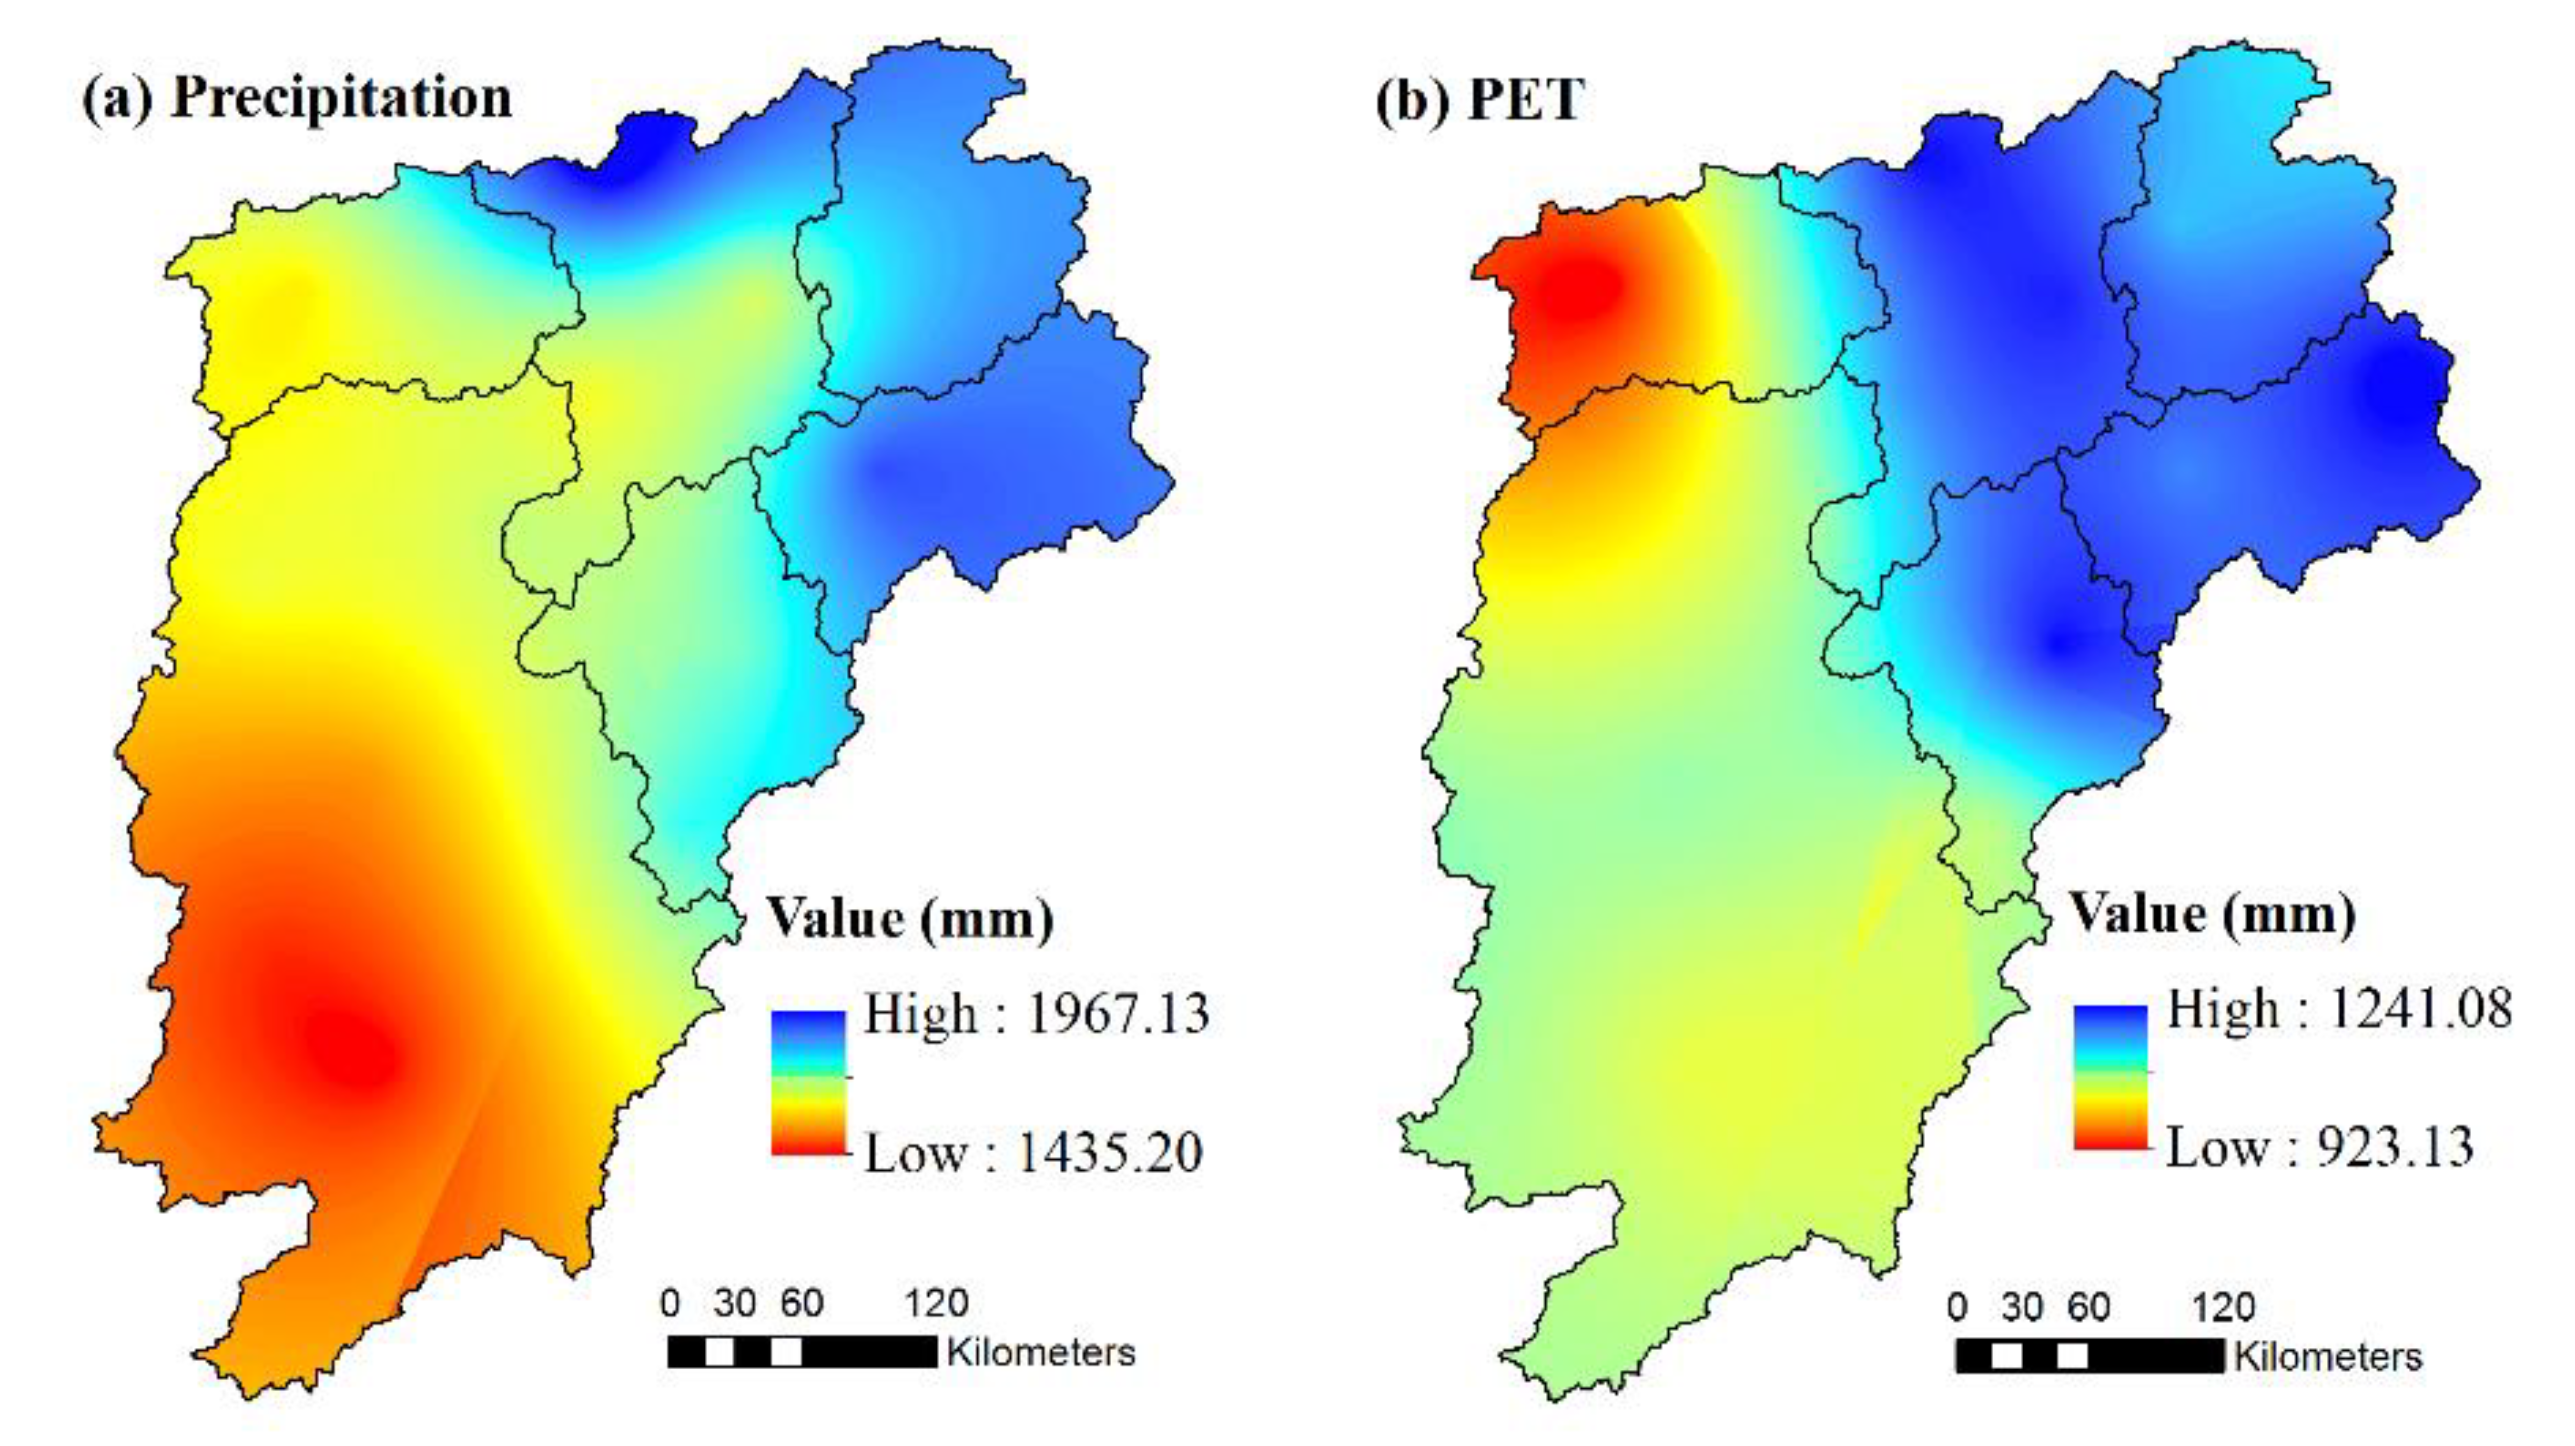
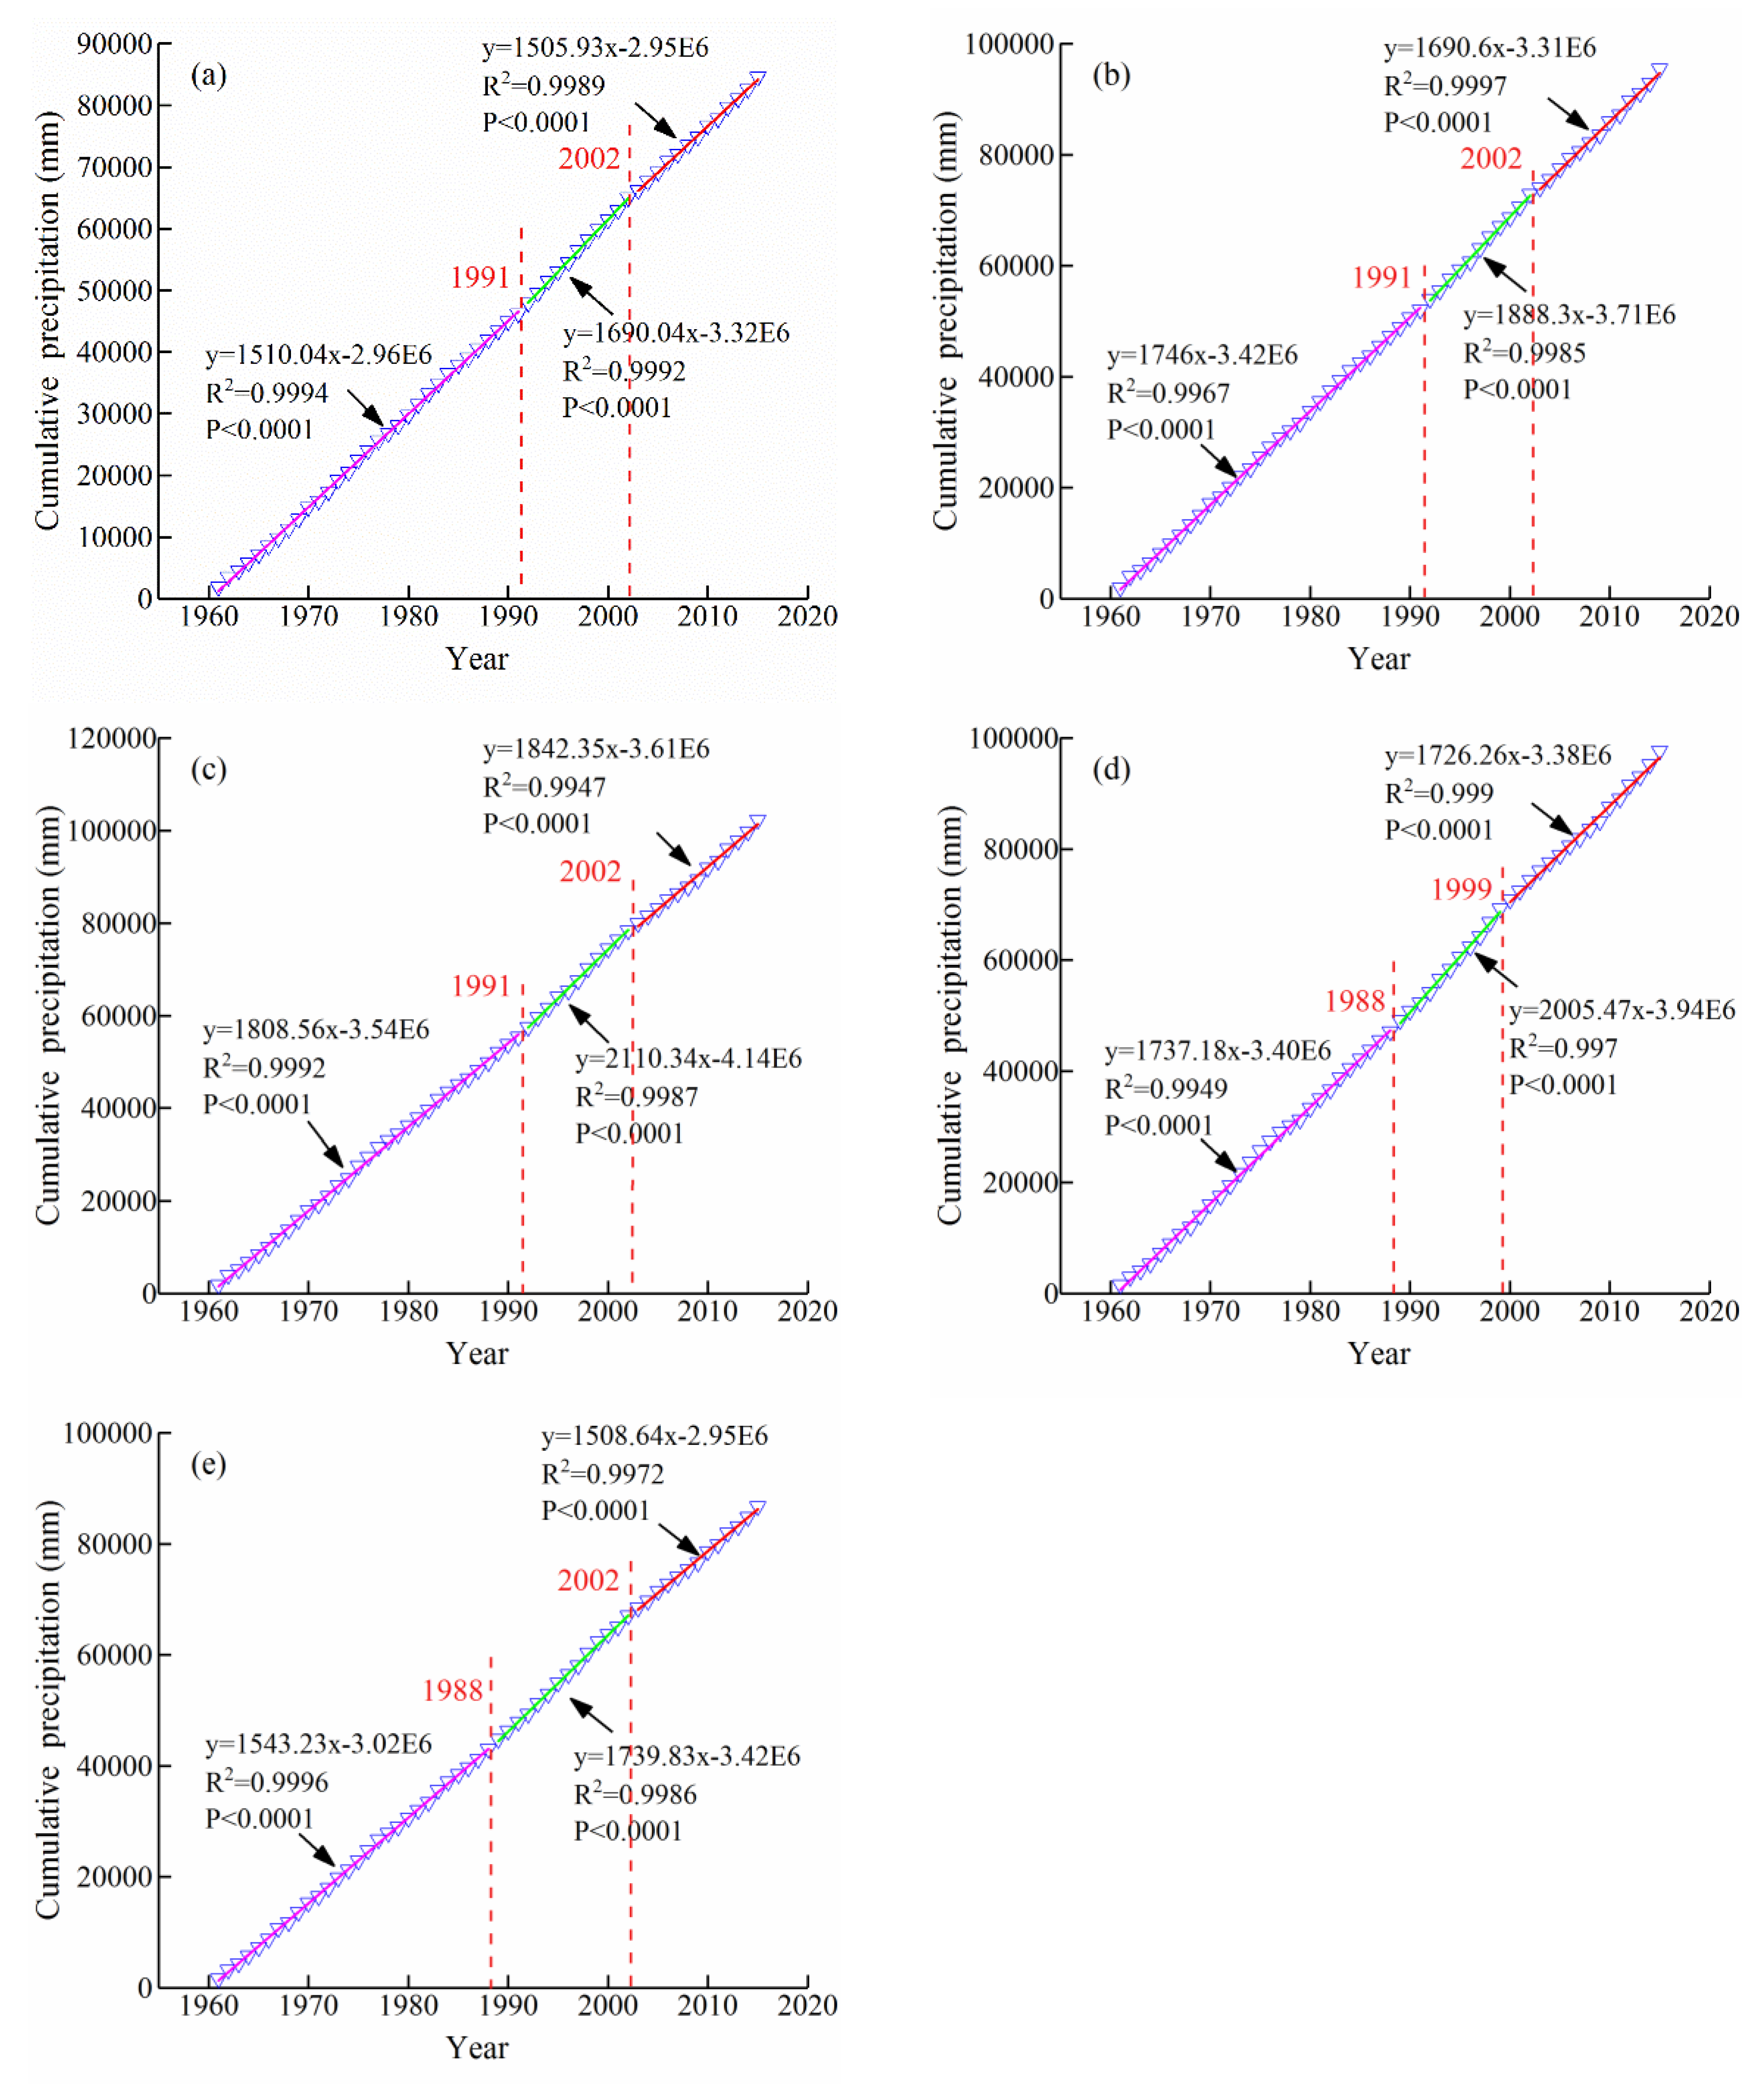
4.1. Changes in Precipitation and PET
4.2. Changes in Runoff
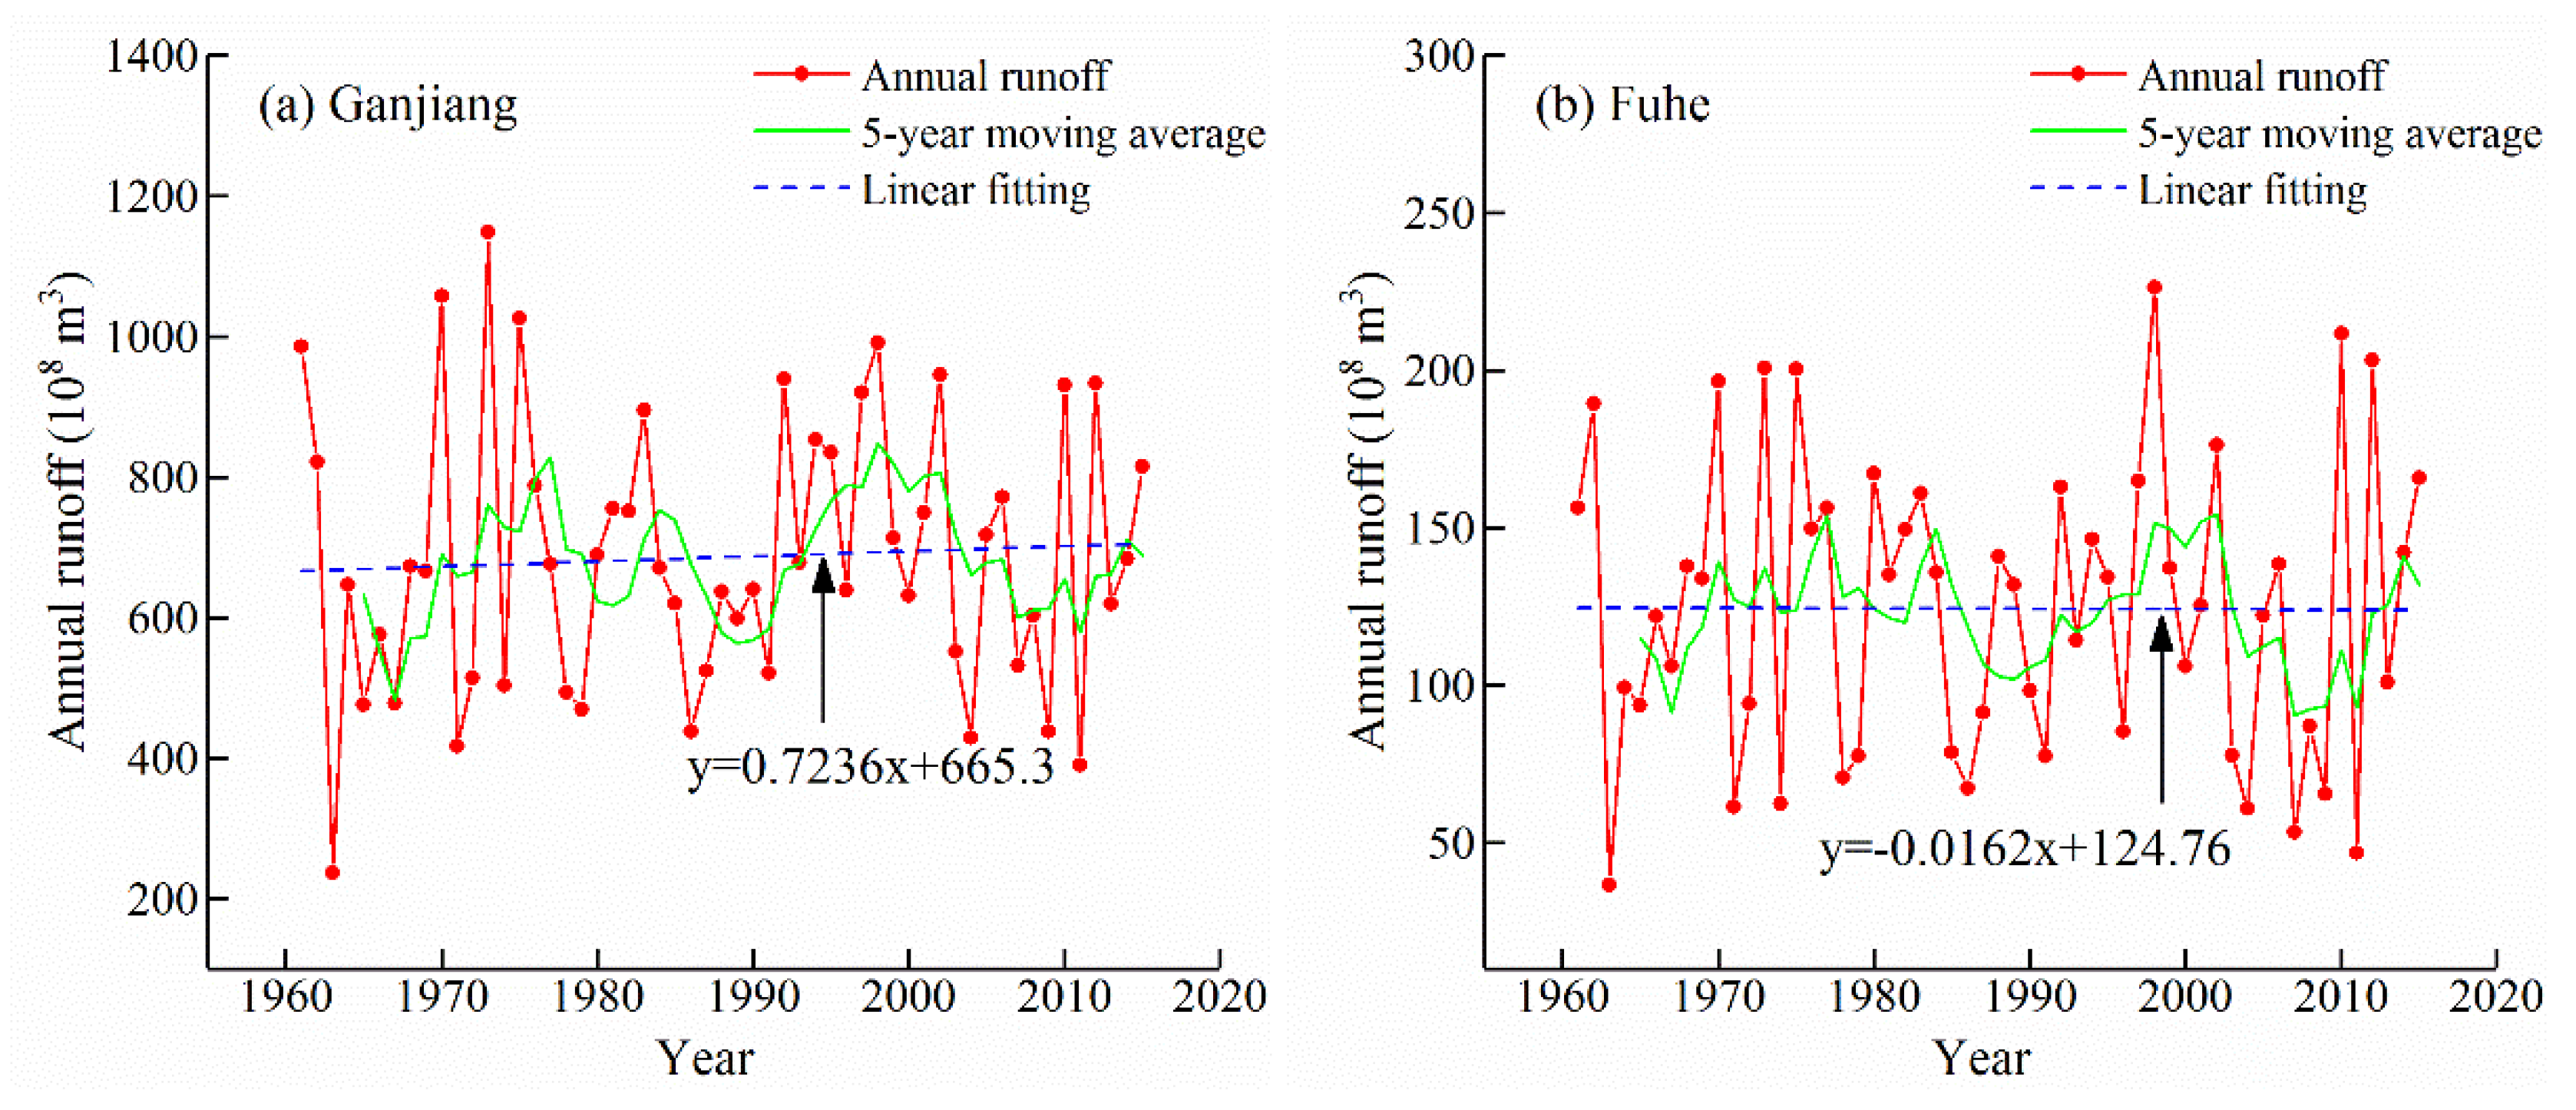
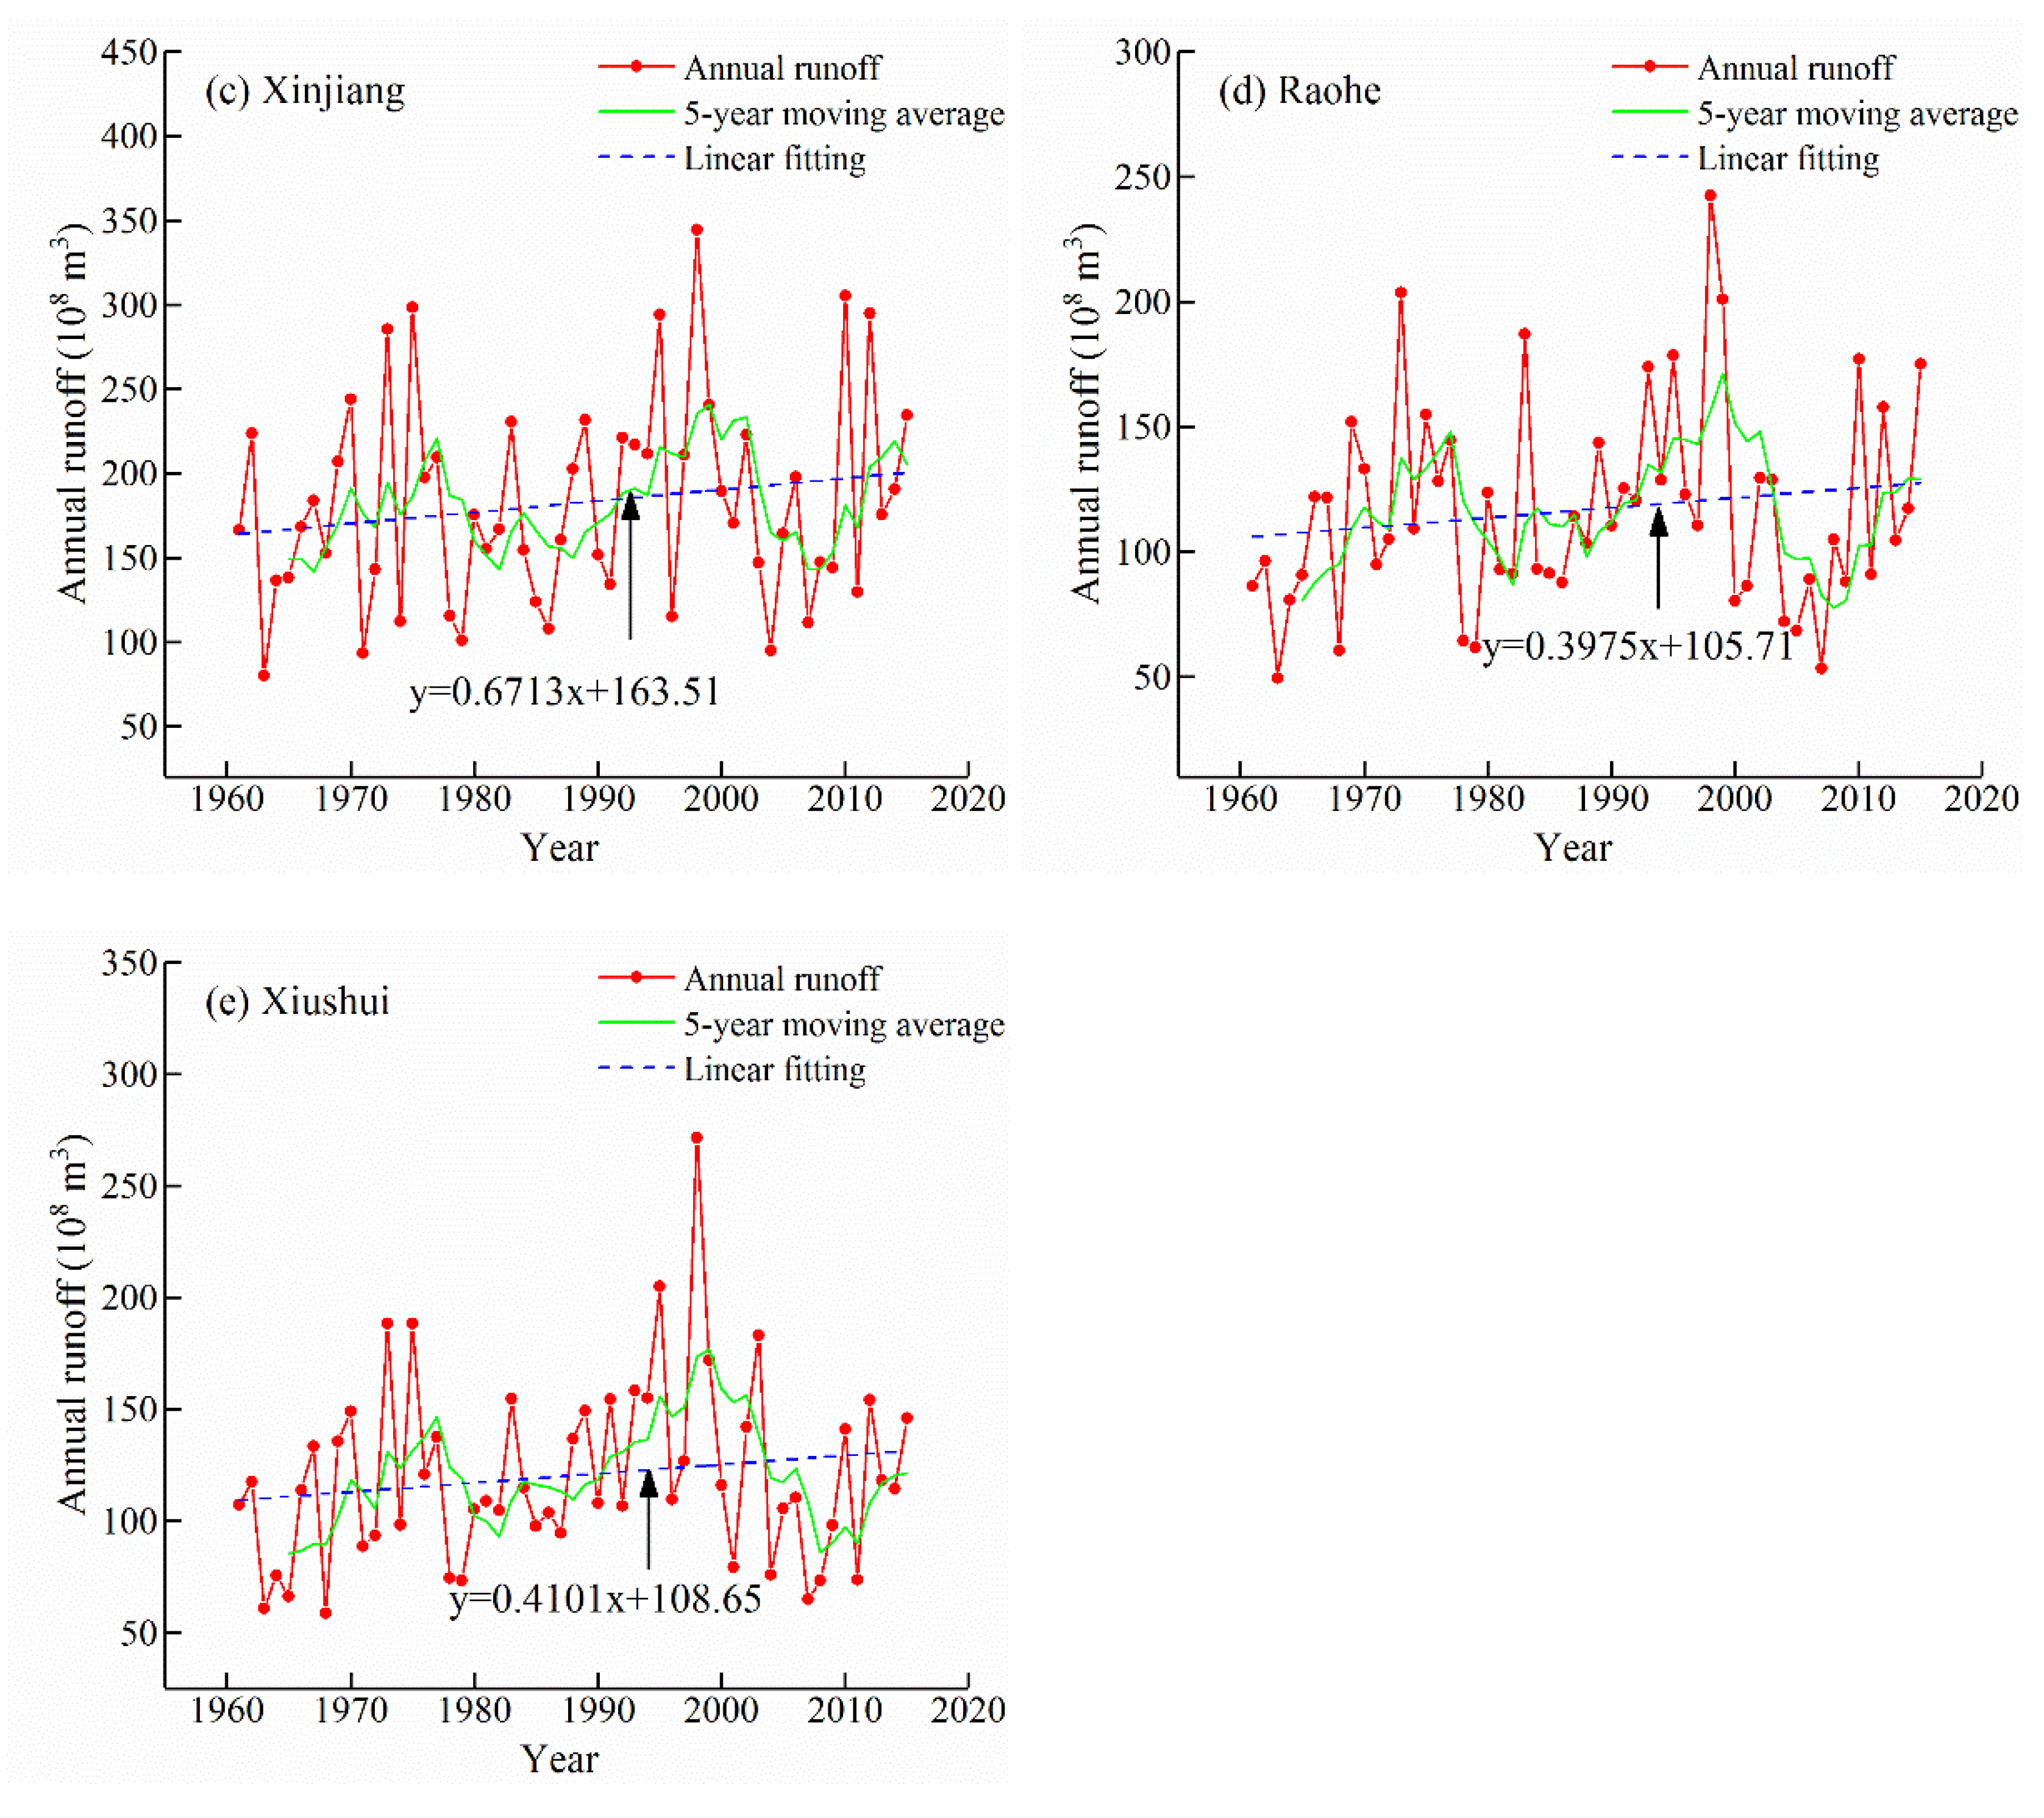
4.2.1. Trend Change Characteristics
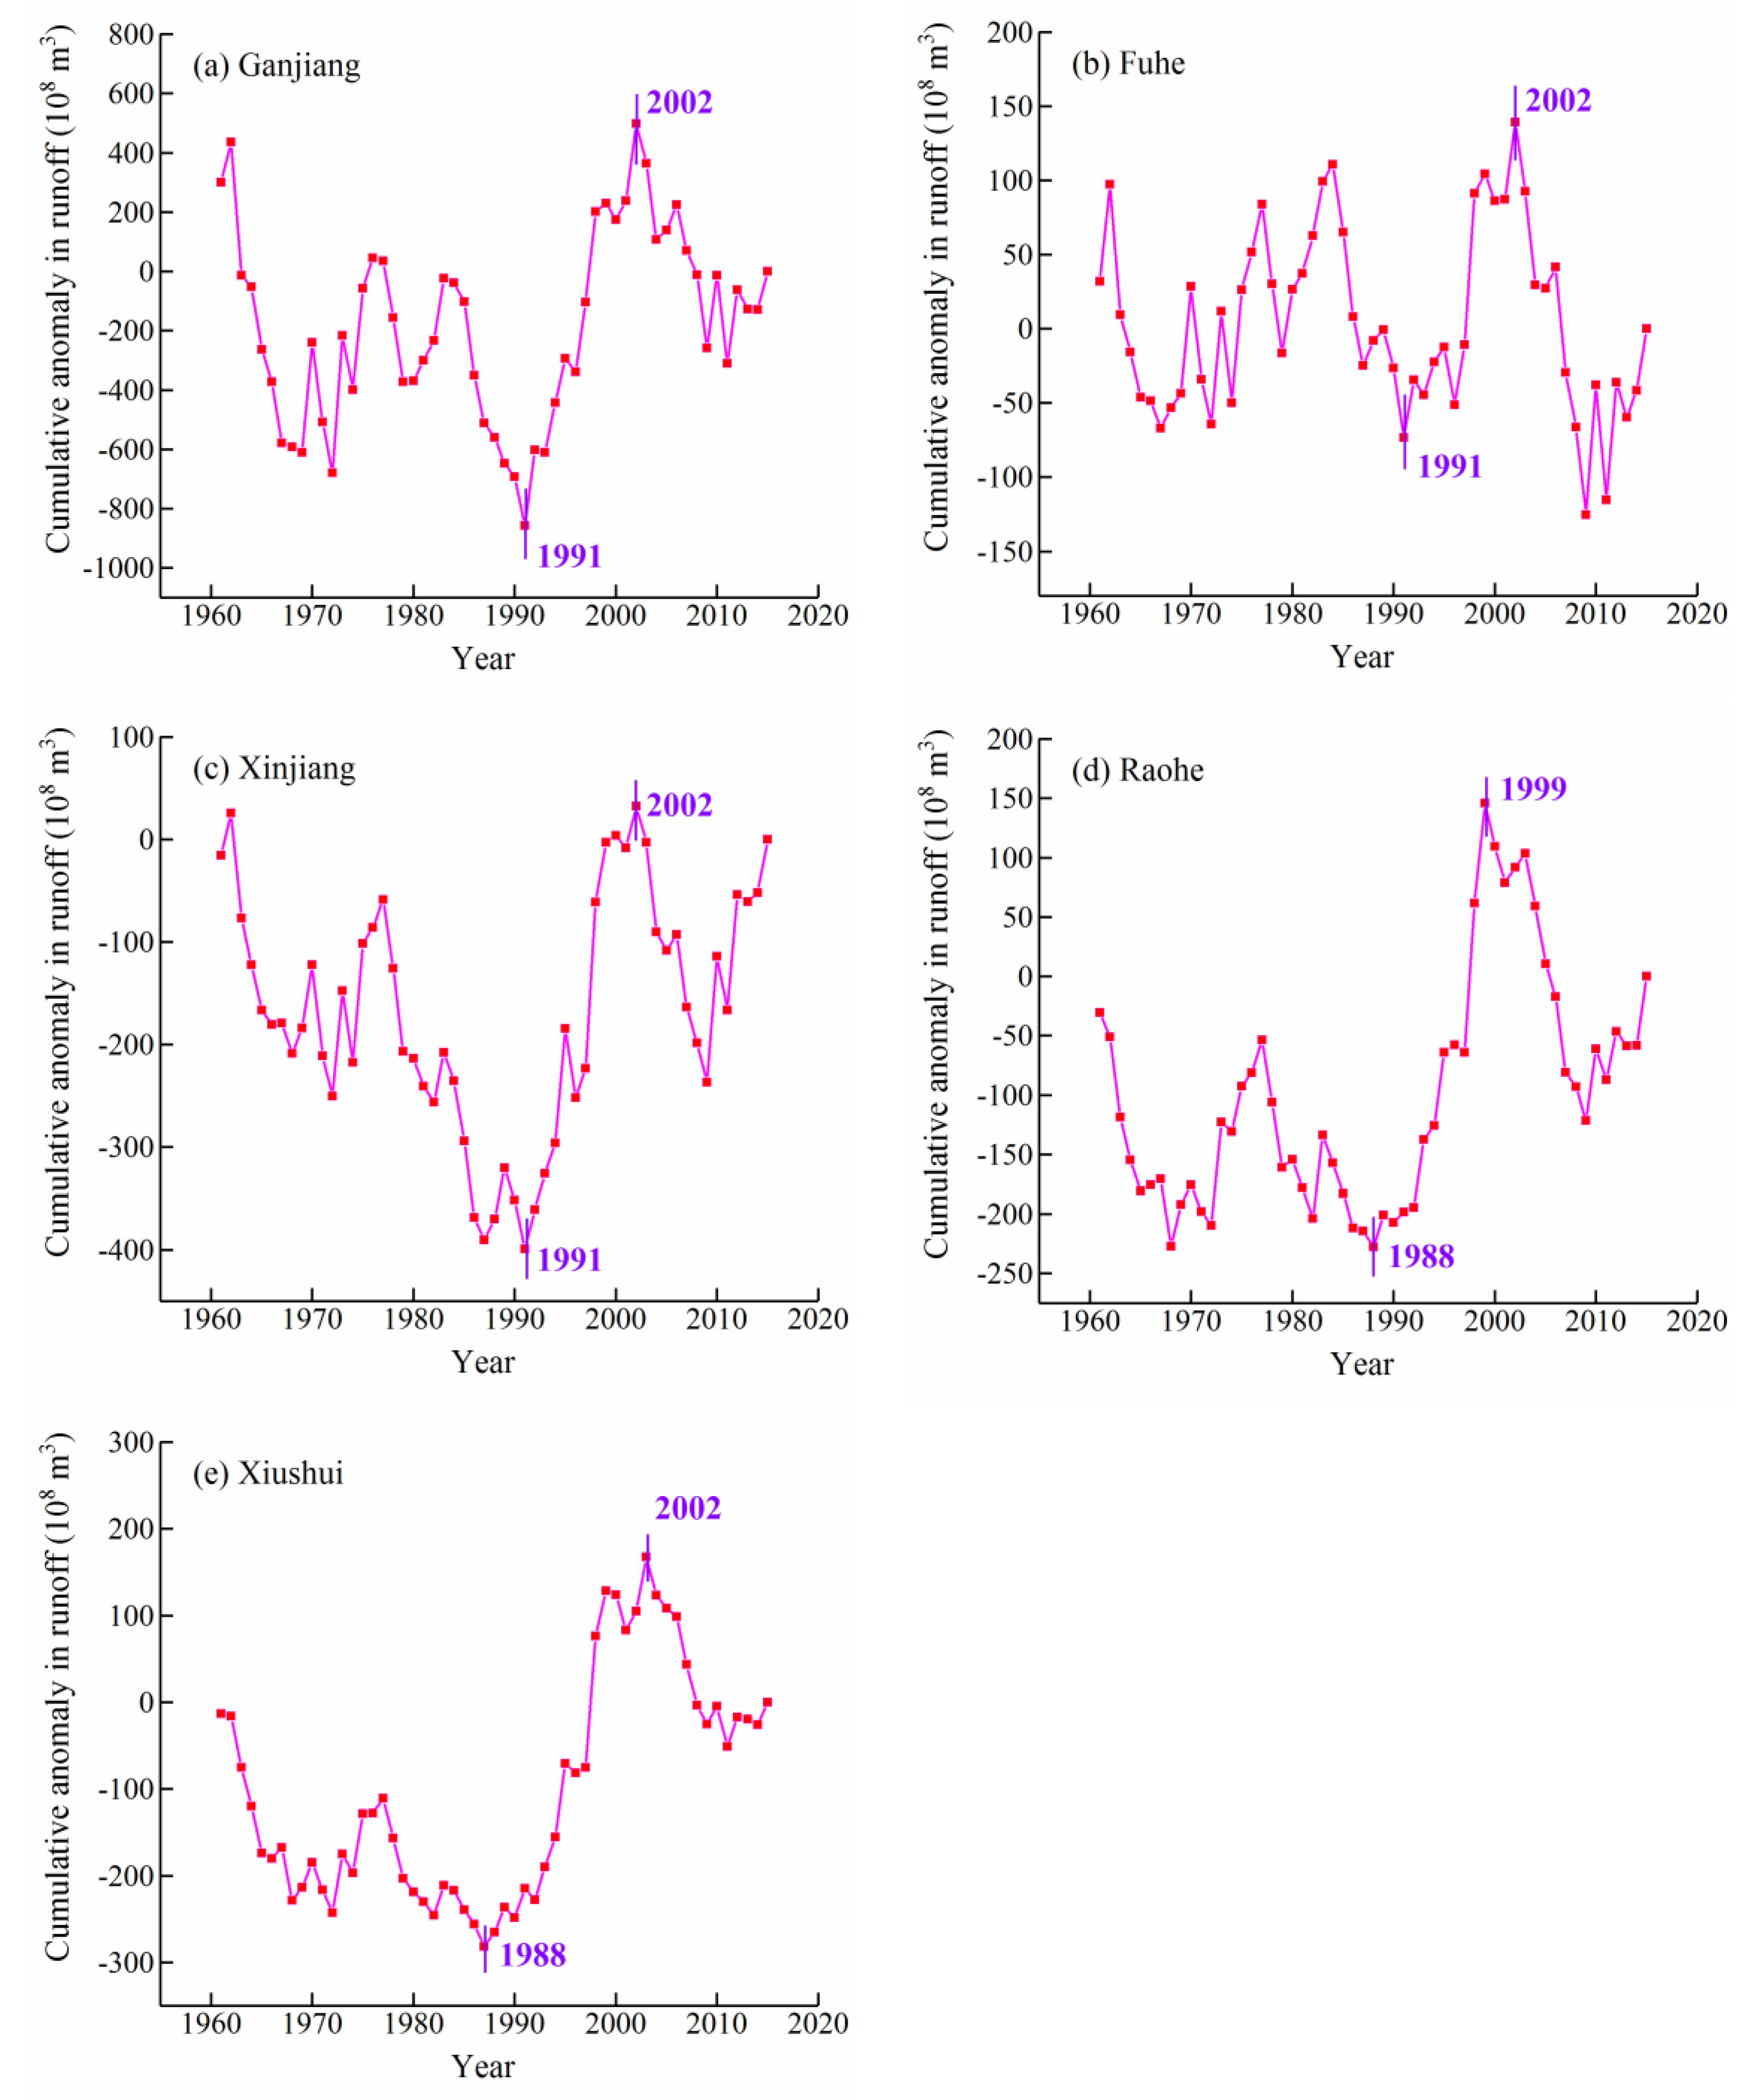
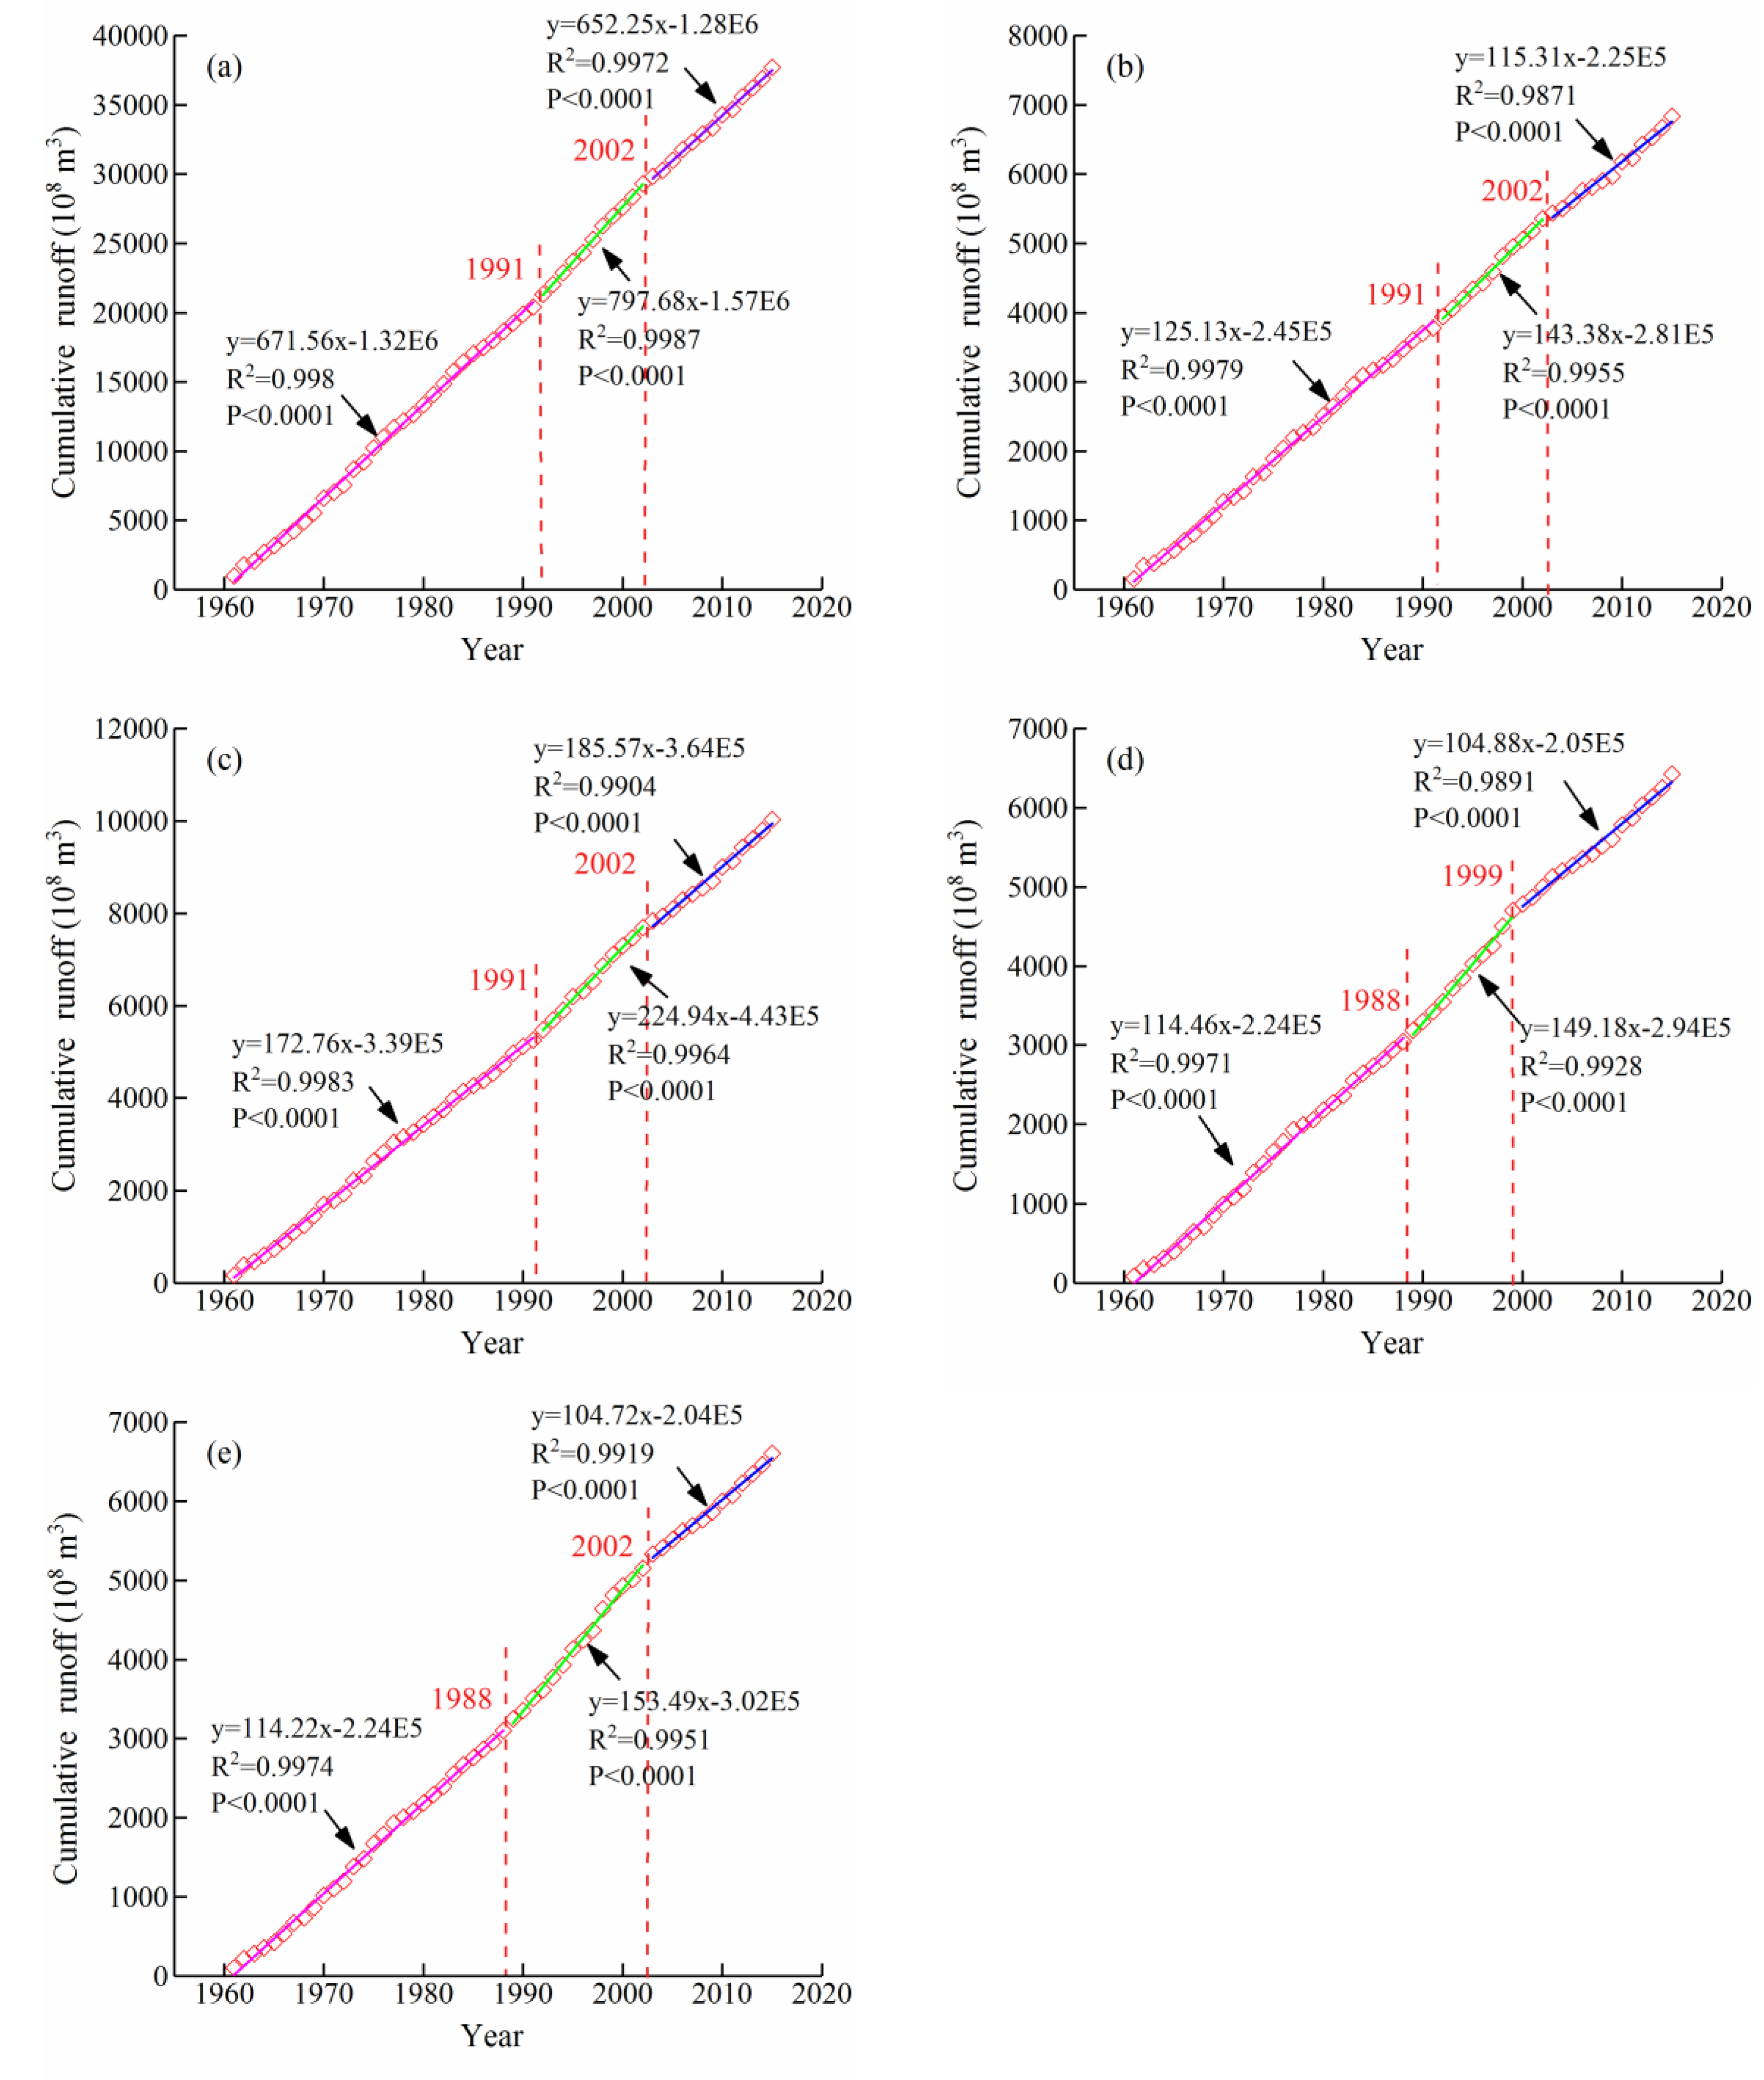
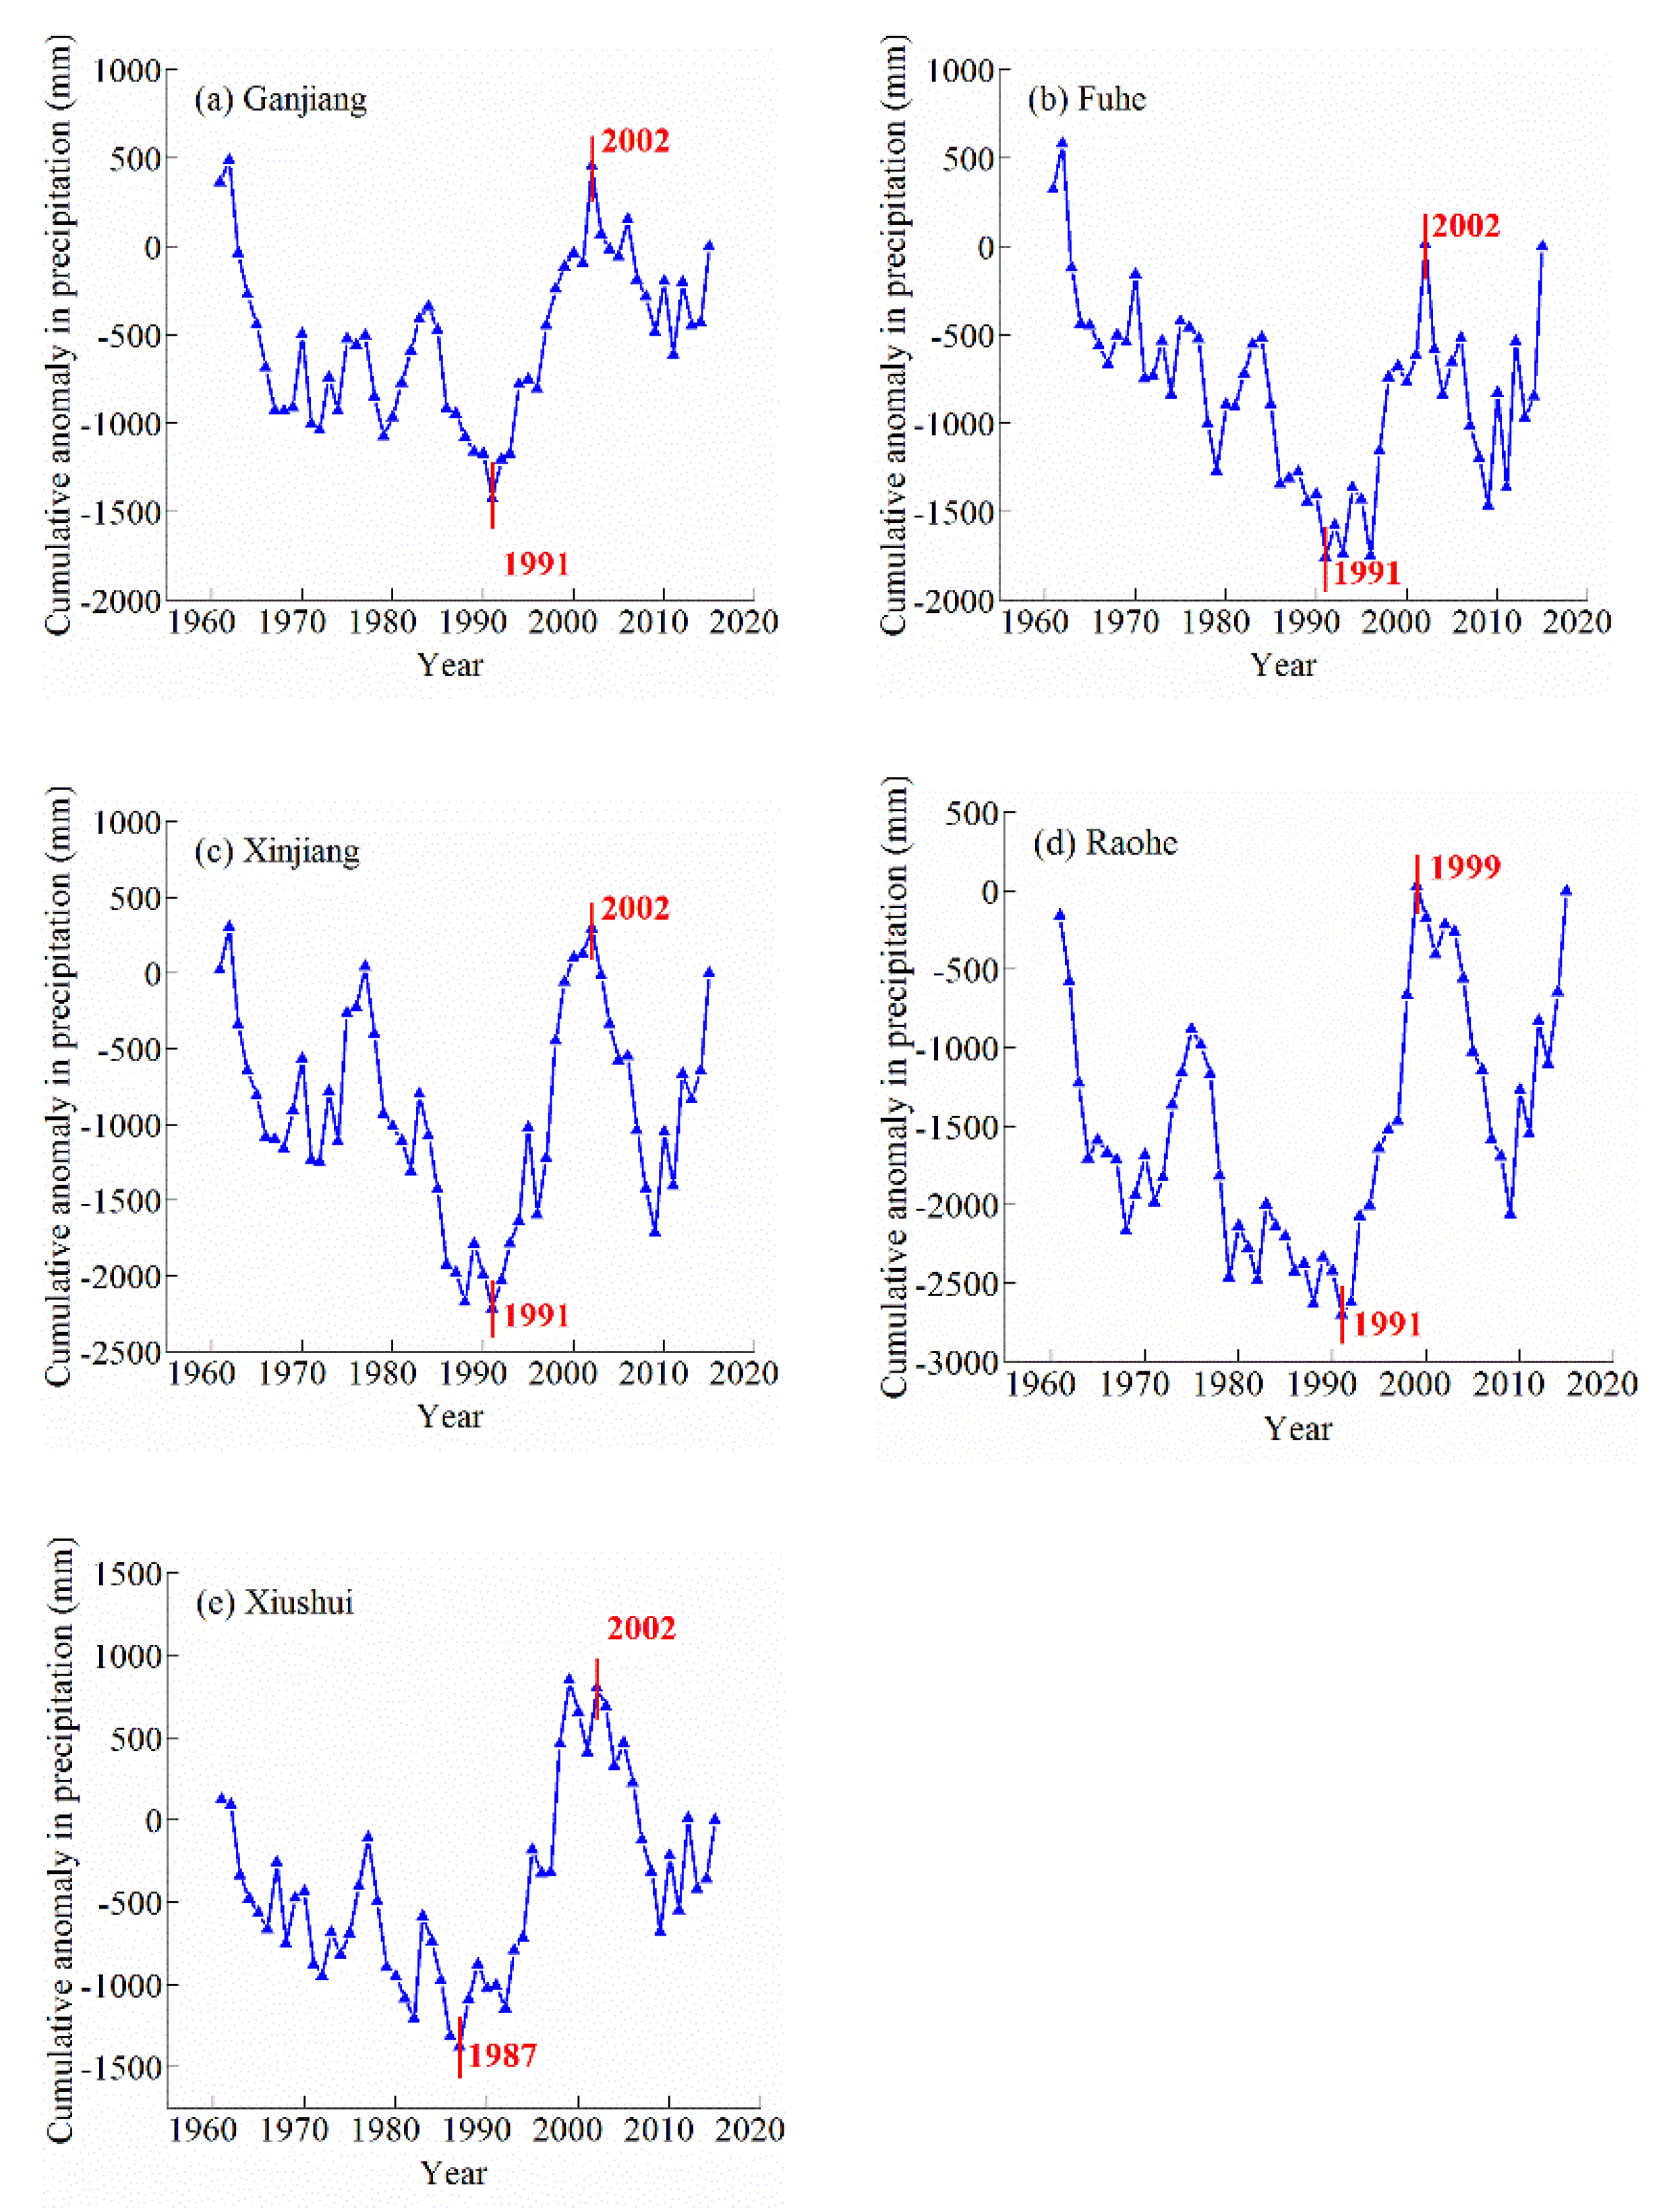
4.2.2. Abrupt Change Characteristics
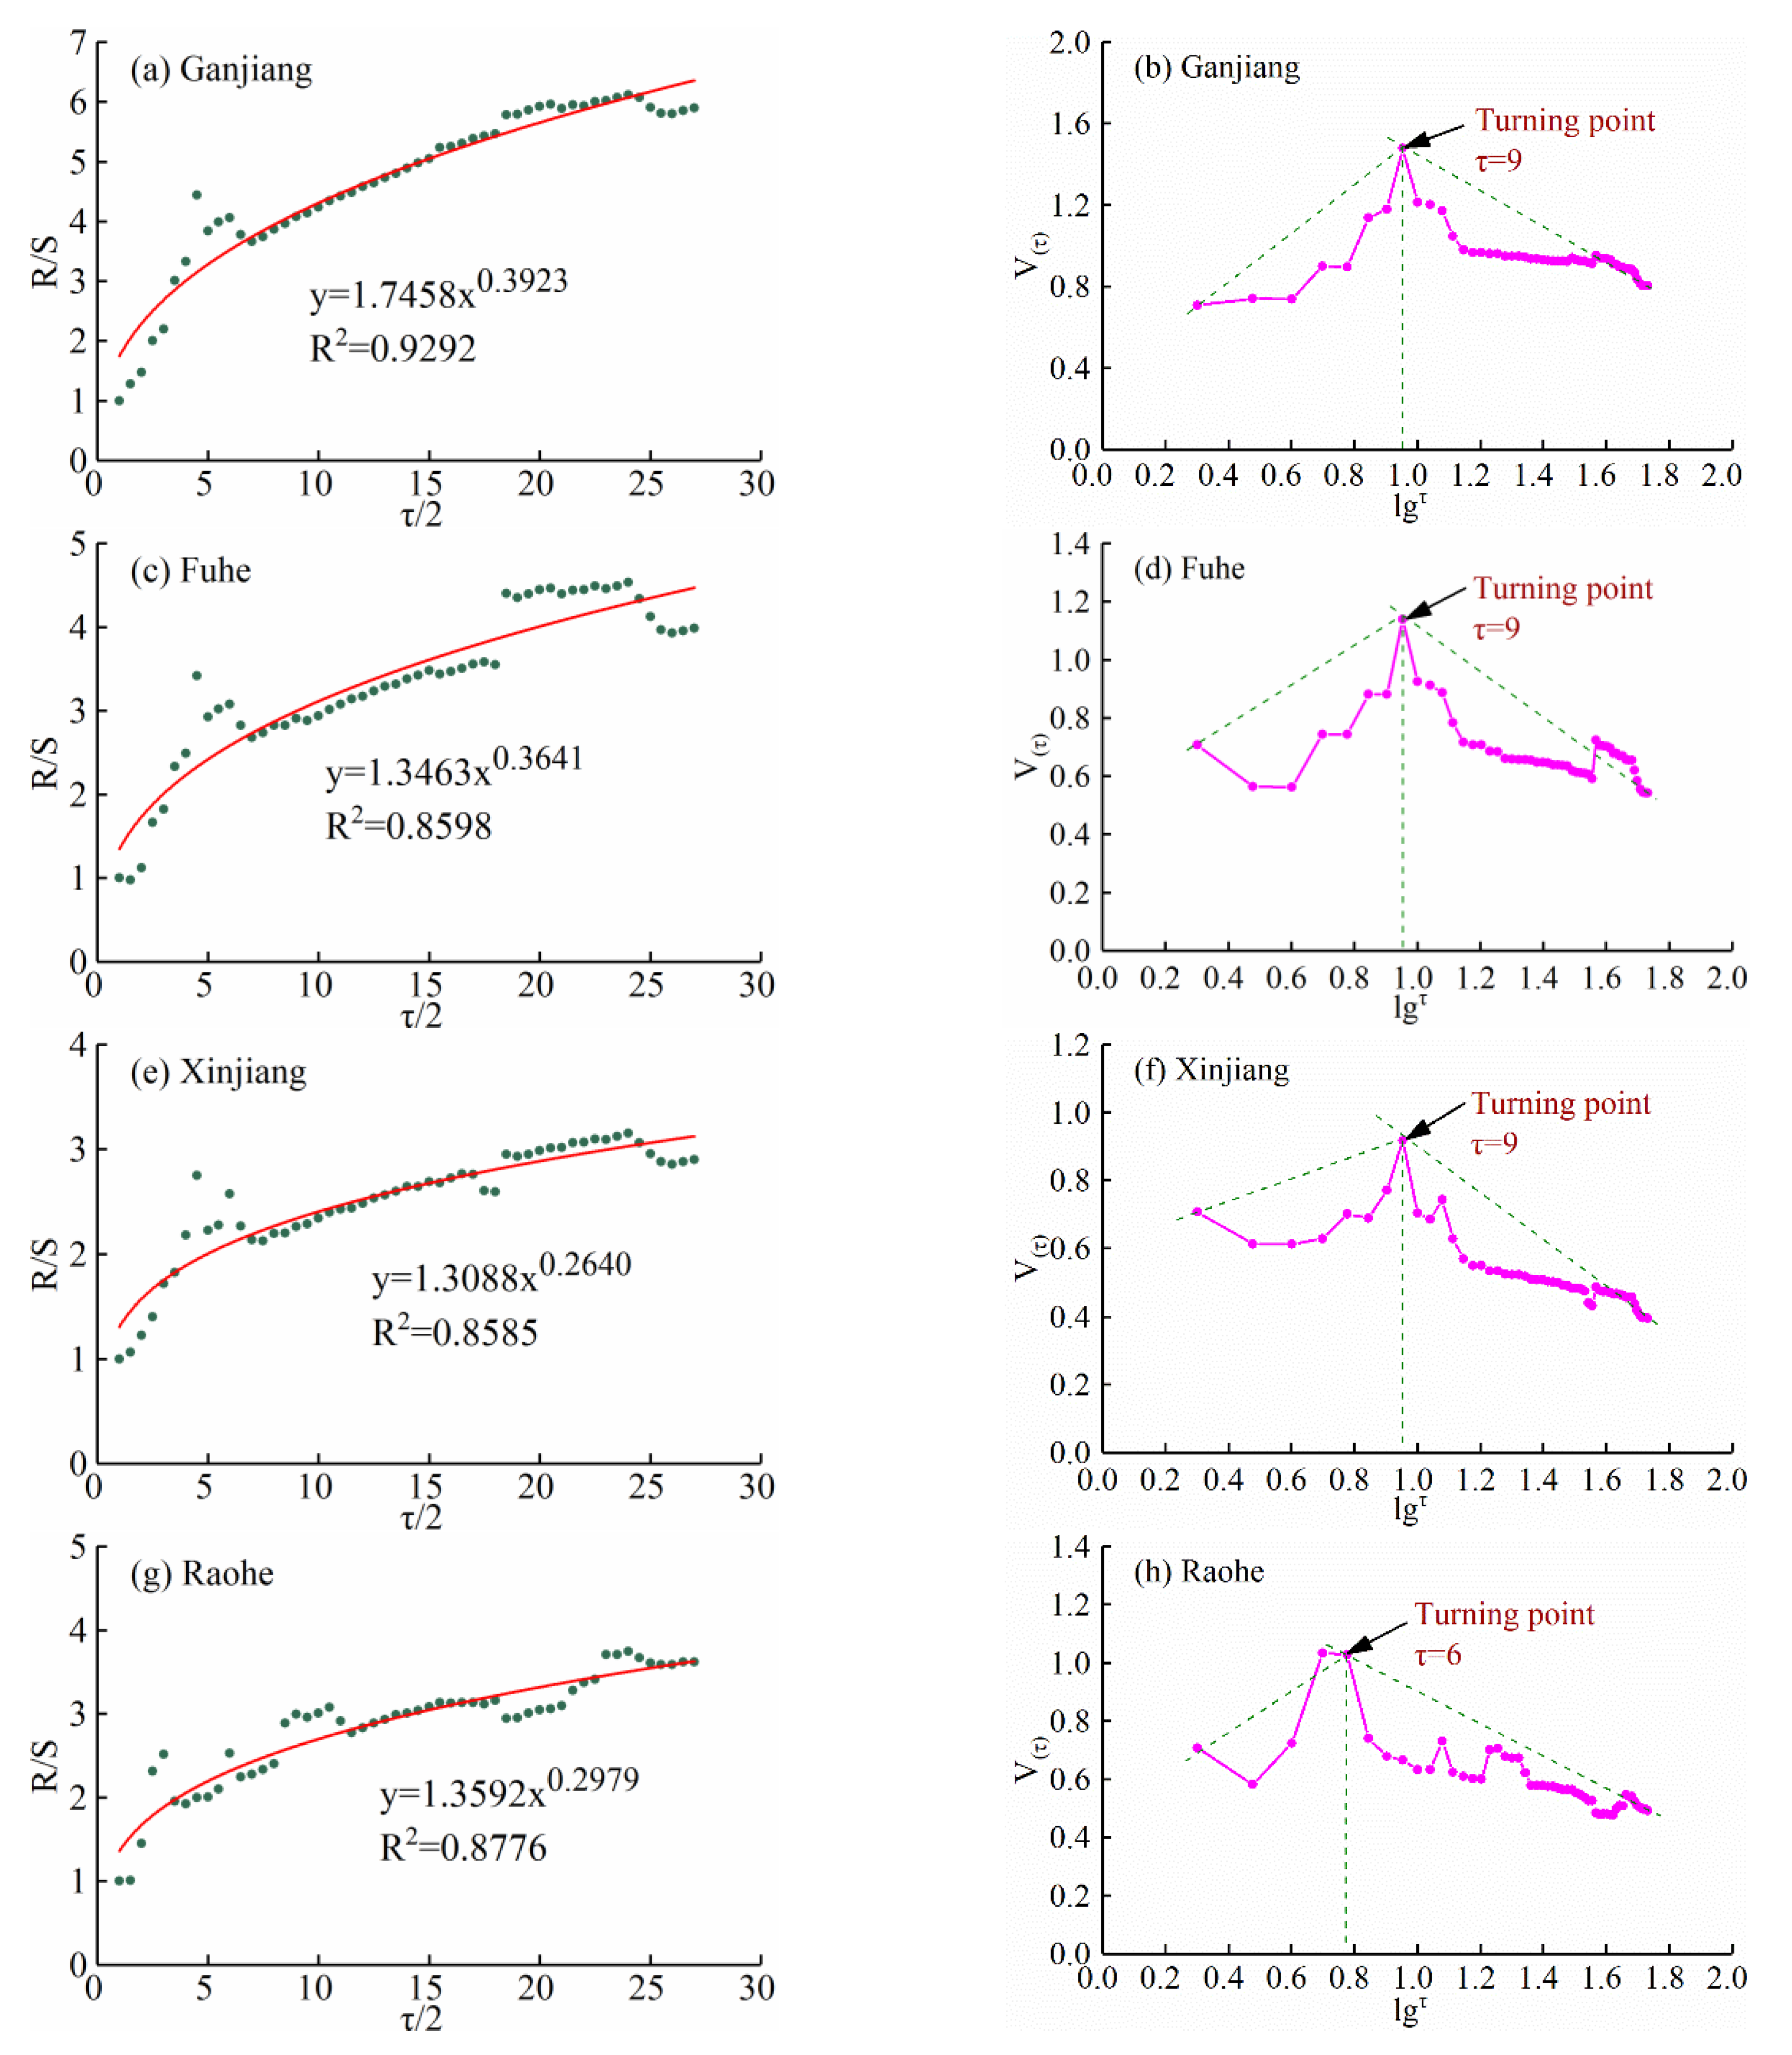
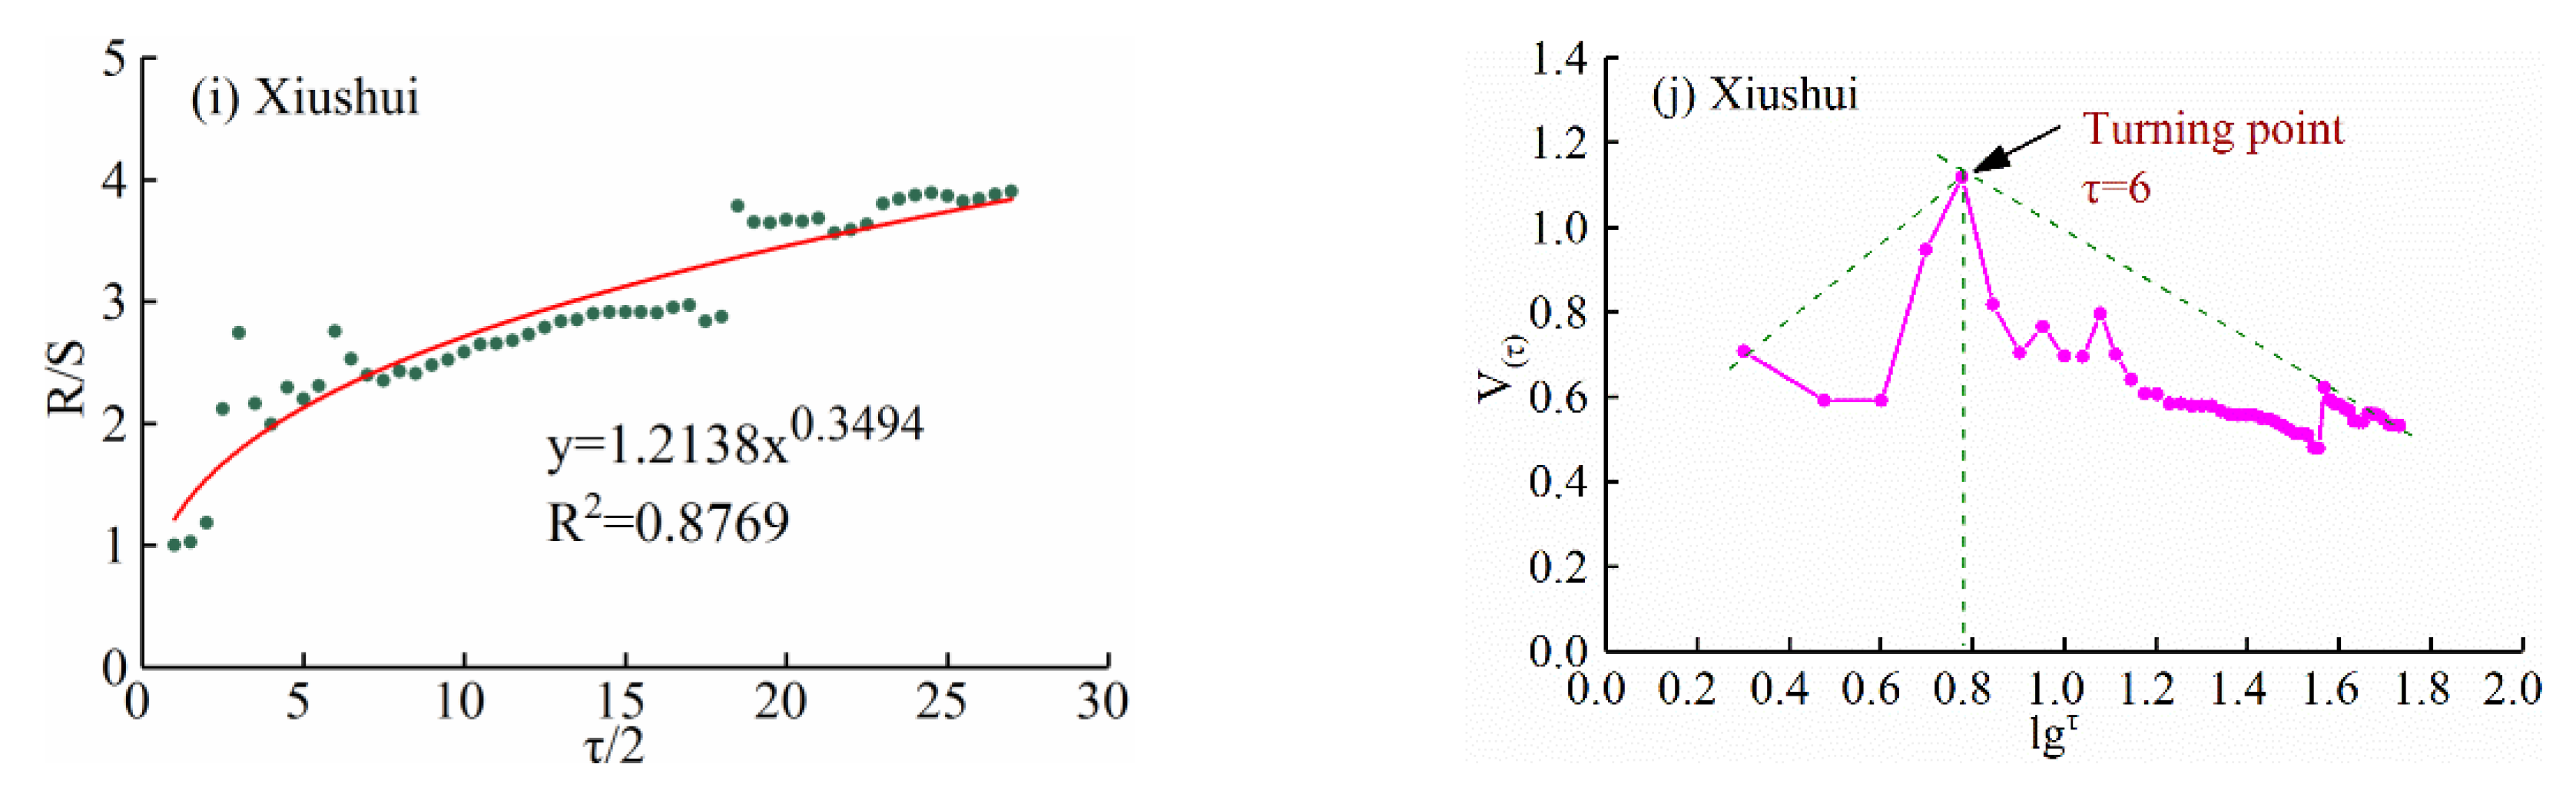
4.2.3. Long-Term Memory Characteristics
4.2.4. Quantification of the Influences of Climatic and Human Activities
5. Discussion
5.1. Different Inflection Points in the Runoff Changes
5.2. Impacts of Precipitation on the Runoff Changes
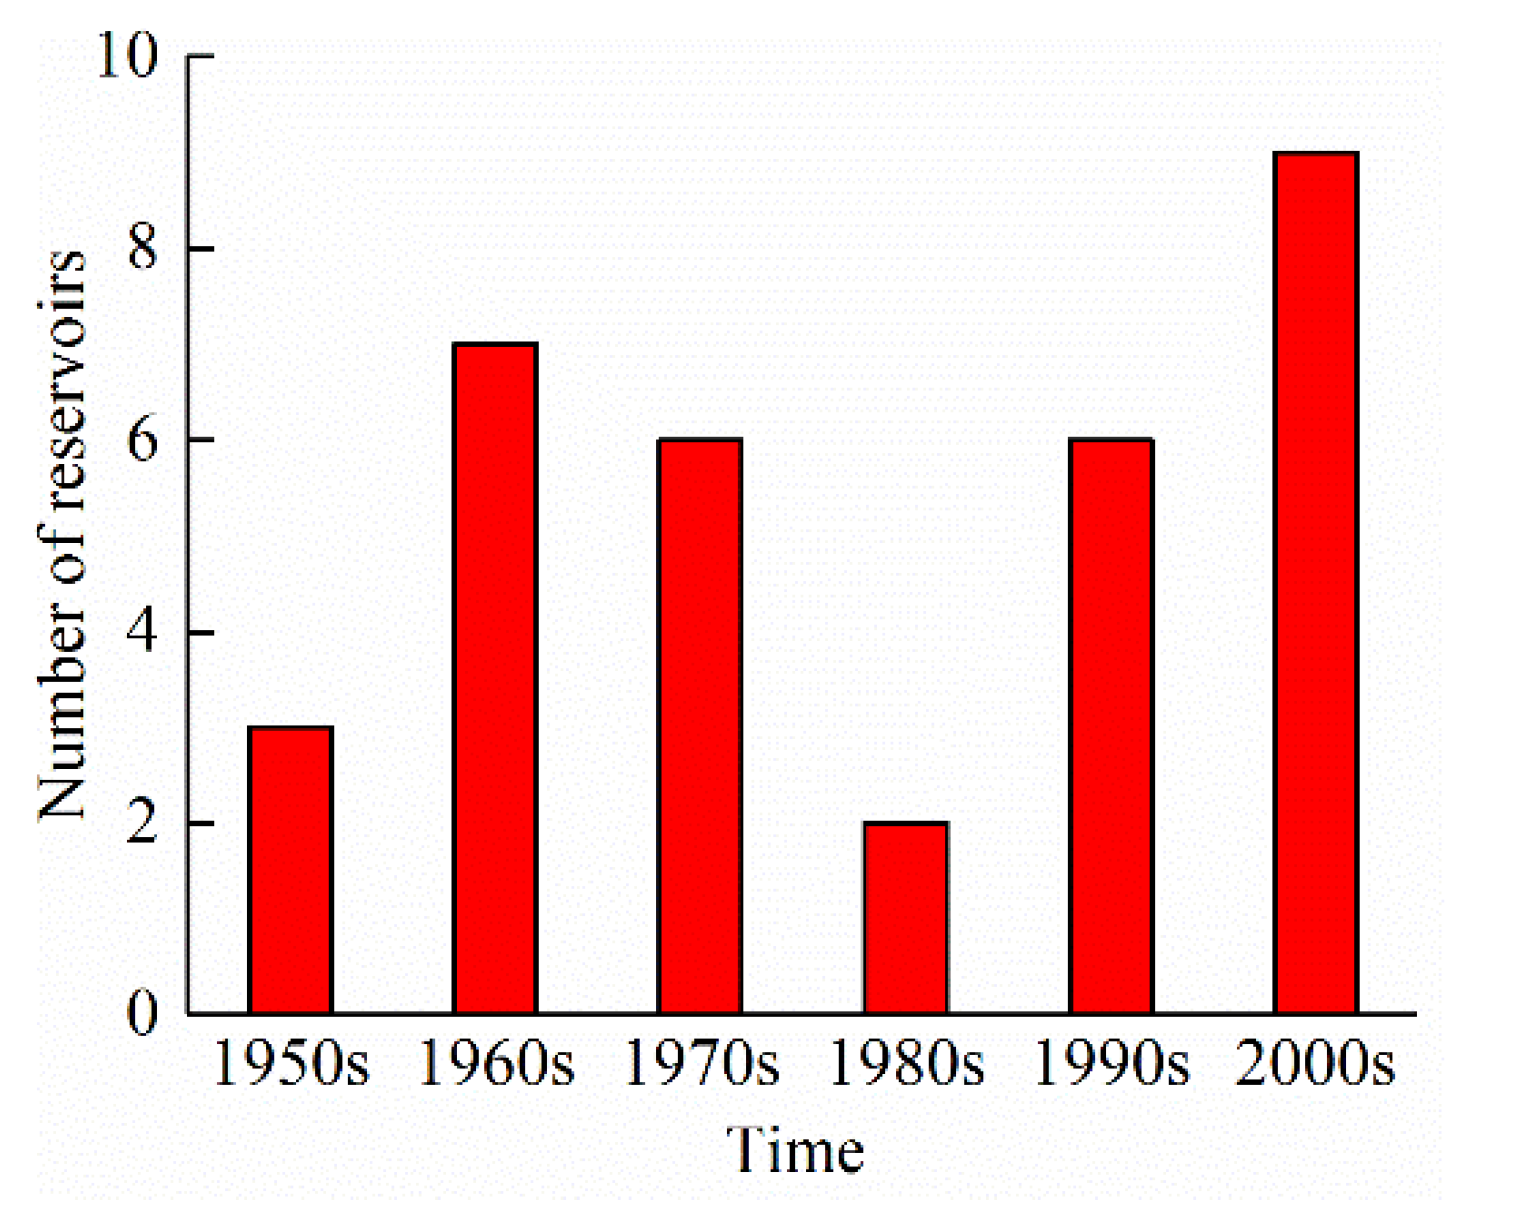
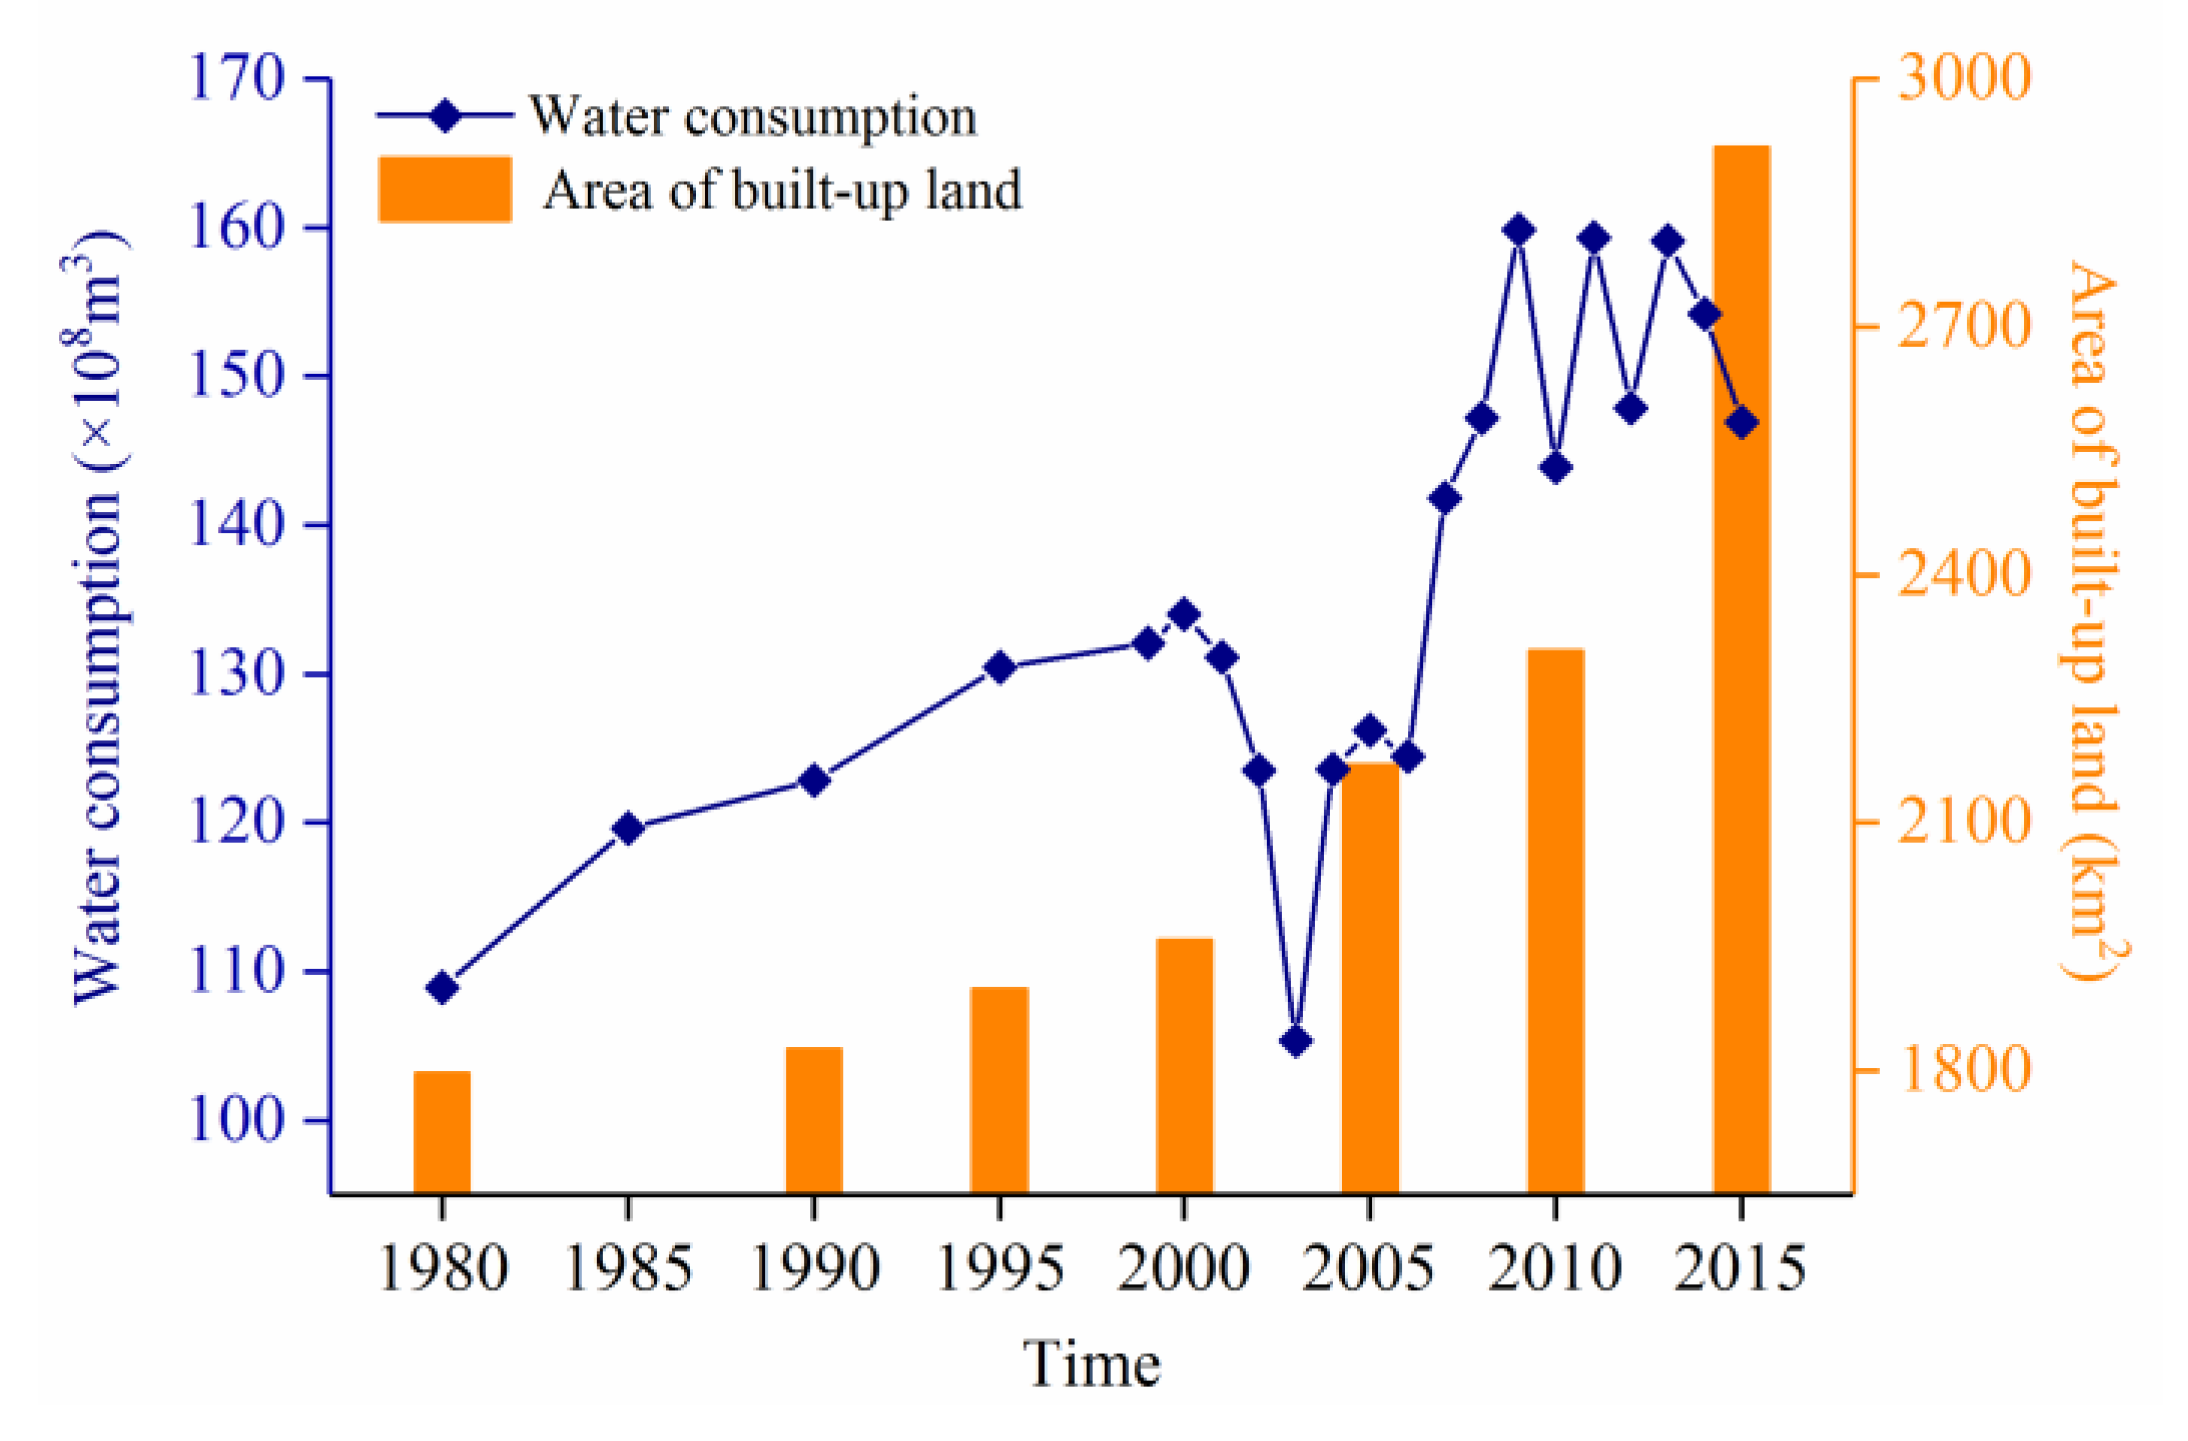
5.3. Impacts of Human Activities on Runoff Changes
6. Conclusions
Author Contributions
Funding
Acknowledgments
Conflicts of Interest
Data Availability
References
- Humborg, C.; Ittekkot, V.; Cociasu, A.; Bodungen, B.V. Effect of Danube River dam on Black Sea biogeochemistry and ecosystem structure. Nature 1997, 386, 385–388. [Google Scholar] [CrossRef]
- Gong, G.C.; Chang, J.; Chiang, K.P.; Hsiung, T.M.; Hung, C.C.; Duan, S.W.; Codispoti, L.A. Reduction of primary production and changing of nutrient ratio in the East China Sea: Effect of the Three Gorges Dam? Geophys. Res. Lett. 2006, 33, 3716–3730. [Google Scholar] [CrossRef]
- Li, E.H.; Mu, X.M.; Zhao, G.J. Temporal changes in annual runoff and influential factors in the upper and middle reaches of Yellow River from 1919–2010. Adv. Water Sci. 2014, 25, 155–163. [Google Scholar]
- Quilbé, R.; Rousseau, A.N.; Moquet, J.S.; Savary, S.; Ricard, S.; Garbouj, M.S. Hydrological responses of a watershed to historical land use evolution and future land use scenarios under climate change conditions. Hydrol. Earth Syst. Sci. Discuss. 2008, 12, 101–110. [Google Scholar] [CrossRef]
- Milano, M.; Reynard, E.; Köplin, N.; Weingartner, R. Climatic and anthropogenic changes in Western Switzerland: Impacts on water stress. Sci. Total Environ. 2015, 536, 12–24. [Google Scholar] [CrossRef] [PubMed]
- Zhao, G.; Tian, P.; Mu, X.; Jiao, J.; Wang, F.; Gao, P. Quantifying the impact of climate variability and human activities on streamflow in the middle reaches of the Yellow River basin, China. J. Hydrol. 2014, 519, 387–398. [Google Scholar] [CrossRef]
- Zhou, Y.; Shi, C.; Fan, X.; Shao, W. The influence of climate change and anthropogenic activities on annual runoff of Huangfuchuan basin in northwest China. Theor. Appl. Climatol. 2015, 120, 137–146. [Google Scholar] [CrossRef]
- Milly, P.C.D.; Dunne, K.A.; Vecchia, A.V. Global pattern of trends in streamflow and water availability in a changing climate. Nature 2005, 438, 347. [Google Scholar] [CrossRef]
- Jiang, C.; Xiong, L.; Wang, D.; Liu, P.; Guo, S.; Xu, C.Y. Separating the impacts of climate change and human activities on runoff using the budyko-type equations with time-varying parameters. J. Hydrol. 2015, 522, 326–338. [Google Scholar] [CrossRef]
- Zhang, G.X. Wetland Ecological Hydrology and Water Resource Management; Science Press: Beijing, China, 2014. [Google Scholar]
- Walling, D.E.; Fang, D. Recent trends in the suspended sediment loads of the world’s rivers. Glob. Planet. Change 2003, 39, 111–126. [Google Scholar] [CrossRef]
- Sivakumar, B.; Jayawardena, A.W.; Fernando, T.M.K.G. River flow forecasting: Use of phase-space reconstruction and artificial neural networks approaches. J. Hydrol. 2002, 265, 225–245. [Google Scholar] [CrossRef]
- Acreman, M.C.; Dunbar, M.J. Defining environmental river flow requirements—A review. Hydrol. Earth Syst. Sci. 2004, 8, 861–876. [Google Scholar] [CrossRef]
- Sun, Z.; Huang, Q.; Opp, C.; Hennig, T.; Marold, U. Impacts and implications of major changes caused by the Three Gorges Dam in the middle reaches of the Yangtze River, China. Water Res. Manag. 2012, 26, 3367–3378. [Google Scholar] [CrossRef]
- Zhao, C.Y.; Wang, Y.X.; Wen, Z.Z.; Hu, G.L.; Chen, H.X. Analysis of runoff variation and influencing factors in Pingliang reach of Jinghe river. J. Water Resource. Water Eng. 2017, 28, 36–41. [Google Scholar]
- Zhai, R.; Tao, F. Contributions of climate change and human activities to runoff change in seven typical catchments across China. Sci. Total Environ. 2017, 605–606, 219. [Google Scholar] [CrossRef] [PubMed]
- Wu, J.; Miao, C.; Zhang, X.; Yang, T.; Duan, Q. Detecting the quantitative hydrological response to changes in climate and human activities. Sci. Total Environ. 2017, 586, 328–337. [Google Scholar] [CrossRef]
- Al-Safi, H.I.J.; Kazemi, H.; Sarukkalige, P.R. Comparative study of conceptual versus distributed hydrologic modelling to evaluate the impact of climate change on future runoff in unregulated catchments. J. Water Clim. Change 2019. [Google Scholar] [CrossRef]
- Wang, X. Advances in separating effects of climate variability and human activity on stream discharge: An overview. Adv. Water Resource. 2014, 71, 209–218. [Google Scholar] [CrossRef]
- Guo, H.; Hu, Q.; Zhang, Q.; Wang, Y.J. Annual variations in climatic and hydrological processes and related flood and drought occurrences in the Poyang Lake basin, china. Acta Geogr. Sin. 2012, 67, 699–709. [Google Scholar]
- Liu, J.; Zhang, Q.; Xu, C.Y.; Zhang, Z.X. Characteristics of runoff variation of Poyang lake watershed in the past 50 years. Trop. Geogr. 2009, 29, 213–218. [Google Scholar]
- Zhang, X.L.; Li, Y.L.; Yu, G.; Zhang, Q. Runoff simulation and response to climate changes for Poyang Basin during the past 1000 years. J. Lake Sci. 2016, 28, 887–898. [Google Scholar]
- Shankman, D.; Keim, B.D.; Song, J. Flood frequency in China’s Poyang Lake region: Trends and teleconnections. Int. J. Climatol. 2010, 26, 1255–1266. [Google Scholar] [CrossRef]
- Min, Q. Analysis on the flood characters in 1990s, Poyang Lake. J. Lake Sci. 2002, 14, 323–330. [Google Scholar]
- Sun, P.; Zhang, Q.; Tu, X.J.; Jiang, T. Changing properties of meteor-hydrological droughts of the Lake Poyang Basin using the Markov model. J. Lake Sci. 2015, 27, 1177–1186. [Google Scholar]
- Guo, H.; Hu, Q.; Jiang, T. Annual and seasonal streamflow responses to climateand land-cover changes in the Poyang Lake basin, China. J. Hydrol. 2008, 335, 106–122. [Google Scholar] [CrossRef]
- Hu, J.F.; Zhao, G.N.; Cai, Z.; Ma, F.M. Variation characteristics and attribution of runoff in Xinjiang Drainage basin during 1953–2011. Meteorol. Disast. Reduct. Res. 2014, 37, 61–66. [Google Scholar]
- Liu, G.H.; Qi, S.H.; Zhu, J.X.; Xiong, M.Y.; Wang, D. Quantitative estimation of runoff changes in Ganjiang River, Lake Poyang Basin under climate change and anthropogenic impacts. J. Lake Sci. 2016, 28, 682–690. [Google Scholar]
- Ye, X.C.; Zhang, Q.; Liu, J.; Li, X.H.; Xu, C.Y. Distinguishing the relative impacts of climate change and human activities on variation of streamflow in the Poyang Lake catchment, China. J. Hydrol. 2013, 494, 83–95. [Google Scholar] [CrossRef]
- Zhang, Q.; Liu, J.Y.; Singh, V.P.; Gu, X.H.; Chen, X.H. Evaluation of impacts of climate change and human activities on streamflow in the Poyang Lake basin, China. Hydrol. Process. 2016, 30, 2562–2576. [Google Scholar] [CrossRef]
- Zhao, G.J.; Hörmann, G.; Fohrer, N.; Zhang, Z.X.; Zhai, J.Q. Streamflow trends and climate variability Impacts in Poyang Lake Basin, China. Water. Resour. Manag. 2010, 24, 689–706. [Google Scholar] [CrossRef]
- Wang, R.N.; Peng, W.Q.; Liu, X.B.; Wu, W.Q.; Chen, X.K.; Zhang, S.J. Responses of Water Level in China’s Largest Freshwater Lake to the Meteorological Drought Index (SPEI) in the Past Five Decades. Water 2018, 10, 137. [Google Scholar] [CrossRef]
- Mann H, B. Nonparametric Tests Against Trend. Econometrica 1945, 13, 245–259. [Google Scholar] [CrossRef]
- Ran, L.S.; Wang, S.J.; Fan, X.L. Channel change at Toudaoguai Station and its responses to the operation of upstream reservoirs in the upper Yellow River. J. Geogr. Sci. 2010, 20, 231–247. [Google Scholar] [CrossRef]
- Hurst, H.E. Long term storage capacities of reservoirs. Trans. Am. Soc. Civ. Eng. 1951, 116, 776–808. [Google Scholar]
- Mandelbrot, B.B.; Wallis, J.R. Robustness of the rescaled range r/s in the measurement of noncyclic long run statistical dependence. Water Resource. Res. 1969, 5, 967–988. [Google Scholar] [CrossRef]
- Fu, Y.Z.; Xu, S.G.; Liu, J.W. Temporal-spatial variations and developing trends of Chlorophyll-a in the Bohai Sea, China. Estuar. Coast. Shelf Sci. 2016, 173, 49–56. [Google Scholar] [CrossRef]
- Wu, L.H.; Wang, S.J.; Bai, X.Y.; Luo, W.J.; Tian, Y.C.; Zeng, C.; Luo, G.J.; He, S.Y. Quantitative assessment of the impacts of climate change and human activities on runoff change in a typical karst watershed, SW China. Sci. Total Environ. 2017, 601, 1449–1465. [Google Scholar] [CrossRef]
- Wang, S.J.; Yan, Y.X.; Ming, Y.; Zhao, X.K. Quantitative estimation of the impact of precipitation and human activities on runoff change of the Huangfuchuan River basin. J. Geogr. Sci. 2012, 22, 906–918. [Google Scholar] [CrossRef]
- Wang, S.; Wang, Y.; Ran, L.; Su, T. Climatic and anthropogenic impacts on runoff changes in the songhua river basin over the last 56 years (1955–2010), Northeastern China. Catena 2015, 127, 258–269. [Google Scholar] [CrossRef]
- Wang, S.; Yan, M.; Yan, Y.; Shi, C.; Li, H. Contributions of climate change and human activities to the changes in runoff increment in different sections of the Yellow River. Quaternary Int. 2012, 282, 66–77. [Google Scholar] [CrossRef]
- Wang, J.J.; Li, C.Y.; Sun, B.; Fan, C.R.; Liang, L.; Han, Z.M. Impacts of precipitation on runoff yield of Hulun Lake basin during 1963–2014. Bulletin Soil Water Conserv. 2017, 37, 115–119. [Google Scholar]
- Wang, Y.; Xu, H.M.; Cheng, B.Y.; Huang, D.P.; Tan, Y.T.; Luo, Y. Impacts of precipitation change on the runoff change in the Fujiang River basin during the period of 1951–2012. Progressus Inquisitiones De Mutatione Climatis 2014, 10, 127–134. [Google Scholar]
- Luo, W.; Zhang, X.; Deng, Z.M.; Xiao, Y. Variation of the total runoff into Poyang Lake and drought-flood abrupt alternation during the past 50 years. J. Basic Sci. Eng. 2013, 21, 845–856. [Google Scholar]
- Liu, J.Y.; Zhang, Q.; Gu, X.H. Evaluation of ecological flow with considerations of hydrological alterations in the Poyang Lake basin. Acta Ecolog. Sin. 2015, 35, 5477–5485. [Google Scholar]
- Xiao, L.Y.; Zhou, X.; Peng, Y.W. Comparative analysis of change-point detection of runoff series with different methods in Poyang Lake Watershed. J. Nanchang Inst. Technol. 2016, 35, 85–89. [Google Scholar]
- Zhang, J.W.; Guo, J.L.; Liu, J.; Li, Y.H.; Guo, J. Prediction for temporal and spatial variability of Poyang Lake inflow. South-to-North Water Tran. Water Sci. Technol. 2016, 14, 41–48. [Google Scholar]
- Guo, H.; Su, B.D.; Wang, Y.J.; Jiang, T. Runoff coefficients change and the analysis of the relationship between climate factors and runoff coefficients in Poyang Lake Basin (China):1955–2002. J. Lake Sci. 2007, 19, 163–169. [Google Scholar]
- Yuan, Y.J.; Zhang, C.; Zeng, G.M.; Liang, J.; Guo, S.L.; Huang, L.; Wu, H.P.; Hua, S.S. Quantitative assessment of the contribution of climate variability and human activity to streamflow alteration in Dongting Lake, China. Hydrolog. Process. 2016, 30, 1929–1939. [Google Scholar] [CrossRef]
- Kong, D.; Miao, C.; Wu, J.; Duan, Q. Impact assessment of climate change and human activities on net runoff in the Yellow River Basin from 1951 to 2012. Ecol. Eng. 2016, 91, 566–573. [Google Scholar] [CrossRef]
- Tian, L.; Wang, S. Analysis of the runoff change and main influencing factors in the Liaohe River Basin. Res. Soil Water Conservat. 2018, 25, 153–159. [Google Scholar]
- Xia, J.; Ma, X.Y.; Zou, L.; Wang, Y.L.; Jing, Z.X. Quantitative analysis of the effects of climate change and human activities on runoff in the upper Hanjiang River Basin. South-to-North Water Tran. Water Sci. Technol. 2017, 15, 1–6. [Google Scholar]
- Li, C.; Yang, Z.F. Influence of operation of main reservoirs on the yellow river on runoff. Yellow River 2004, 26, 15–16. [Google Scholar]
- Xu, J.X.; Sun, J. Influence of precipitation and human activities on water fluxes from the Yellow River into the sea in the past 50 years. Adv. Water Sci. 2003, 14, 690–695. [Google Scholar]
- Yao, Y.B.; Zhang, X.Y.; Wang, R.Y.; Cai, G.Z. Impact of climate changing to water resource in Taohe river valley. J. Soil Water Conservat. 2008, 22, 168–173. [Google Scholar]
- Mo, M.H.; Yang, X.X.; Xiao, S.S.; Tu, A.G. Analysis on runoff and sediment change characteristics and influence factors of Poyang Lake five rivers basin. Res. Soil Water Conservat. 2017, 24, 197–203. [Google Scholar]


| Subbasin | River | Drainage Area (km2) | Annual Mean Runoff Depth (mm) | Annual Mean Precipitation (mm) | Hydrological Station | Meteorological Station | |||
|---|---|---|---|---|---|---|---|---|---|
| Name | Latitude | Longitude | Name | Altitude (m) | |||||
| Ganging | Ganjiang | 80948 | 847 | 1538.20 | Waizhou | 28.63° N | 115.83° E | Yichun | 131.3 |
| Ji’an | 71.2 | ||||||||
| Suichuan | 126.1 | ||||||||
| Ganxian | 137.5 | ||||||||
| Fuhe | Fuhe | 15811 | 786 | 1736.26 | Lijiadu | 28.22° N | 116.17° E | Nancheng | 80.8 |
| Guangchang | 143.8 | ||||||||
| Xinjiang | Xinjiang | 15535 | 1174 | 1859.91 | Meigang | 28.43° N | 116.82° E | Guixi | 60.8 |
| Yushan | 116.3 | ||||||||
| Raohe | Changjiang | 6374 | 1116 | 1776.14 | Hushan | 28.92° N | 117.27° E | Jingdezhen | 61.5 |
| Le’anjiang | 5013 | 912 | Dufengkeng | 29.16° N | 117.12° E | ||||
| Xiushui | Xiushui | 9914 | 854 | 1577.36 | Qiujin | 29.10° N | 115.41° E | Xiushui | 146.8 |
| Liaohe | 3548 | 999 | Wanjiabu | 28.85° N | 115.65° E | ||||
| Poyang Lake Region | Lushan | 1164.5 | |||||||
| Poyang | 40.1 | ||||||||
| Nanchang | 46.9 | ||||||||
| Zhangshu | 30.4 | ||||||||
| Grade | Range of Hurst Exponent (H) | Strength | |
|---|---|---|---|
| Positive Correlation | Negative Correlation | ||
| I | (0.50, 0.55] | [0.45, 0.50) | Weak |
| II | (0.55, 0.65] | [0.35, 0.45) | Weaker |
| III | (0.65, 0.75] | [0.25, 0.35) | Stronger |
| IV | (0.75, 0.85] | [0.15, 0.25) | Strong |
| V | (0.85, 1.00] | [0.00, 0.15) | Very strong |
| Subbasin | Baseline Period | Measurement Periods | ||||
|---|---|---|---|---|---|---|
| Ta | Ra (108 m3/a) | Tb | Rb (108 m3/a) | Tc | Rc (108 m3/a) | |
| Ganjiang | 1961–1991 | 657.93 | 1992–2002 | 808.73 | 2003–2015 | 647.24 |
| Fuhe | 1961–1991 | 121.95 | 1992–2002 | 143.63 | 2003–2015 | 113.60 |
| Xinjiang | 1961–1991 | 169.43 | 1992–2002 | 221.55 | 2003–2015 | 179.82 |
| Raohe | 1961–1988 | 108.72 | 1989–1999 | 150.79 | 2000–2015 | 107.73 |
| Xiushui | 1961–1988 | 110.66 | 1989–2002 | 146.56 | 2003–2015 | 112.07 |
| Subbasin | H | Correlation | Strength | T (a) | Change Trend | |
|---|---|---|---|---|---|---|
| Historical | Future | |||||
| Ganjiang | 0.39 | Negative | Weaker | 9 | ↑ | ↓ |
| Fuhe | 0.36 | Negative | Weaker | 9 | ↓ | ↑ |
| Xinjiang | 0.26 | Negative | Stronger | 9 | ↑ | ↓ |
| Raohe | 0.30 | Negative | Stronger | 6 | ↑ | ↓ |
| Xiushui | 0.35 | Negative | Weaker | 6 | ↑ | ↓ |
| Subbasins | Periods | SR (108 m3/a) | SP (mm/a) | ∆SR (%) | ∆SP (%) | Contribution to the Runoff Changes | ||
|---|---|---|---|---|---|---|---|---|
| CP (%) | CH (%) | |||||||
| Ganjiang | Ta | 1961–1991 | 671.56 | 1510.04 | ||||
| Tb | 1992–2002 | 797.68 | 1690.04 | 18.78 | 11.92 | 63.47 | 36.53 | |
| Tc | 2003–2015 | 652.25 | 1505.93 | −2.88 | −0.27 | 9.47 | 90.53 | |
| Fuhe | Ta | 1961–1991 | 125.13 | 1746 | ||||
| Tb | 1992–2002 | 143.38 | 1888.3 | 14.58 | 8.15 | 55.88 | 44.12 | |
| Tc | 2003–2015 | 115.31 | 1690.6 | −7.85 | −3.17 | 40.43 | 59.57 | |
| Xinjiang | Ta | 1961–1991 | 172.76 | 1808.56 | ||||
| Tb | 1992–2002 | 224.94 | 2110.34 | 30.20 | 16.69 | 55.25 | 44.75 | |
| Tc | 2003–2015 | 185.57 | 1842.35 | 7.41 | 1.87 | 25.20 | 74.80 | |
| Raohe | Ta | 1961–1988 | 114.46 | 1737.18 | ||||
| Tb | 1989–1999 | 149.18 | 2005.47 | 30.33 | 15.44 | 50.91 | 49.09 | |
| Tc | 2000–2015 | 104.88 | 1726.26 | −8.37 | −0.63 | 7.51 | 92.49 | |
| Xiushui | Ta | 1961–1988 | 114.22 | 1543.23 | ||||
| Tb | 1989–2002 | 153.49 | 1739.83 | 34.38 | 12.74 | 37.05 | 62.95 | |
| Tc | 2003–2015 | 104.72 | 1508.64 | −8.32 | −2.24 | 26.95 | 73.05 | |
© 2020 by the authors. Licensee MDPI, Basel, Switzerland. This article is an open access article distributed under the terms and conditions of the Creative Commons Attribution (CC BY) license (http://creativecommons.org/licenses/by/4.0/).
Share and Cite
Wang, R.; Peng, W.; Liu, X.; Jiang, C.; Wu, W.; Chen, X. Characteristics of Runoff Variations and Attribution Analysis in the Poyang Lake Basin over the Past 55 Years. Sustainability 2020, 12, 944. https://doi.org/10.3390/su12030944
Wang R, Peng W, Liu X, Jiang C, Wu W, Chen X. Characteristics of Runoff Variations and Attribution Analysis in the Poyang Lake Basin over the Past 55 Years. Sustainability. 2020; 12(3):944. https://doi.org/10.3390/su12030944
Chicago/Turabian StyleWang, Ruonan, Wenqi Peng, Xiaobo Liu, Cuiling Jiang, Wenqiang Wu, and Xuekai Chen. 2020. "Characteristics of Runoff Variations and Attribution Analysis in the Poyang Lake Basin over the Past 55 Years" Sustainability 12, no. 3: 944. https://doi.org/10.3390/su12030944
APA StyleWang, R., Peng, W., Liu, X., Jiang, C., Wu, W., & Chen, X. (2020). Characteristics of Runoff Variations and Attribution Analysis in the Poyang Lake Basin over the Past 55 Years. Sustainability, 12(3), 944. https://doi.org/10.3390/su12030944