Abstract
The present article was aimed at identifying opportunities for cleaner production (CP) from the process flow analysis of a furniture manufacturing company located in the municipality of Palhoça (SC, Brazil). The company was used as an exploratory case study with a qualitative approach. The criteria used for the flow analysis and for identifying the opportunities of CP were associated to the systems and technologies employed, as well as to the process analysis and to the project layout factors (stock location, movement). With this, 107.24 m2 of wasted areas were found in the production environment, of which 72.06 m2 included the floor area with material to be discarded (waste) and 66.93 m of flow lines with returns and crossings. The study identified that the total flow lines of the company represented a total of 775.58 m, with the possibility of being reduced by 29.45%. This reduction is a result of optimizing the physical space and reducing waste with material handling. Twenty-five opportunities of a CP associated to the process flow analysis (layout) were listed. The analyses also indicated that the association of CP to process flows as a preventive measure leads to a new connection between process optimization and environmental performance.
1. Introduction
The adaption of companies to new trends in society, as well as to new technologies, the optimization of processes in the physical factory space, combined with the adaption to socio-environmental issues and the continuous search for a cleaner production (CP) are contemporary needs that increase competition levels, attached with social and environmental responsibilities.
Environmental issues bring great challenges to companies. These issues put pressure on companies to take into account environmental impacts in their business plans, as these impacts may have an effect on costs (reduction of time, material, and energy) and increase customer demand [1]. Environmental (lack of resources), regulatory (policies and legislation), and market pressures promote production and consumption standards that have less environmental impact, bringing new business opportunities and innovation [2].
Besides managing resources and optimizing processes, under an environmental management perspective, companies must fulfil the needs of the new profile of customers and consumers (green consumers) of products and services, who seek economic, social, and environmental responsibility (reducing waste, pollutants, and costs) [3]. In addition, the priorities of the industry of the contemporary world must take into account a sustainable economy and energy, as well as digital economy, smart mobility, safety, sustainable infrastructure, and an innovative workspace [4], i.e., the layout of work facilities.
The productivity and efficiency of a company are based on “continuous internal improvements”, ranging from the increase in the productivity of workers (distribution and flow of workers throughout the production process), levels of stock control and management, better distribution of resources by departments (layout of physical facilities), and balance between production lines [5] (p. 2) until internal improvements in process flows, maintenance, and productive capacity, and on the reduction of waste and emissions.
The furniture sector, chosen for this study, is inserted in this context of continuous internal improvements. In 2017, this sector was responsible for the generation of 268,900 direct and indirect jobs in Brazil, representing 3.3% of workers in industrial production, thus playing a relevant role in the wood production chain, with strong social impact [6]. In 2018, data from the Brazilian furniture industry identified the existence of 46 furniture production centers and 21,800 companies in the country, with greater presence of micro-enterprises (17,300) and small companies (3800) [7].
Besides being a traditional sector, the furniture industry involves the production of durable goods, being structured on a semi-industrial manufacturing system, mainly in terms of the production of small businesses or small-scale production [8]. The furniture industry uses wood as its main raw material, being one of the biggest consumers of natural resources from forests and a great waste generator. Despite this reality, Brazil still does not have any legal norms that impose the implementation of CP in companies [9].
A study carried out in the furniture industry in the Brazilian state of Rio Grande do Sul (RS, Brazil) concluded that most of the waste from this industry comes from sawn wood (1381.00 tonnes), as well as from chipboards (1209.11 tonnes), medium-density fiberboards (MDF) (331.99 tonnes), plywood, primary process wood sheets, and cutting and finishing processes. These wastes can become raw materials for other processes, although they can pose great challenges to the environmental management of companies [10].
Data from the furniture sector show that large amounts of feedstock waste, wood, is generated, demonstrating the inefficiency of the production process to which the different systems and technologies (processes, layout design of the facilities, stock location and control, movement of people and material) are submitted to. The way in which these are arranged generate losses, with a negative impact on the transformation industry. Nonetheless, these losses can be analyzed under a process flow analysis perspective to be reduced.
There is a considerable gap in the literature regarding approaches that consider a diagnostic analysis of process flows in the physical spaces of industrial facilities (layout design) associated to CP and aiming at generating continuous improvements to enable a gradual implementation of CP in small companies of the furniture industry.
Massote and Santi, in 2013, implemented CP in a Brazilian furniture industry of doors and partition panels, focused on the flow of materials (mass balance). The authors identified opportunities of CP that reduced waste, as well as the raw material and water used. With this, the generation of solid waste was reduced between 23% and 93% [11]. In 2019, Panameño et al. applied CP and life cycle analysis (LCA) in a small company that produces wooden chairs, analyzing the flow of materials. The authors highlighted the environmental exchange between two models, proposing a flowchart to guide future CP applications when changing the materials used, as well as processes, the energy source, service life, and final destination [12].
With this in mind, this article was aimed at identifying the opportunities of CP from the process flow analysis of a furniture manufacturing company located in the municipality of Palhoça, in the Brazilian state of Santa Catarina (SC). This article used the company as a case study and sought to broaden the discussions regarding the identification of CP opportunities, by associating them with the diagnostic analysis of process flows in the physical space of industrial facilities (layout design) and using them as an initial basis of studies under development within the University’s Industrial Engineering Program from the Federal University of Bahia (PEI/UFBA/Brazil) and the Federal Institute of Alagoas (IFAL/Brazil) to develop an integration methodology between layout projects of industrial facilities (layout) and CP that can serve the small furniture sector.
2. Literature Review
Cleaner Production (CP), Layout, and the Furniture Industry
In 1990, the United Nations Environmental Programme (UNEP) defined CP as the “continuous application of an integrated environmental strategy to processes, products, and services to increase efficiency and reduce risks to humans and the environment” [13]. CP analyzes the production process under a technical, economic, and environmental point of view, considering a company “as a macrosystem that converts inputs in outputs which do not harm the environment” (In Portuguese: “um macrossistema que converte entradas em saídas que não agridam ao meio ambiente.” [14] (p. 414)). Moreover, it enables the identification of how to implement continuous improvements to productive and environmental performance without raising costs, being based on a systemic view that enables the interaction of all elements [14] (p. 414).
The sector of a company responsible for purchasing supplies has a regulatory and environmental influence in terms of the implementation of CP, given that requirements concerning the suppliers’ compliance with environmental aspects, in terms of the raw material used, influence the environmental indicators of companies, imposing the need of adapting the company’s supply chain [15]. Therefore, it can be argued that the legal and environmental aspects, as well as factors regarding the purchase flow of raw materials for a company’s supply and the flow of material and by-products in indoor spaces and physical industrial facilities, are of fundamental importance for CP.
The approach taken for CP is preventive, promoting integration and being specific to the place being analyzed. Moreover, it is related to the reduction of emissions, as well as to the assessment of the efficiency of resources in the origin, and operational, energy, and material flows, being based on health, safety, and environmental criteria [16].
Financial limitation is one of the barriers to the implementation of CP in small and medium-sized Brazilian companies; in order to achieve the transition to sustainable production systems, “it is essential to implement changes in their production systems by adopting CP in principle and in practice” [17] (p. 50).
CP and environmental management systems are complementary, being able to improve environmental indicators and contribute to a “continuous improvement process of the environmental performance of industrial plants” (In Portuguese: “processo de melhoria contínua do desempenho ambiental das plantas industriais” [18] (p. 163).) The physical space of industrial facilities, the industrial plant, or its layout, are among the items analyzed in reports for the implementation of CP programs in the Brazilian National Center of Clean Technologies (CNTL, in Portuguese). The CNTL cites the need of assessing spaces, deployment plans, operational practices, the use and movement of materials (flow), equipment operations, and internal organization to maximize the use of productive capacity and eliminate waste [19,20].
Layout changes are technological in nature with an emphasis on the reduction of generated source [19,21], enabling the reduction in the consumption of resources, minimizing accidents, and/or eliminating the generation of pollutants and costs [22]. The layout represents the shape of the productive operation. It consists of the location and physical arrangements of processing resources (facilities, machines, equipment, materials, information, and people), being important to determine of production flows [23]. Therefore, “facility layout is an arrangement of everything needed for the production of goods or delivery of services” [24] (p. 2079).
The layout represents the productive factors in the physical space. For dimension, it is necessary to perform a process flowchart and establish the quantities of materials, as well as components, mass balance, production losses, and flows; quantities and characteristics of equipment; number and staff roles required; and surfaces of inventory areas, production centres, ancillary areas, support areas, and administrative areas [25].
Factors that influence the layout project include external or internal changes, services (internal or external benefits offered to customers and staff members), labor, materials (quantity and characteristics), waiting time (delays and stock), equipment, building (structural aspects), and movement of materials and people [26,27].
The movement factor is related to process flows, given that it concerns the study of the movement of materials and people throughout the manufacturing process, observing flows, floor obstructions, distances covered, returns, crossings, and inter-relationships between sectors, as well as the waiting factor being associated to the processing of materials and stocks [26,27].
In 2009, Tseng, Lin, and Chiu, established the following criteria used for implementing CP: Organization, Training and People, Systems and Technologies, and Assessment and Feedback. The attributes, tools, and technologies, process analysis and improvement, supply chain analysis, and life cycle analysis (LCA) of products are linked to the criterion Systems and Technologies [28], which, in turn, is associated to all factors involved in layout projects.
Changes in the layout include process, equipment, staff, and material flows, as well as the physical conditions of the building. According to technological breakthroughs and the evidence presented in the literature, it can be argued that process flow analyses are both part of the study for implementing CP and of studies and projects for implementing changes in the industrial plant. These analyses must be carried out to generate opportunities for continuous improvements and opportunities of CP, maximizing the generation of products and eliminating or reducing the production of waste.
Nunes et al. (2019) argued that flow analysis is one of the steps taken for managing CP in small companies. The application of a CP management methodology in small and medium enterprises (SMEs) facilitates the overcoming of internal barriers and actions to reduce waste generation [29]. Moreover, analysis methods associated to the movement of materials and people, which is one of the factors taken into account in layout projects, can be applied for diagnosing processes and to reduce waste, effluents, and emissions.
According to Circular Economy (CE), reusing, remanufacturing, reforming products are ways to save resources and energy; and to maximize the time that resources flow internally; the flow of materials and energy in CE is considered cyclical (sustainable) [30]. Therefore, the CP and the analysis of processes flows establish an important relationship with the CE.
Production processes in the furniture industry generate several types of solid residue, emissions, and effluents that may have greater negative impact on the environment when production, emissions, and the layout are uncontrolled [31]. Analyses carried out in furniture industries from the Brazilian state of Goiás concluded that the most common techniques used for developing cleaner processes included improvements in the internal work environment of industries themselves (49% of the answers) and changes in the implementation of CP (14%) [32].
It is also important to highlight the importance of the “continuous implementation of CP programs, especially in Latin America, where a large part of their economy depends on small- and medium-sized enterprises” which require “lower need for financial resources” [12] (p. 17). The implementation of CP opportunities and the reduction and control of pollution at the source can start with companies from the furniture sector through “simple changes in operational conditions, layout, and in the way materials are handled” (in Portuguese: “Mudanças simples nas condições operacionais, no leiaute e no manuseio dos materiais” [8] (p. 19)), with technology transfer playing a key role [8] (p. 19).
The investment in CP projects can reduce the environmental impact and bring benefits to companies by reducing costs, consumption of energy, and the generation of sawdust, shavings, and MDF waste, increasing productivity.
The management of process flows through layout projects integrated with CP may improve the quality of the work environment, as well as improve processes and products, consequently eliminating and/or reducing by-products by reusing materials, besides reducing costs by the decline in consumption of materials, energy, and water. Therefore, the combination of the principles of CP and layout of the facilities can be considered innovation in the workplace. Moreover, the integration of CP in layout projects drives and potentializes efforts for reducing environmental impacts.
This study was based on the literature presented, but mainly, on the methodology from United Nations Industrial Development Organization (UNIDO)/ United Nations Environment Programme (UNEP) for implementing a CP program [13], on the manuals of the Brazilian National Centre of Clean Technologies (CNTL) [19,20], on criteria for implementing CP established by Tseng, Ling, and Chiu in 2009 [28], and on the factors and methodologies of layout projects systematized by Olivério [26] and Muther [27]. This research contributed to the association of CP analyses and process flows in the existing layout of the case study and enabled the identification of the opportunities.
3. Methodological Approach
This work consisted of an exploratory study, using a qualitative approach, as the data presented sought to understand the meaning, interactions, and opportunities to improve systems and technologies [33]. The quantitative data were presented to enhance the meanings [33], being a case study which provided detailed, contextualized, and broad knowledge of a reality that was used to lead theoretical reflections to the exploration and development of theories [34,35,36].
The study was carried out in a micro-enterprise located in the municipality of Palhoça, in the metropolitan region of Florianópolis, in the Brazilian state of Santa Catarina (SC), close to the federal motorway BR-101, an important longitudinal axis for the country.
The study began with the preparation of a questionnaire and an integrated checklist, applied in the period between 13 and 27 April 2015, with the support of the Unit of Design Management (NGD) from the Federal University of Santa Catarina (UFSC).
The questionnaire and integrated checklist were based on the report for the implementation of a cleaner production (CP) (Manual 4 from CNTL) [19], as well as on the methodology developed by UNIDO/UNEP for the implementation of the CP program [13], on the attributes of the criterion Systems and Technologies for the implementation of CP, as pointed out by Tseng, Lin, and Chiu in 2009 [28], combined with the factors and methodologies of the layout project (checklist) [26,27].
The criteria used for analyzing and identifying the opportunities for CP are related to Systems and Technologies (process analysis, layout of facilities, location and stock control, and movement of people and material), based on studies, factors, and consolidated methodologies regarding the implementation of CP and industrial layout projects. The methodological approach of this study can be described by steps 1, 2, and 3 of the methodology for implementing CP [19], adapted for this case study (Figure 1).
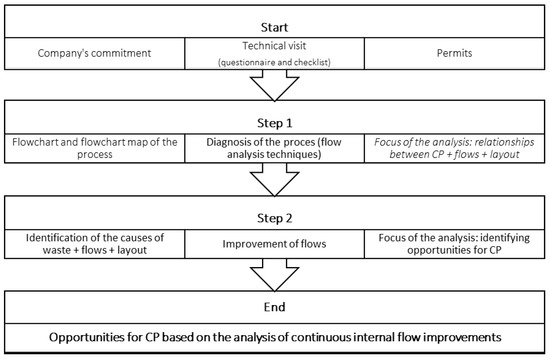
Figure 1.
Steps for identifying cleaner production (CP) + flow analysis adapted to the case study. Adapted from the Brazilian National Center of Clean Technologies (CNTL, in Portuguese) [19].
The resources responsible for the transformation process in a production system are called inputs, which include information, human resources, energy, supplies, and material. In turn, outputs are products or services resulting from the transformation process [37].
In the technical visit for diagnosing the process flows of the company in study, based on the methodology used in industrial layout projects [26,27], we obtained the qualitative input data (raw materials, products, production routes) and output data (products, waste, residue, by-products), as well as the areas, arrangement of machinery, equipment, and sectors, information regarding the relationship between the different activities, the flow of materials, people, and information for product handling, measurements of the physical space, and the location of residues and by-products in the layout. Table 1 presents the design requirements included in the questionnaire and checklist carried out.

Table 1.
Design requirements included in the questionnaire and checklist for identifying CP opportunities from process flow (layout) analysis.
Two technical visits were made to the company in the study in the year of 2015 for the application of the questionnaire and the integrated checklist, aimed at observing and mapping production processes. The integrated checklist assisted in direct observations and annotations and in measurements and observations about the physical space. The production manager accompanied the work to describe the process.
In addition, methodological procedures were carried out, such as a photographic and metric survey of the architectural space and the physical arrangement of machines and equipment. The questionnaire was not applied for obtaining data on the mass or energy balance, as the company did not have this information available.
Following the application of the questionnaire and the integrated checklist (1), photographic surveys (2), mapping of the physical space (3), and a description of the data was also carried out (4), drawing the respective zoning (5) and sectorized floor plans (6), performing a study on the interactions between the areas, sectors, and flows (7), with the flow layout plan being drawn (8), followed by the creation of a flowchart of the respective processes (9) with symbols being drawn according to the American Society of Mechanical Engineers (ASME). Finally, analyses (10) and the creation of a list with CP opportunities integrated with the factors of the layout project (11) were carried out.
The methodology used led to a new link between the optimization of processes and environmental performance, being also a breakthrough in comparison to the literature, as it provided guidance for the process flow analysis of the physical space of industrial facilities (layout) and contributed to the identification of CP opportunities associated to process flows.
4. Results
4.1. Description of the Company Used as a Case Study
This research was carried out in a micro-enterprise (ME) in the furniture manufacturing and trade industry, focused on furniture for offices, with a serial and tailored production process. According to the Brazilian Micro and Small Business Support Service (SEBRAE) [38], a micro-enterprise (ME) is a small business with a revenue equal to or lower than R$360,000 (Brazilian reals), with up to 19 workers (Complementary Federal Law no. 123/2006).
It covers a land area of 1410 m2, in a densely occupied commercial and industrial area (347.56 inhabitants per km2) [39]. In 2015, it produced 10 different furniture lines for offices: Furniture for call centers, workstations, platforms, reception, and furniture lines with drawers, shelves, desks and archives. In 2018, the same furniture lines were still present, although there were changes in the design, with updates of the materials used and the inclusion of customized furniture.
In 2015, in its organigram, the company employed, apart from its director, 17 staff members (3 female and 14 male), with one of them being a production engineer. No quantitative record of waste of the material used was registered, such as medium-density fiberboard (MDF) or medium-density particleboard (MDP), among others. In 2018, waste (considered as by-products in this work) collection was still carried out by the same specialized company, although still without any quantitative record of the waste produced or of the respective final destination.
It was observed that the materials purchased by the company as MDF/MDP, had the FSC Brazil (Brazilian Forest Stewardship Council) seal, which ensures the ecologically correct origin of the wood used, that is, compliance with forest management norms and environmental and labor laws. However, the finished products did not have a seal directed to the furniture sector, being unable to attest the ecologically correct purchase of raw materials and the level of environmental performance. They did not have the proper management of industrial waste, or internal awareness and training actions related to social and environmental issues.
4.1.1. Zoning of the Areas from the Existing Layout
The zoning of the production centres of the layout simplified the study on the physical spatial needs and on the location of the facilities, enabling us to determine the distances covered for the movement of material and people, as well as the inter-relationships of the production areas.
Figure 2 shows the zoning plan areas used as production centres in the company’s site with the existing layout (survey carried out in 2015), as well as the location of the entrance of supplies and customers and the exit of the finished products. The floor plan also determines the respective areas used for the administration/sales (56.79 m2) processes, as well as for the support of workers (20.01 m2), stock/storage area (273.66 m2), production (283.36 m2), packaging and dispatch (120.79 m2), by-products (98.96 m2), and circulation (445.90 m2).
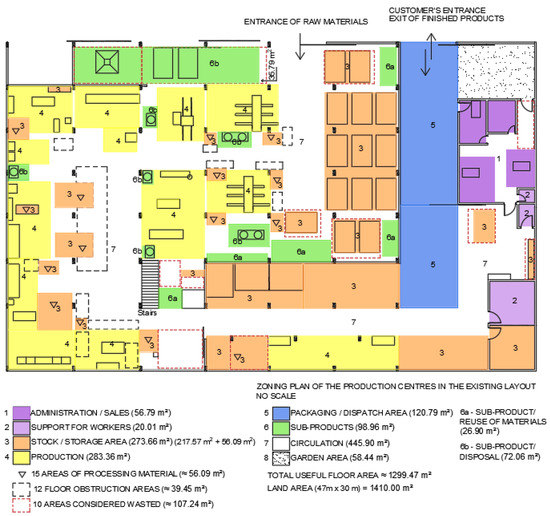
Figure 2.
Zoning plan of the production centres.
It can be observed that the storage facilities, as well as the production and circulation areas, occupy the greatest areas (in ascending order), with a total of 273.66 m2 being used for stocking/storage area, with 100.00 m2 of the floor area close to the access of supplies/material and to the production area being occupied with MDF/MDP. Figure 2 indicates that there are 10 different areas considered underused/wasted in this work (107.24 m2), which could be used in the production area or for improvements of the physical space (rectangle with red, dashed line).
The production, stock, and by-product areas were fragmented around the layout, with the areas used for by-products (98.96 m2) being divided in areas with materials for reuse (6a) and in areas for the materials classified as for disposal waste (6b), totaling 72.06 m2 of the floor area being occupied with materials to be discarded (waste). Moreover, 15 production areas were assigned for stocking the processing material (56.09 m2), with 12 areas obstructing the floor area (39.45 m2), indicating the lack of planning and control in terms of the movement and location of the material in the layout.
The reuse of the by-products and the management of material from the sales process until being dispatched to the customer show an opportunity for reorganizing the layout areas, reducing waste, and clearing the physical space in order to expand the production area.
4.1.2. Production Centres and Sectorization of the Existing Layout
The location of the production sectors, as well as of the machinery, equipment, and stock of the material in the production centres of each department enables the study of the role, activities, and inter-relationship between the sectors (Figure 3).
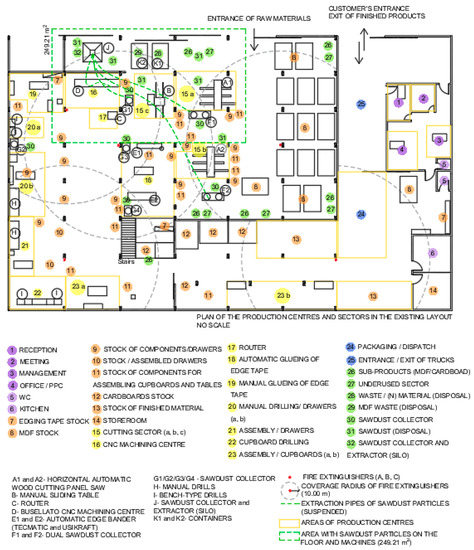
Figure 3.
Plan of the production centres and sectorization.
Figure 3 sets out the location of the production centres, the sectors, and machinery, as well as the type of stocks, of supplies, fire extinguishers with the respective spanning radius, and the ducts for the extraction of sawdust particles in the existing layout.
With this, a lack of separation can be noticed between the entrance for customers, the reception (sector 1), and the exit of delivery vehicles (sector 25). Moreover, the stock of MDF/MDP panels (sector 8), the waste container (K1) for the disposal of several materials (sector 28), and the container (K2) for the disposal of MDF waste (sector 29) are located near the entrance of supplies for an easier reception of the material and easier exit of by-products.
The administration/sales area consists of the reception area (sector 1), the meeting area (sector 2), management (sector 3), and office/production, planning, and control (PPC) (sector 4). The management sector was responsible for managing resources and for the administration of the material according to the demand of the sales sector and production needs. In turn, the PPC sector (sector 4) oversaw the planning and control of the factory production centres.
Nevertheless, the PPC sector was located far from the production centres, with the greatest distances being to the cutting sections (A1 and A2), 76.19 m (sector 15a) and 74.58 m (sector 15b), respectively. This distance was considered disadvantageous for the production control and monitoring. The fact that the PPC sector is located far from the production area may also have a negative influence on the flow of information and on the quality control of the process and the product.
Figure 3 illustrates the location of eight storage areas, fragmented throughout the production area, as follows: Edging tape stock (sector 7), MDF stock (sector 8), stock of components for the assembly of drawers (sector 9), stock of assembled drawers (sector 10), stock of components for assembling cupboards and tables (sector 11), cardboard stock (sector 12), stock of finished material (sector 13), and storeroom (sector 14).
The cardboard stock (sector 12) was divided into five spaces shared with processing material, close to the assembly of cupboards (sectors 23a and 23b), being also located close to the packaging and dispatch sector (sector 24) and to the stock of finished material (sector 13) to facilitate the tasks. A certain amount of cardboard waste was observed in the space underneath the stairs, obstructing the area and compromising the organization.
The production area was divided into cutting sectors (sectors 15a, 15b, and 15c), CNC (Computer Numeric Control) machining center (sector 16), router (sector 17), automatic gluing of edge tape (sector 18), manual gluing of edge tape (sector 19), manual drilling of drawers (sectors 20a and 20b), assembly of drawers (sector 21), cupboard drilling (sector 22), and cupboard assembly (sectors 23a and 23b). The packaging and dispatch area (sector 24) was located at the end of the process, near the exit of finished material.
The by-products were located in the production area, namely the cutting areas (sectors 15a, 15b, 15c) and CNC machining center (sector 16), with the following subdivision: MDF/MDP waste (sector 26), large unused MDF/MDP cuts (sector 27), waste or mixed material in waste container (sector 28), MDF/MDP waste in container for disposal (sector 29), sawdust collector (sector 30), sawdust bags for disposal (sector 31), and sawdust extractor (silo) (sector 32).
The absence of waste containers for the selective collection of by-products could be observed in the production sectors. In addition, the improper sealing of the area surrounding the collection and extraction of sawdust (sector 32) spread sawdust particles in the air during the extraction of sawdust from the silo, impregnating an area of 249.21 m2 with particles (area affected marked in Figure 3 with a dashed-line rectangle in green).
Six MDF/MDP waste sectors (sector 26) were present, as well as five sectors of unused MDF/MDP (sector 27). The material was leaning on wooden planks, columns, walls, and machines, with two of them being mixed with the waste material next to the containers. Therefore, it can be argued that the company did not have a preventive view regarding CP (Figure 3).
The location of the fire extinguishers in the layout (dashed-line circles in grey, in Figure 2) shows the respective spanning range (10.00 m, according to Brazilian Regulatory Standard NR-23) [40] and the risk areas, where the extinguishers did not reach, indicating the need of complying with the Fire Protection Standards (NR-23) and improving work safety.
The location of the respective sectors followed the sequence of the production flow, although some obstruction of the floor space could be observed in the production and circulation areas. The need for optimizing the spaces and flows was also observed and identified by eliminating returns and crossings to improve the movement of material and people throughout the process, as well as improvements in terms of cleaning procedures and in the organization of the production center. In addition, there is the need of adapting the transport, movement, storage, and handling of material to the current standards in place (according to Brazilian Regulatory Standard NR-11) [41], in order to avoid piling material within 0.50 cm from the structural elements of the building, avoiding the obstruction of firefighting equipment.
4.1.3. Process Flow and Supply in the Existing Layout
By mapping the flow lines and supply of the production process, it was possible to obtain information regarding the movement of material and human resources throughout the production chain, such as the number of movements and distances covered by the material and people, as well as flow crossings and returns. The objective of this mapping was to identify critical points to be optimized in the layout. Figure 4 shows the floor plan with the production, delivery, and customer flow lines, considering the production centres of each sector (Figure 3) in the existing layout.
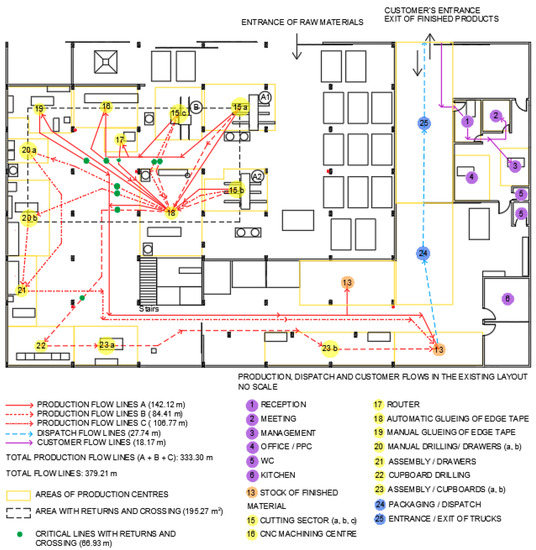
Figure 4.
Plan of the production processes, dispatch, and customers flows.
The furniture manufacturing processes of the company were divided into tabletops, straight connections, and curves (A); cupboards, shelves, and partitions (B); and drawers (C). The furniture manufacturing started when all elements were concentrated in the cutting sector (15a, 15b, and 15c), with sectioning machines (A1 and A2) or a sliding table saw (B) (Figure 4).
The flow lines for the manufacturing of tabletops and straight and curved connections (production A) are represented in Figure 4 with continuous (red) lines, totaling 142.12 m. The cut furniture pieces could be transported to the automatic gluing of edge tape sector (sector 18) and/or to the manual gluing of edge tape sector (sector 19), or even to the router (sector 17) or to the machining sector (sector 16), then returned to the gluing of edge tape sector (sectors 18 and 19). The finished pieces were then transported to the stock of finished material (sector 13).
The flow lines for the production of cupboards, shelves, and partitions (production B), represented in Figure 4 with (red) dashed lines, covered a total of 84.41 m. Following the cutting process, the pieces were transported to the automatic gluing of edge tape sector (sector 18). They were then transported to the drilling section (sector 22), to the cupboard assembly section (sectors 23a and 23b), and to the stock of finished material (sector 13).
The flow lines for the production of drawers (production C), represented by (red) dashed-dotted lines, account for a total of 106.77 m. Following the cutting process, the pieces would be transported to the automatic gluing of edge tape (sector 18), drilling and preparation of drawers sectors (sectors 20a and 20b), then to the assembly sector (sector 21), and to the stock of finished material (sector 13).
The dispatch area (sector 24) was located close to the administration area and to the stock of finished material (sector 13), at the end of the processes described. A linear flow without obstacles could be then observed (27.74 m). The flow of customers took place in the reception, meeting, and production management areas (18.10 m).
Figure 4 illustrates the area marked, which represents 195.27 m2 (as shown in the dashed-line rectangle in black), thus, indicating the return and crossing flow lines, which are critical lines, being highlighted by dark-green circles, representing 66.93 m.
The study identified that the sum of the production, dispatch, and customer flows represented 379.21 m and that the production flow lines (A+B+C) totaled 333.30 m. The need of eliminating return and crossing lines was also identified. With the layout project, the possibility of reducing the production flow lines in 66.93 m was identified, in order to optimize the movement factor by eliminating critical lines. The flow reduction from 333.30 m to 266.37 m represents up to 20.09% of the production flow lines, which may have a positive effect on productivity in terms of the movement of material and increasing the production capacity and control, as well as reducing the generation of by-products and waste.
Figure 5 shows the supply flow lines of the supply of raw materials and production flow lines, taking into account the production centres of each sector.
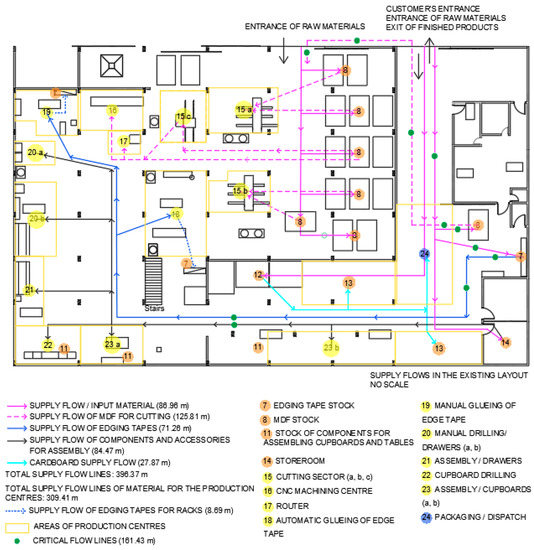
Figure 5.
Plan of the supply flows, input material for the stock, and production centres.
The sum of the supply flow lines representing the supply of raw material, as well as the input of material, such as MDF, components, accessories, edging tapes, and cardboard, was equal to 86.96 m, as illustrated in Figure 4 by the continuous (pink) lines.
The total of the MDF/MDP supply flow lines for the cutting sectors (15a, 15b, and 15c), CNC machining center (sector 16), and router (sector 17) was of 125.81 m, also taking into account the MDF batch stocked close to the dispatch sector, as shown in Figure 5 with pink, dashed lines.
It was observed that there were edging tapes stocked on the shelves in the automatic (sector 18) and manual (sector 19) gluing of edge tape sectors, as well as batches of edging tapes close to the storeroom (sector 14).
In addition, the distance covered for supplying the automatic and manual gluing of edge tape processes (sectors 18 and 19) was 71.26 m for the respective production centre. The surplus of flow lines can be considered a travel waste, as seen in Figure 5 with the continuous lines in dark blue.
The supply flow of components and accessories for the sectors of manual drilling of drawers (sectors 20a and 20b), for the assembly of drawers (sector 21), cupboard drilling (sector 22), and cupboard assembly (sectors 23a and 23b) is represented in Figure 5 (continuous lines in black), representing a total of 84.47 m. The location of the storage area (sector 14) hindered the supply of the drilling bench and the assembly line.
The cardboard supply flow lines for the stock of finished material (sector 13) and dispatch sector (sector 24) represented a total of 27.87 m. It was verified that the proximity between the sectors enabled the reduction of the distances covered in the end of the process, as observed in Figure 4 with the continuous line in light blue.
The study identified a total of 396.37 m of supply flow lines in the company, with 309.41 m being for production supply. Figure 5 shows the outline of critical flow lines highlighted by circles in green, which represent 161.43 m in movements, causing delays in the processes.
The study also verified the need of eliminating critical supply flow lines (161.43 m). The layout project can reduce the supply flow lines to optimize the movement of materials factor. The flow reduction of 161.43 m represents an overall supply flow reduction from 396.37 m to 234.94 m, that is, a reduction of up to 40.73%, which may increase the productivity of the system, the control of the materials to be processed, and the company’s production capacity, enabling it to reduce the waste of production time and delays in delivery.
4.1.4. Information, Production, and Assembly Flowchart with Material Input and Output
The mapping of the production flows from the two technical visits and the zoning analyses, as well as from the assessment of the inter-relationship between the sectors and production, dispatch, customer, material supply, and production flows, resulted in the information flowchart (IF) (Figure 6), prior to the manufacturing process. In addition, the production and assembly flowchart (PAF) was also prepared (Figure 7).
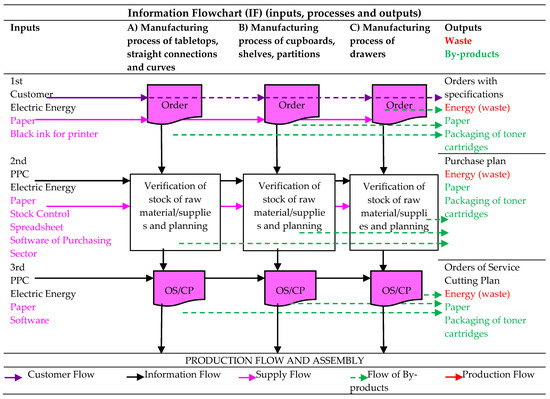
Figure 6.
Information Flowchart (IF) (inputs, processes, and outputs).
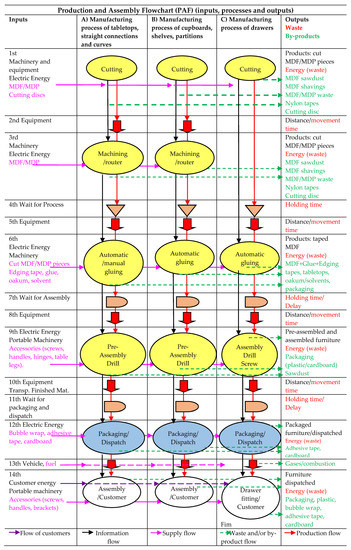
Figure 7.
Production and assembly flowchart (PAF) (inputs, processes, and outputs).
The manufacturing processes were divided into production flows (A), (B), and (C), as previously mentioned in item 4.1.3. The inputs energy, supply, and material were included in the production supply, as well as the output products, waste, by-products, and information flow.
The project specifications, such as measures and specifications of the material, were pre-established in the sketches of each furniture line, although no formal portfolio of the executive projects carried out by the furniture design specialist could be found to enable better monitoring of the production and respective production waste. The existence of such a portfolio would also give support to innovation products and eco-design or design processes.
The production process took into account customer demand, which started with the verification of the stock of raw material, supplies, and production planning after the client’s order. Information regarding the orders made was also cross-checked with the data available in the PPC and stock sectors, being then transmitted to the purchasing sector (first and second lines of Figure 6).
Following the purchase and supply of the material, the orders of service (OS) and cutting plans were executed, which were then sent to the cutting centre (sectors 15a, 15b, or 15c) and CNC machine centre (sector 16) (third line of Figure 6).
With this, it was verified the need of managing and controlling orders, the purchase plan, orders of service, and cutting plans based on the project portfolio. Moreover, it was identified the need of implementing actions in order to optimize the use of energy (which remained switched on throughout the entire technical visit) and the use of paper supplies and toner cartridges, discarded by the company.
The production and assembly flowchart (PAF) is presented in Figure 7 and was designed to describe the flow of the different materials that supplied the production centre, such as MDF, MDP, laminates, cutting discs, edging tapes, glue, oakum, solvents, accessories, screws, nuts, washers, legs for tables, hinges, slides, bubble wrap, adhesive tape, cardboard, and fuel. Electric energy, machinery, and equipment were also inserted.
The production processes (A) and (B) were carried out in the following order: Cutting, CNC machining/router, automatic or manual gluing of edge tape, pre-assembly (drilling and screwing), packaging, dispatching, and assembly at the customer’s location. Process (C), the production of chest of drawers, was performed in the following order: Cutting, automatic gluing of edge tape, assembly (drilling, screwing, and assembly), packaging, dispatching, and fitting of drawers at the customer’s location, which had a greater volume of components being produced (Figure 7).
The main types of material that supplied the cutting and machining/router production centres were MDF/MDP (first to third lines of the PAF, Figure 7). These centres also produced by-products that were discarded by the company, such as sawdust, shavings, and MDF/MDP waste. These materials were stored in a container (K2), with the sawdust being stored in a silo. In turn, the nylon tapes, used for tying the MDF/MDP batches, were placed together with other material in a container (K1) for disposal. All these by-products were removed from the company’s facility by another company specialized in waste collection. With this, the need for optimizing the use of MDF/MDP and reducing the costs of the use of this collection service was verified.
In the gluing of edge tape process (sixth line of the PAF, Figure 7), the cut MDF/MDP panels, edging tapes, glue, oakum, and solvents were the input material outlined. The panels were arranged in wooden platforms, close to the ground, and leaning on workbenches. The edging tapes were placed on shelves behind the machinery. These arrangements pointed out the need for optimizing the space to reduce unnecessary movement of workers within the sector.
The outputs of the gluing of edge tape process were finished panels (consisting of MDF/MDP, glue, and edging tape), by-products of this composition, pieces of edge ribbons, oakum with solvents, glue, and packaging, which were placed together inside a container (K1).
Following the gluing of edge tape process, the furniture pieces remained on hold (waiting) to be transported for assembly, requiring physical space to be stocked (seventh line of the PAF, Production and Assembly Flowchart). The furniture pieces were then separated and transported to the pre-assembly area of tables and cupboards, and to the assembly of drawers sector. The tables could be transported directly to the finished material stock area to be packaged and dispatched, according to the delivery schedule.
The lack of planning and control of the transport of material activity (eighth line of the PAF) obstructed the working area, hampering the movement of people and material during production, causing delays in the production, and, consequently, in delivery.
The outlined input material for the pre-assembly of processes (A) and (B), and for the assembly of drawers (C) (ninth line of the PAF) included taped items, table legs, accessories, screws, hinges, handles, slides, and brackets, as well as electric energy and portable machinery, which could be pneumatically driven or not.
Besides these products, the outputs from the pre-assembly and assembly processes were cardboard boxes from the accessories, the plastic used in the packaging, hardware, and waste from the (manual or bench-type) drill, which could be observed in the workbench or on the factory floor.
In order to prevent any loss of components, the workbenches consisted of MDF boxes attached to the benches for separating the material and shelves on the walls of different heights that would be used to organize the processing material.
The benches also had shelves attached, in order to organize the drawers’ components. This organization of the production space had a positive effect on the optimization of the tasks in the sector, highlighting the importance of organizing workstations.
The finished furniture pieces were then transported to the stock of finished material (10th line of the PAF), next to the dispatch area, although they were only packaged after being dispatched for delivery and assembly at the client’s space (11th line of the PAF). At this stage, delays in the dispatch procedure and inconsistencies in the deadline were noticed. The inputs of the packaging/dispatch process (12th line of the PAF, Figure 7) were the following: Bubble wrap, adhesive tape, sheets, and cardboard rolls.
The physical space of the packaging sectors, stock of finished material, and dispatch had no trace of dust on the walls or floor or in the air. The space consisted of plastered and painted walls, which facilitated maintenance. Nonetheless, it was observed that the stock of material that had been cut and machined awaited available space in the gluing of edge tape area, to be then transported. Moreover, furniture components were accumulated in the gluing of edge tape area due to delays in their transportation to the assembly area. The detection of these critical routes indicates the need of optimizing and synchronizing the work in the production centres.
4.1.5. Assignment and Destination of By-Products
The process that produced the greatest amounts of by-products was cutting (sectors 15a, 15b, and 15c), as well as the CNC machining center (sector 16), despite the MDF/MDP cutting plans in place. Moreover, it was found that the company did not control the volume of by-products wasted.
The cutting sectors (sectors 15a, 15b, and 15c) and CNC machining center (sector 16) were dusty and filled with by-products on the floor next to the machinery, as well as with sawdust covering the floor and sawdust particles in the air, which had originated from the extraction of the material from the silo due to improper sealing. In addition, the walls of the space were not plastered.
The company had dust collectors with an exhaust system, with the pipes connected to the silo not being correctly connected to the machines, which also contributed to the dispersion of sawdust particles in the air and floor and the on the furniture pieces.
Furthermore, the fact that the extractor (silo) was not appropriately sealed increased the dispersion of particles when the silo was emptied by the company which had been hired to carry out the waste collection and the disposal of sawdust.
In the production line, the furniture company had ducts and collectors to avoid the dispersion of MDF particles in the air. However, the silo did not have a duct system connected to the dumpsters, which, in turn, were not covered to prevent the dispersion of sawdust when being loaded, thus, having an impact in the surroundings.
Moreover, the absence of selective collection of the material was observed. The company did not separate toxic material, such as glue, solvents, and packaging, during waste disposal. Furthermore, oakum waste, sweeping dust, sawdust, and MDF/MDP shavings, as well as MDF/MDP/glue/edging tape by-products, plastic, bubble wrap, adhesive and nylon tapes, and cardboard, among other products which had been specified in the flowchart (Figure 7), were all found together in container (K1), in sector 28. In container (K2), pieces of MDF waste of several sizes could also be found.
Additionally, a need for improving the optimization of the physical spaces could be verified, by clearing the floor, as well as selecting and better handling the waste material. In 2018, a discussion was initiated on the reuse and optimization of waste material, based on the professional experience of the production supervisor that had been hired.
4.2. CP Opportunities from the Process Flow Analysis
In order to implement a CP, managers need to envisage the financial benefits which can be generated from saving resources and the environmental impacts associated to the production process, as well as the optimization in the production and supply, which generate internal and external reuse. In addition, the elimination of waste from improved layout planning integrated with CP foments eco-innovation.
Thus, 25 opportunities (O) of CP were identified, related to the production area and the Systems and Technologies criterion, as well as the attributes tools and technologies (O-1 to O-4), process flows, production waste, by-products, layout (O-5 to O-17), stock and storage (O-18 to O-21), supply chain analysis (O-22), and packaging and dispatching (O-23 to O-25). The factors related to the layout project (modifications, services, equipment, material, workforce, building, and storage/waiting) were associated to all opportunities identified, being listed in Table 2.
Table 2.
CP opportunities integrated in factors of the layout project.
Nevertheless, the associated opportunities must be approved and detailed in conceptual plans, so that they can then be implemented through executive projects, with the respective indicators for measurements and monitoring. The flow analysis can be inserted in all stages of the layout project and, when implementing CP in an integrated manner, as an economic and environmental strategy.
The opportunities regarding tools and technologies (O-1 to O-4) promote an improvement in safety conditions and the reduction of risks for workers, minimizing energy consumption, and promoting a preventive attitude of organization and control. They also promote the reduction of time and material waste, minimizing emissions of wood particles in the air, and improving working conditions.
In turn, the opportunities related to process flows, production losses, by-products, and layout (O-5 to O-17) promote a decrease in production time, as well as fewer accidents, minimizing the waste of materials and components and eliminating waste of flow, as well as reducing the consumption of materials and energy and setting out the appropriate setup for selective waste collection. The strategy of using a flowchart map of by-products for internal and external use (opportunity 17) proves to be a form of technological innovation that contributes to better financial performance, as well as greater production and environmental performance of small-scale production.
Finally, the opportunities regarding stock and storage (O-18 to O-21) and suppliers (O-22) help to reduce losses and risks, promoting greater control, enabling breakthroughs for circular economy, as well as promoting and increasing the environmental performance with suppliers and increasing the production capacity. In addition, the opportunities regarding packaging and dispatching (O-23 to O-25) provide a positive environmental position to a company in the market.
5. Discussion
The methodology used for the process flow analysis of the physical space of the industrial facility layout enabled identifying the opportunities of cleaner production (CP) in the furniture manufacturing company (case study), during processing, in the location itself, and in the generating source. The analysis of the process flows can be used in small enterprises in the furniture sector for reducing waste related to the movement of people and material, as well as for decreasing the generation of waste at the source (production waste), so that waste is raised to the category of by-products.
This diagnosis proved to be relevant and consisted of the first step for executing strategic projects aimed at developing a methodological study for implementing CP and continuous improvement actions of flows for the environmental performance of the physical space.
The opportunities for cleaner production (CP), pointed out following the analysis of production, customer, dispatch, and supply flows in the internal space of the company, were considered strategies set out for continuously improving the production processes, eliminating or reducing waste and production loss at the source, and enabling the internal and external reuse of the material. The integration of CP in the process flow analysis of layout projects provides greater opportunity for reducing waste at the generating source, reducing the small company’s environmental impact, considering the existing systems and technologies.
The areas wasted with the assignment of by-products for disposal, stock with poor accessibility, and idle circulation can be better used for future expansions. The integration of CP in the flow layout analysis is an innovation strategy, which sets out a greater vision to the future, promoting competition and contributing to a better market position.
As CP monitoring is combined with the application of key performance indicators, the reduction of production flows and movement of material and people, as well as the control of material and stock supply flows, can generate less production loss. The production system becomes cleaner and faster.
The continuous improvement strategy conducted by the methodological approach of the case study, applied to the design of the industrial facilities (layout) from the diagnostic analysis of the flows, indicated a new link with the CP implementation strategy from the preventive point of view, especially considering a small company, which has difficulties in implementing CP and is not charged for the absence of legal rules that require them to be implemented.
It is the strategy of continuous improvement for productivity gain and reduction of productive losses that will drive and encourage the small business to create an organizational culture of CP implementation from the preventive point of view for process optimization.
6. Conclusions
With the zoning and sectorization analysis of the existing production area in the company in study, 10 wasted or underused areas were identified, which represented a total of 107.24 m2, of which 35.79 m2 referred to the area assigned to by-products for disposal, 45.79 m2 for stock not close to the respective process, and 25.66 m2 for circulation areas.
Twelve floor obstruction areas were also identified (39.45 m2), as well as a fragmentation of the storage area, with 15 stock areas for processing material (56.09 m2) and the lack of control regarding the movement of material, which obstructed the circulation and interrupted the flow of material. The rearrangement of the layout areas and flows promotes a reduction of production losses and waste caused by the movement of material and people, as well as improving the production capacity.
Furthermore, it is possible to reduce the stock area from 273.66 m2 to 188.42 m2. The reduction of 85.24 m2 represents 33.15% of the existing storage area and 6.55% of the total floor area of the current layout. This approximation is based on the elimination of the existing fragmentation of the stock areas, clearing the floor areas, and bringing inter-related areas close to one another.
The reduction of production flow lines from 333.30 m to 266.37 m, by removing 66.93 m of return and crossing flow lines in the circulation area, represents a reduction of up to 20.09%, contributing to a greater optimization of the movement of material and people during the production process, increasing productivity.
Moreover, 396.37 m of flow lines were used for supplying the company, with 161.43 m as a result of the stock being located far away from the respective processes. The reduction of these lines represents 40.73% less in material and human displacements.
The total flow lines identified in the company’s layout was of 775.58 m, with process flow analysis enabling us to reduce these lines from 775.58 m to 547.22 m. The reduction of 228.36 m of these flow lines represent 29.45% of the total flow, rationalizing the physical space, and enabling future expansions and gains in productivity. The reduction of flows leads to greater production controls, which enable reduction of the generation of by-products and waste.
Finally, 25 CP opportunities were identified, related to the production area, encompassing the update and optimization of the existing technology, streamlining process flows, and reducing electric energy, production losses, and by-products generated, as well as optimizing cutting plans, the layout of the production areas, production, and transport of the material, the supply chain analysis, and rearrangement of cleaning procedures.
The study showed the need of rearranging workstations, as well as of inserting areas for selective waste collection, with the internal and external reutilization of the material, thus, maximizing resources, by-products, and physical spaces. These changes promote reductions of costs, waste, and production losses, as well as less environmental impact.
The diagnostic process flow analysis associated to CP and applied in the context of a small furniture company demonstrated that the possibility of implementing continuous improvements that promote less waste, applying a CP strategy. The analyses showed that the association of CP to process flows as a preventive strategy leads to a new link between process optimization and environmental performance.
The analyses showed the differentiated positioning of the company management for the systems and technologies, both when monitoring and releasing of information and in positioning the roles of each employee in the production process, highlighting the importance of each person, as well as the skills and characteristics.
People’s relationships with physical space and process flows were associated with the attributes of the criterion systems and technologies as a new element that surpassed technical aspects and this application, and demonstrated relationships of belonging and cooperation in relation to the physical space, process flows, and management. These relationships indicated the existence of a link between people, CP, and process flows in the physical space capable of promoting change. It also demonstrated that identifying CP opportunities from process flow analysis can lead to greater engagements, facilitating changes in environmental positioning, and contributing to the reduction of waste and the continuous minimization of waste and emissions.
As there are no legal requirements that oblige small furniture companies to implement a CP strategy, the present study contributed to a change of perception regarding systems and technologies (processes, layout, stock location and control, and movement of people and material) associated to the consumption of raw material and to the generation of waste and by-products, demonstrating that continuous and gradual improvements in process flow performance related to systems and technologies can lead to a more efficient production, generating less waste, and can represent a way of implementing CP in small enterprises.
Author Contributions
This article was developed by all authors, with special attention to the authors S.F.C. and A.K. for the contact established with NGD for the exchange of knowledge, text review, analysis, proposals, and reflections on the work; P.S.L. for developing the work and data collection with the company in study, analysis, proposals, literature review, drawing the floor plans, layout, and writing the article; Á.L.Q.R.eS.R. and S.F.C. for the review, analysis, discussions, proposals, and monitoring of the work and analysis; and R.D.A.C. for the revision, analysis, and methodological contributions. All authors have read and agreed to the published version of the manuscript.
Funding
This research did not receive any external funding.
Acknowledgments
This study was possible due to the qualification program (Masters and PhD) established between the Postgraduate Program in Industrial Engineering from the Federal University of Bahia (PEI-UFBA) and the Federal Institute of Alagoas (IFAL); the support of the UFBA Wood Laboratory (MadLab), the Design Management Center (NGD) of the Federal University of Santa Catarina (UFSC), and the IFAL Study Group of Design and Interdisciplinary studies (GEID); as well as the furniture manufacturing company for office purposes located in Palhoça (SC, Brazil) for their reception, availability, and interest in supporting and collaborating with the necessary information whenever requested; and Eugênio Andrés Díaz Merino, who coordinated the contact with the host company and supervised the technical visit. A special thanks to the contribution of Armando Tanimoto, from the Federal Institute of Bahia (IFBA).
Conflicts of Interest
The authors state that there are no conflicts of interest.
References
- Stefano, N.M.; Ferreira, A.R. Ecodesign referencial teórico e análise de conteúdo: Proposta inicial para estudos futuros. Revista Estudos em Design 2013, 21, 01–22. (In Portuguese) [Google Scholar]
- Yoshimochi, A.P.; Dalto, F.; Bortoletti, M.; Britschka, N.N.; Cavini, R.; Garcia, R.L. Guia PCS, Produção e Consumo Sustentáveis, Tendência e Oportunidades para o Setor de Negócios; PNUMA/FIESP: São Paulo, Brazil, 2015; Available online: https://nacoesunidas.org/wp-content/uploads/2015/06/PNUMA_Guia-de-Produ%C3%A7%C3%A3o-e-Consumo-Sustent%C3%A1veis.pdf (accessed on 26 April 2019). (In Portuguese)
- Silva, A.L.E.; Moraes, J.A.R.; Machado, Ê.L. Proposal for cleaner production oriented practices ecodesign and reverse logistics. Revista Engenharia Sanitária e Ambiental 2015, 20, 29–37. (In Portuguese) [Google Scholar] [CrossRef]
- BMBF. Federal Report on Research and Innovation 2018; Bundesministerium für Bildung und Forschung /Federal Ministry of Education and Research (BMBF): Bonn, Germany, 2018. Available online: https://www.bmbf.de/upload_filestore/pub/Bufi_ (accessed on 26 April 2019).
- Silva, A.N.; Araújo, A.V.; Godoy, L.C.; Minette, L.J.; Suzuki, J.A. Contribution of Computational Simulation for Layout Analysis in a Wooden Furniture Industry. Revista Árvore 2017, 41, 1–8. [Google Scholar] [CrossRef]
- Prado, M.V. Brasil Móveis. Relatório Setorial da Indústria de Móveis no Brasil 2018; IEMI/ABIMÓVEL: Brasília, Brasil, 2018; pp. 40–41, (In Portuguese and in English). [Google Scholar]
- Brainer, M.S.D.C.P. Setor Moveleiro: Aspectos Gerais e Tendências no Brasil e na Área de Atuação do BNB. Caderno Setorial ETENE, Year 3, 34, June, 2018. Available online: https://www.bnb.gov.br/documents/80223/3585904/moveis_34-2018.pdf/f0e0657f-a6c2-db33-f139-04d95692453e (accessed on 3 January 2020). (In Portuguese)
- Rapôso, A.; César, S.F.; Kiperstok, A. Design do Ciclo de Vida do Produto e Produção mais Limpa: Uma reflexão aplicada à produção de estofados. Revista Estudos em Design 2013, 21, 01–25. (In Portuguese) [Google Scholar]
- Aguilar, C.M.G.; Panameño, R.; Velazquez, A.P.; Álvarez, B.E.A.; Kiperstok, A.; César, S.F. Cleaner Production Applied in a Small Furniture Industry in Brazil: Addressing Focused Changes in Design to Reduce Waste. Sustainability 2017, 9, 1–17. (In English) [Google Scholar]
- Hillig, É.; Schneider, V.E.; Pavoni, E.T. Geração de resíduos de madeira e derivados da indústria moveleira em função das variáveis de produção. Production 2009, 19, 292–303. (In Portuguese) [Google Scholar] [CrossRef]
- Massote, C.H.R.; Santi, A.M.M. Implementation of a cleaner production program in a Brazilian wooden furniture factory. J. Clean. Prod. 2013, 46, 89–97. (In English) [Google Scholar] [CrossRef]
- Panameño, R.; Aguilar, C.M.G.; Angel, B.E.; César, S.F.; Kiperstok, A. Cleaner Production and LCA as Complementary Tools in Environmental Assessment: Discussing Tradeoffs Assessment in a Case of Study within the Wood Sector in Brazil. Sustainability 2019, 11, 5026. [Google Scholar] [CrossRef]
- United Nations Environment Programme. UNEP. Resource Efficient and Cleaner Production. 2019. Available online: http://www.unep.fr/scp/cp/ (accessed on 26 April 2019). (In English).
- Da Silva, G.C.S.; de Medeiros, D.D. Cleaner production implementation in services using checkland’s methodology. Gestão Produção 2006, 13, 411–422. (In Portuguese) [Google Scholar]
- Tavares, A.C.S.; Vanalle, R.M.; Camarotto, J.A. Influence of Green Initiatives on Environmental, Economic and Operational Outcomes: The Case of the Brazilian Packaging Supply Chain. Sustainability 2019, 11, 430. (In English) [Google Scholar] [CrossRef]
- Schneider, P.; Oswald, K.; Riedel, W.; Meyer, A.; Schiller, G.; Bimesmeier, T.; Thi, V.A.P.; Khac, L.N. Engineering Perspectives and Environmental Life Cycle Optimization to Enhance Aggregate Mining in Vietnam. Sustainability 2018, 10, 525. [Google Scholar] [CrossRef]
- Neto, G.C.O.; Leite, R.R.; Shibao, F.Y.; Lucato, W.C. Framework to overcome barriers in the implementation of cleaner production in small and medium-sized enterprises: Multiple case studies in Brazil. J. Clean. Prod. 2017, 142, 50–62. [Google Scholar] [CrossRef]
- Fernandes, J.V.G.; Gonçalves, E.; Andrade, J.C.S.; Kiperstok, A. Introduzindo práticas de produção mais limpa em sistemas de gestão ambiental certificáveis: Uma proposta prática. Revista Engenharia Sanitária e Ambiental 2001, 6, 157–164. (In Portuguese) [Google Scholar]
- Centro Nacional de Tecnologias Limpas. CNTL. Implementação de Programas de Produção mais Limpa (Série Manuais de Produção mais Limpa). 2003. Available online: www.pha.poli.usp.br/LeArq.aspx?id%5Farq=7985 (accessed on 10 April 2019). (In Portuguese).
- Centro Nacional de Tecnologias Limpas. CNTL. Diagnóstico Ambiental e de Processo (Série Manuais de Produção mais Limpa). 2003. Available online: https://www.senairs.org.br/documentos/serie-manuais-de-producao-mais-limpa-diagnostico-ambiental-e-de-processo (accessed on 10 April 2019). (In Portuguese).
- United States Environmental Protection Agency. EPA. Facility Pollution Prevention Guide. Washington: 1992. Available online: https://nepis.epa.gov/Exe/ZyPDF.cgi/200132N4.PDF?Dockey=200132N4.PDF (accessed on 10 April 2019). (In English)
- Conselho Empresarial Brasileiro para o Desenvolvimento Sustentável. CEBDS. Guia da Produção mais Limpa Faça Você Mesmo. 2005, pp. 1–58. Available online: https://d335luupugsy2.cloudfront.net/cms/files/14773/1560693095Guia-Pratico-de-PmaisL.pdf (accessed on 22 January 2020). (In Portuguese).
- Marujo, L.G.; Carvalho, D.; Leitão, M.N. Otimização de layout utilizando-se o SLP combinado com teoria das filas: Um estudo de caso em uma oficina de rodas e freios de aeronaves. Revista Gestão Industrial 2010, 6, 93–109. (In Portuguese) [Google Scholar] [CrossRef]
- Saravanan, M.; Arulkumar, P.V. An artificial bee colony algorithm for design and optimize the fixed area layout problems. Int. J. Adv. Manuf. Technol. 2015, 78, 2079–2095. (In English) [Google Scholar] [CrossRef]
- Camarotto, J.A. Projetos de Unidades Produtivas; Universidade de São Carlos: São Carlos, Brasil, 2006. (In Portuguese) [Google Scholar]
- Olivério, J.L. Projeto de fábrica produtos processos e instalações industriais, 1st ed.; IBLC-Instituto Brasileiro do Livro Científico Ltda.: São Paulo, Brasil, 1985; pp. 192–216. (In Portuguese) [Google Scholar]
- Muther, R. Planejamento do layout:Sistema SLP; Edgard Blucher LTDA: São Paulo, Brasil, 1978. (In Portuguese) [Google Scholar]
- Tseng, M.L.; Lin, Y.H.; Chiu, A.S.F. Fuzzy AHP-based study of cleaner production implementation in Taiwan PWB manufacturer. J. Clean. Prod. 2009, 17, 1249–1256. (In English) [Google Scholar] [CrossRef]
- Nunes, J.R.R.; Silva, J.E.A.R.D.; Moris, V.A.D.S.; Giannetti, B.F. Cleaner production in small companies: Proposal of a management methodology. J. Clean. Prod. 2019, 218, 357–366. (In English) [Google Scholar] [CrossRef]
- Korhonen, J.; Honkasalo, A.; Seppälä, J. Circular Economy: The Concept and its Limitations. Ecol. Econ. 2018, 143, 37–46. (In English) [Google Scholar] [CrossRef]
- Schneider, V.E.; Nehme, M.C.; Ben, F. Pólo Moveleiro da Serra Gaúcha: Sistemas de Gerenciamento Ambiental na Indústria Moveleira; Educs: Caxias do Sul, Brasil, 2006; p. 19. (In Portuguese) [Google Scholar]
- Kravchenko, G.A.; Pasqualetto, A.; Ferreira, E.D.M. Aplicação de princípios da ecologia industrial nas empresas moveleiras de Goiás. Revista Engenharia Sanitária Ambiental 2016, 21, 283–294. (In Portuguese) [Google Scholar] [CrossRef]
- Da Costa, M.A.F.; Costa, M.D.F.B.D. Projeto de Pesquisa: Entenda e Faça, 6th ed.; Editora vozes: Petrópolis, Brasil, 2015. (In Portuguese) [Google Scholar]
- Cauchick-Miguel, P.A.; Sousa, R. Metodologia de Pesquisa em Engenharia de Produção e Gestão de Operações, 3rd ed.; Coordenação de Cauchick-Miguel, P.A., Ed.; Elsevier: Rio de Janeiro, Brasil, 2018. (In Portuguese) [Google Scholar]
- Bernards, E.; Muniz Junior, J.; Nakano, D.N. Pesquisa qualitativa em engenharia de produção e gestão de operações; Atlas: São Paulo, Brasil, 2019. (In Portuguese) [Google Scholar]
- Voss, C.; Tsikriktsis, N.; Frohlich, M. Case research in operations management. Int. J. Oper. Prod. Manag. 2002, 22, 195–219. (In English) [Google Scholar] [CrossRef]
- Tubino, D.F. Planejamento e Controle da Produção: Teoria e Prática, 2nd ed.; Atlas: São Paulo, Brasil, 2009; p. 1. (In Portuguese) [Google Scholar]
- Serviço Brasileiro de Apoio às Micro e Pequenas Empresas. SEBRAE. 2019. Available online: https://m.sebrae.com.br/sites/PortalSebrae/estudos_pesquisas/quem-sao-os-pequenos-negociosdestaque5,7f4613074c0a3410VgnVCM1000003b74010aRCRD (accessed on 10 September 2019).
- Instituto Brasileiro de Geografia Estatística. IBGE. 2019. Available online: https://www.ibge.gov.br/cidades-e-estados/sc/palhoca.html? (accessed on 30 September 2019).
- Associação Brasileira de Normas Técnicas. ABNT NR-23: Proteção Contra Incêndios; Mai: Rio de Janeiro, Brasil, 2011. [Google Scholar]
- Associação Brasileira de Normas Técnicas. ABNT NR-11: Transporte, Movimentação, Armazenagem e Manuseio de Materiais; Abr: Rio de Janeiro, Brasil, 2016. [Google Scholar]


© 2020 by the authors. Licensee MDPI, Basel, Switzerland. This article is an open access article distributed under the terms and conditions of the Creative Commons Attribution (CC BY) license (http://creativecommons.org/licenses/by/4.0/).