Article

The Role of Electricity Balancing and Storage: Developing Input Parameters for the European Calculator for Concept Modeling

by
Miklós Gyalai-Korpos
1,
László Zentkó
1,
Csaba Hegyfalvi
1,
Gergely Detzky
1,
Péter Tildy
1,
Nóra Hegedűsné Baranyai
2,
Gábor Pintér
2 and
Henrik Zsiborács
1,2,*
1
PANNON Pro Innovations Ltd., 1021 Budapest, Hungary
2
Department of Economic Methodology, University of Pannonia, Georgikon Faculty, 8360 Keszthely, Hungary
*
Author to whom correspondence should be addressed.
Sustainability 2020, 12(3), 811; https://doi.org/10.3390/su12030811
Submission received: 4 December 2019 / Revised: 12 January 2020 / Accepted: 20 January 2020 / Published: 22 January 2020
(This article belongs to the Special Issue Economic Evaluation of Renewable Energy Sources)

Abstract

:
Despite the apparent stability of the electricity system from a consumer’s point of view, there is indeed significant effort exerted by network operators to guarantee the constancy of the electricity supply in order to meet demands any time. In the energy sector models provide an important conceptual framework to generate a range of insight, examine the impacts of different scenarios and analyze the supply and demand of energy. This paper presents a user-oriented and transparent modeling concept of the European calculator, a tool for delineating emission and sustainable transformation pathways at European and member state levels. The model consists of several modules of different sectors, where the energy supply module includes sub-modules for electricity generation, hydrogen production and oil refinery. The energy storage requirement module investigates how new technologies can help the stability of the European electricity system with increasing renewables penetration, demand-side measures and decarbonization paths. The objective of this study is to introduce the concept of this module with the main logical steps, especially the input parameters, assumptions, the basic data of electricity trade and maximum energy storage potential levels. The article also introduces and explains the feasibility of the theoretical maximum gross electricity generation potential from variable renewable energy for the European Union including Switzerland, compared to the demand in 2040. According to the results the electricity systems in the future will need to show ever increasing flexibility in order to cope with variable renewable energy production on the supply side, and shifting patterns of electricity consumption on the demand side.

1. Introduction

1.1. Challenges in the European Electricity Systems

Despite the apparent stability of electricity systems from a consumer’s point of view, there is indeed significant effort exerted by the network managers to guarantee the constancy of the electricity supply. Although, from a technical point of view, electricity demand and supply always need to be equal, both the supply and demand of electricity are, in fact, rather variable, even in the short term, thereby requiring significant efforts by transmission system operators (TSOs). It is likely that due to expected structural changes in the European electricity grid, balancing activities and capacities will advance in the future. The growing share of intermittent renewable electricity generation, as well as changing patterns in electricity demand create challenges for grid balancing. On the demand side, this is due to the electrification of sectors, as well as empowering consumers with the options to wisely influence consumption and even produce electricity on their own, thus finally becoming prosumers. Thus, new technologies and investments, as well as grid management strategies are needed for seamless integration. Currently, the balancing of the grid is mostly done by natural gas-based power generation, a widely spread and applied technology, and also by pumped hydro storage (PHS). Currently these technologies provide the required flexibility for the grid. Using natural gas, however, is not climate neutral and natural gas is mostly imported to Europe, while PHS is geographically limited to certain countries. In continental Europe the largest potential for PHS is in the Alps, and the existing PHS units there already play a role in balancing the intermittency of renewables at a European level [1,2,3,4,5].

1.2. The Trends and Evolution of Electricity Balancing

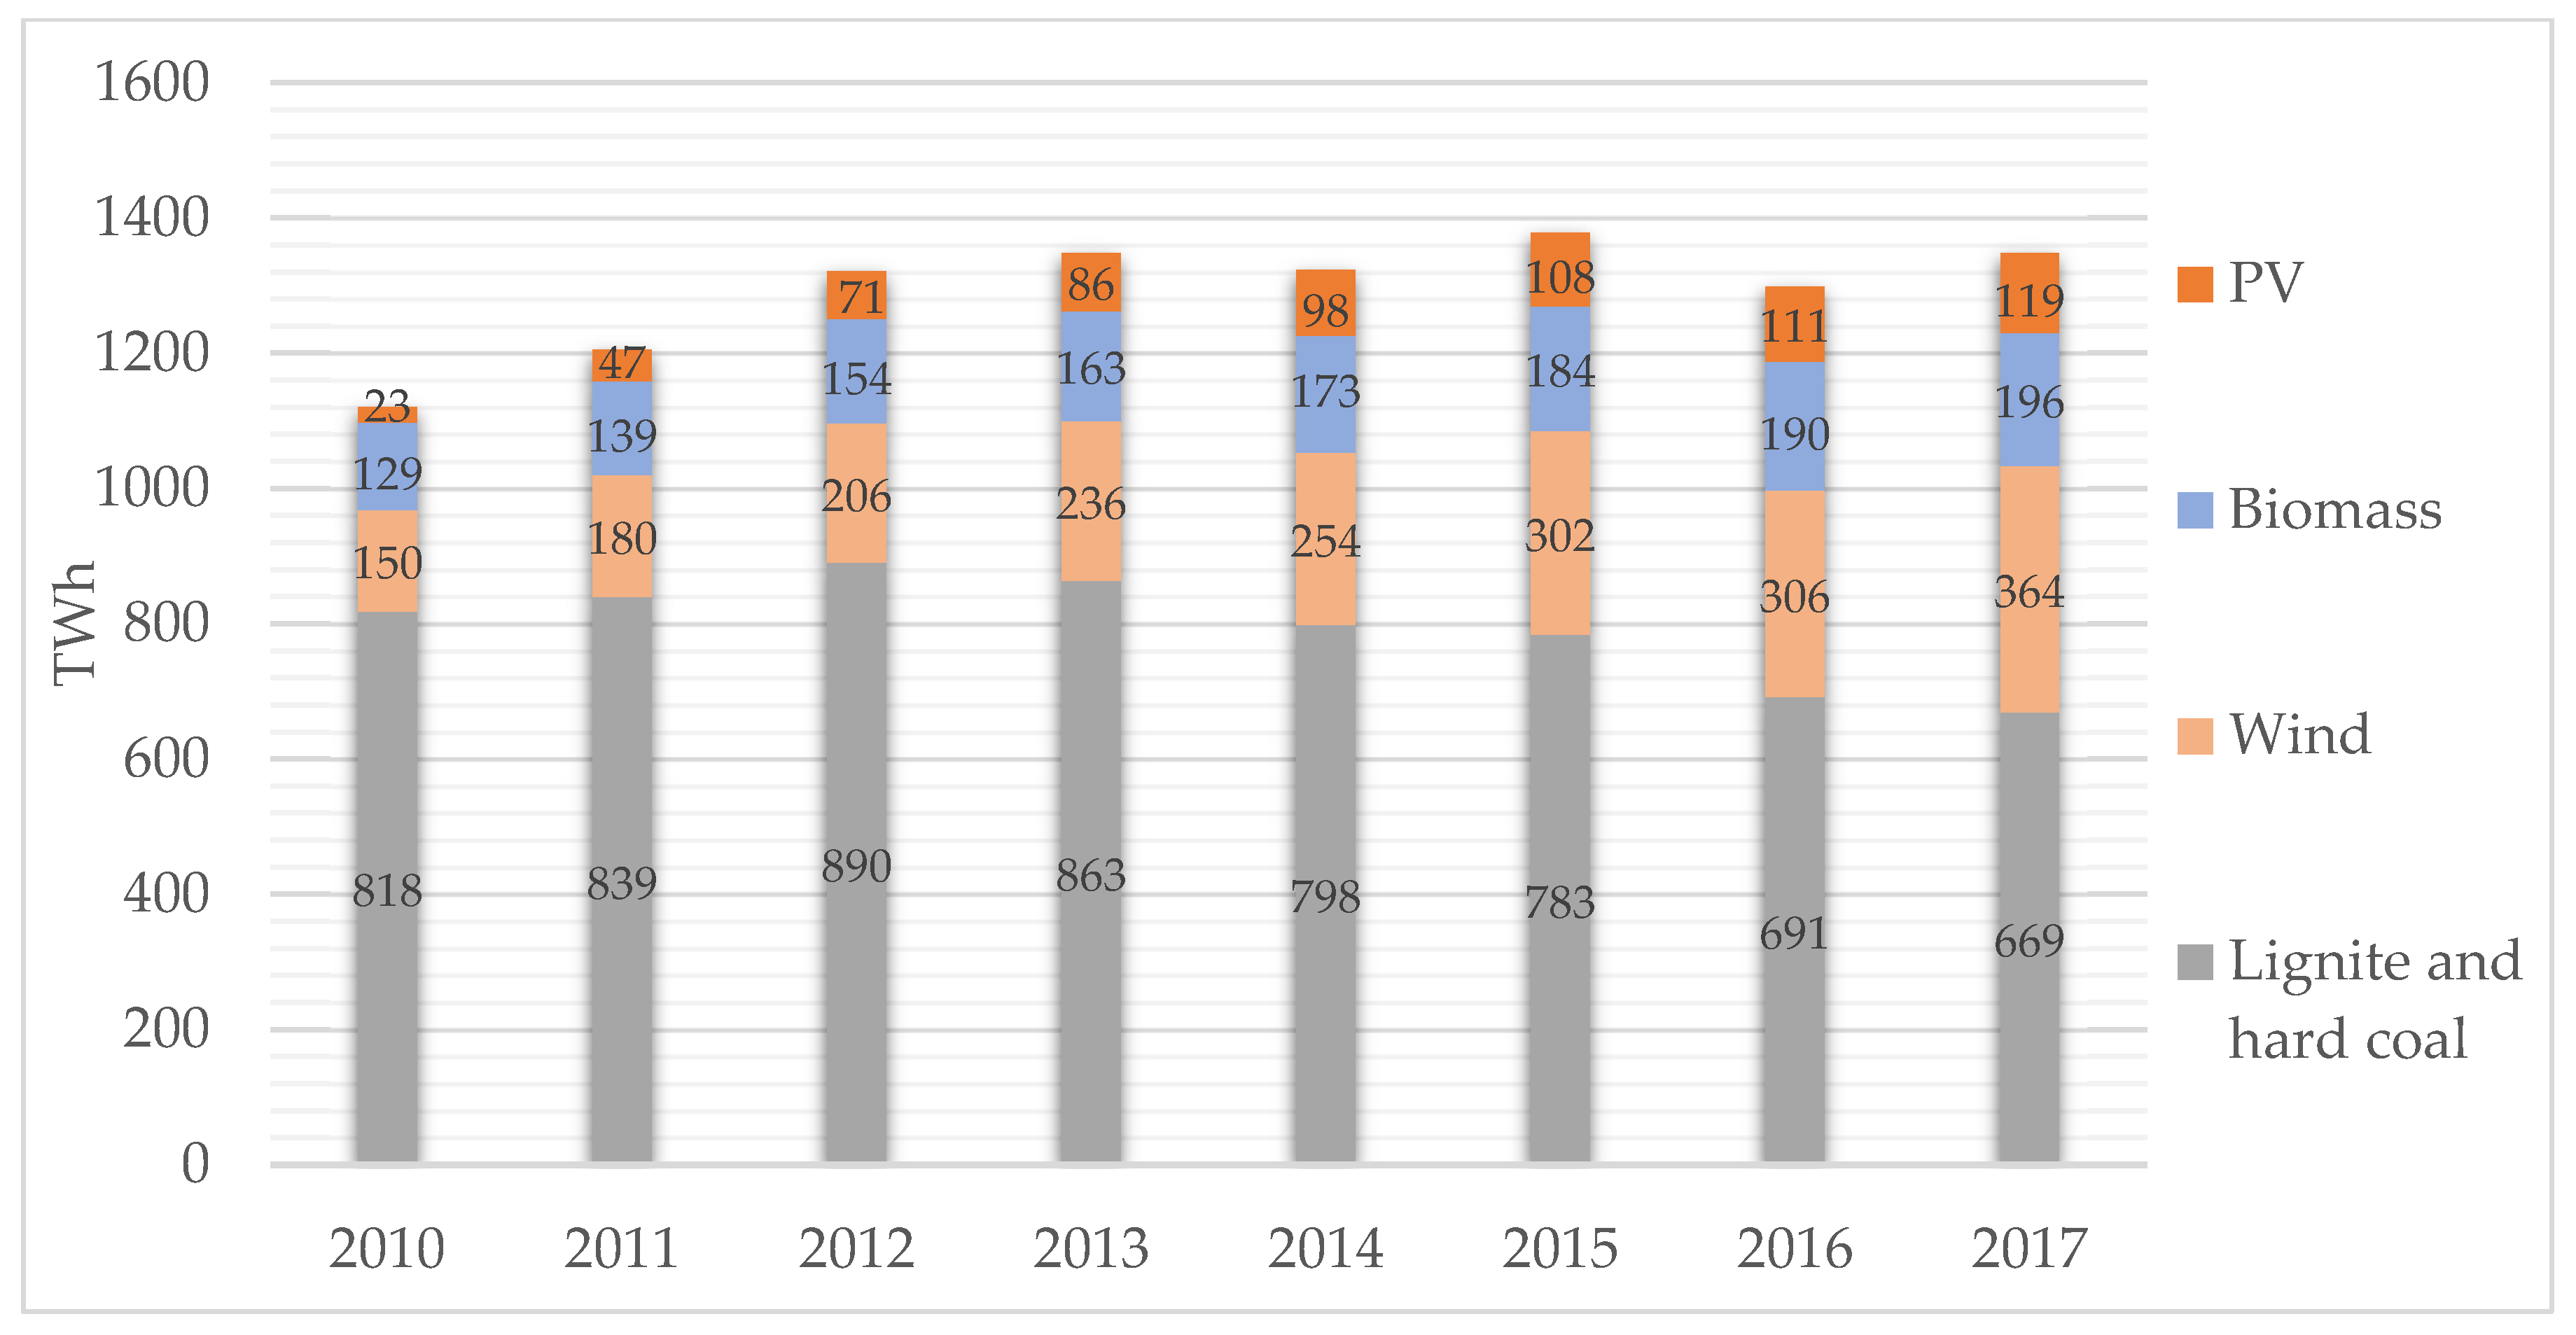
Electricity Supply Side

In the past few years tremendous changes have started both on the supply and demand sides of the electricity sector, which are expected to accelerate in the future. On the supply side renewable-based power generation technologies, mostly wind and photovoltaic (PV) power are becoming dominant parts of electricity systems, as shown in Figure 1 and Figure 2. From a balancing perspective, the intermittent nature of these renewable energy sources—which are also expected to be subject to the effects of climate change—are creating challenges in the electricity sector that previously were not of concern. In the short term, renewable-based power generation needs to be properly integrated with non-intermittent traditional baseload power plants, which puts significant strains on network operators and the operators of the existing power plant portfolio. In the long term, however, the storage needs of excess renewable power generated in favorable conditions and should be stored for later, when the conditions are not ideal for weather-dependent renewable energy generation, needs to be tackled. Furthermore, it is not only the increased overall level of renewables that is creating challenges in terms of balancing but also the questions of the locations where these renewable power generation capacities are connecting to the existing electricity grid. As a result, the electricity system is becoming more and more decentralized, as, for instance, household-scale PV installations are connecting to the low voltage network. From a balancing perspective this is important, as storages will be increasingly required in cases when the generation capacities are connecting to the distribution instead of the transmission network. These storage devices, which are integrated into the distribution network along with the renewable power capacities are essential to prevent bi-directional flows, which would otherwise decrease the supply qualities of the electricity system, while also increasing the costs associated with operating these systems. Decentralization also creates the possibility to evolve micro-grids of self-sustainable electricity production communities, which may function separately from the nation-wide electricity grids in the future. The application of decentralized energy generation in micro-grids—especially in those that operate on PV and wind power—cannot be reliable on its own. The intermittency of renewables is perhaps an even greater issue in micro-grids and therefore requiring balancing technologies. Nevertheless, despite these apparent shortcomings, complementing the centralized grid with decentralized power and storage systems improves energy independence and reliability for the overall system [6,7,8,9]. (Figure 2)

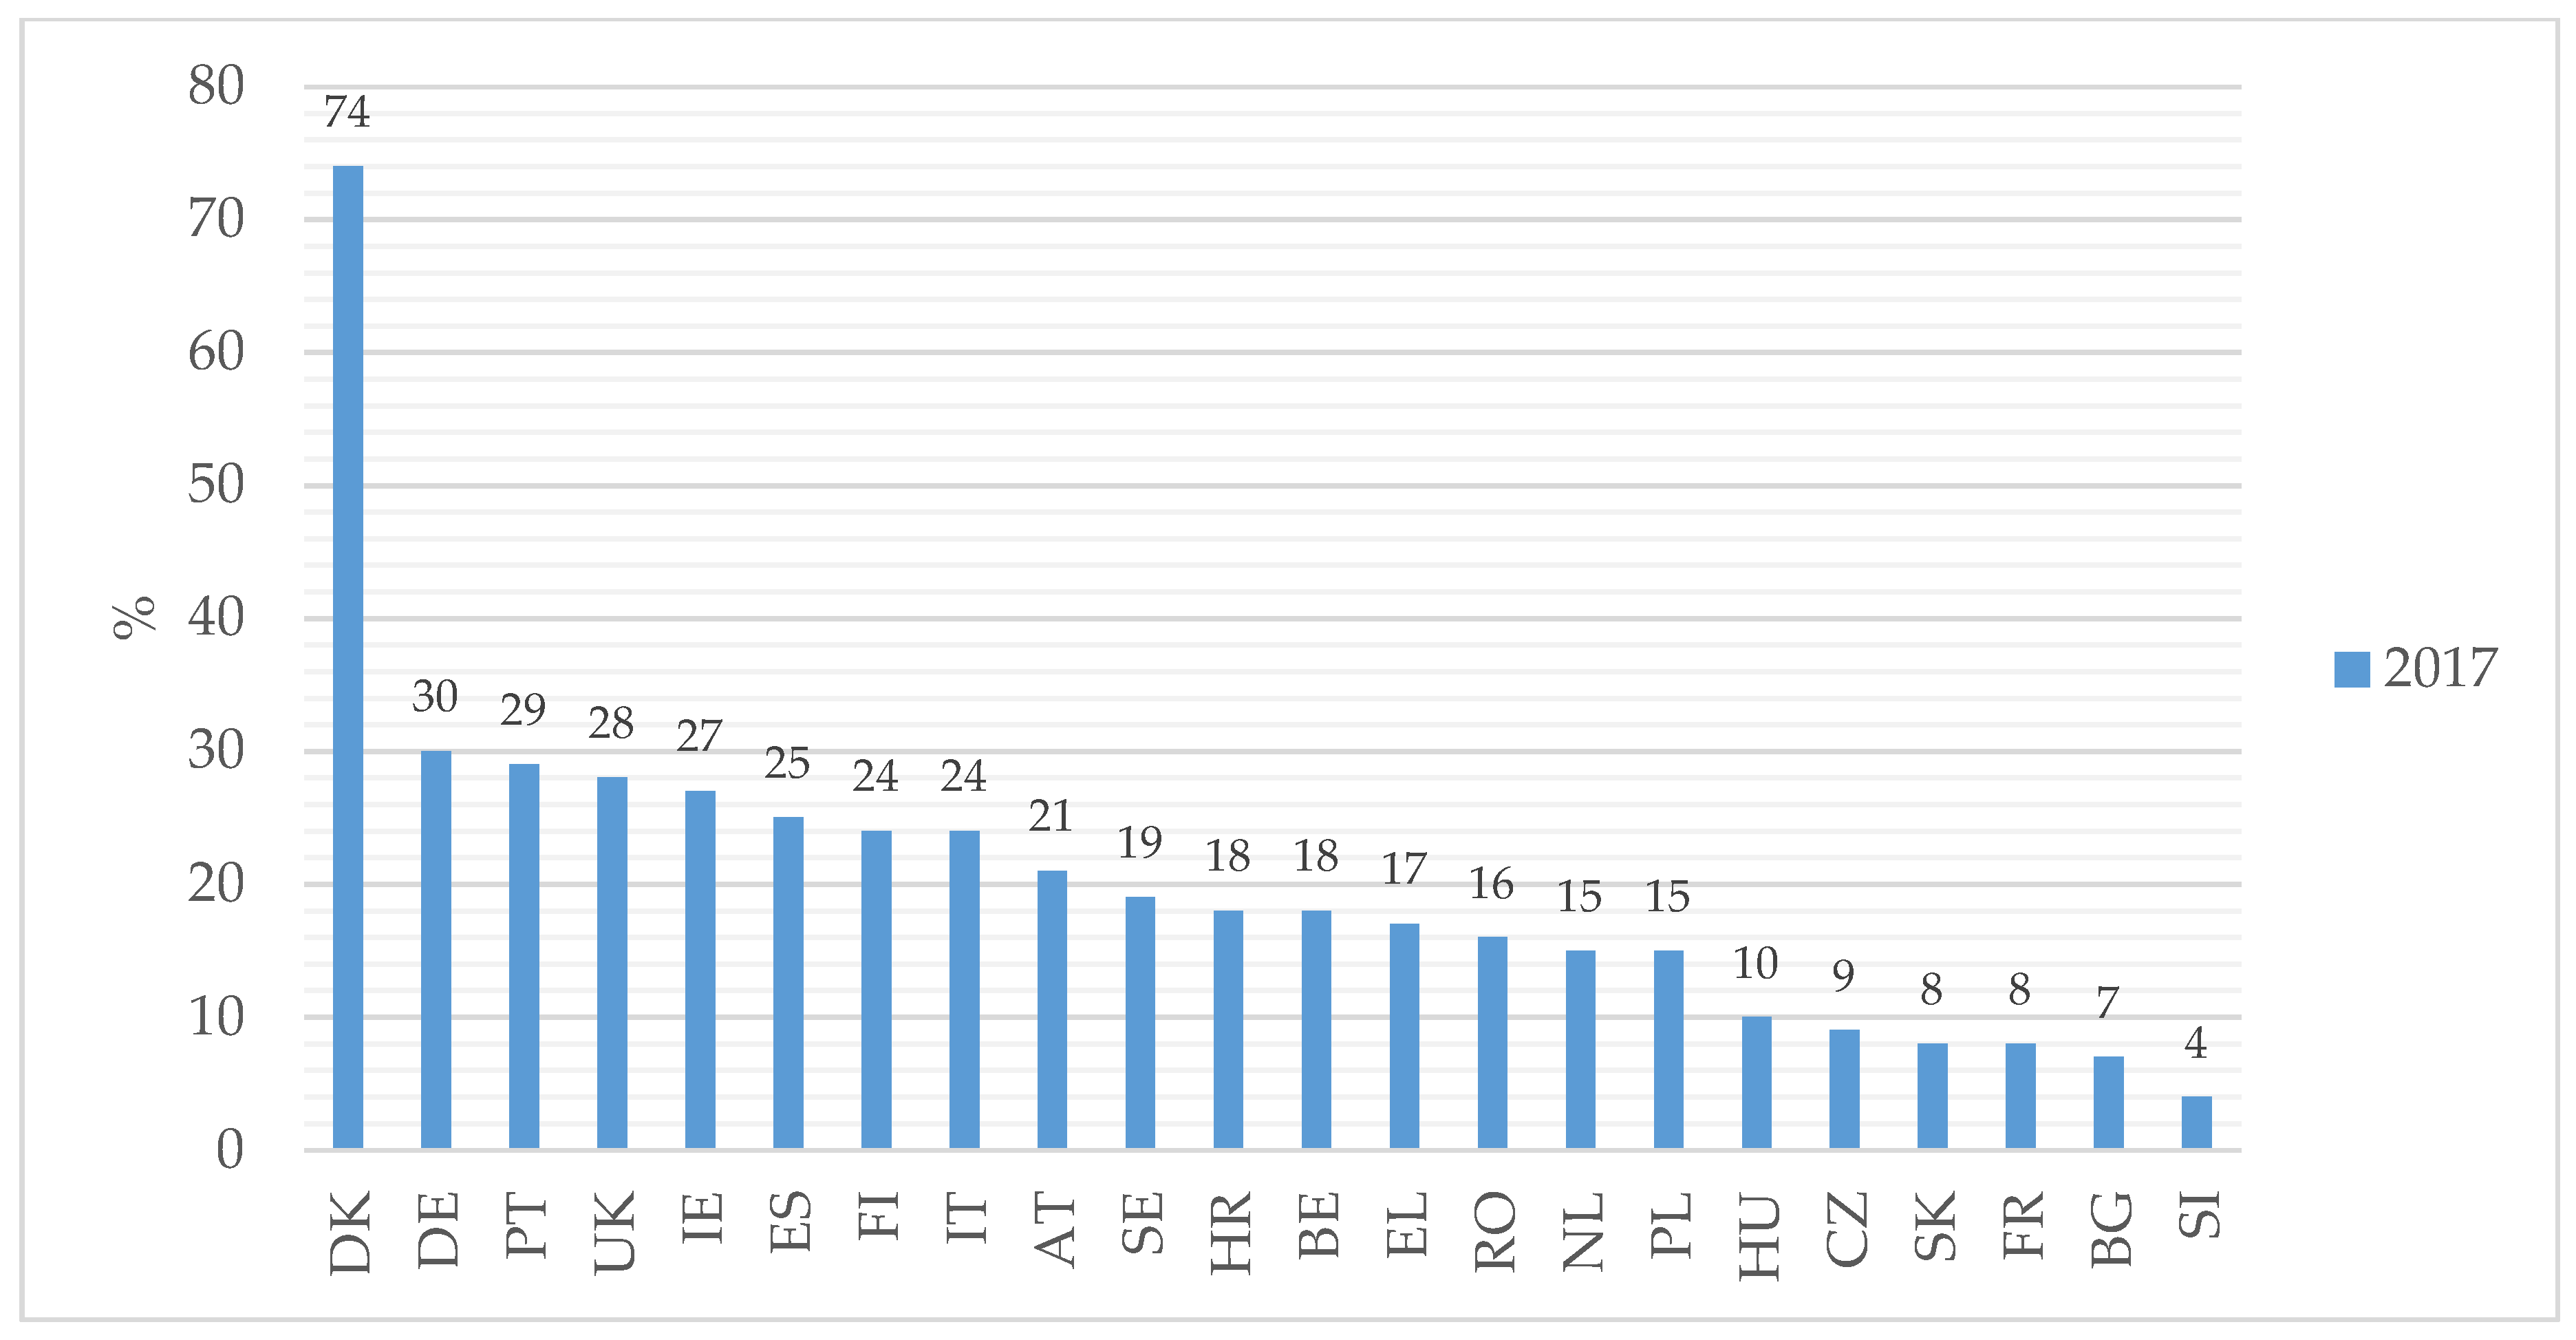
1.3. Changes in the Spread of Photovoltaic and Wind Energy Technologies in the European Union and the Importance of Energy Storage Systems

A major change has been going on in the power generation sector of the EU with a significant increase of renewables technologies and an accelerating decrease of burning fossil fuels. In general, all fossil fuel-based power generation capacities in Europe are aging, meaning a good chance for renewables to replace them [10]. Nevertheless, natural gas-based power generation may play a role in balancing the growing intermittency of the production due to its flexibility [11]. The growing share of renewables is due to policy incentives and more and more to decreasing costs and economic maturity, while fossil fuel-based capacities are disappearing due to the ageing of the power plant stock and phase-out policies [10]. In the EU the growth of wind- and PV-based power generation has become significant in the last few years [12,13].
In 2015 a wind power capacity of 142 GW (131 GW onshore, 11 GW offshore) was operational in the EU. In that year, wind energy overtook hydropower as the third largest source of power generation in the EU with a 15.6% share of the total power capacity. Wind power accounts for one third of all new power installations since 2000. The total wind power capacity installed at the end of 2015 could produce 315 TWh and cover 11.4% of the EU electricity consumption in a normal wind year [14]. Due to the continuous increase of wind power capacities, with a total net installed capacity of 169 GW in 2017, wind energy is now the second largest form of power generation capacity in Europe, closely approaching natural gas installations [15]. Different scenarios are available to project the further spread of wind power capacities in Europe. According to scenarios from different sources, the European total onshore wind power capacity in 2050 can be in the range of 245–875 GW, while off-shore lies between 190 and 373 GW [16], depending mainly on policies. The EU Reference Scenario 2016 predicts a total of 367.6 GW wind power capacity in the EU-28 for 2050, which is possible because the Reference Scenario provides a benchmark, which can be used for comparing new policy proposals and allows policy-makers to analyze the long-term economic, energy, climatic and transport outlooks based on the current policy framework [17].
Next to wind power, PV capacities are adding to the European power plant stock at the second fastest pace. The built-in photovoltaic capacity was 115 GW in the European Union in 2018 and the solar power generation can be a cornerstone of a decarbonized electricity system in many EU countries [12,18]. According to projections, PV can become dominant in the European power generation fleet. Bloomberg New Energy Finance believes it could account for a 36% share or 1400 GW, while according to Prof. Christian Breyer of Lappeenranta University of Technology solar power technologies will provide nearly 2 TW of power generation in Europe, of which nearly 700 GW will be utility-scale and nearly 1.3 TW rooftop solar PV [19]. The EU Reference Scenario 2016 [17] predicts a PV capacity of 294.7 GW in the EU-28 for 2050, while other sources indicate that the European PV capacity can be in the range of 480–962 GW [16,20].
The energy system will rely significantly on renewables by 2050 in the EU [21,22,23,24]. The optimal share of PV and wind energy technologies in the energy mix depends on various factors. The flexibility of the grid, the quality, the back-up capacity of the transmission system [24,25,26,27,28], the load performance characteristics [24,29,30,31] and the actual local weather patterns may determine the volume of variable renewable energies (VREs) [24,32,33,34]. An ideal solution to compensate for the uncertainty arising from the variable nature of PV and wind technologies is to upgrade and enhance the overall flexibility of the electricity grid. By integrating more VRE technologies into the European grid system, it will be essential to tackle the need for a more flexible electricity grid because the electricity system needs to be always in balance. By adding storage capacity to the energy system, greater flexibility can be achieved through the provision of a back-up potential for shaving of peak loads or filling valleys [24,32,33,35].

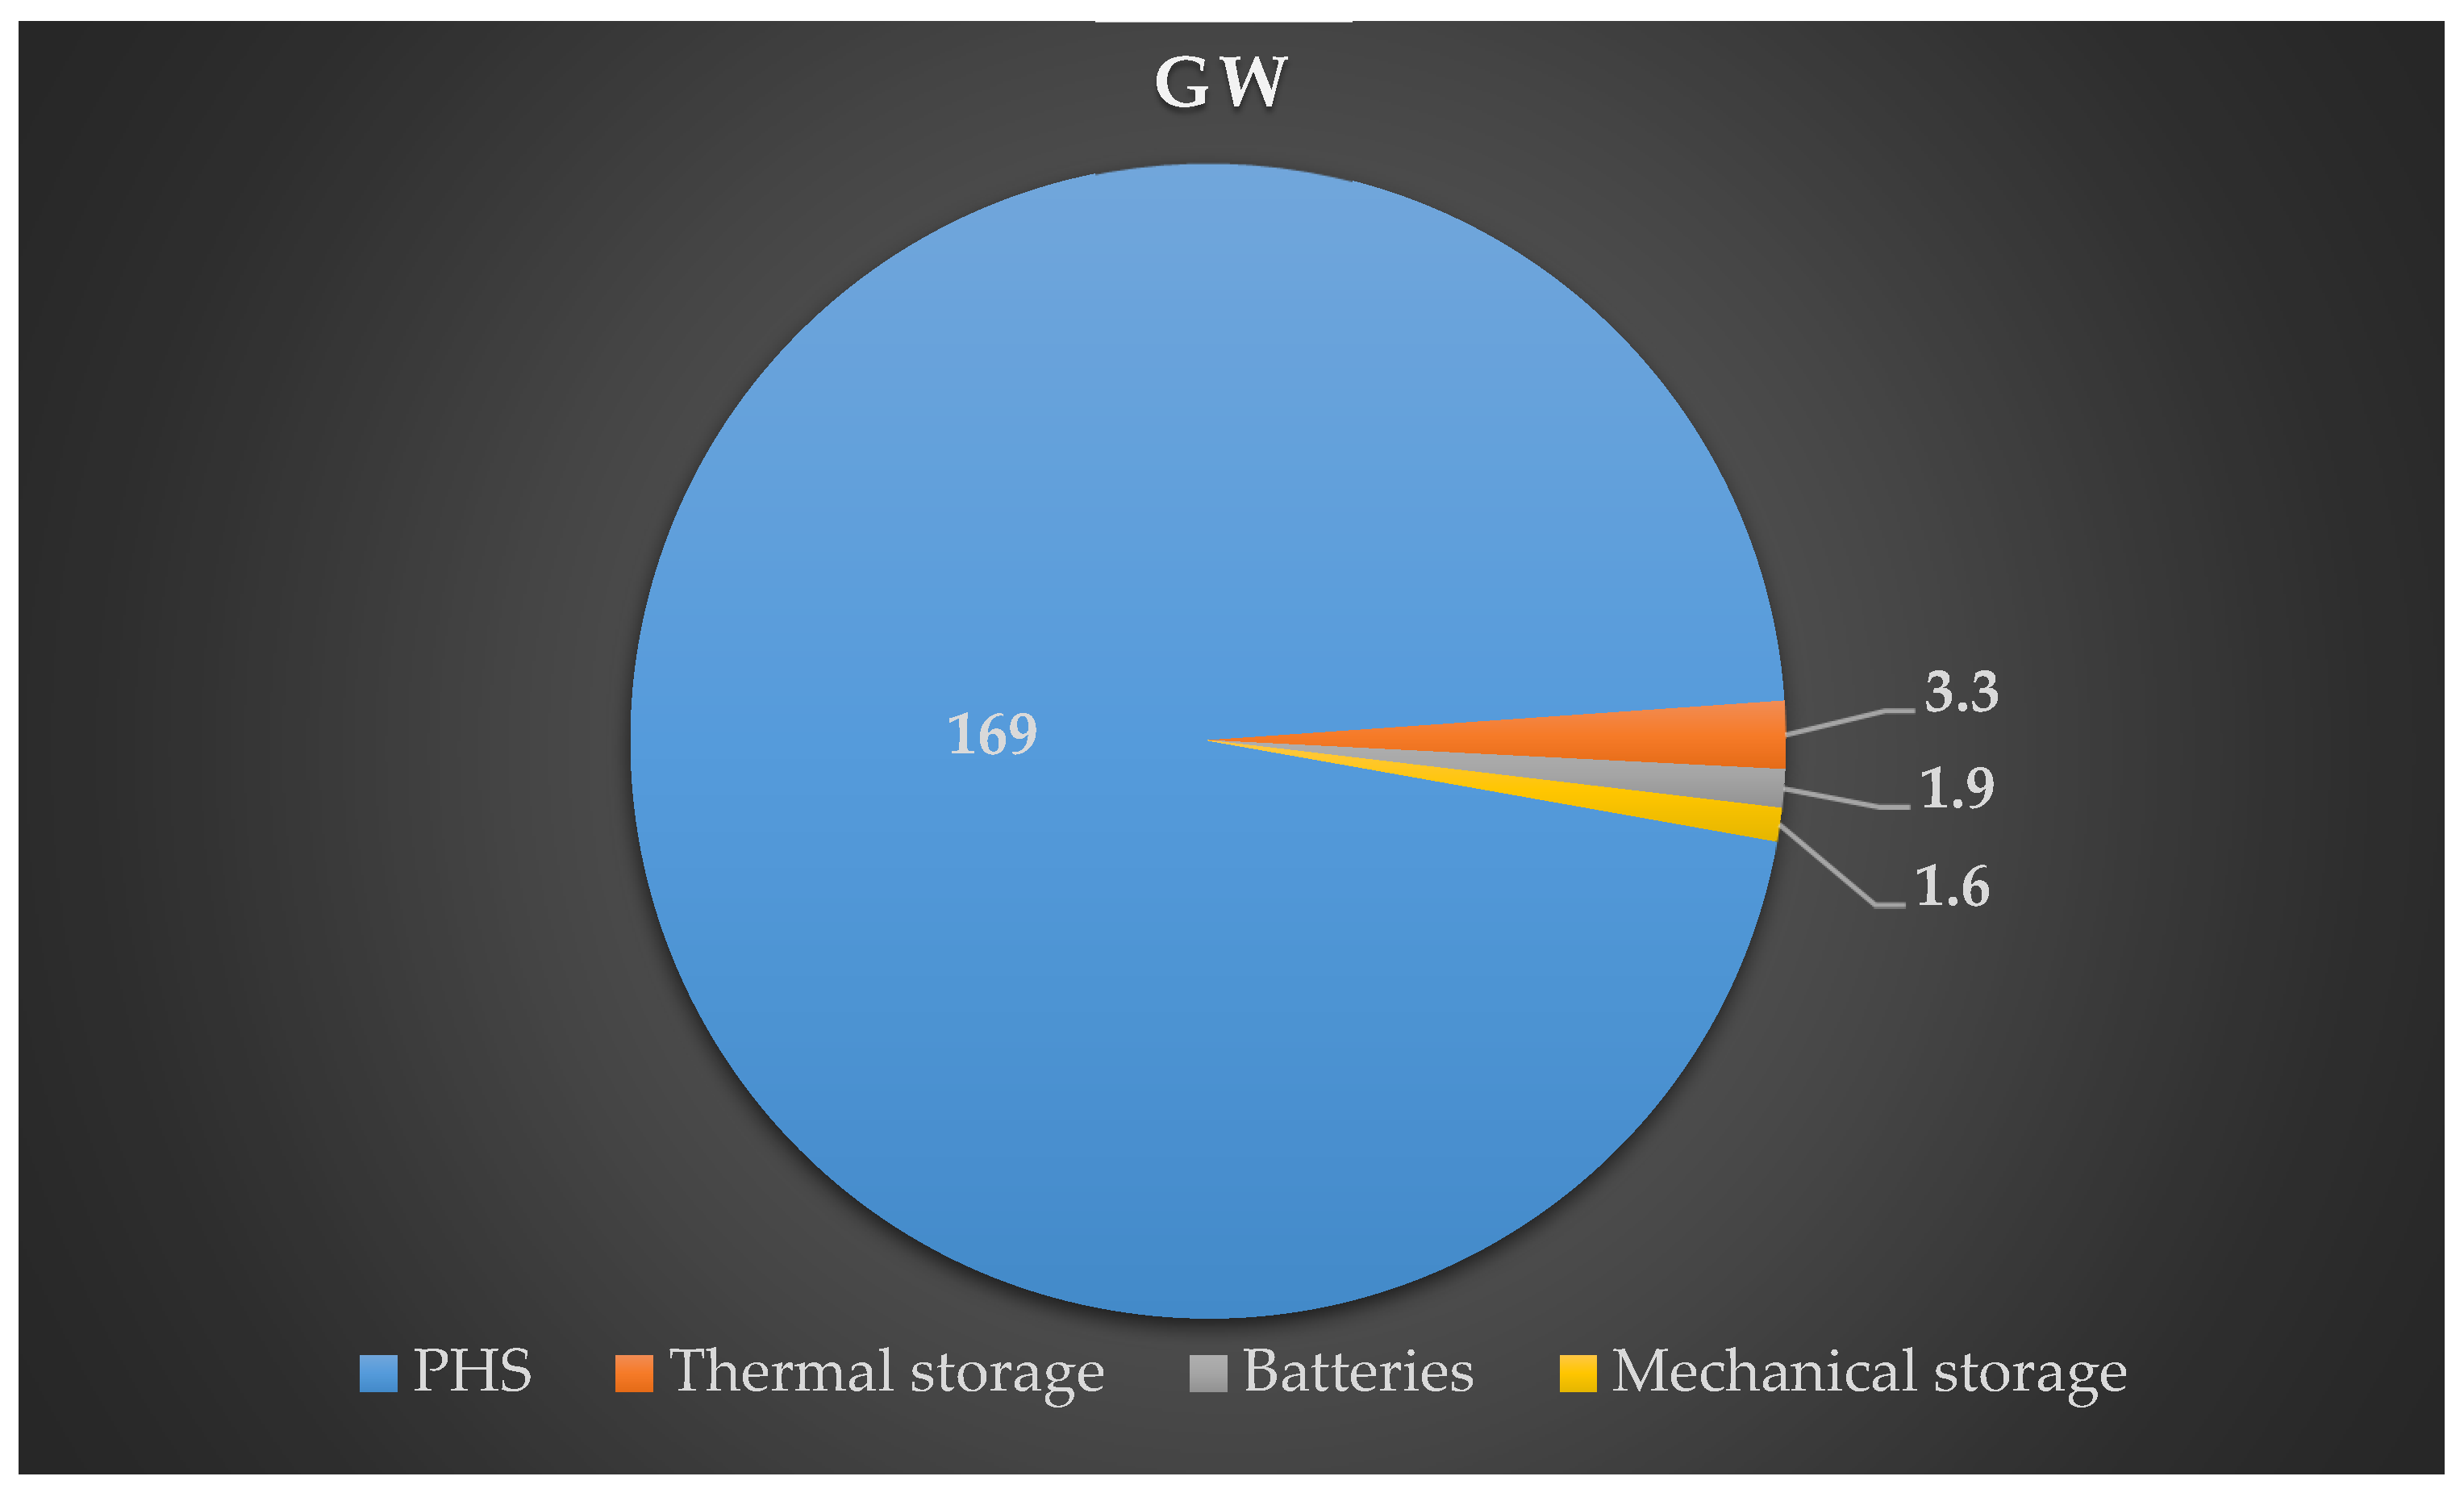
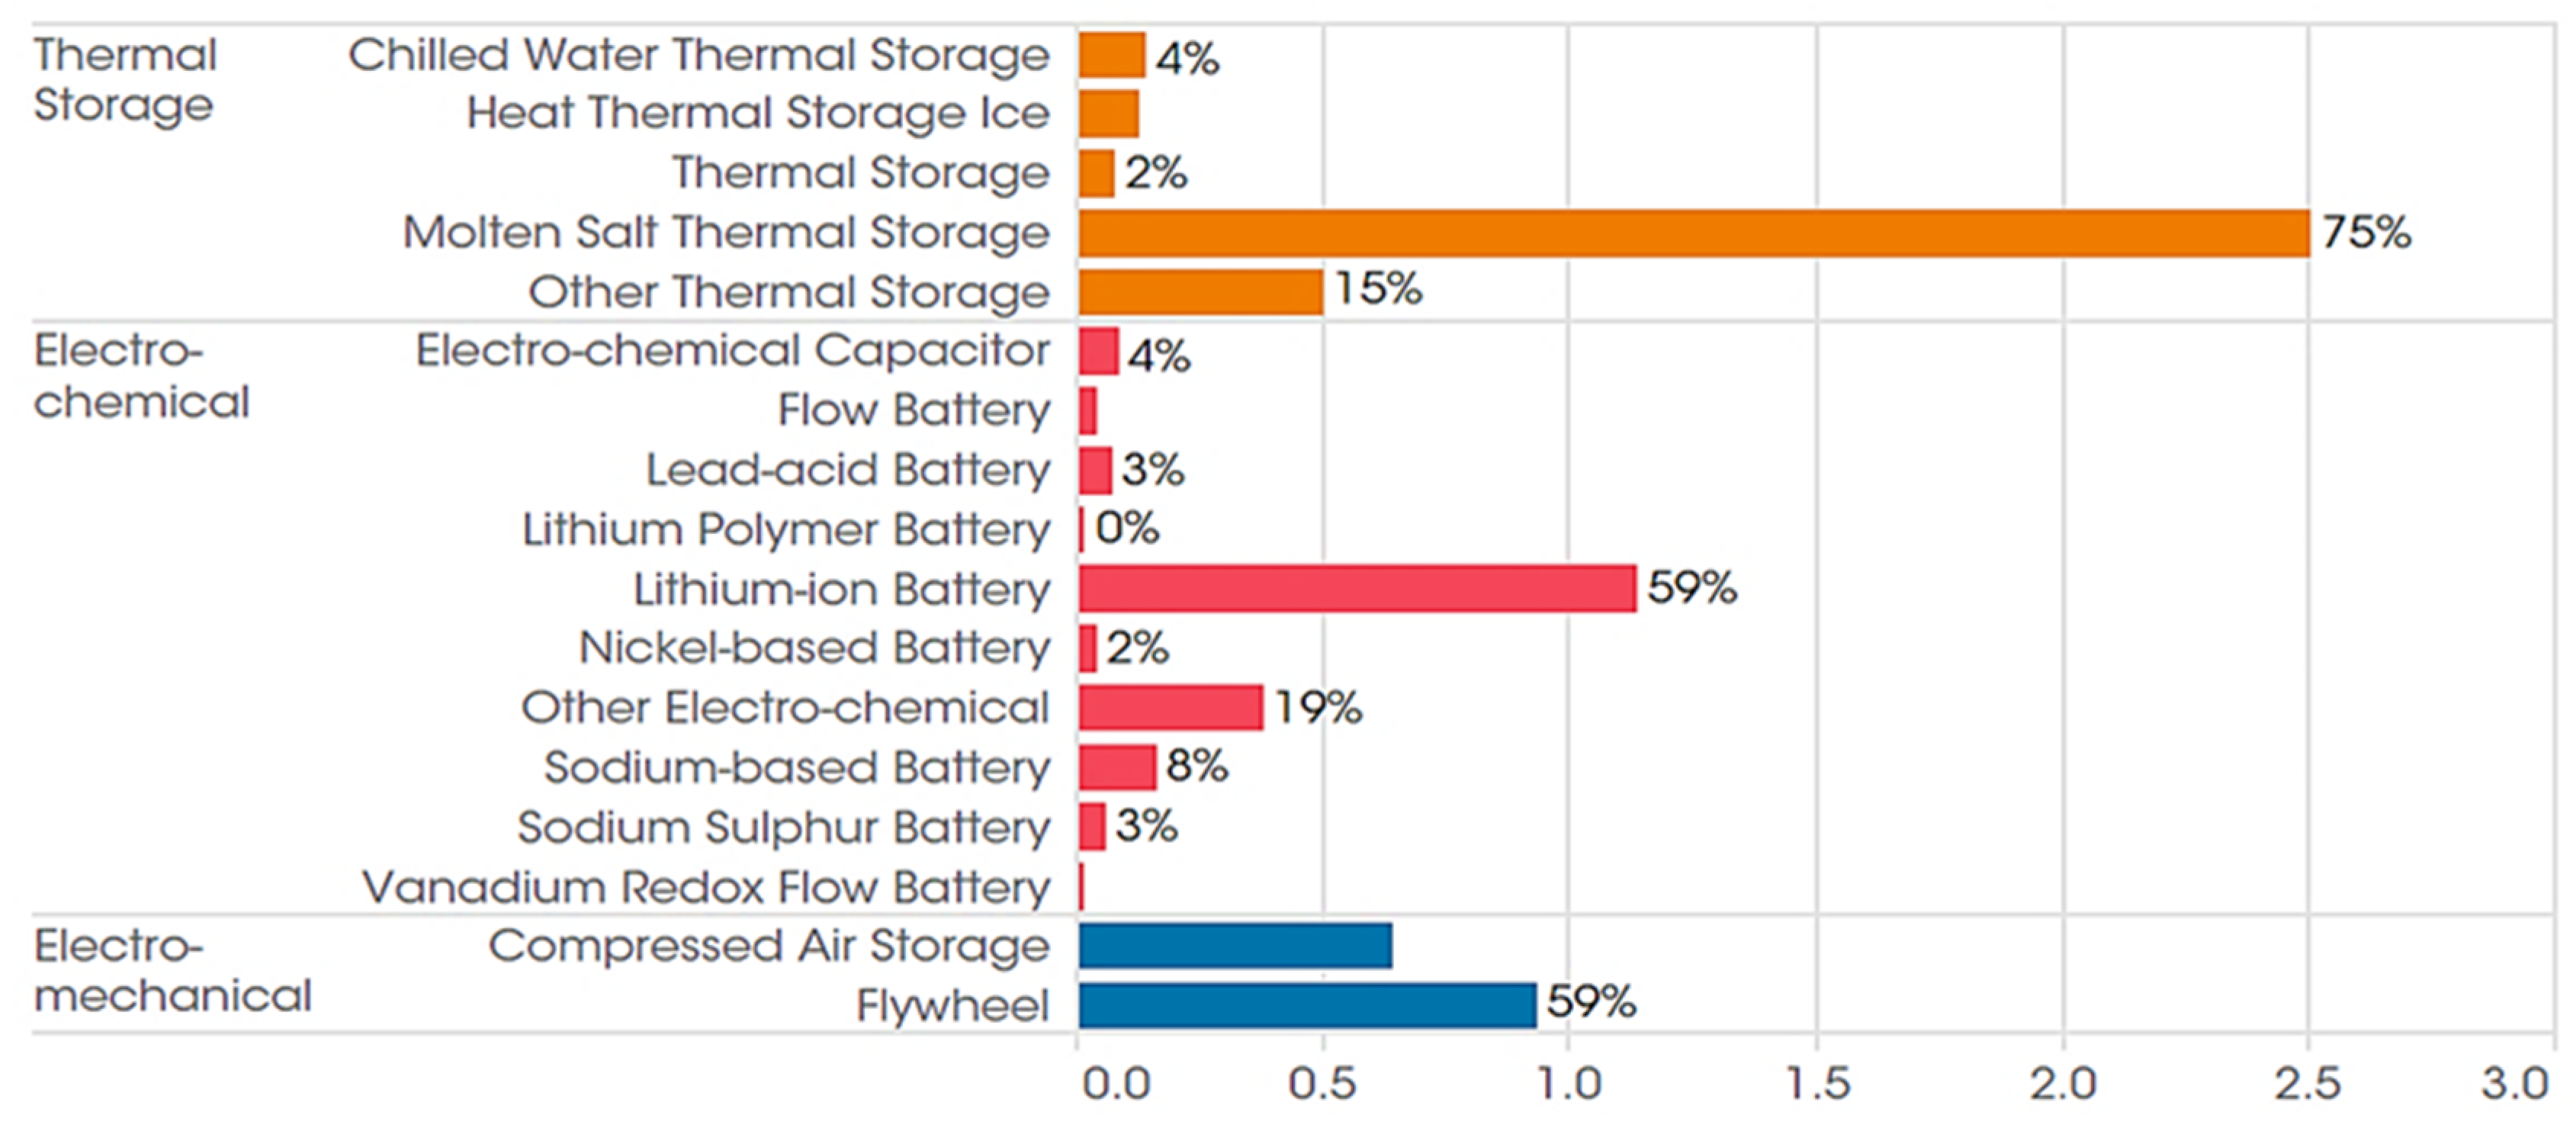
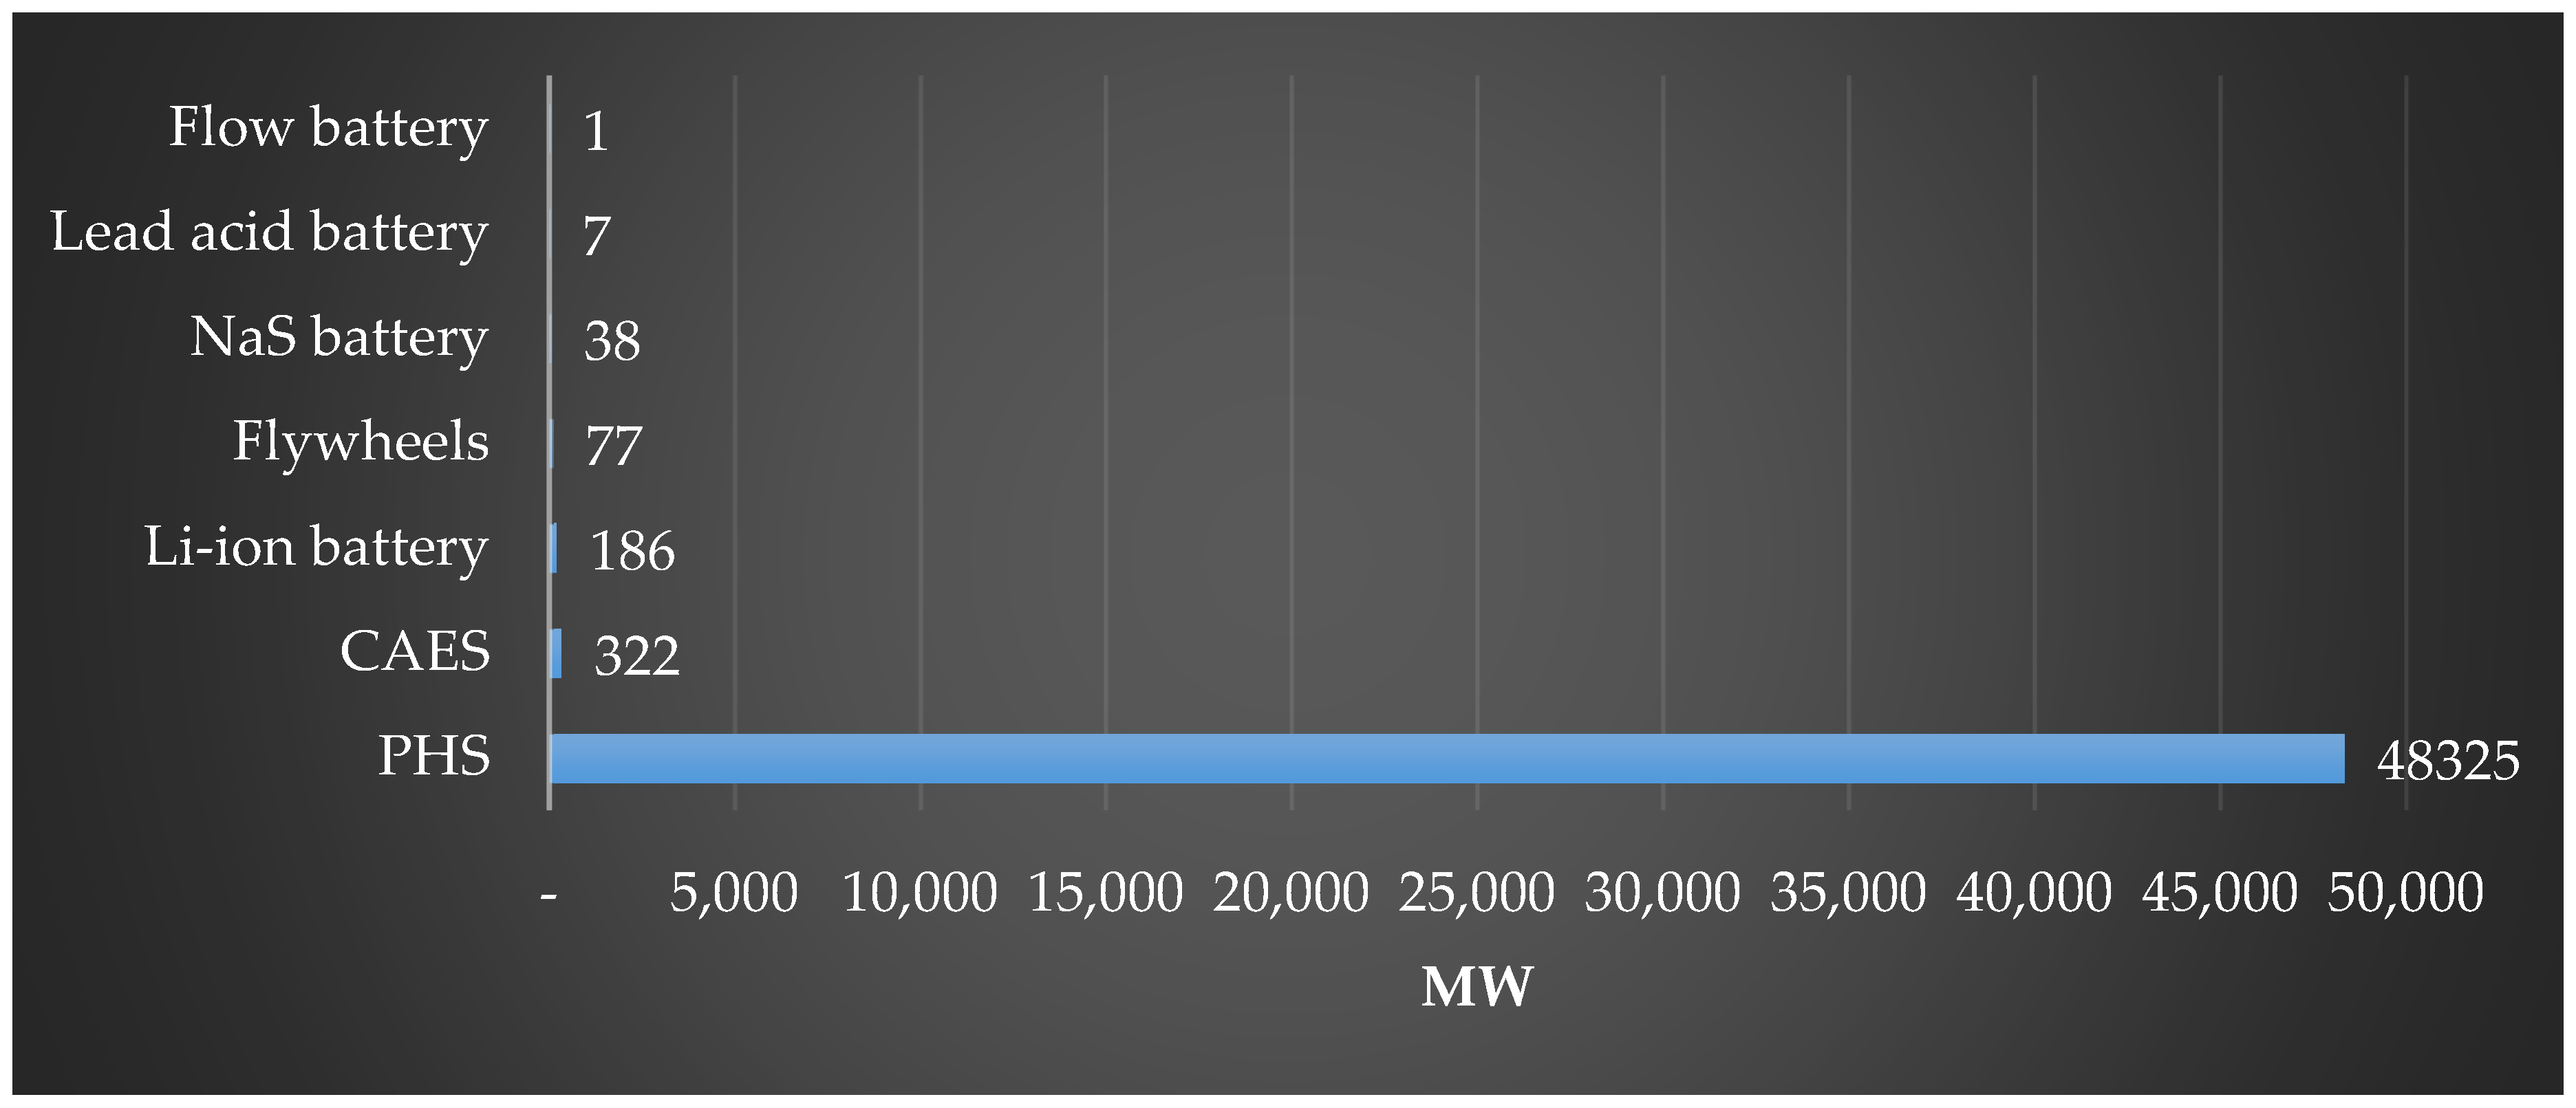
1.4. The Current Situation of Electricity Storage Technologies

The global stationary and grid-connected energy storage capacity was 156.4 GW in 2016 (176 GW/mid-2017, Figure 3) of which only the pumped storage hydropower (PHS) technology was 150 GW (169 GW/mid-2017, Figure 3) [36]. Other technologies only constitute a small slice of the pie but growing continuously: around 0.8 GW of new energy storage capacity was built in 2016, bringing the year-end capacity total to an estimated 6.4 GW [37]. Most of the growth was in electrochemical (battery) storage technologies, which increased by 0.6 GW to a total of 1.7 GW energy storage capacity. Lithium-ion technologies constituted the majority of the new capacity installed and currently the rechargeable battery is one of the most widely used electrical energy storage technologies in many areas (Figure 4). Battery storage is attractive because it is already economical, easy to deploy, compact, and provides virtually instant response both when being charged and discharged [38,39,40]. PHS dominates also in Europe. Figure 5 shows the sum of installed storage units in Europe as of 2016 [41].

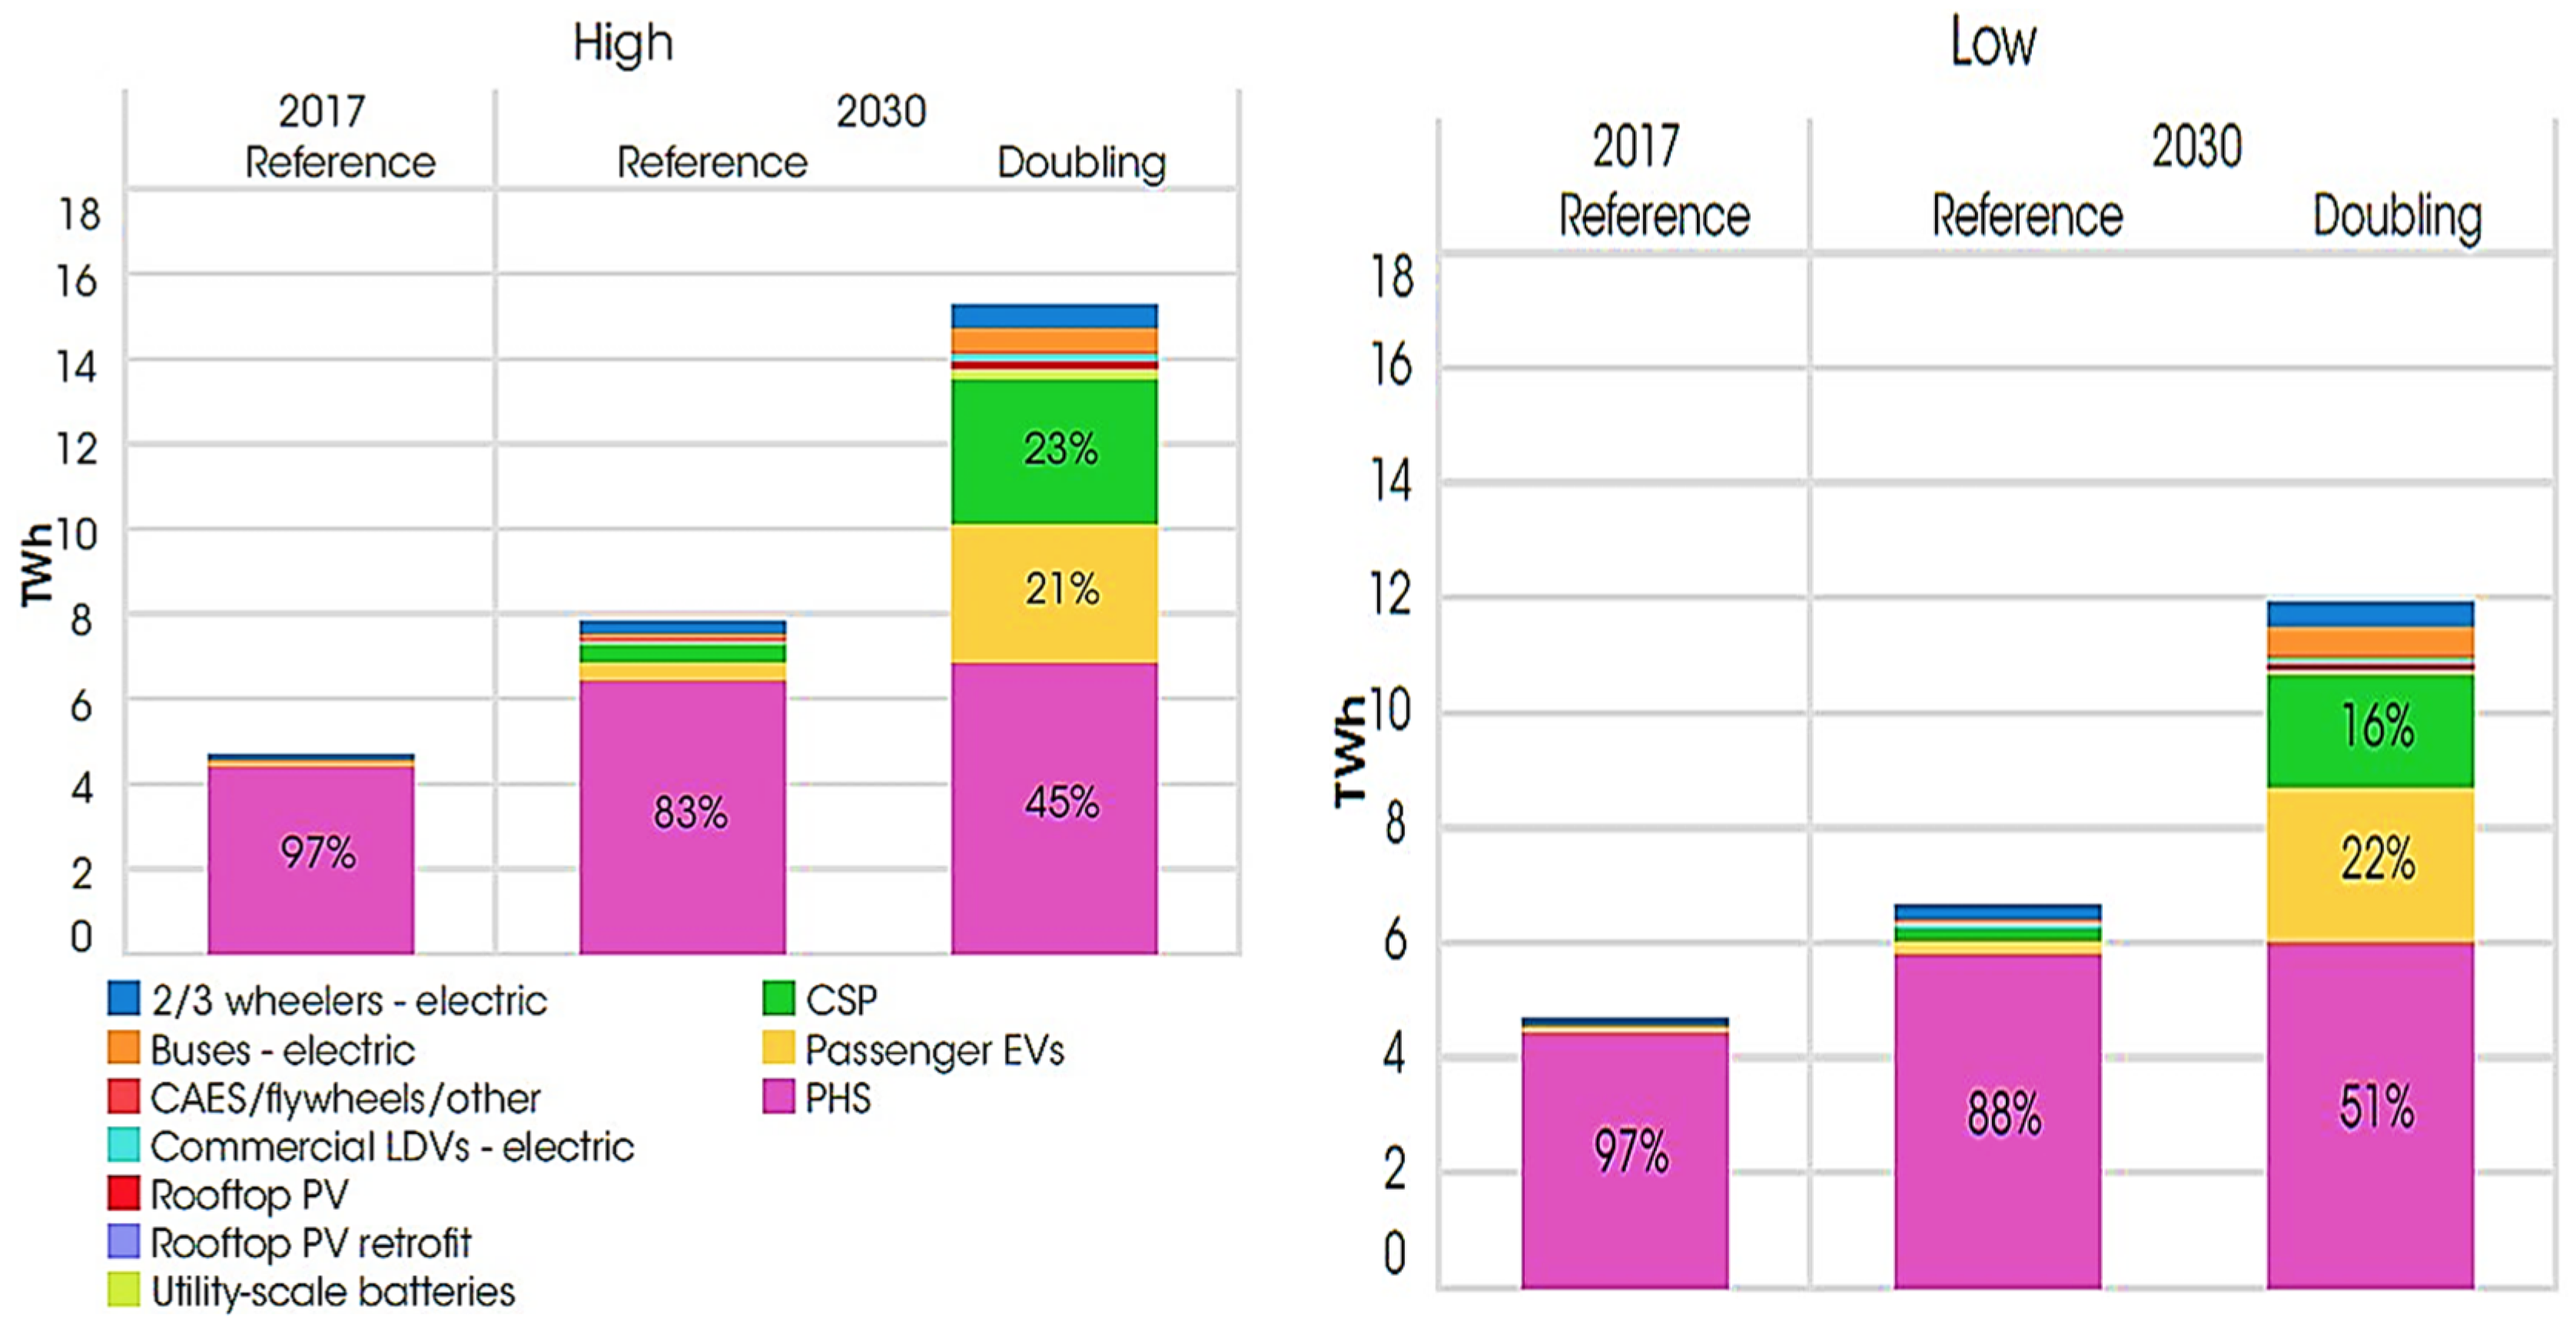
1.5. Various Scenarios for Electricity Storage in 2050

IRENA scenarios show that the total electricity storage volumes are projected to grow from an estimated 4.67 TWh in 2017 to 6.62–15.89 TWh by 2030 (Figure 6) if the share of PV and wind energy in the energy system is to double by 2030. Based on the reference forecasts for 2030, the global PHS capacity will increase at least by 1.2 TWh compared to 2017. However, it should be noted that the TWh forecasts have significant uncertainty till 2030 (IRENA, 2017). The large increase in storage technologies as forecasted by IRENA [42] will be driven by the rapid growth of utility-scale and behind-the-meter applications. It means that the total electrochemical storage volume in stationary applications will grow from an estimated 11 GWh in 2017 to 100–421 GWh by 2030 (Figure 7). High residential and commercial electricity rates, the competitive cost structures for PV, and the low levels of remuneration for grid feed-in constitute important aspects that are helping the spread of stationary battery technologies [42]. It is expected that regulatory reforms will open up other opportunities for electro-chemical storage deployment, given that battery storages will be increasingly offering competitive and flexible services (such as time shift services, frequency regulation, voltage support, or renewable capacity firming) to markets [43].
In 2030 the estimated role of PHS will be still significant but smaller because the cost reduction of battery technologies will open up new economic opportunities for storage technologies. In the future, it is likely that the total installed cost for stationary Li-ion battery applications will be in the range of 145–480 USD/kWh, depending on battery chemistry, which is a 50%–60% reduction compared to current costs. The cost of Li-ion batteries used in electric vehicles already decreased by 73% from 2010 to 2016. However, it is not just Li-ion based batteries that have great prospects. The cost reduction potential for emerging technologies (like zinc bromine or vanadium redox flow batteries) is also significant [43].

1.6. Introduction of the European Calculator Model

In the energy sector models are important structures to generate a range of insight and analysis on the supply and demand of energy. The European Calculator (EUCalc model) is a model of energy, land, materials, product, and food systems at European and member-state levels for representing greenhouse gas (GHG) emissions dynamics until 2050. The model can be applied for delineating emission and sustainable transformation pathways at a European scale but may also be used to study the impact of a specific member state on European-level policy [44].
While optimization models are often the norm in low carbon analysis (e.g., economic optimization), the massive uncertainties arising from taking a long-term horizon as 2050 or 2100 mean that optimizing on certain factors like costs is at the least extremely challenging, meaning these models should be complemented with other approaches to possible low carbon trajectories, particularly if one wants to include the potential of breakthroughs or non-linear changes. Addressing these system dynamics with a bottom-up driver- and lever-based model provides a very powerful and complementary alternative. The EU Calculator has these two concepts at its core:
(1)
it defines calculation sequences based on material, energy and emissions drivers,
(2)
and, then it sets a range of ambition levels on the drivers that are the most important and where the user can define projected levels [44].
These drivers are called levers and they are at the center of the scenario creation logic [44].

1.7. Balancing and Storage in the Context of the European Calculator Concept

The sustainability of the world’s energy supply is strongly dependent on successful VRE integration. The need for energy storage technologies in the electricity networks is becoming increasingly important as more generating capacity uses VRE sources. The EUCalc model consists of several modules. The energy storage requirement module investigates how new technologies can help the electricity system of the EU to operate stably in light of increasing renewables penetration, demand-side measures and decarbonization paths. The calculation is based on a bottom-up approach to compute electricity production and GHG emissions by using historical data and trajectories until 2050 [24,45]. There are various definitions of balancing depending on the level of complexity and target audience, which is also reflected in various EU policy documents defining the act of balancing. According to the Commission Regulation (EU) 2017/2195 [46], balancing means “all actions and processes, on all timelines, through which TSOs ensure, in a continuous way, the maintenance of system frequency within a predefined stability range”. From this definition it emerges that from one point of view balancing is strictly focused on maintaining the frequency of the electricity system, which has to be maintained at 50 Hz Europe-wide in order to maintain the stability of the grid. A European Commission working document that accompanied the Winter Energy Package also adopts a similarly narrow definition of balancing “the situation after markets have closed in which a TSO acts to ensure that demand is equal to supply, in and near real time” [47]. This definition highlights that although securing the required balancing capacities is based on market-based auctions and therefore actors are selected competitively, however, the act of balancing itself is the sole responsibility of the TSOs, ordering the required capacities to be dispatched on demand. The common part of these definitions is that the TSO is responsible for balancing, therefore balancing activities are aggregated at the TSO level, which also resembles the national level in Europe, with a few exceptions. The fact that demand and supply should be equal “in and near real time” highlights that this definition focuses also mostly on frequency control, thereby guaranteeing the stability of the system. From the reviewed definitions it is also clear that balancing, at whichever time scale, will always have to focus on frequency control, the matching of supply and demand. This is because if demand is systematically higher than the supply that is delivered by machines driving the generators, then the rotational speed of the generators themselves will drop, which will lower the frequency. In the absence of intervention, this process would be self-generating and ultimately resulting in blackouts within seconds. Balancing mechanisms are required therefore, as the electricity system itself is unable to store electricity, thereby requiring instant intervention possibilities to maintain grid frequency. This instant intervention possibility can be delivered by different technologies at different time scales. In the context of growing renewable energies with seasonally diverging outputs though, the importance of electricity storage will grow, in order to deliver the required power at the right time to sustain supply and demand matching, thereby keeping the frequency within the predefined band requirement. Table 1 details the European categorization of balancing activities including four categories also with reference to time considerations [46,47,48].
Of these three categories, the first two concern the containment and upholding of the frequency of the grid by running generators, thereby requiring almost instant reactions and intervention by power plants that are either dedicated to do this or have reserve rolling capacities set aside. It is interesting that replacement reserves themselves are defined as a means that are capable of “restoring or supporting the required level of frequency restoration reserves to be prepared for additional system imbalances, including generation reserves” [49], but this category of balancing functions as replacement in the case of unavailability of other supply sources, with generators that are not already running as highlighted by the activation time as well.

2. Material and Methods

The objective of this study was to introduce the concept of the storage module and to determine the module input data of trading zones, the energy storage capacities, the theoretical maximum gross electricity generation potential of VRE compared to the 2040 demand and the maximum energy storage potentials during one year in the EU plus CH.

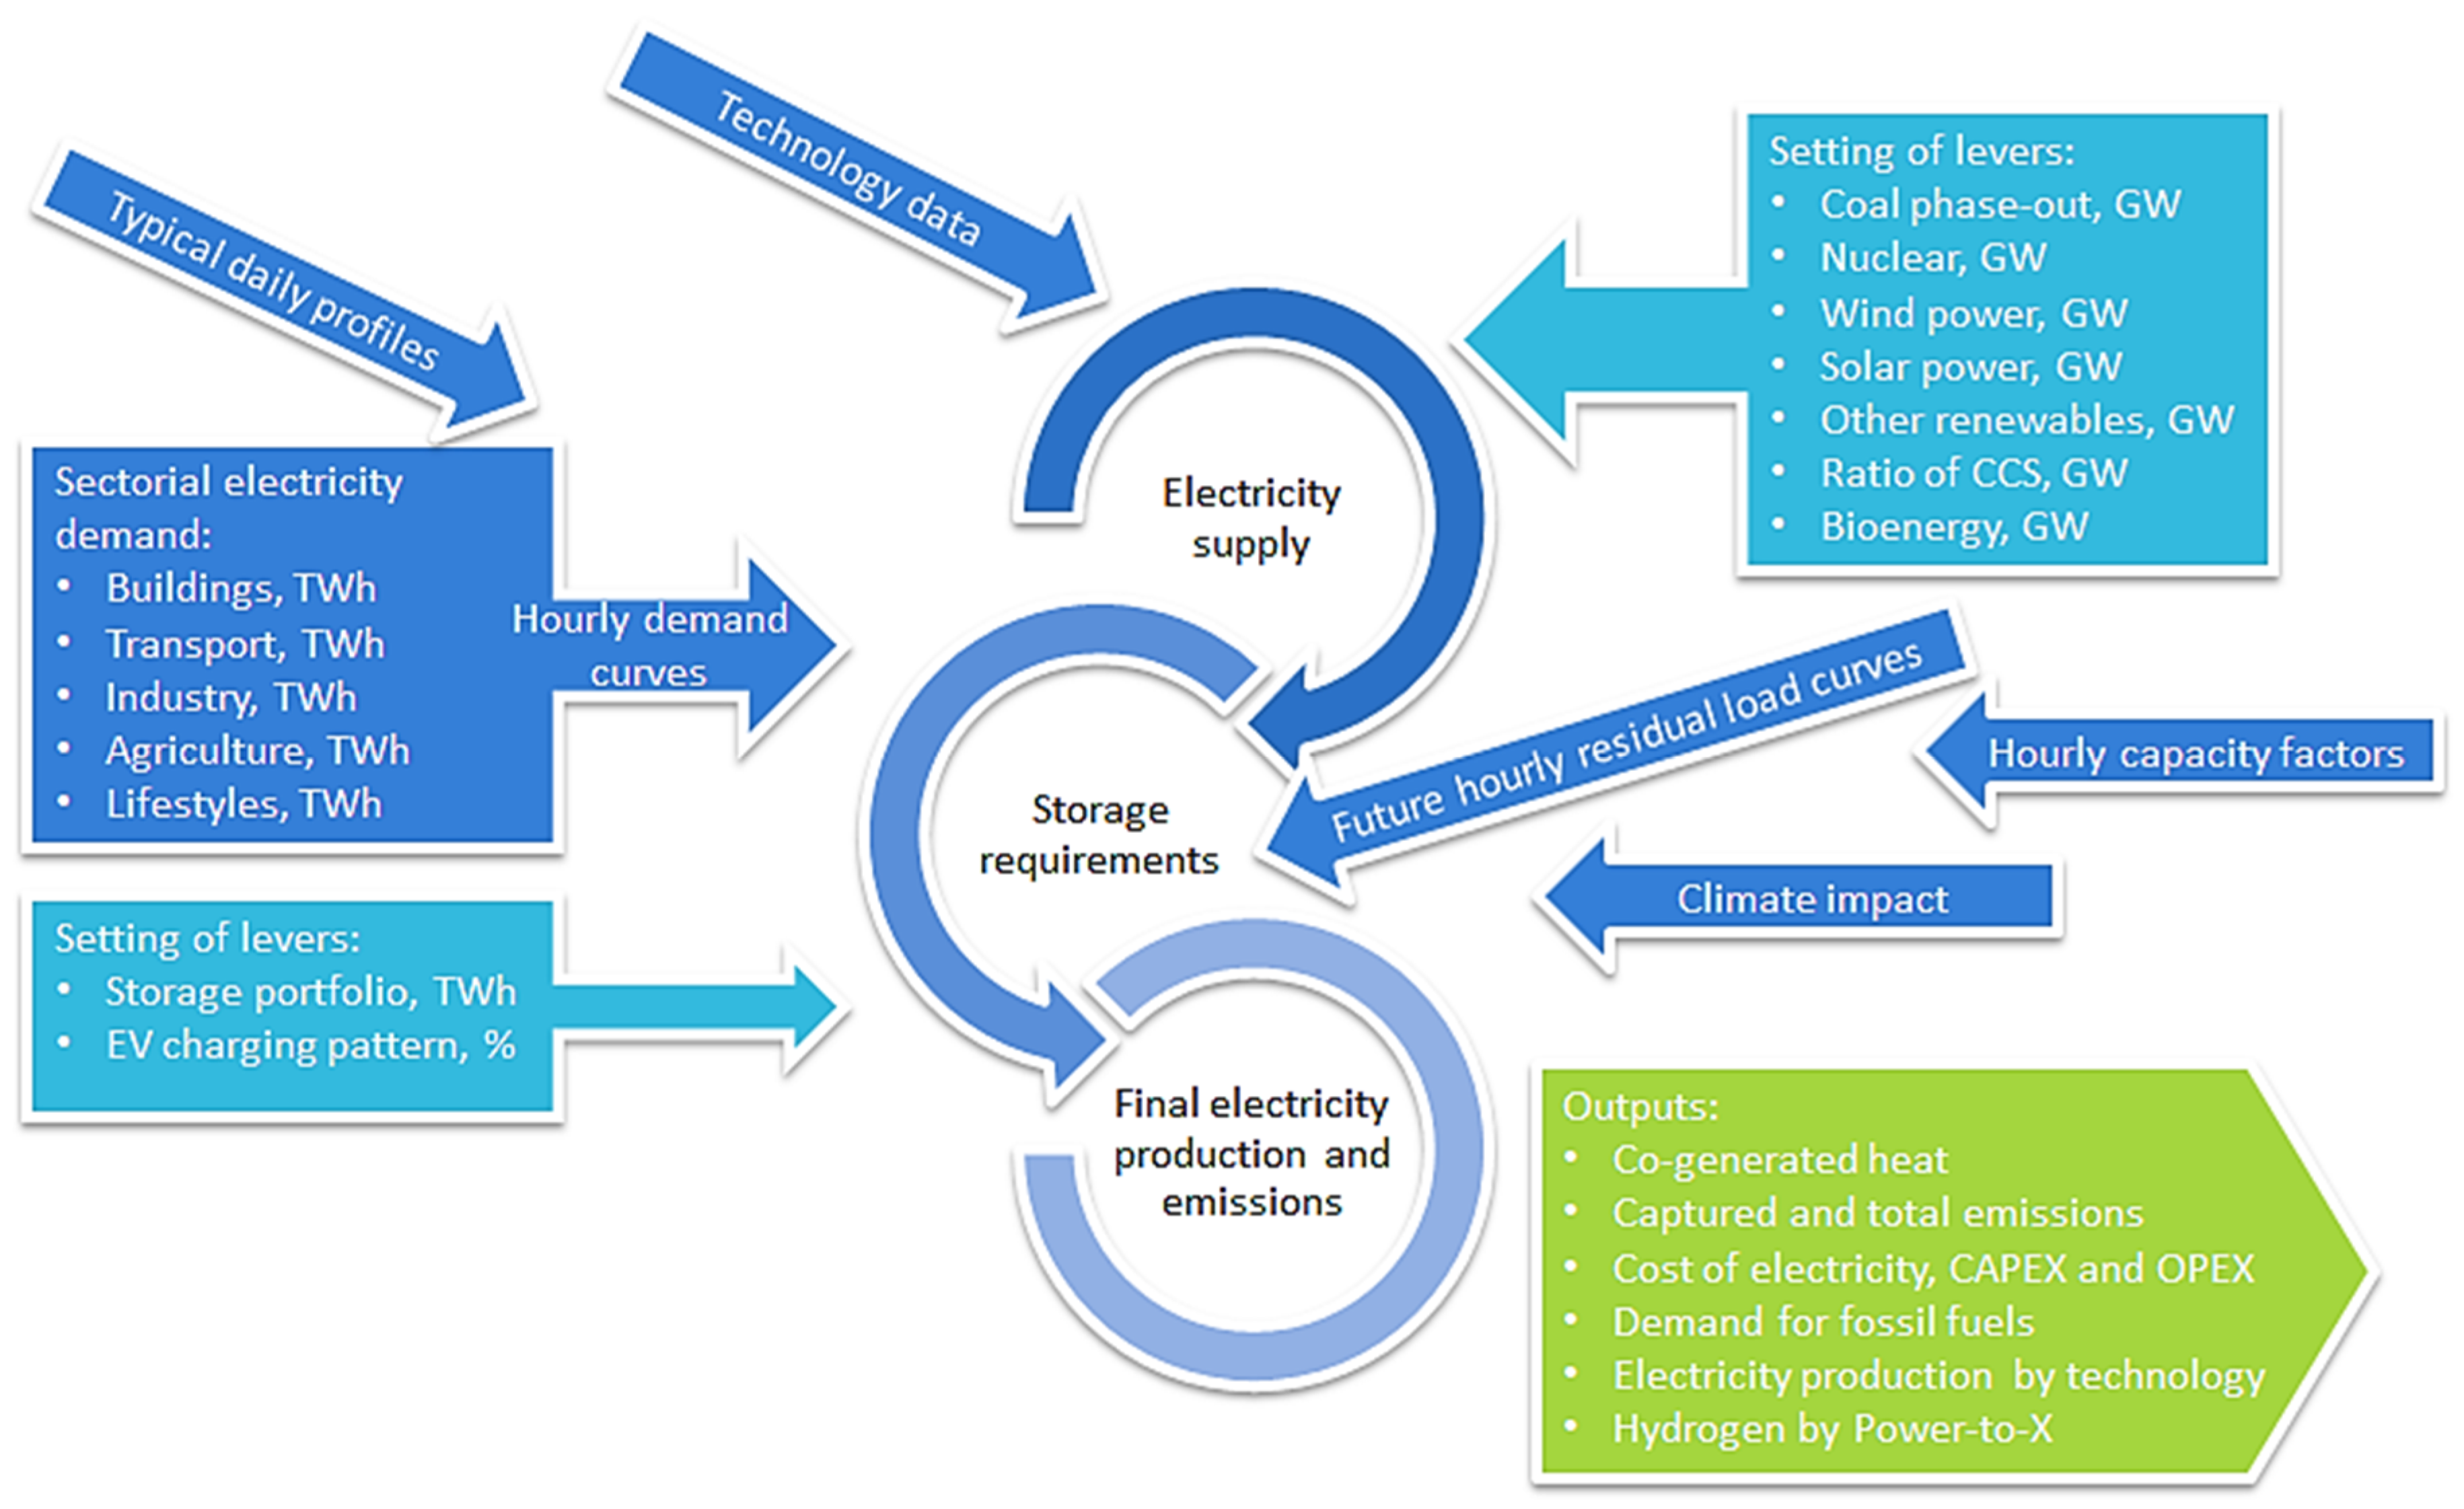
2.1. EUCalc Modeling Approach

In summary, EUCalc is a simulation model, driven by people activities in a given context and reflects the impact of using technologies to perform the activities on energy, emissions, socioeconomic impacts, and environment and resources. It also assesses links to the economy, to policies, and to transboundary flows [44].
The EUCalc model’s origin is the Department of Energy and Climate Change (DECC) 2050 calculators [44,50]. These excel and web-based simulation models provided great value by being synthetic, transparent, and user friendly. These models are typically used as eye-openers, especially in the first phase of the analysis to get a grasp of the impact of the various levers. They are typically complemented by:
  • Optimization models such as the integrated MARKAL-EFOM system (TIMES) [51], the price-induced market equilibrium system (PRIMES) [52], and the Global Trade Analysis Project (GTAP) [53] are meant to answer questions such as: “what is the cheapest way of?”, “in which order should I perform this?”;
  • Sector specific models on each of the issues addressed are made to better operationalize the pathway recommendations in the sector; for example, in “buildings”, or “air quality” [44,54,55].
Through EUCalc, more sectors, more interlinkages and a more in-depth modeling of each specific issue were added. A combination of all the lever choices creates a scenario. The model outputs for a given input scenario are named pathways, because the focus is on the final impact and overall evolution trend. For each pathway the calculator displays the implications over time (for example in terms of energy, emissions, resource use, job creation, and land-use) [44].

2.2. Overview of the EU Calculator’s Electricity Module

The module calculates electricity production and its related CO2 emissions based on levers that define the installed capacity of power generation, according to different technologies. Considering the intermittency of renewables, as well as the variations in electricity demand, further storage technologies or natural gas-based capacities are added to the electricity generation mix. With this concept, the module simulates the impact of different scales of penetration of renewable-based technologies, phase-out schedule of coal power plants and the different shares of nuclear energy. All of them influence the long-term, economy-wide GHG reduction objective, which is to achieve a fully decarbonized power generation sector in Europe. Figure 8 illustrates some of the main variables associated with the EUCalc power sector module.
A major change has been going on in the power generation sector of the EU with a significant increase of renewables technologies and an accelerating decrease of burning fossil fuels of late. Currently, the main source of GHG emissions, accounting for 51% at EU level [56], is the coal-based power plants, thus phasing them out and replacing them by renewables or even natural gas can lead to significant carbon mitigation pathways.
The recently growing share of renewables has been led by policy incentives and the decreasing costs and economic maturity of renewable technologies, whereas fossil fuel-based power capacities have been reducing due to the ageing of the power plant stock and phase-out policies. These trends are expected to continue in the future as renewables become more competitive [57], while coal power plants get more obsolete [58]. In general, all fossil fuel-based power generation capacities in Europe are ageing, representing an opportunity for renewables to take their place [10]. Natural gas-based power generation may play a role in balancing the growing intermittency coming from a large share of wind and solar power in the energy mix due to its flexibility (dispatchability) [11]. However, battery storage and other forms of flexibility solutions, such as the combination of different renewable technologies and smart grids, increasingly provide auxiliary services and the ability to reduce the peak load of electricity with a chance to even rely less on natural gas as a single source for balancing.

2.3. The Calculation Logic and the Scope of the Storage Module

The objective of the storage module is to match supply and demand and account for the flexibility needs of the system resulting from the increased share of VRE. This module functions in close connection with the supply module and the ones defining the demand; thus, the calculation is based on inputs gathered from those modules. The user has the option to influence the volume of storage capacities via the levers of the module. The additional value of the storage module compared to the electricity supply—and demand—side modules is that this one works with an hourly resolution for a single year adding up the yearly resolution of the input modules. The module does this by applying increased granularity through the downscaling of the annual electricity demand to load curves with hourly resolution and applying hourly capacity factors for PV and wind power generation on the supply side. Considering the aims of EUCalc, the module complements the outputs of the supply module with the below listed characteristics:
  • The module calculates the annual electricity supply-demand gap on the trading zone level, considering the EU net electricity import and the balancing possibilities of electricity trade within EU. The annual deficit/excess is handled by capacity changes of fossil fuel power and power-to-X (PtX) generation.
  • The module predicts renewable power generation from variable sources (PV and wind), for each country at an hourly level.
  • The module breaks down the annual demand of each country into load curves with hourly granularity for each country.
  • The module includes trade flows of electricity between groups of countries with high level interconnections (trading zones), thus correcting the supply-demand match with trade, resulting in trading zone level residual load curves.
  • The module calculates flexibility needs on three timescales (weekly, daily, and sub-daily), based on the trade zone level residual load curves
  • The module integrates specific storage technologies into the calculation to match flexibility needs on three timescales of balancing.
  • The module calculates the capacity, yearly production and direct CO2 emission of the additional, flexible power generation that are needed to balance electricity demand with supply at the country level.
The module, however, does not consider indirect emissions as they are addressed by other EUCalc modules (e.g., the manufacturing module assesses the emissions related to the manufacturing of the power plants). The storage module considered cross-border electricity trade and demand side management as additional sources of flexibility for the power systems under consideration in the calculator.

2.4. The Link between Balancing and Storage in the EUCalc Modeling Concept

In the energy sector models are important tools to generate a range of insight and analyses on the supply and demand of energy. A new modeling concept is the European Calculator, with the goal to delineate emission and sustainable transformation pathways at a European and member state scale. The model consists of several modules. In the EUCalc modeling concept the energy storage module is working with an hourly granularity, thus it is unable to capture short-term balancing needs. It is therefore solely focusing on long-term balancing activities on country and EU levels. This approach is justified by Brown et al. (2018) [59] stating that at large spatial scales the variations in aggregated load, wind, and solar time series are statistically smoothed out, none of the large-scale model results change significantly when going from hourly resolution down to 5-min simulations [59].
Describing a year by hourly data, i.e., 8760 values, also includes the variations in lower time granularity, thus the curves obtained by 8760 data points show also weekly and seasonal patterns, thus weekly and seasonal patterns of supply and demand are captured in the modeling. On the other hand, another EUCalc module (supply module) uses capacity factors to calculate the annual production of power plants. The historical capacity factors inform us about the generation observed over time compared to the maximal generation through a period including all the time the unit was running. Therefore, capacity factors include also the generation that was provided for flexibility purposes. For example, when observing historical capacity factors of natural gas power plants in a country, the capacity factor of the gas power plants already includes the times when the power plants were used for balancing purposes and not for general power production. Typically, though, balancing power plants have relatively low annual utilization rates, rarely exceeding 1% of the time of the year (see MAVIR and MEKH, 2017 for example, in the case of Hungary [60]). Therefore, the capacity factors of power plants used in the supply module already encompass the kind of short-term balancing that was needed before.
The storage module considers storage as an operational tool of the electricity system that can help to achieve electricity balancing with the ability of shifting the (over)supply of electricity to a later time point, when demand exceeds supply and the stored electricity will be needed in order to maintain frequency and sustain the stability of the system. Storage can be realized on different time scales by different technologies. Therefore, in the context of the module, storage and balancing can be interchangeable terms, as storage is a technical toolset within balancing.
It is important to mention that electricity storage technologies can fulfill various functions. Based on the International Renewable Energy Agency (IRENA), the categorization of the services in Figure 9, due to the characteristics of EUCalc and the assumptions of the supply module, this module focuses on the bulk of energy services that are needed for a well operating electricity system. In Figure 9, the pink fields are the services directly supporting the integration of VRE, which is the key component of the decarbonization process, whose impact EUCalc is actually investigating. On the other hand, as the module works in close relation with modules defining the electricity demand, the pink fields under other services on the right-hand side of the model are considered with interaction from there. For example, the transport sector is considered in the form of input received from the transport module about the demand response potential of the batteries used in transportation. Exceptions are off-grid energy storage applications, as the main aim of the module along with the supply module, is to model the grid in view of increasing renewable energy penetration and how different storage technology can influence it.
In general, blue fields are outside of the scope of current modeling. For the ancillary services of storage, the module functions do not take into consideration electricity system specifics, such as the voltage or frequency level, which indeed can be influenced by various factors, such as temperature itself. Transmission infrastructure services cannot be evaluated in the module either, as the whole of EUCalc is based on countries, thereby unable to differentiate between different transmission characteristics within a country. The same kind of reasoning can also be applied to the distribution infrastructure services.
The lever works at the EU 28 plus the CH level and disaggregation to the Member State level is applied directly in the calculation. With this lever, the user can influence the technology portfolio delivering (at least partially) the flexibility needs (Table 2).
The levers describe scenarios for the further development of the storage technologies depending on which technology gets more focus, as explained in Table 3.

2.5. Determining the Energy Storage Capacity and the Maximum Energy Storage Potential during One Year of Stationary Storage Technologies

This section elaborates the annual storage capacities that a technology may be able to offer in the different lever settings. The module focuses on the annual storage capacities (expressed in TWh) of the storage technologies due to the calculation logic as opposed to the rated power (expressed in GW). In this step we described how the EU 28 plus Switzerland level trajectories were obtained, after which the disaggregation was elaborated at the trading zone and country level. Data from 2015 for installed PHS units were extracted from the Integrated Database of the European Energy Sector (JRC IDEES) database [61], which was used as a starting point. The reported energy storage capacities express the electricity production capacity of the water turbine (i.e., installed generation capacity). As reported by Gimeno-Gutierrez and Lacal-Arántegui (2015) [62], there are no official figures in Europe for the energy storage capacity of PHS units. The only source, is a 2011 survey by Eurelectric (2011) [63], which includes the energy storage capacity of PHS for certain countries in Europe, the results of which are shown in Figure 10.
Generation capacities for 2011 were also taken from the JRC IDEES database [61] in order to calculate the 2011 country specific ratio of the generation and storage capacities. These ratios were used to deliver the 2015 storage capacities in TWh. In the case of countries that have PHS units but the survey did not provide storage capacity values, the ratio of a similar country was used: for Italy the ratio of France, and for Romania, for Croatia, for Slovenia, and for Sweden the ratio of Ireland.
In the case of the least ambitious trajectory for PHS, we only assumed additional PHS capacities that are part of the European Network of Transmission System Operators (Entso-E) Ten Years Network Development Plan 2018 Storage project [64] database, see Table 4. These capacities will start operation according to the schedule shown below. In the case of the most ambitious trajectory for PHS in 2050, the full exploitation of PHS potential is considered as defined by Gimeno-Gutierrez and Lacal-Arántegui (2015) [62]. The round-trip efficiency was taken into account by 80%.
For non-PHS storage technologies, there are no projections at the country level or European level for the installed capacities of these other storage technologies, therefore we disaggregated the scenarios from IRENA (2017) [42] to obtain storage capacity values. In order to estimate electricity storage volumes for electro-chemical batteries, Figure 6 and Figure 7 were used. From the scenarios presented in the source, the lowest, 100 GWh and the highest ambition, 421 GWh, global battery storage power outputs were considered. Of this new global electro-chemical energy storage power 35% was estimated to be realized in the EU-28 plus Switzerland [65]. It is important to note that there are not any suitable scenarios for battery storage after 2030. First, linear interpolation was used for calculating 2025 values from the 2030 values (in order to match the 5-year EUCalc resolution). After 2030, the excel forecast function (least square method) was used to determine the values for 2035–2050. For each analyzed year, the entire previous period was considered. This means that for instance in the case of 2035, the 2020–2030 period was considered, while for 2040 the period 2020–2035 was considered. It is also important to mention that the module considers that battery storages can be installed in any country; the technology does not have any geographical of topographical constraints. For the 2015 values of the power output of electro-mechanical storage technologies, the Global Energy Storage Database (DOE) [65] was used. For the future values of these technologies, the IRENA (2017) [42] study was used, in which projections for many technology-specific storage scenarios are described until 2030. For electro-mechanical storage Figure 6 and Figure 7 were used. From the scenarios the 20 GWh, the lowest, and the highest ambition, 84 GWh, global electro-mechanical storage energy capacity were estimated. 30% of this new, global electro-mechanical energy storage power was estimated for EU plus CH. Furthermore, based on IRENA and DOE data [42,65], a share of 63% flywheel and 37% compressed air energy storage (CAES) has been assumed for electromechanical storage technologies. For power-to-X, the EU Reference Scenario 2016 [17] and the ‘Technical report on Member State results of the EUCO policy scenarios [66]’ sources were used to create Level 1 and Level 4 trajectories, between which linear interpolation was applied. The module assumes that electrolyzers work with 80% efficiency, which is the higher range of the currently most viable alkaline electrolyzers and polymer electrolyte electrolyzers [67].
Chapter 3.3 shows the theoretical maximum energy storage capacity of CAES and flywheels in the respective years for the least and most ambitious trajectories at the EU-28 plus the CH level. Intermediate ambition levels that have been calculated with linear interpolation are not shown in Chapter 3.3 below. For example, the maximum possible volume to be withdrawn is limited by the 24-h discharge time of the PtX units, therefore it takes 48 h to completely charge and discharge these units. This logic was the same for all the other storage technologies. The following cycle times (charge + discharge periods) were taken into account [64,68,69] in the calculations:
  • electro-chemical, battery, stationary, 6 h;
  • electro-mechanical, compressed air, 12 h;
  • electro-mechanical, flywheel, 0.5 h;
  • power-to-gas-to-power, 48 h.

2.6. Electricity Trade within the EU

In the model the exporting regions export electricity to their neighboring trading zones. The model is based on the network flow theory [70]. The exporter and importer trading zones are considered as nodes of a digraph with their demands (a negative demand means excess of electricity), while the transmission connections are the edges with their capacity constraints. A virtual importer and exporter are added to the flow to fulfill all demands. A weight attribute is also involved into the calculations, which is a proper tool to minimize the virtual member’s trade and to mimic real market processes by considering the demand/supply gap. In order to include the existing plans for the expansion and intensification of cross-border electricity trade, the Regional Investment Plans [71,72,73,74,75,76] for the regions were used. These investment plans detail near-term expansion projects that are already included in the Ten-Year Network Development plans, however, also taking into account longer-term investments up to 2040. The Regional Investment Plans give a summary of cross-border net transfer capacities in relation to every country within a region, from which it was easy to conclude the cross-border net transfer capacity (NTC) values for the regional aggregation of the module. Although the Regional Investment Plans only list projects that are planned until 2040, the module argues that it is a good approximation to consider 2040 values as 2050 values in the module, as transmission network developments are increasingly contested investments and therefore are difficult to execute, and they are likely to be subject to delays.

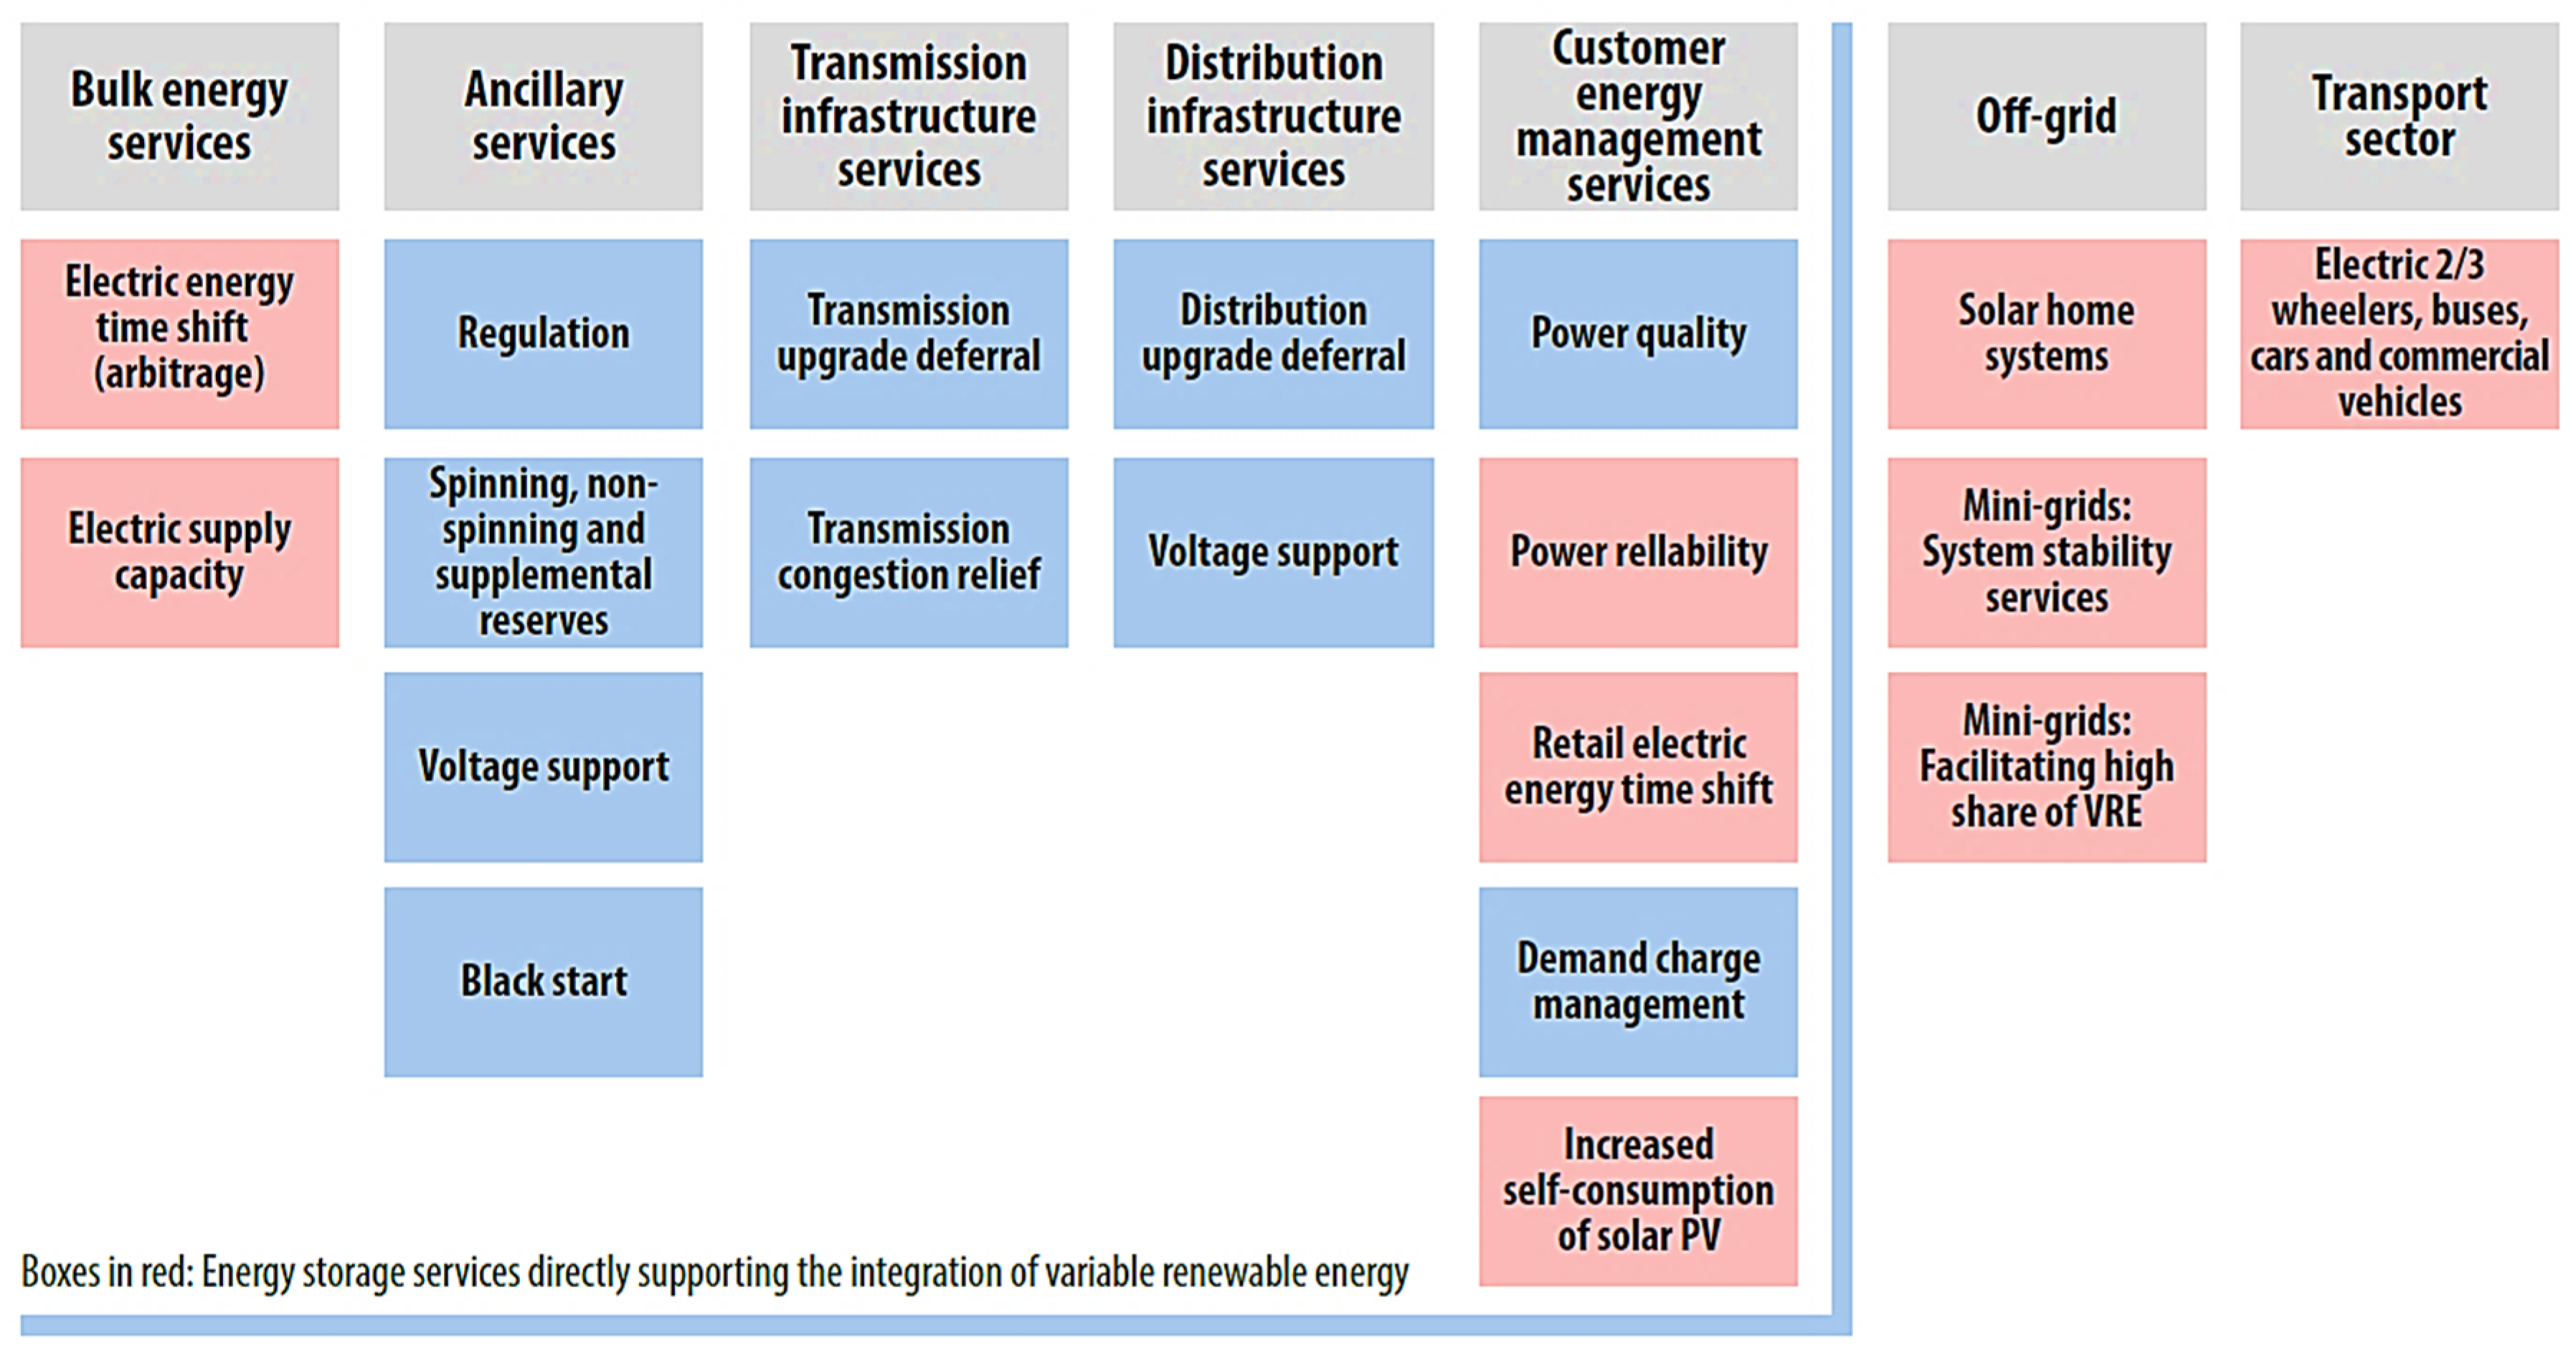
2.7. Variable Renewable Energy Integration Challenges

Zsiborács et al. [24] developed a polynomial regression model and validation method to determine the European (36 Entso-E countries) energy storage demand based on 79 sources (Table 5). The study examined the European VRE integration challenges related to the power capacity and energy capacity of stationary storage technologies. It also analyzed and presented the feasibility of the European VRE electricity generation targets and the theoretical maximum related to the European Network of Transmission System Operators’ (Entso-E) Sustainable Transition (ST), Distributed Generation (DG), and Global Climate Action (GCA) 2040 scenarios. With the created solution, it is possible to determine the average energy storage fraction requirements expressed in energy storage capacity (TWh). This refers to the amount of energy that can be stored at the same time and not the energy delivered throughout a year. The model calculates the average energy storage fraction in the context of VRE gross electricity generation, expressed as a percentage of the total electricity demand [24].
In this manuscript the above-mentioned model solution was used to analyze the 2040 EUCalc ‘storage capacity per cycle’ levels. The 2040 electricity demand of the EU plus CH was estimated from the average of the Entso-E’s DG, GCA, and SC country-specific scenarios. Applying the energy storage capacity logical context of the [24] manuscript (Table 5), the results of the ‘storage capacity per cycle’ potential levels (chapter 3.3) and the EU plus CH’s 2040 average electricity demand [23] can determine the theoretical maximum VRE gross electricity generation potential compared to the demand.

3. Results and Discussion

3.1. The Logic of the Calculation of the Storage Module

Generating the hourly level information in three parallel steps at the country level then aggregated to trading zone level (Figure 11):
  • Step 0: the module matches annual electricity demand with supply, and in case of excess in a trading zone accounts for electricity trade.
  • Step 1: the module determines hourly load curves for electricity demand based on load profiles and inputs from electricity consuming sectors.
  • Step 2: the module creates the hourly granularity residual supply curves based on hourly capacity factors for PV, on- and off-shore wind power.
Securing the flexibility needs for the system on the trading zone level:
  • Step 3: the module calculates the residual load curve from the hourly granularity values and generates flexibility needs on three different timescales.
  • Step 4: the module assigns different technologies to the different flexibility needs. Disaggregating parameters to country level and adjusting flows between modules:
  • Step 5: the module calculates disaggregates the physical storage and generation capacities to individual countries.
  • Step 6: the calculation may adjust the primary electricity production due to the adjustment of capacity factors at the hourly level, this module will finalize the values of the flows from the supply module and forward the final data to the Transition Pathway Explorer—these changes are associated with the changes in the capacity factor values influencing not only the produced electricity but the necessary power capacity investments, the used fuel input and produced emissions.
  • Step 7: the module determines the cost of electricity production.

3.2. The Development of Cross-Border Capacities within the EU

The interconnection capacities for the 2015 base year were collected from ACER’s 2016 publication [77], reflecting the aggregated NTC between regions as of 2015 shown in Figure 12. Net transfer capacities are defined as the difference between the total transferable capacities and the transmission reliability margin, thereby truly capturing the usable capacity of a transmission line.
For the cross-border capacities development, the Global Climate Action scenario of Entso-E [78] was considered, as that is the one where it is envisaged that the EU reaches its 2050 climate goals. Based on this, the module includes the changes of the available transfer capacities between regions from 2015 to 2050 (Figure 12 and Figure 13). Interim values are determined by interpolation, with changes in the capacity occurring in steps of up to 700–1000 MW, which is the average range for transmission network capacity increases. Figure 13 summarizes the expected 2050 state of the European electricity transmission network. Note the large capacity increased along basically all exchange corridors and the new connection from Northern Europe to the British Isles and the connection of Cyprus to South Eastern Europe. Finally, the module considered that cross-border interconnectors had a maximum capacity factor of 85%, which is the value that the most used interconnectors are approaching in Europe. Aligned with the time scale of the whole EUCalc model, for each fifth year the cross-border transmission NTC values were included in the modeling using the above interpolation.

3.3. Storage Technology Ambition Levels

The table below, Table 6, shows the theoretical maximum energy storage capacity (annual electricity storage volumes) of batteries, CAES, flywheels, and PtX in the respective years for the least and most ambitious trajectories at the EU-28 plus CH level. Intermediate ambition levels that were calculated with linear interpolation are not shown in the Table 6 below. Disaggregation of these capacities to trading zone and country levels were carried out as detailed in Step 6 of the calculation process.
Unlike the other technologies, PHS already operates in a large scale, thus we had data to calculate real discharge cycles, which varied significantly over trading zones, as shown in Table 7. These values were based on weighted averages of the existing discharge times of PHS units operating in the countries that make up the regions, hence the widely diverging discharge times. Discharge times for each country were calculated as detailed in Section 2.3. For modeling reasons, the module assumed that discharge times did not change over time.
Table 8 summarizes the figures obtained as described in Section 2.3. Linear interpolation was used for calculating the intermediate ambition level, which is not shown in the Table 8 below.
After combining the trajectories of each technology, the following Table 9 emerges that represents the annual storage volumes of each technology at the EU-28 plus Switzerland level, given the lever setting.
Having determined the overall storage capacities at the EU-28 plus CH level for each respective year, it is then necessary to translate these values to the trading zone and then country-level values, as written at Step 5 of the calculation process. This conversion happens based on Table 8 and the definition of trading zones. As the storage potential of PHS was determined by topographical conditions, the above region-specific disaggregation was necessary. Other, non-PHS technologies, however, are not dependent on topographical conditions and hence were shared between regions depending on the share of VRE generation capacity located in the region, as explained more in detail in Step 6 of the calculation process.

3.4. European Union Plus Switzerland Variable Renewable Energy Integration Limit

Based on the Entso-E’s DG, GCA, and SC country-specific scenarios the average electricity demand of EU plus CH was estimated at 3537 TWh in 2040 (Table 10) [23]. From the electricity demand and the aggregate energy storage capacity of all storage technologies, the VRE penetration limit was calculated by using the equation described in Table 5. Based on the analyzed EUCalc levels, the storage fraction values were between 0.093% and 0.350%, which represents the values of the summarized energy storage capacities of all storage technologies (Table 10). The results showed that achieving a minimum of approximately 55% VRE penetration integration could be a realistic target in the EU plus CH power grid sector until 2040. In addition, for the EUCalc level 4 scenario, the 65.8% VRE penetration rate seemed to be feasible. According to the results, energy storage market regulations and developments that motivate the increased use of energy storage solutions are of great importance for a successful EU wind and PV technology integration.

3.5. Summary and the Importance of Input Data Quality

The European Calculator aims to provide decision makers with a highly accessible, user-friendly, dynamic modeling solution to quantify the sectorial energy demand, greenhouse gas (GHG) trajectories, and social implications of lifestyles and energy technology choices in Europe. It should be noted that for many models (e.g., EUCO scenarios [66] and tyndp 2018-entso-e [79]) the correctness of the input parameters and their results cannot be verified. The European calculator project makes use of several heterogeneous data sources as the bases for its calculations. It is therefore of high importance to ensure the quality of input data, which are the foundation of the model. This allows accurate traceability of all model logic, input data, and approaches. The novel and pragmatic modeling approach is rooted between pure complex energy system and emissions models and integrated impact assessment tools. It introduces an intermediate level of complexity and a multi-sector approach that is based on co-design with scientific and societal actors [44,80].

4. Conclusions

Electricity systems in the future should show either increasing flexibility in order to cope with VRE production on the supply side or shifting patterns of electricity consumption on the demand side. Balancing will thus be an integral part of future electricity systems, and hence it is an important module of EUCalc, complementing the modeling of electricity supply.
Given the current practices of balancing services, one may categorize these into short term (frequency containment reserves, and frequency restoration reserves) and long-term balancing actions (replacement reserves). Given the characteristics of the closely linked supply module, which works with annual capacity factors of various electricity generation technologies, the short-term balancing actions are, on the one hand, already included in the supply module (including their electricity consumption) and, on the other hand, they are influenced by factors that are out of the scope of the entire EUCalc.
As a result, the storage module focuses on long term balancing actions, the issues of replacement reserves that are used at times when the generation capacity is not adequate to meet the demand in the system. These replacement reserves will be increasingly important in the future with the ever-increasing levels of renewable electricity generation, which the module considered as the most important driver for electricity balancing. This balancing, however, can also be referred to as storage, which the module considers as a means to achieve balancing. Further to storage, the module considered cross-border electricity trade and demand-side management as additional sources of flexibility for the power systems under consideration in the calculator. The module outlined four distinct scenarios that enable users to test potential developments in electricity storage technologies. Therefore, with the help of the storage module, electricity demand, and supply, which were treated separately before in the overall logic of the calculator, are now brought into interactions with each other, spelling out the additional effects and requirements for EU-wide energy and climate policies.
The results showed that achieving a minimum of approximately 55% VRE penetration integration could be a realistic target in the EU plus CH power grid sector until 2040.

Author Contributions

Authors of PANNON Pro Innovations Ltd. contributed equally in the analysis of the EUCalc data and the writing of the manuscript. Authors of the University of Pannonia contributed equally in the VRE integration analysis of the data and the revision of the manuscript. All authors have read and agreed to the published version of the manuscript.

Acknowledgments

This project has received funding from the European Union’s Horizon 2020 research and innovation program under grant agreement No. 730459. The publication is supported by the EFOP-3.6.3-VEKOP-16-2017-00008 project. The project is co-financed by the European Union and the European Social Fund.

Conflicts of Interest

The authors declare no conflict of interest.

Abbreviations

The following abbreviations are used in this manuscript:
CAESCompressed air energy storage
CAPEXCapital expenditure
CEGCentralized energy generation
CFCapacity factor
CHSwitzerland
COECost of electricity
DEGDecentralized energy generation
DESSTinEEDemand for Energy Services, Supply, and Transmission in Europe
DOEGlobal Energy Storage Database
DSMDemand-side measures
Entso-EThe European Network of Transmission System Operators for Electricity
EUEuropean Union
EUCalcEuropean Calculator
EVElectric vehicle
GHGGreenhouse gas
GTAPGlobal Trade Analysis Project
JRC IDEESIntegrated Database of the European Energy Sector
NRELNational Renewable Energy Laboratory
OPEXOperating expenses
PHSPumped hydroelectric storage
PVPhotovoltaic
PtXPower-to-X
TSOTransmission system operator
VREVariable renewable energy
WACCweighted average cost of capital

References

  1. Gurung, A.B.; Borsdorf, A.; Füreder, L.; Kienast, F.; Matt, P.; Scheidegger, C.; Schmocker, L.; Zappa, M.; Volkart, K. Rethinking Pumped Storage Hydropower in the European Alps. Mt. Res. Dev. 2016, 36, 222–232. [Google Scholar] [CrossRef] [Green Version]
  2. Coburn, A.; Walsh, E.; Solan, P.J.; McDonnell, K.P. Combining Wind and Pumped Hydro Energy Storage for Renewable Energy Generation in Ireland. J. Wind Energy 2014, 2014, 1–6. [Google Scholar] [CrossRef] [Green Version]
  3. Bertsch, J.; Growitsch, C.; Lorenczik, S.; Nagl, S. Flexibility in Europe’s power sector—An additional requirement or an automatic complement? Energy Econ. 2016, 53, 118–131. [Google Scholar] [CrossRef] [Green Version]
  4. Blanco, H.; Faaij, A. A review at the role of storage in energy systems with a focus on Power to Gas and long-term storage. Renew. Sustain. Energy Rev. 2018, 81, 1049–1086. [Google Scholar] [CrossRef]
  5. Kondziella, H.; Bruckner, T. Flexibility requirements of renewable energy based electricity systems—A review of research results and methodologies. Renew. Sustain. Energy Rev. 2016, 53, 10–22. [Google Scholar] [CrossRef]
  6. Liu, W.H.; Alwi, S.R.W.; Hashim, H.; Muis, Z.A.; Klemeš, J.J.; Rozali, N.E.M.; Lim, J.S.; Ho, W.S. Optimal Design and Sizing of Integrated Centralized and Decentralized Energy Systems. Energy Procedia 2017, 105, 3733–3740. [Google Scholar] [CrossRef]
  7. Kursun, B.; Bakshi, B.R.; Mahata, M.; Martin, J.F. Life cycle and emergy based design of energy systems in developing countries: Centralized and localized options. Ecol. Modell. 2015, 305, 40–53. [Google Scholar] [CrossRef]
  8. Ogunjuyigbe, A.S.O.; Ayodele, T.R.; Akinola, O.O. Impact of distributed generators on the power loss and voltage profile of sub-transmission network. J. Electr. Syst. Inf. Technol. 2016, 3, 94–107. [Google Scholar] [CrossRef] [Green Version]
  9. Agora Energiewende and Sandbag. The European Power Sector in 2017. State of Affairs and Review of Current Developments; Agora Energiewende and Sandbag: London, UK; Berlin, Germany, 2018. [Google Scholar]
  10. Farfan, J.; Breyer, C. Aging of European power plant infrastructure as an opportunity to evolve towards sustainability. Int. J. Hydrogen Energy 2017, 42, 18081–18091. [Google Scholar] [CrossRef]
  11. Mac Kinnon, M.A.; Brouwer, J.; Samuelsen, S. The role of natural gas and its infrastructure in mitigating greenhouse gas emissions, improving regional air quality, and renewable resource integration. Prog. Energy Combust. Sci. 2018, 64, 62–92. [Google Scholar] [CrossRef]
  12. Renewable Energy Policy Network for the 21st Century Renewables 2019 Global Status Report-REN21; REN21: Paris, France, 2019.
  13. SolarPower Europe. Global Market Outlook for Solar Power; SolarPower Europe: Brussels, Belgium, 2019. [Google Scholar]
  14. European Wind Energy Association-EWEA. Wind in Power 2015 European Statistics; European Wind Energy Association-EWEA: Brussels, Belgium, 2016. [Google Scholar]
  15. WindEurope asbl/vzw. Wind in Power 2017-Annual Combined Onshore and Offshore Wind Energy Statistics; WindEurope asbl/vzw: Brussels, Belgium, 2017. [Google Scholar]
  16. Zappa, W.; Junginger, M.; van den Broek, M. Is a 100% renewable European power system feasible by 2050? Appl. Energy 2019, 233, 1027–1050. [Google Scholar] [CrossRef]
  17. European Commission. EU Reference Scenario 2016; European Commission: Brussels, Belgium, 2016.
  18. Hübler, M.; Löschel, A. The EU Decarbonisation Roadmap 2050—What way to walk? Energy Policy 2013, 55, 190–207. [Google Scholar] [CrossRef] [Green Version]
  19. TaiyangNews. Bloomberg Expects 1400 GW PV for Europe by 2050. Available online: http://taiyangnews.info/markets/bloomberg-expects-1400-gw-pv-for-europe-by-2050/ (accessed on 3 January 2020).
  20. ENTSO-E. Europe Power System 2040: Completing the Map and Assessing the Cost of Non-Grid. Available online: https://tyndp.entsoe.eu/tyndp2018/power-system-2040/ (accessed on 12 April 2019).
  21. Delucchi, M.A.; Jacobson, M.Z. Providing all global energy with wind, water, and solar power, Part II: Reliability, system and transmission costs, and policies. Energy Policy 2011, 39, 1170–1190. [Google Scholar] [CrossRef]
  22. Czisch, G. Szenarien zur Zukünftigen Stromversorgung, Kostenoptimierte Variationen zur Versorgung Europas und Seiner Nachbarn Mit Strom Aus Erneuerbaren Energien. Ph.D. Thesis, Universitat Kassel, Kassel, Germany, 2005. [Google Scholar]
  23. ENTSO-E. TYNDP 2018-Scenario Report. Available online: https://tyndp.entsoe.eu/tyndp2018/scenario-report/ (accessed on 12 April 2019).
  24. Zsiborács, H.; Baranyai, N.H.; Vincze, A.; Zentkó, L.; Birkner, Z.; Máté, K.; Pintér, G. Intermittent Renewable Energy Sources: The Role of Energy Storage in the European Power System of 2040. Electronics 2019, 8, 729. [Google Scholar] [CrossRef] [Green Version]
  25. Czisch, G.; Giebel, G. Realisable scenarios for a future electricity supply based 100% on renewable energies. In Proceedings of the Risø International Energy Conference 2007: Energy Solutions for Sustainable Development, Roskilde, Denmark, 22–24 May 2007; Risø National Laboratory: Roskilde, Denmark, 2007. ISBN 9788755036031. [Google Scholar]
  26. Kempton, W.; Pimenta, F.M.; Veron, D.E.; Colle, B.A. Electric power from offshore wind via synoptic-scale interconnection. Proc. Natl. Acad. Sci. USA 2010, 107, 7240–7245. [Google Scholar] [CrossRef] [PubMed] [Green Version]
  27. Schaber, K.; Steinke, F.; Hamacher, T. Transmission grid extensions for the integration of variable renewable energies in Europe: Who benefits where? Energy Policy 2012, 43, 123–135. [Google Scholar] [CrossRef] [Green Version]
  28. Schaber, K.; Steinke, F.; Mühlich, P.; Hamacher, T. Parametric study of variable renewable energy integration in Europe: Advantages and costs of transmission grid extensions. Energy Policy 2012, 42, 498–508. [Google Scholar] [CrossRef] [Green Version]
  29. Widen, J. Correlations Between Large-Scale Solar and Wind Power in a Future Scenario for Sweden. IEEE Trans. Sustain. Energy 2011, 2, 177–184. [Google Scholar] [CrossRef]
  30. Aboumahboub, T.; Schaber, K.; Tzscheutschler, P.; Hamacher, T. Optimal Configuration of a Renewable-based Electricity Supply Sector. Wseas Trans. Power Syst. 2010, 5, 120–129. [Google Scholar]
  31. Yao, R.; Steemers, K. A method of formulating energy load profile for domestic buildings in the UK. Energy Build. 2005, 37, 663–671. [Google Scholar] [CrossRef]
  32. Heide, D.; von Bremen, L.; Greiner, M.; Hoffmann, C.; Speckmann, M.; Bofinger, S. Seasonal optimal mix of wind and solar power in a future, highly renewable Europe. Renew. Energy 2010, 35, 2483–2489. [Google Scholar] [CrossRef]
  33. Heide, D.; Greiner, M.; von Bremen, L.; Hoffmann, C. Reduced storage and balancing needs in a fully renewable European power system with excess wind and solar power generation. Renew. Energy 2011, 36, 2515–2523. [Google Scholar] [CrossRef] [Green Version]
  34. Rasmussen, M.G.; Andresen, G.B.; Greiner, M. Storage and balancing synergies in a fully or highly renewable pan-European power system. Energy Policy 2012, 51, 642–651. [Google Scholar] [CrossRef]
  35. Hedegaard, K.; Meibom, P. Wind power impacts and electricity storage—A time scale perspective. Renew. Energy 2012, 37, 318–324. [Google Scholar] [CrossRef]
  36. International Hydropower Association. Hydropower Status Report 2016; International Hydropower Association: London, UK, 2016. [Google Scholar]
  37. Sandia National Laboratories. DOE Global Energy Storage Database, Office of Electricity Delivery and Energy Reliability. Available online: http://www.energystorageexchange.org/projects (accessed on 6 January 2020).
  38. Zsiborács, H.; Hegedűsné Baranyai, N.; Vincze, A.; Háber, I.; Pintér, G. Economic and Technical Aspects of Flexible Storage Photovoltaic Systems in Europe. Energies 2018, 11, 1445. [Google Scholar] [CrossRef] [Green Version]
  39. Luo, X.; Wang, J.; Dooner, M.; Clarke, J. Overview of current development in electrical energy storage technologies and the application potential in power system operation. Appl. Energy 2015, 137, 511–536. [Google Scholar] [CrossRef] [Green Version]
  40. May, G.J.; Davidson, A.; Monahov, B. Lead batteries for utility energy storage: A review. J. Energy Storage 2018, 15, 145–157. [Google Scholar] [CrossRef]
  41. European Academies Science Advisory Council. Valuing Dedicated Storage in Electricity Grids, EASAC Policy Report 33; European Academies Science Advisory Council: Halle (Saale), Germany, 2017. [Google Scholar]
  42. International Renewable Energy Agency. Electricity Storage and Renewables: Costs and Markets to 2030; International Renewable Energy Agency: Abu Dhabi, UAE, 2017.
  43. Garrett, F.; James, M.; Jesse, M.; Hervé, T. The Economics of Battery Energy Storage-How Multi-Use, Customer-Sited Batteries Deliver the Most Services and Value to Customers and the Grid; Rocky Mountain Institute: Boulder, CO, USA, 2015. [Google Scholar]
  44. Pestiaux, J.; Matton, V.; Cornet, M.; Costa, L.; Hezel, B.; Kelly, G.; Kropp, J.; Rankovic, A.; Taylor, E. Introduction to the EUCalc Model Cross-Sectoral Model Description and Documentation; European Commission: Brussels, Belgium, 2019. [Google Scholar]
  45. Zsiborács, H.; Gyalai-korpos, M.; Hegyfalvi, C.; Zentkó, L.; Pintér, G.; Hegedűsné Baranyai, N. Balancing and storage of electricity in the European Calculator modelling environment: Role of capacity factors. In Proceedings of the International Conference on Renewable Energy 2019, Paris, France, 24–26 April 2019; pp. 1–158. [Google Scholar]
  46. Official Journal of the European Union. Commission Regulation (EU) 2017/2195 of 23 November 2017 Establishing a Guideline on Electricity Balancing. Available online: https://eur-lex.europa.eu/legal-content/GA/TXT/?uri=CELEX:32017R2195 (accessed on 11 March 2019).
  47. European Commission. Commission Staff Working Document Impact Assessment Accompanying the Document Commission Regulation (EU), Establishing a Guideline on Electricity Balancing; European Commission: Brussels, Belgium, 2017. [Google Scholar]
  48. Michal, G. Electricity Balancing-European Union Electricity Market Glossary. Available online: https://www.emissions-euets.com/internal-electricity-market-glossary/593-balancing (accessed on 11 March 2019).
  49. Michal, G. Replacement Reserve (RR)-European Union Electricity Market Glossary. Available online: https://www.emissions-euets.com/internal-electricity-market-glossary/424-frequency-containment-reserves-frequency-restoration-reserves-frr-replacement-reserves-rr (accessed on 11 March 2019).
  50. Department of Energy & Climate Change DECC 2050 Calculator. Available online: http://2050-calculator-tool.decc.gov.uk/#/home (accessed on 6 January 2020).
  51. Energy Technology Systems Analysis Programme (ETSAP) The Integrated MARKAL-EFOM System (TIMES). Available online: https://iea-etsap.org/index.php/etsap-tools/model-generators/times (accessed on 6 January 2020).
  52. National Technical University Of Athens. PRIMES MODEL 2013–2014 Detailed Model Description; National Technical University Of Athens: Athens, Greece, 2014. [Google Scholar]
  53. Purdue University, Department of Agricultural Economics, Center for Global Trade Analysis. Global Trade Analysis Project (GTAP). Available online: https://www.gtap.agecon.purdue.edu/ (accessed on 6 January 2020).
  54. Goy, S.; Tardioli, G.; Uribarri, P.M.A. Lvarez de Building energy demand modeling. In Urban Energy Systems for Low-Carbon Cities; Elsevier: Amsterdam, The Netherlands, 2019; pp. 79–136. [Google Scholar]
  55. Amann, M.; Bertok, I.; Borken-Kleefeld, J.; Cofala, J.; Heyes, C.; Höglund-Isaksson, L.; Klimont, Z.; Nguyen, B.; Posch, M.; Rafaj, P.; et al. Cost-effective control of air quality and greenhouse gases in Europe: Modeling and policy applications. Environ. Model. Softw. 2011, 26, 1489–1501. [Google Scholar] [CrossRef]
  56. European Environment Agency. Annual European Union Greenhouse Gas Inventory 1990–2017 and Inventory Report 2019-Submission under the United Nations Framework Convention on Climate Change and the Kyoto Protocol; European Environment Agency: Copenhagen, Denmark, 2019. [Google Scholar]
  57. European Commission and International Renewable Energy Agency. Renewable Energy Prospects for the European Union; European Commission and International Renewable Energy Agency: Brussels, Belgium; Abu Dhabi, UAE, 2018. [Google Scholar]
  58. Watson, L. Lignite of the Living Dead:Below 2 °C Scenario and Strategyanalysis of EU Coal Power; Carbon Tracker Initiative: London, UK, 2017. [Google Scholar]
  59. Brown, T.W.; Bischof-Niemz, T.; Blok, K.; Breyer, C.; Lund, H.; Mathiesen, B.V. Response to ‘Burden of proof: A comprehensive review of the feasibility of 100% renewable-electricity systems. Renew. Sustain. Energy Rev. 2018, 92, 834–847. [Google Scholar] [CrossRef]
  60. Hungarian Transmission System Operator-MAVIR ZRt. Data of the Hungarian Electricity System, 2017; Hungarian Transmission System Operator-MAVIR ZRt: Budapest, Hungary, 2017. [Google Scholar]
  61. Mantzos, L.; Matei, N.A.; Mulholland, E.; Rózsai, M.; Tamba, M.; Wiesenthal, T. Joint Research Centre Data Catalogue, JRC-IDEES 2015. Available online: http://data.jrc.ec.europa.eu/dataset/jrc-10110-10001 (accessed on 11 March 2019).
  62. Gimeno-Gutiérrez, M.; Lacal-Arántegui, R. Assessment of the European potential for pumped hydropower energy storage based on two existing reservoirs. Renew. Energy 2015, 75, 856–868. [Google Scholar] [CrossRef]
  63. Union of the Electricity Industry—EURELECTRIC. Hydro in Europe: Powering Renewables Full Report; Union of the Electricity Industry—EURELECTRIC: Brussels, Belgium, 2011. [Google Scholar]
  64. ENTSO-E. TYNDP 2018 Storage Project Sheets. Available online: https://tyndp.entsoe.eu/tyndp2018/projects/storage_projects (accessed on 1 May 2019).
  65. Sandia National Laboratories. DOE Global Energy Storage Database. Available online: https://www.energystorageexchange.org/projects/data_visualization (accessed on 2 March 2019).
  66. European Commission. Technical Report on Member State Results of the EUCO Policy Scenarios; European Commission: Brussels, Belgium, 2016. [Google Scholar]
  67. Schmidt, O.; Hawkes, A.; Gambhir, A.; Staffell, I. The Future Cost of Electrical Energy Storage Based on Experience Rates; Tenzing Natural Energy: London, UK, 2017. [Google Scholar]
  68. STORNETIC GmbH. Powerful Storage System for Grid Services; The Energy Storage Company: Jülich, Germany, 2018. [Google Scholar]
  69. ENTSO-E. Maps and Data, TYNDP 2016 Storage Projects. Available online: http://tyndp.entsoe.eu/maps-data/ (accessed on 27 May 2018).
  70. Király, Z.; Kovács, P. Efficient implementations of minimum-cost flow algorithms. arXiv 2012, arXiv:1207.6381v1. [Google Scholar]
  71. ENTSO-E. Regional Investment Plan. 2017-Baltic Sea; ENTSO-E: Brussel, Belgium, 2018. [Google Scholar]
  72. ENTSO-E. Regional Investment Plan. 2017-Continental Central East.; ENTSO-E: Brussel, Belgium, 2018. [Google Scholar]
  73. ENTSO-E. Regional Investment Plan. 2017-Continental Central South.; ENTSO-E: Brussel, Belgium, 2018. [Google Scholar]
  74. ENTSO-E. Regional Investment Plan. 2017-Continental South. East.; ENTSO-E: Brussel, Belgium, 2018. [Google Scholar]
  75. ENTSO-E. Regional Investment Plan. 2017-Continental South. West.; ENTSO-E: Brussel, Belgium, 2018. [Google Scholar]
  76. ENTSO-E. Regional Investment Plan. 2017-North. Sea; ENTSO-E: Brussel, Belgium, 2018. [Google Scholar]
  77. Agency for the Cooperation of Energy Regulators. ACER/CEER-Annual Report on the Results of Monitoring the Internal Electricity Markets in 2015; Agency for the Cooperation of Energy Regulators: Ljubljana, Slovenia; Brussels, Belgium, 2016. [Google Scholar]
  78. Entso-E. Statistics and Data-Electricity in Europe. Available online: https://www.entsoe.eu/publications/statistics-and-data/ (accessed on 11 April 2019).
  79. ENTSO-E. Maps and Data, TYNDP 2018. Available online: http://tyndp.entsoe.eu/tyndp2018/ (accessed on 22 May 2018).
  80. European-Calculator. Research Approach. Available online: http://www.european-calculator.eu/research-approach-wps/ (accessed on 6 January 2020).
Figure 1. Renewables versus coal electricity generation in the European Union (EU) based on [9].
Sustainability 12 00811 g001
Figure 2. Wind, PV, and biomass as the percentage of national electricity production in 22 EU countries in 2017 based on [9].
Sustainability 12 00811 g002
Figure 3. Global operational electricity storage power capacity by technology, mid-2017 based on [42].
Sustainability 12 00811 g003
Figure 4. Global operational electricity storage power capacity by technology without the pumped storage hydropower (PHS), mid-2017 [42].
Sustainability 12 00811 g004
Figure 5. Operational grid-connected electricity storage capacity in the 28 Member States of the EU (EU 28) plus Norway and Switzerland (CH) in 2016 based on [41].
Sustainability 12 00811 g005
Figure 6. Global electricity storage energy capacity growth by source [42].
Sustainability 12 00811 g006
Figure 7. Global electro-chemical electricity storage capacity growth in stationary applications by sector in the case of low and high scenarios, 2017–2030 [42].
Sustainability 12 00811 g007
Figure 8. Illustrative scheme of the main variables associated with the power sector in EUCalc.
Sustainability 12 00811 g008
Figure 9. The range of services that can be provided by electricity storage [42].
Sustainability 12 00811 g009
Figure 10. Total GWh amount of electricity (logarithmic scale) that can currently be stored in one ideal pumping cycle in the European electricity sector in 2011, based on [63].
Sustainability 12 00811 g010
Figure 11. Calculation logic of the storage requirements module.
Sustainability 12 00811 g011
Figure 12. Schematic model of country aggregates in the storage module to allocate exports from an oversupplying region to a region in need of imports in 2015 [71,72,73,74,75,76,77].
Sustainability 12 00811 g012
Figure 13. Schematic model of country aggregates in the storage module to allocate exports from an oversupplying region to a region in need of imports in 2050 [71,72,73,74,75,76,77].
Sustainability 12 00811 g013
Table 1. Types of balancing activities with activation times and relation to the storage sub-module [48].
Balancing ActivityActivation TimeTime Scale in the Storage Sub-Module
Frequency containment reserve<30 sShort-term balancing
Frequency restoration reserve with automatic activation0.5–2 minShort-term balancing
Frequency restoration reserve with manual activation2–15 minShort-term balancing
Replacement reserve>15 minLong-term balancing
Table 2. List of levers for the storage module.
LeverBrief Description
Balancing and storage strategies portfolioNeeded amount of balancing power is shared to the next set of technologies:
  • Pumped hydroelectric storage; electro-chemical, battery, stationary; electro-mechanical, flywheel; electro-mechanical, compressed air storage; power-to-X (PtX).
  • For each technology, the ratios per level are based on analyzing the potential the changes in production, as described in details in the next section.
  • In general, the next factors were considered:
  • Past and current features; future developments; future performance and scale; future importance in other models and policies.
Table 3. Definition of storage portfolio ambition levels.
Level 1Level 2
This scenario considers that electricity storage volumes will grow according to the least ambitious trajectories found in the literature across each technology.This scenario considers that there will be a rapid breakthrough in battery technologies, therefore this technology is growing according to the most ambitious trajectory. As a result, all other technologies will grow at the least ambitious levels (except PtX that follows an intermediate trajectory).
Level 3Level 4
This scenario considers that the currently less attractive technologies of compressed air storage (CAES) and flywheels will gain wide-spread acceptance and hence will grow at their most ambitious trajectories. In this case, however, the growth trajectories of PHS and batteries will have an intermediate growth trajectory between their least and most ambitious trajectories.This scenario considers that all storage technologies grow according to their most ambitious trajectories. This level is considered as transformational and requires some additional breakthrough or efforts such as important cost reduction for some technologies, very fast and extended deployment of infrastructures, major technological advances, strong societal changes, etc.
Table 4. New pumped hydroelectric storage projects in Europe, based on [64].
Entso-E Project NumberCountryNew Energy Storage Capacity (GWh)Commissioning DateCurrent Status
1000Austria1.82022Under consideration
1001Austria1522034In permitting
1026Austria3.52025In permitting
1002Belgium22022Planned but not yet permitting
1003Bulgaria5.22025In permitting
1004Estonia5.452028In permitting
1006Greece3.9742023In permitting
1025Ireland1.82026Under consideration
1030Ireland6.12024Planned but not yet permitting
1009Lithuania8.22024Under consideration
1029Slovenia8.562027In permitting
1011Spain75.112020In permitting
1012Spain3.62023In Permitting
1019Spain34.92027In permitting
1027Spain1.622028In permitting
1014UK302027In Permitting
1015UK6.92025Under consideration
Table 5. Equation of the European storage fraction analysis [24].
DescriptionEquation
Equation (1), storage fraction (%) S t o r a g e f r a c t i o n = p 1 V R E 8 + p 2 V R E 7 + p 3 V R E 6 + p 4 V R E 5
+ p 5 V R E 4 + p 6 V R E 3 + p 7 V R E 2 + p 8 V R E + p 9
pi parameter values p 1 = 3.758 14 ; p 2 = 1.327 11 ; p 3 = 1.818 09 ; p 4 = 1.234 07 ;
p 5 = 4.443 06 ; p 6 = 8.163 05 ; p 7 = 5.844 04 ;
p 8 = 1.646 03 ; p 9 = 3.687 04
Table 6. Other storage technology features based on the ambition levels.
TechnologyRound-Trip Efficiency (%)One Cycle Time (h)Storage Capacity Per Cycle (GWh)Maximum Energy Storage Potential during One Year (TWh)
Least and Most AmbitiousYear 2015Year 2050
Least Ambitious
Year 2050
Most Ambitious
Year 2015Year 2050
Least Ambitious
Year 2050
Most Ambitious
Electro-chemical, battery, stationary8060.281.4361.80.3119528.2
Electro-mechanical, compressed air60120.716.375.00.51254.7
Electro-mechanical, flywheel850.51.227.8128.6214872 253
Power-to-gas-to-power35480.12.310.70.020.41.9
Table 7. Rated power and discharge cycle features for PHS in each trading zone.
RegionCountries IncludedEstimated Discharge Time for 1 Cycle (Hours)Existing Rated Power (GW)
Year 2015Year 2050
Least Ambitious
Year 2050
Most Ambitious
Year 2015Year 2050
Least Ambitious
Year 2050
Most Ambitious
Central Western EuropeFR, NL, BE, LX, DE, AT, CH136.723.433.090.1
Central Eastern EuropePL, CZ, HU, SK, SL, CR15.035.05.111.6152.9
South Eastern EuropeRO, BG, GR18.92.17.4131.1
Apennine PeninsulaIT, MT13.17.77.771.0
Iberian PeninsulaES, PT193.07.78.125.6
British IslesUK, IE9.437.295.4
Northern EuropeDK, SE, FI3.523.51.31.313.7
Baltic countriesEE, LV, LT50.60.81.11.1
CyprusCY040*000.8
Table 8. Pumped hydroelectric storage technology features based on the ambition levels in the EU 28 + CH.
CountryMaximum Energy Storage Potential during One Year (TWh)
Year 2015Year 2050, Least AmbitiousYear 2050, Most Ambitious
Austria22.850.377.6
Belgium5.77.18.5
Bulgaria4.427.2521.2
Croatia1.31.31.3
Cyprus--3.4
Czech Republic5.35.327.0
Denmark---
Estonia-0.60.6
Finland--1.3
France30.730.7197.3
Germany29.842.969.9
Greece3.13.724.5
Hungary--0.4
Ireland1.36.561.8
Italy33.733.7311.1
Latvia---
Lithuania3.54.14.4
Luxembourg5.75.75.7
Malta---
Netherlands---
Poland7.97.952.3
Portugal7.97.924.4
Romania1.81.828.6
Slovakia3.93.938.4
Slovenia0.96.730.3
Spain25.827.687.8
Sweden0.40.431.9
Switzerland7.97.935.4
UK11.825.1356.2
EU 28 + CHsum (TWh)
2153082001
Table 9. Ambition levels of the module, all values are in TWh (level 1 is the current trends, level 2 is the battery breakthrough, level 3 is the breakthrough in alternatives, and level 4 is the strong commitment).
TechnologyAmbition Level *Unit20152020202520302035204020452050
Level 1Electro-chemical, battery, stationaryLeastTWh0.317.234.251.168.085.0101.9118.8
Pumped hydroelectric storageLeastTWh216217232247262278293308
Electro-mechanical, compressed airLeastTWh0.52.13.85.47.08.710.311.9
Electro-mechanical, flywheelLeastTWh2188154221287354420487
Power-to-gas-to-powerLeastTWh0.020.070.10.20.30.30.40.4
TotalTWh237324424525625725826926
Level 2Electro-chemical, battery, stationaryMostTWh0.317144215286364453528
Pumped hydroelectric storageLeastTWh216217232247262278293308
Electro-mechanical, compressed airLeastTWh0.512.13.85.47.08.710.311.9
Electro-mechanical, flywheelLeastTWh2188154221287354420487
Power-to-gas-to-power2TWh0.00.10.30.40.50.70.80.9
TotalTWh237324534689844100511771336
Level 3Electro-chemical, battery, stationaryIntermediateTWh0.31789133177225277324
Pumped hydroelectric storageIntermediateTWh2162173735296868429981155
Electro-mechanical, compressed airMostTWh0.52152330384755
Electro-mechanical, flywheelMostTWh21886269291229155919332253
Power-to-gas-to-power3TWh0.020.20.40.60.81.01.21.4
TotalTWh237457108017032180271232543767
Level 4Electro-chemical, battery, stationaryMostTWh017144215286364453528
Pumped hydroelectric storageMostTWh2162175148121109140717042002
Electro-mechanical, compressed airMostTWh0.52.115.222.629.937.947.054.7
Electro-mechanical, flywheelMostTWh21886269291229155919332253
Power-to-gas-to-powerMostTWh0.00.10.50.81.11.31.71.9
TotalTWh237324129919792656336941394839
* Maximum energy storage potential during one year.
Table 10. Results related to the EU plus CH variable renewable energy integration limit in 2040 [23].
Year2040
Estimated EU + CH Electricity Demand (TWh)3537
Levels1234
Aggregate energy storage capacity of all storage technologies (GWh)33063498717012,375
Theoretical maximum of the annual VRE gross electricity generation compared to the demand (%)54.855.260.965.8
Required storage fraction (%)0.0930.0990.2030.350

