Supporting Electrification Policy in Fragile States: A Conflict-Adjusted Geospatial Least Cost Approach for Afghanistan

 ,
, 
Abstract
1. Introduction
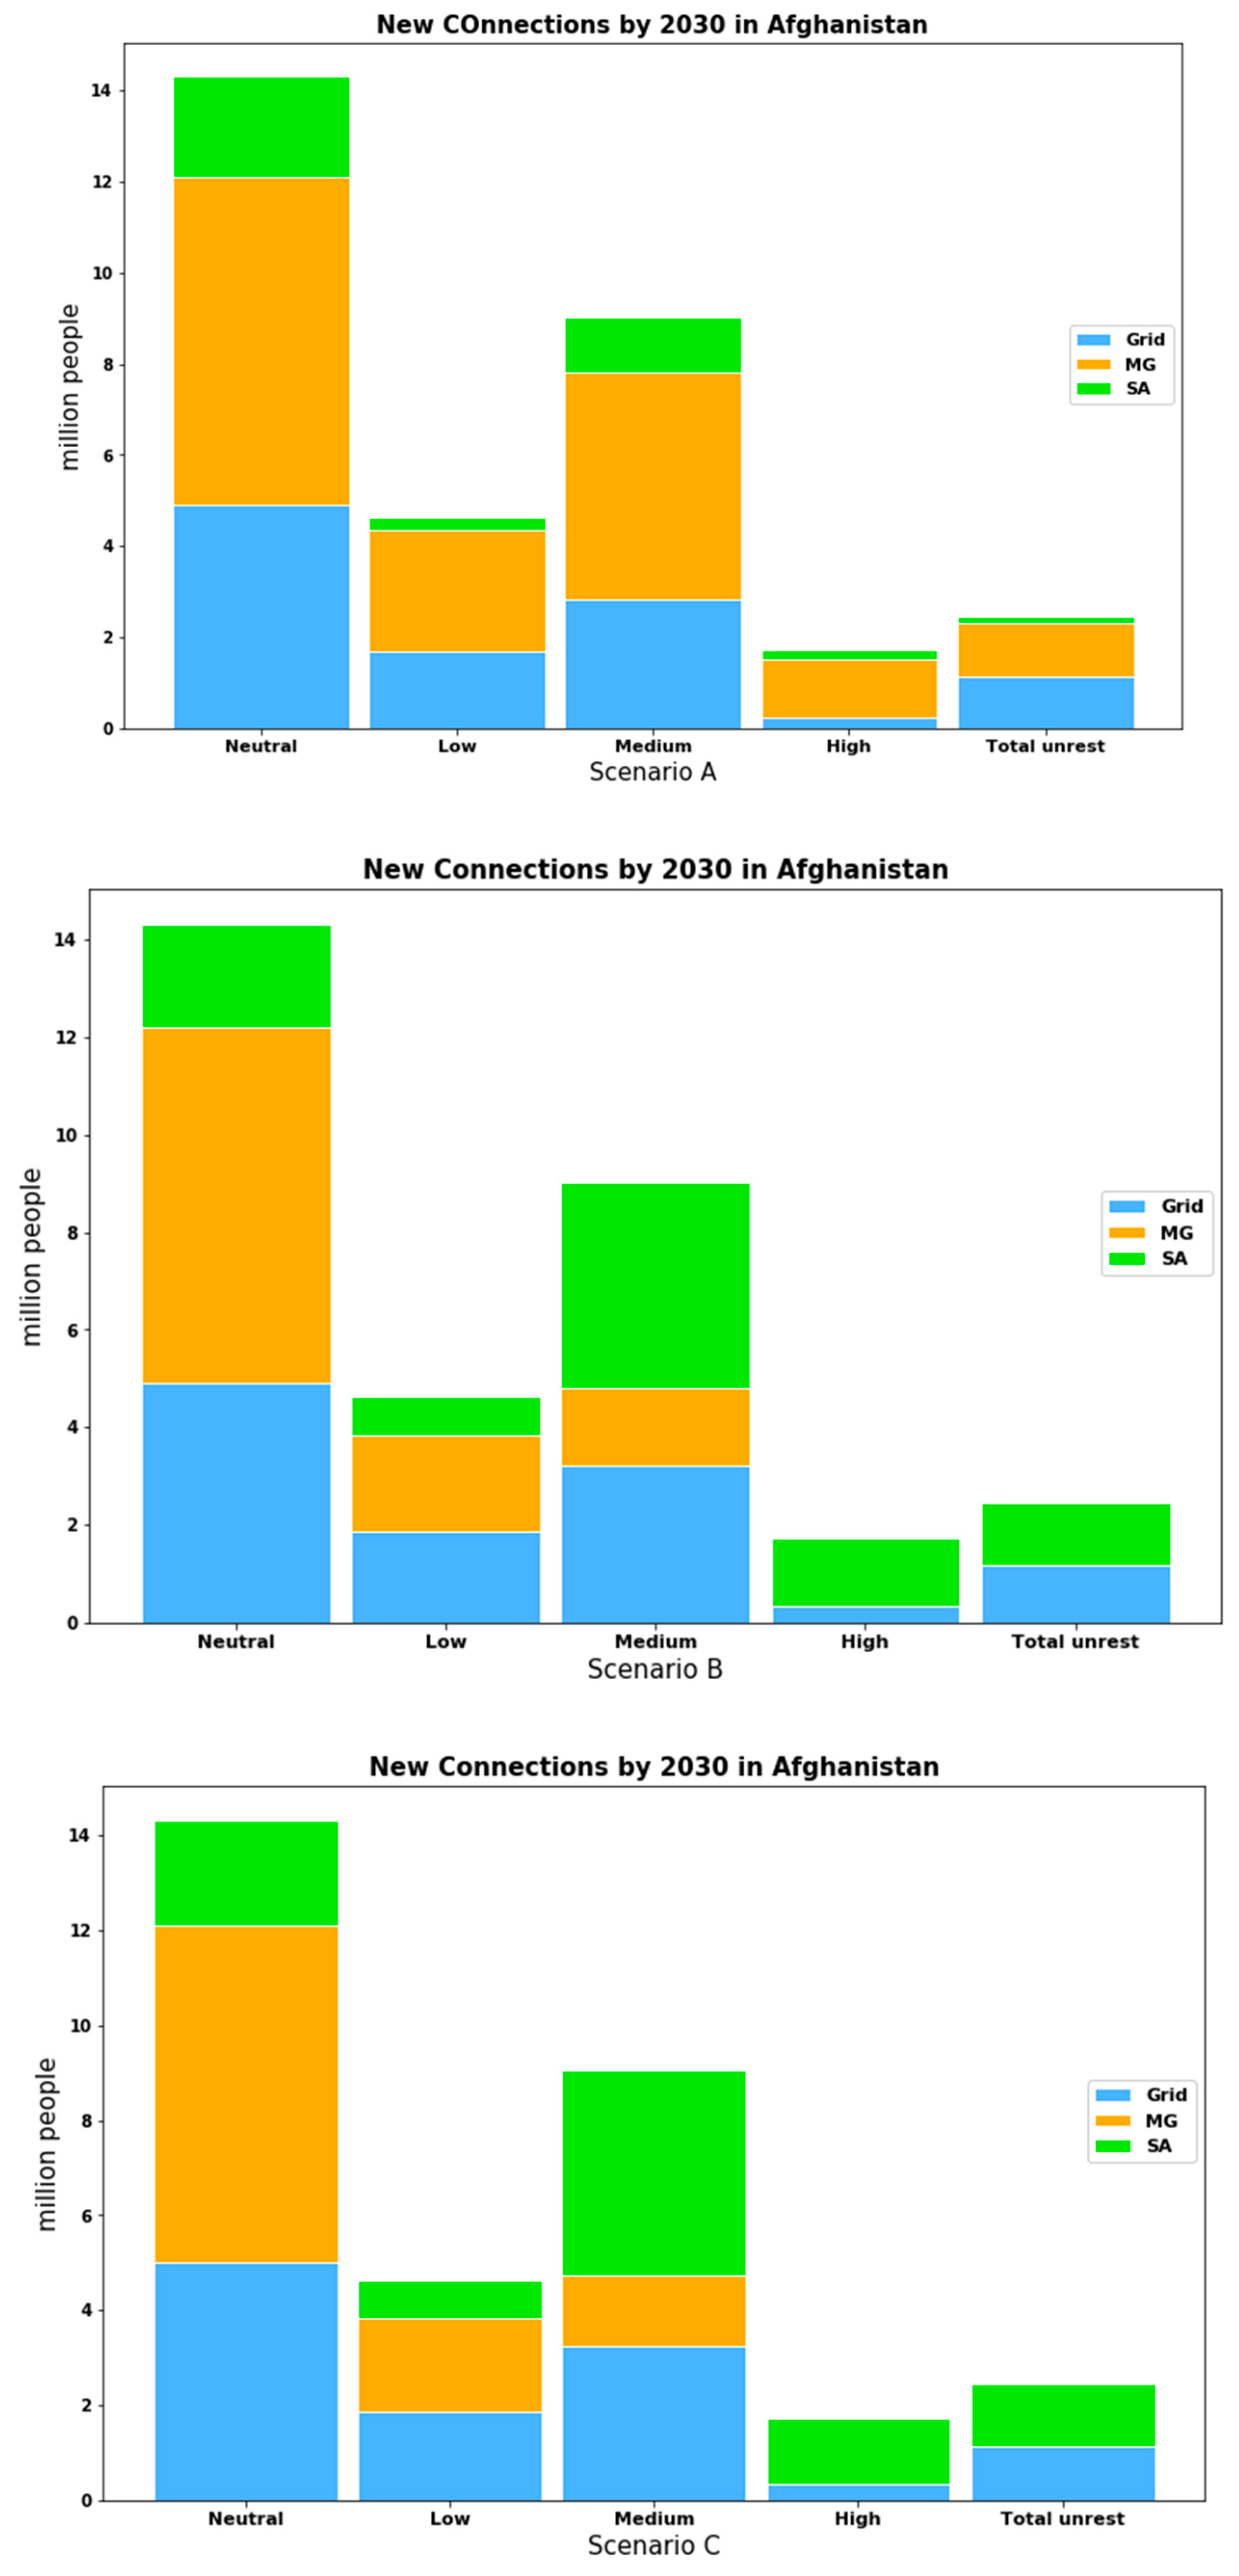
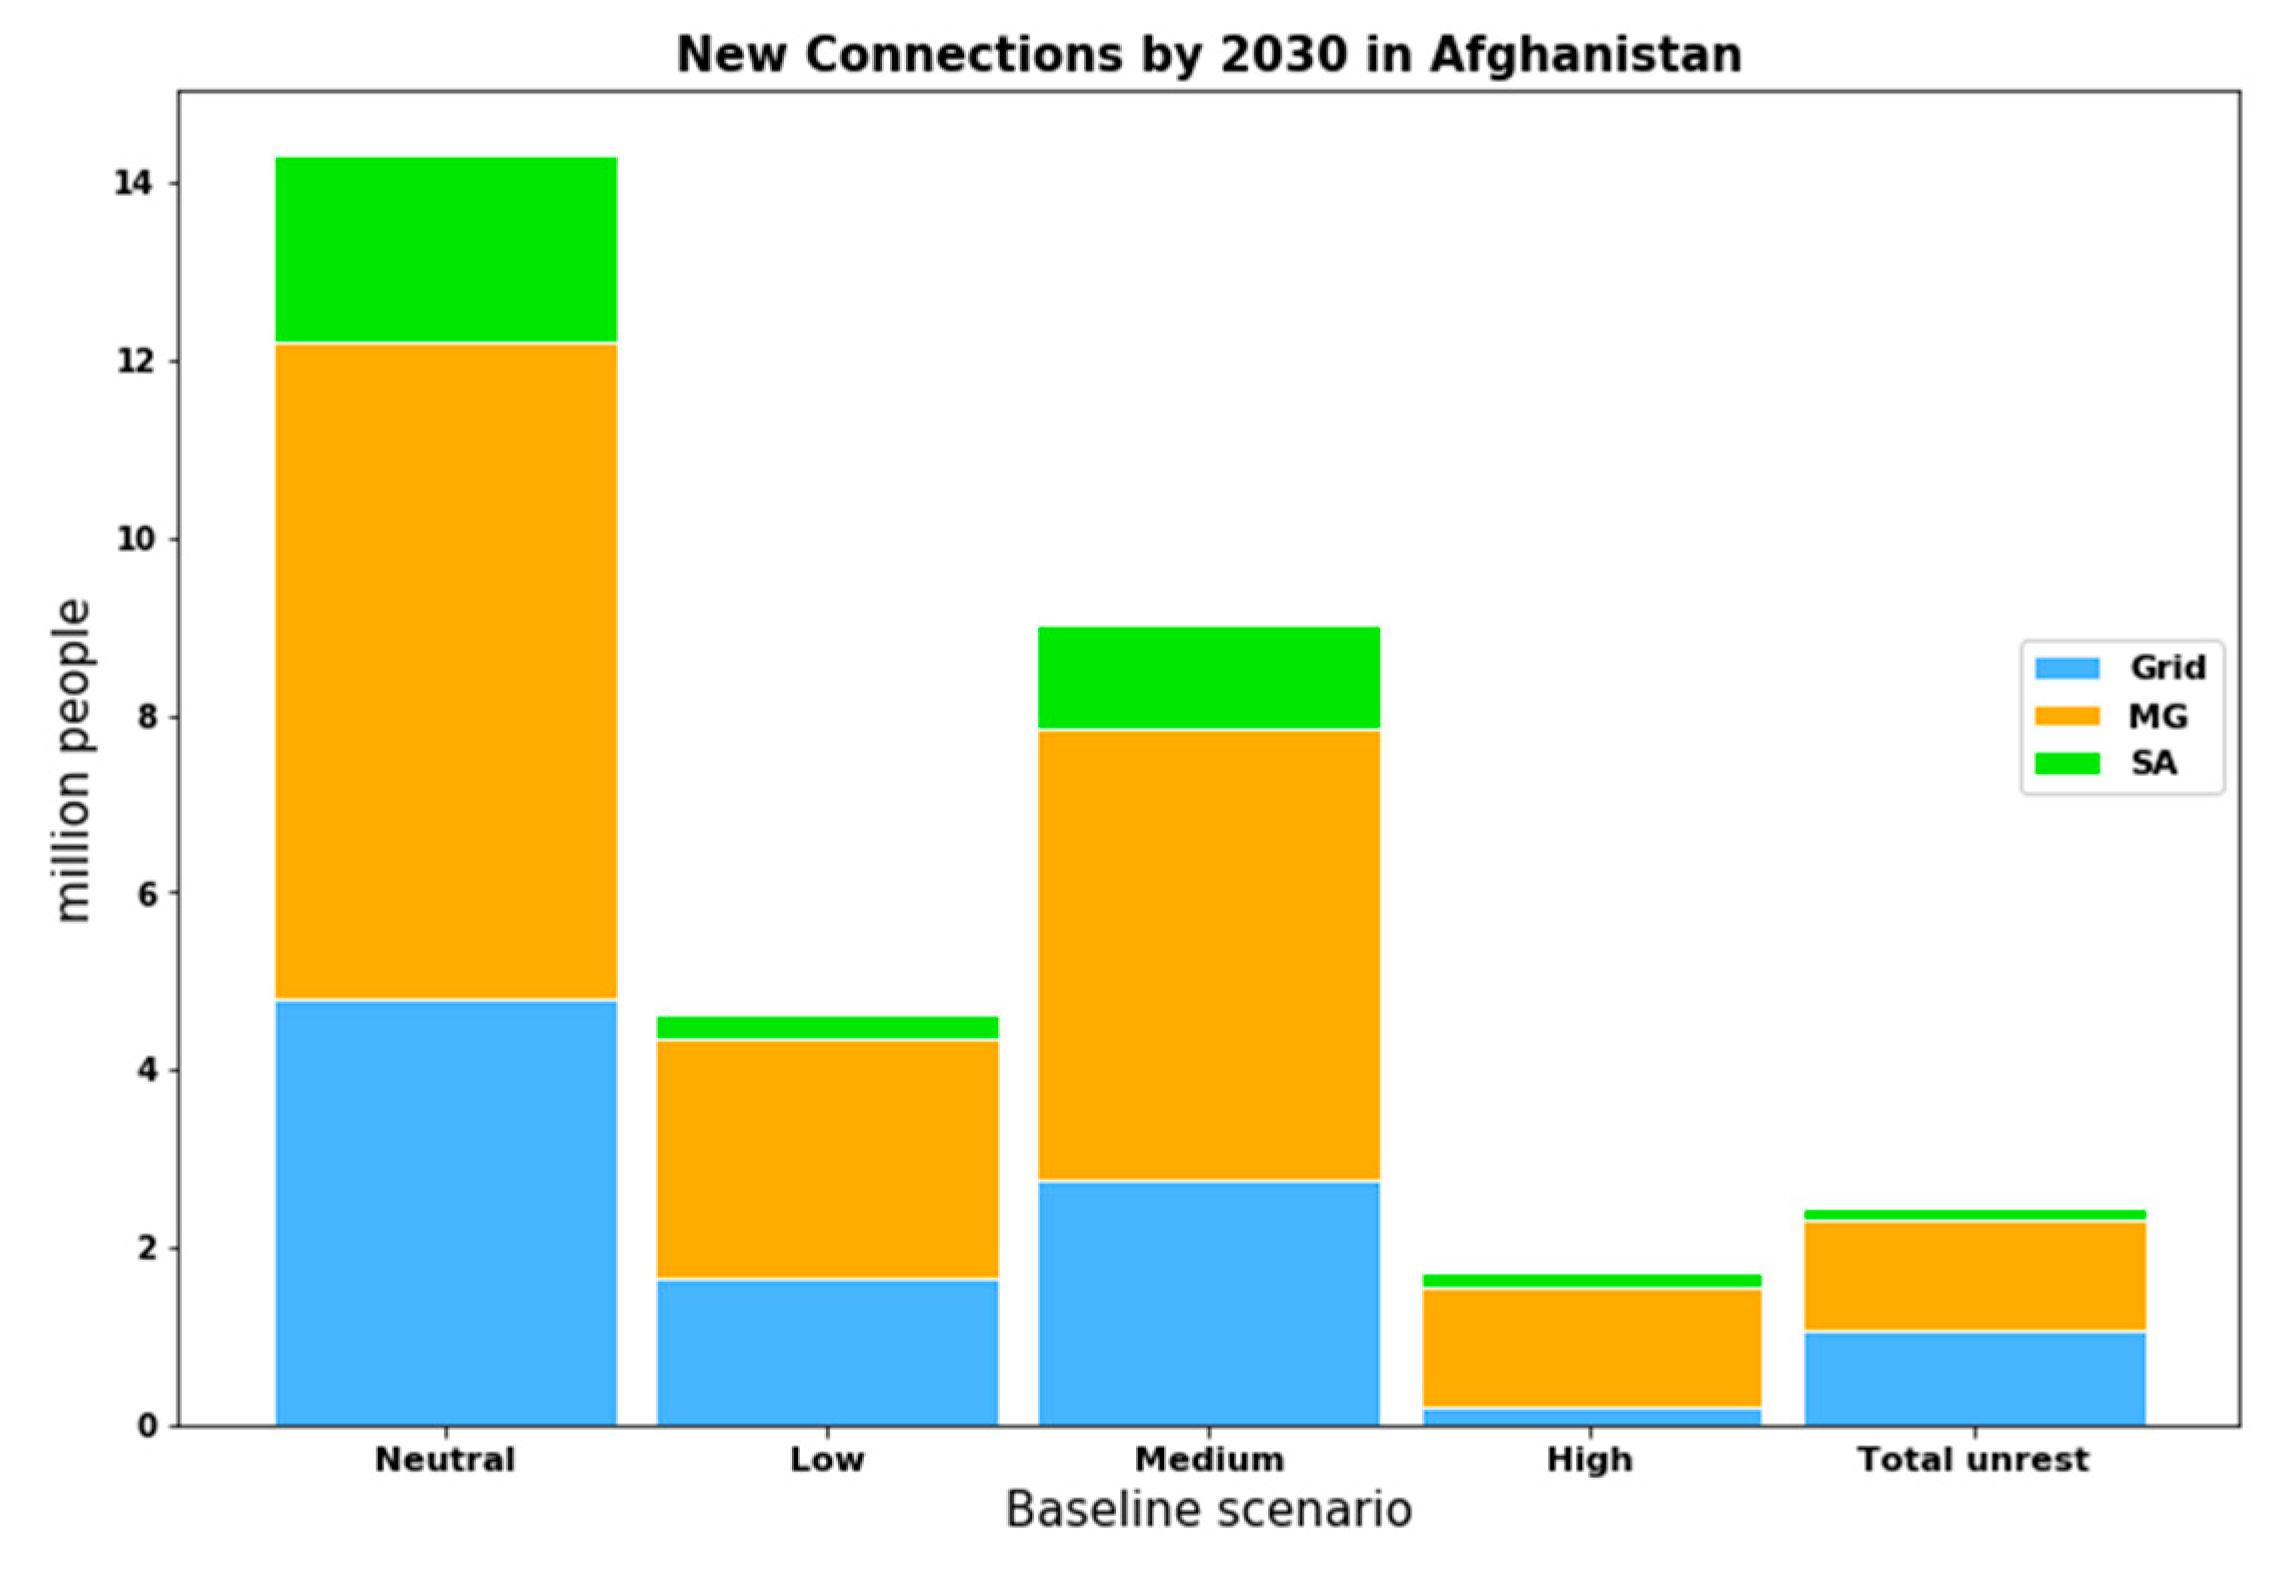
- What is the role (quantitatively and qualitatively) of on- and off-grid systems in the electrification of Afghanistan (SDG 7.1) and to what degree does conflict change this?
- Where should electrification policy focus in order to support stakeholder (public, private sector, and international aid) cooperation and promote investment for power infrastructure modernization in Afghanistan (SDG 7.B)?
2. Power System Planning in Fragile States
2.1. Background
2.2. Rationale
3. Methods
3.1. General Overview
3.2. Risk-Adjusted Discount Rate
3.3. Risk Premium on Fixed and Variable Costs
3.4. Testing Assumptions
3.4.1. Least Cost Electrification Mix under Various Discount Rates
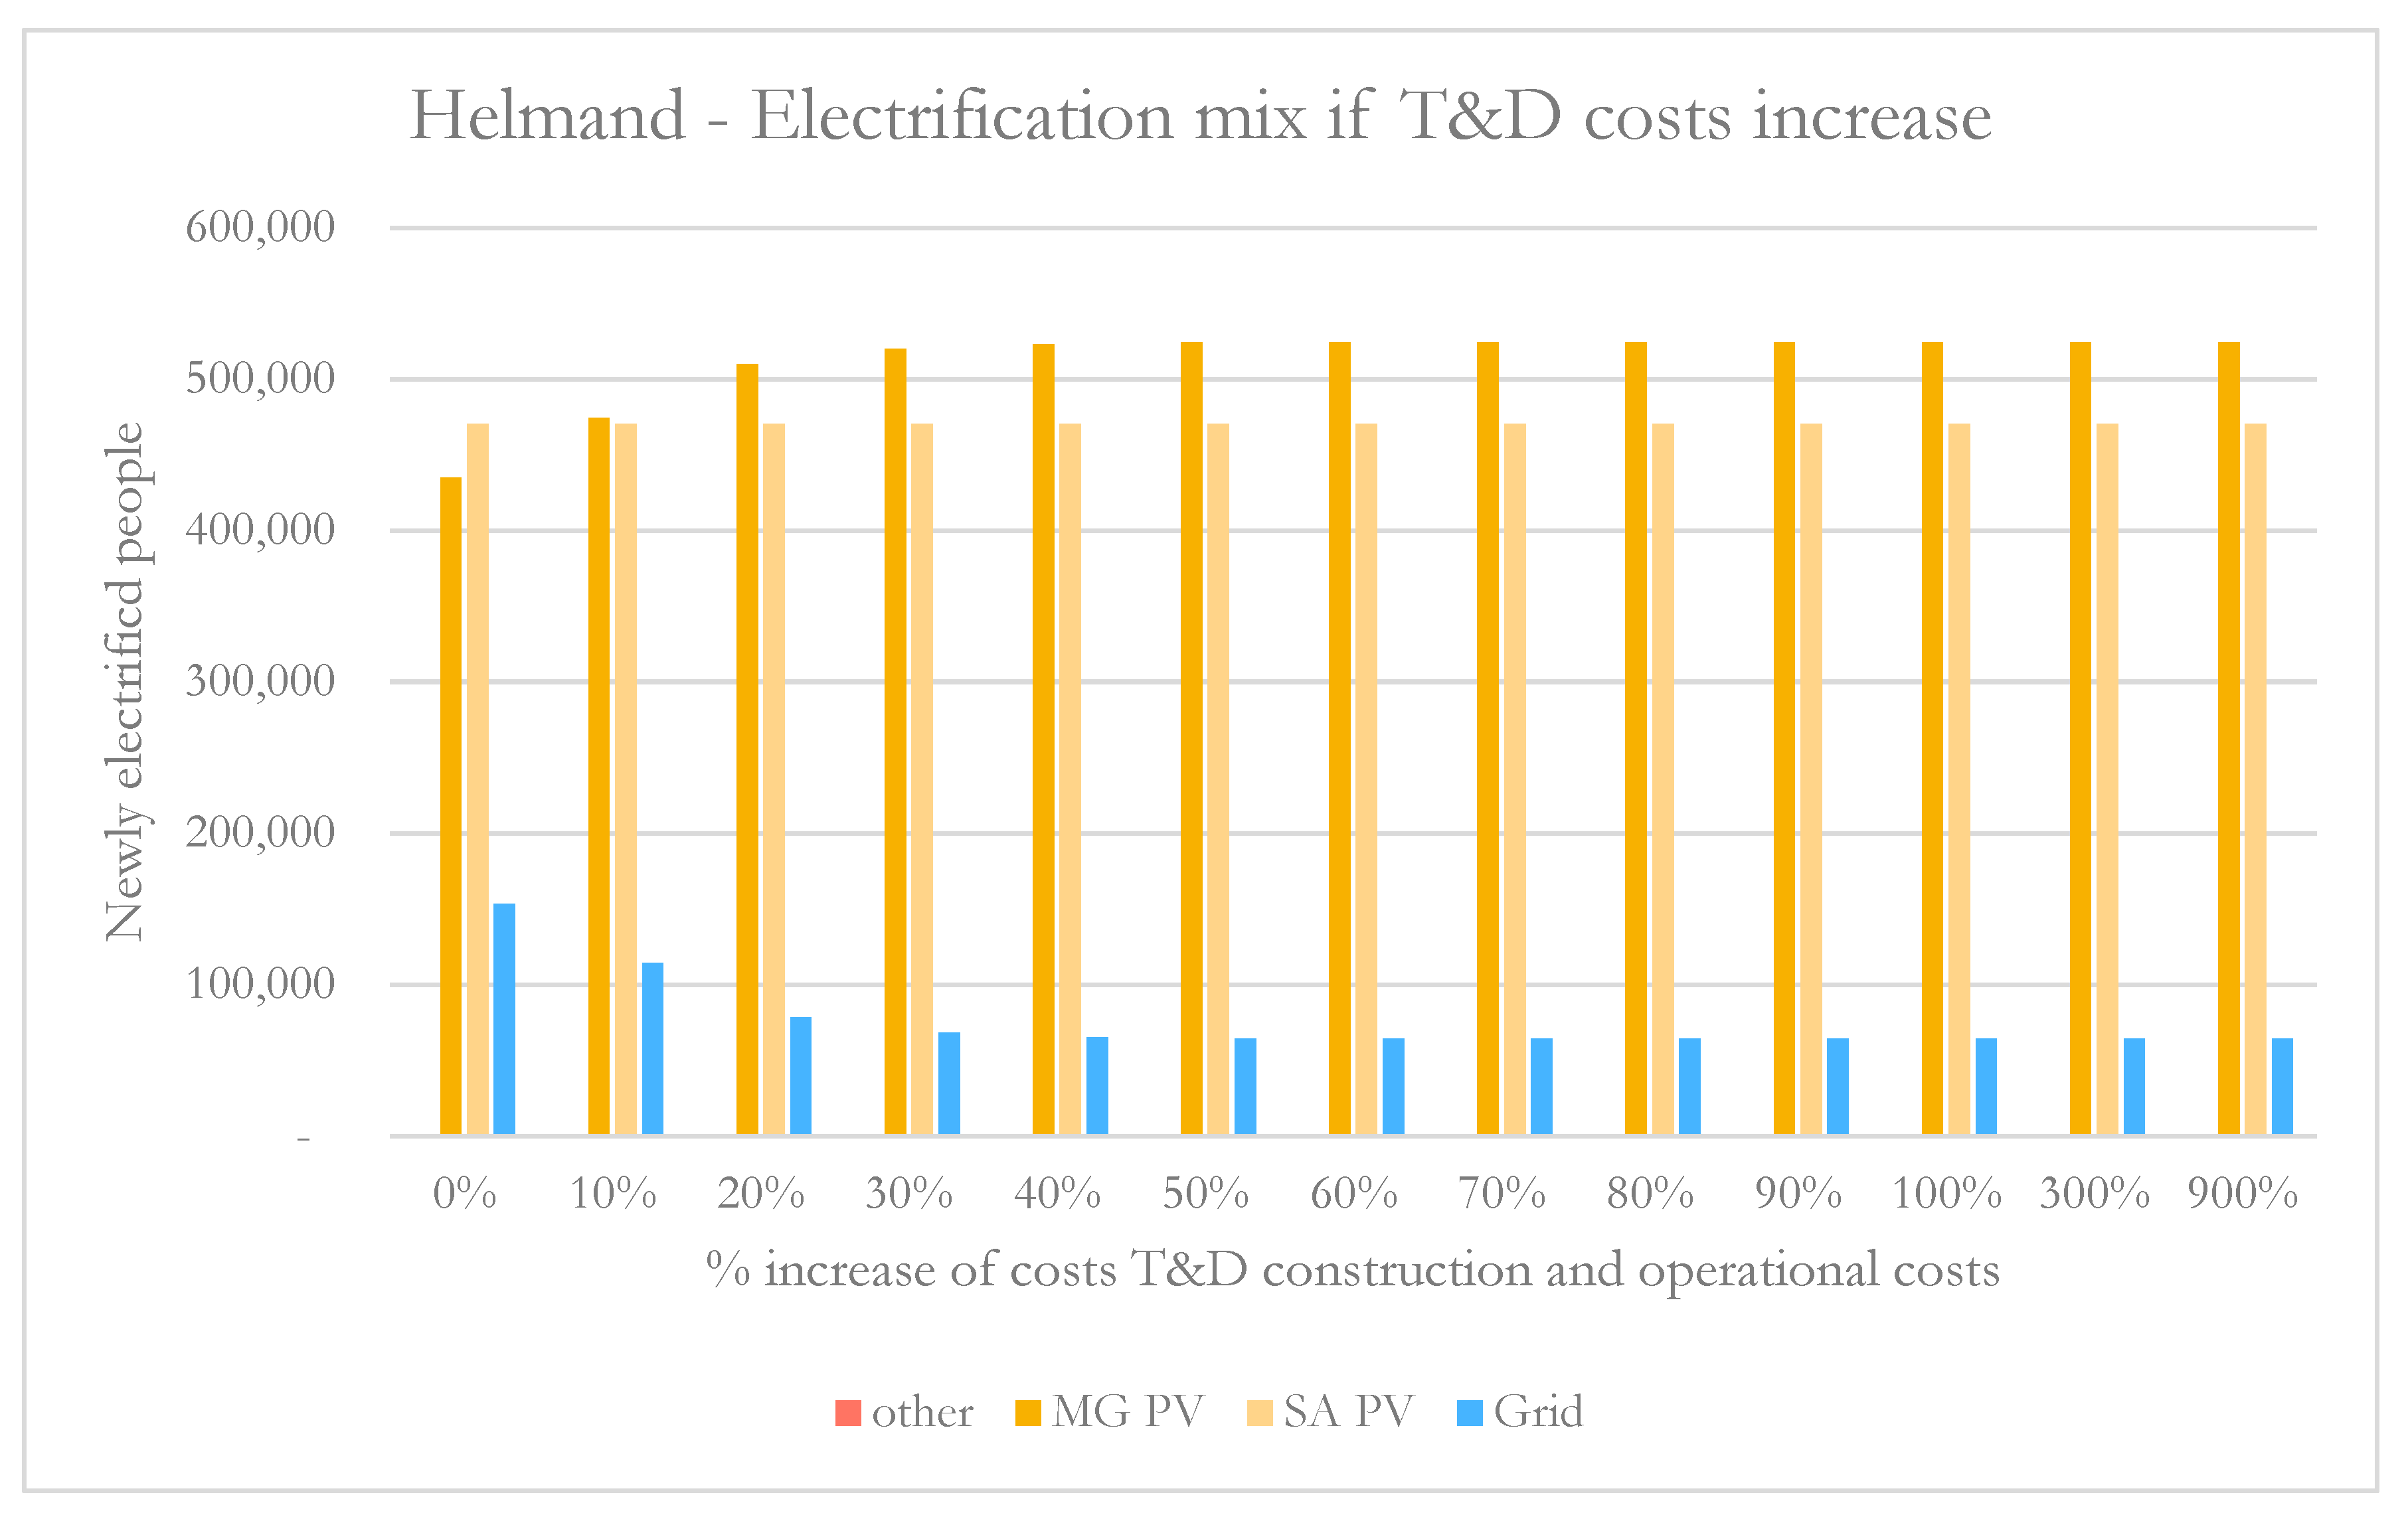
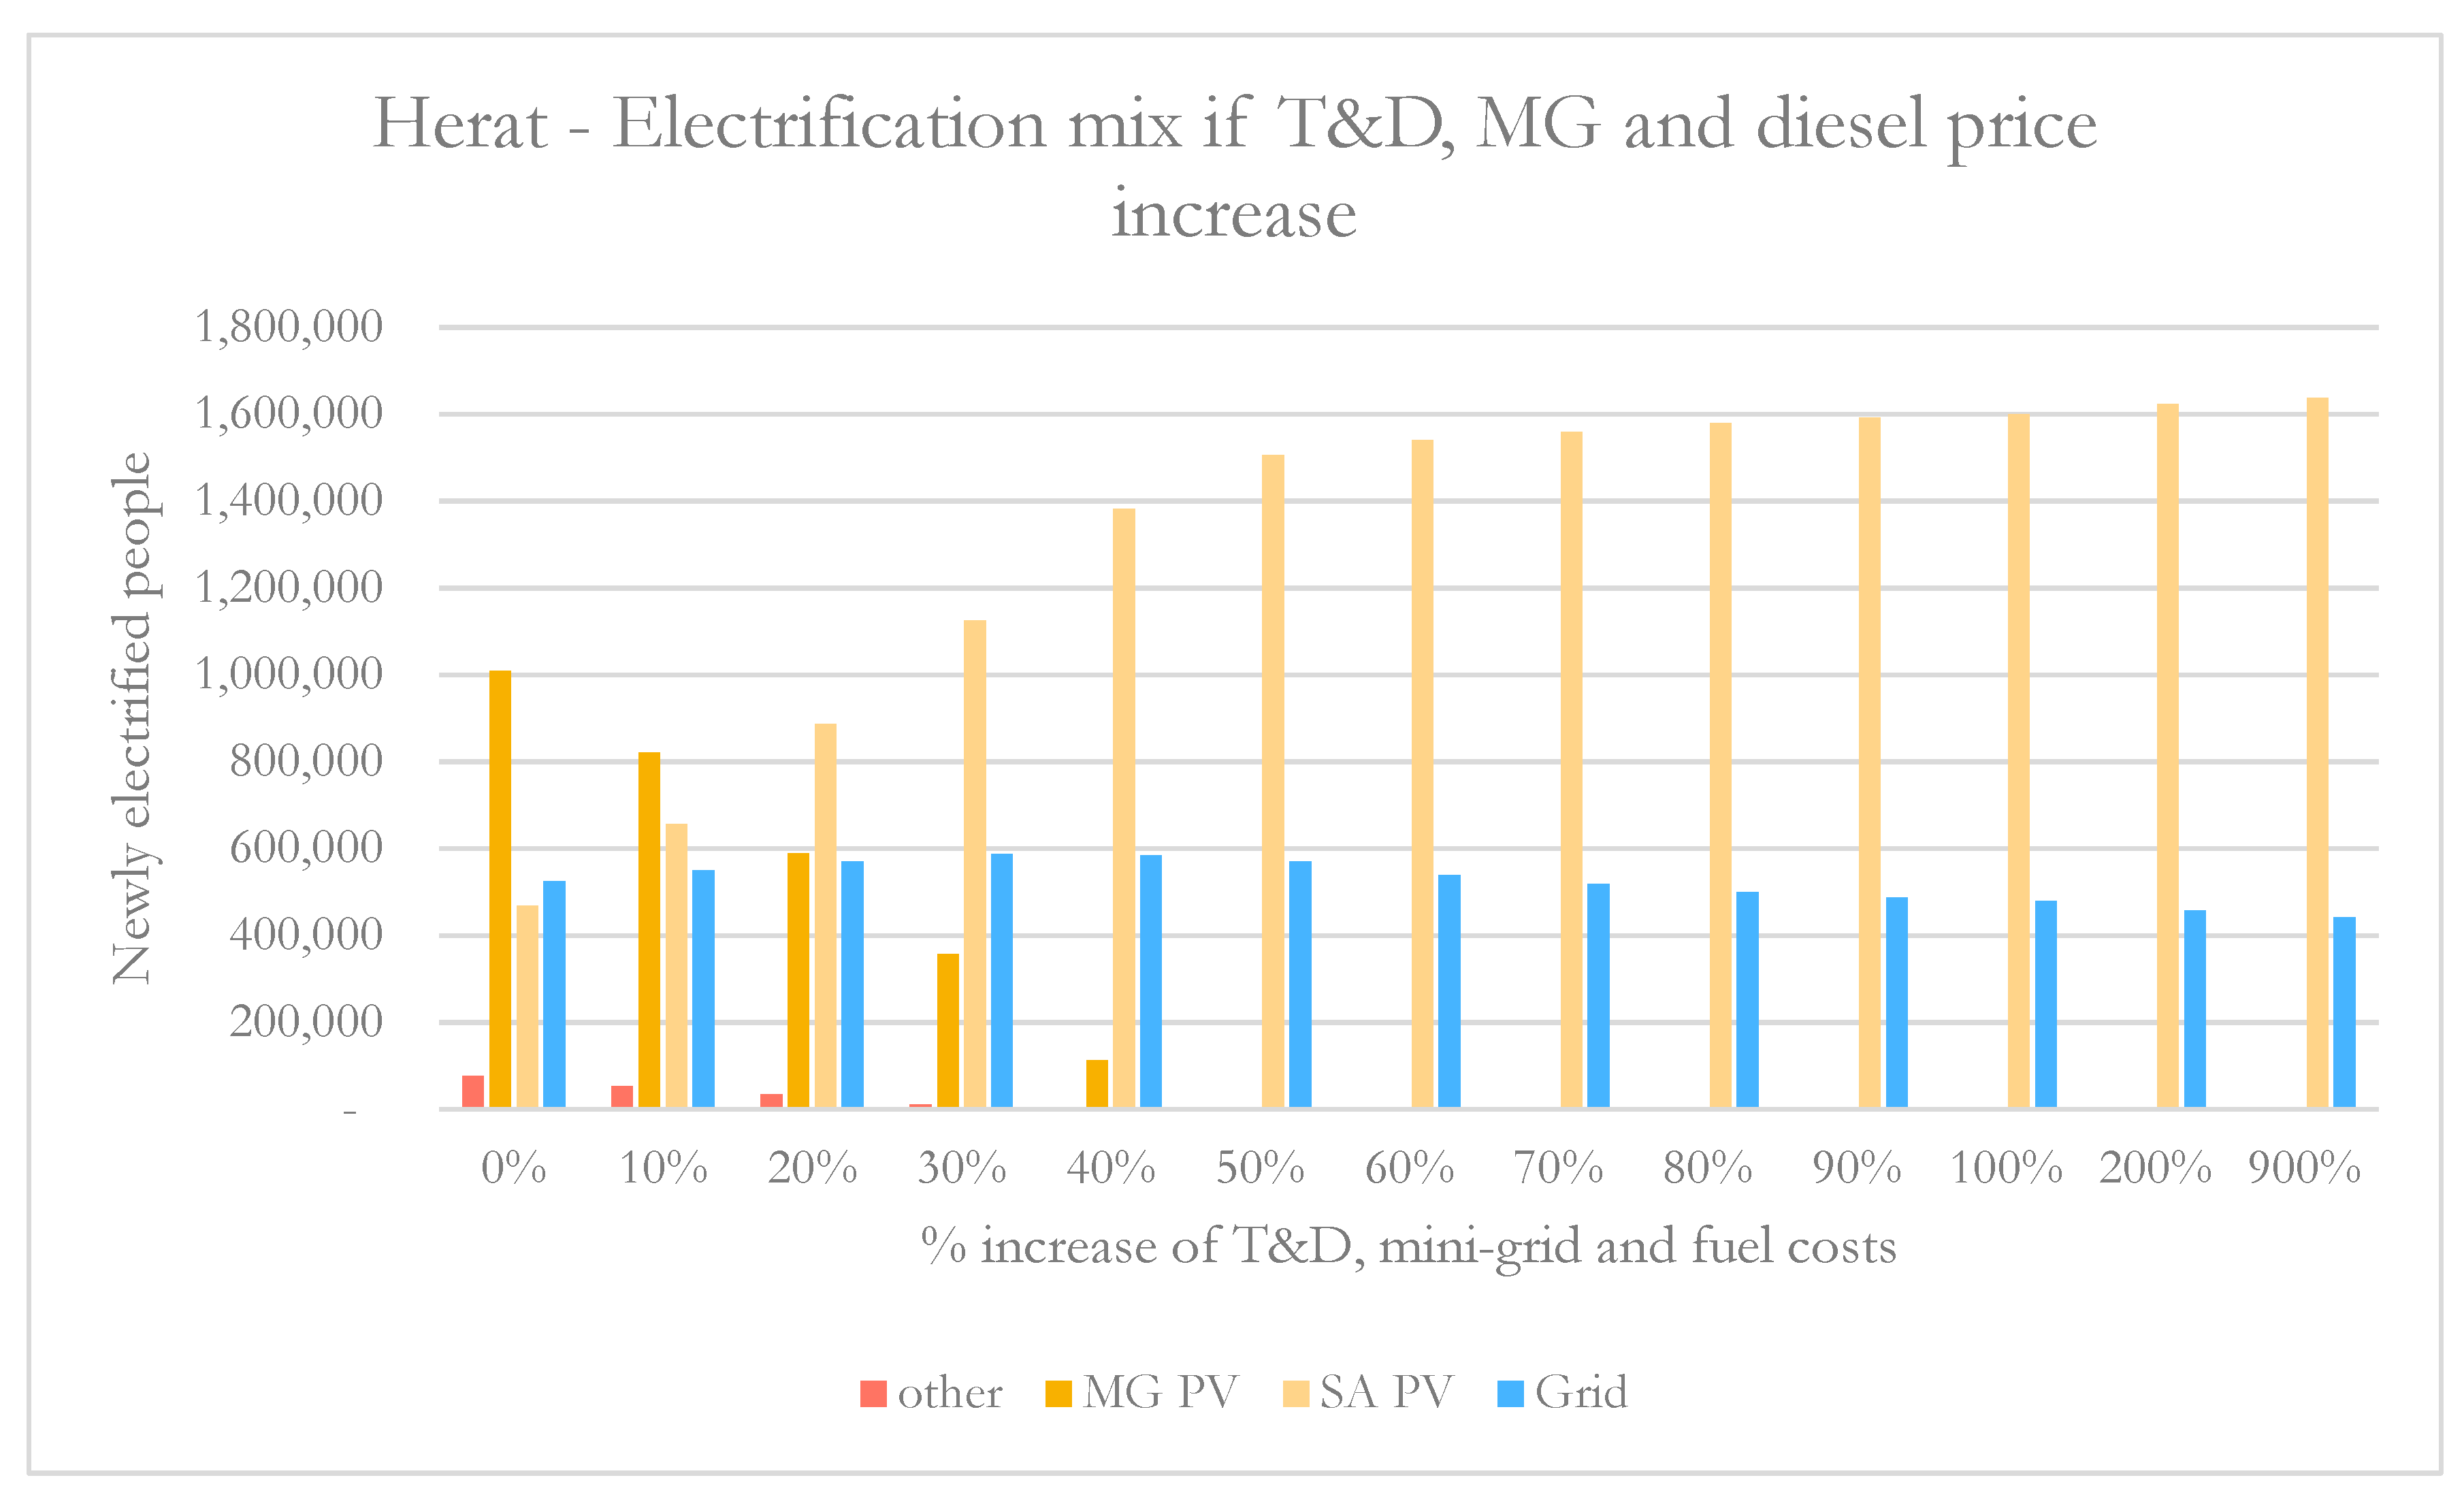
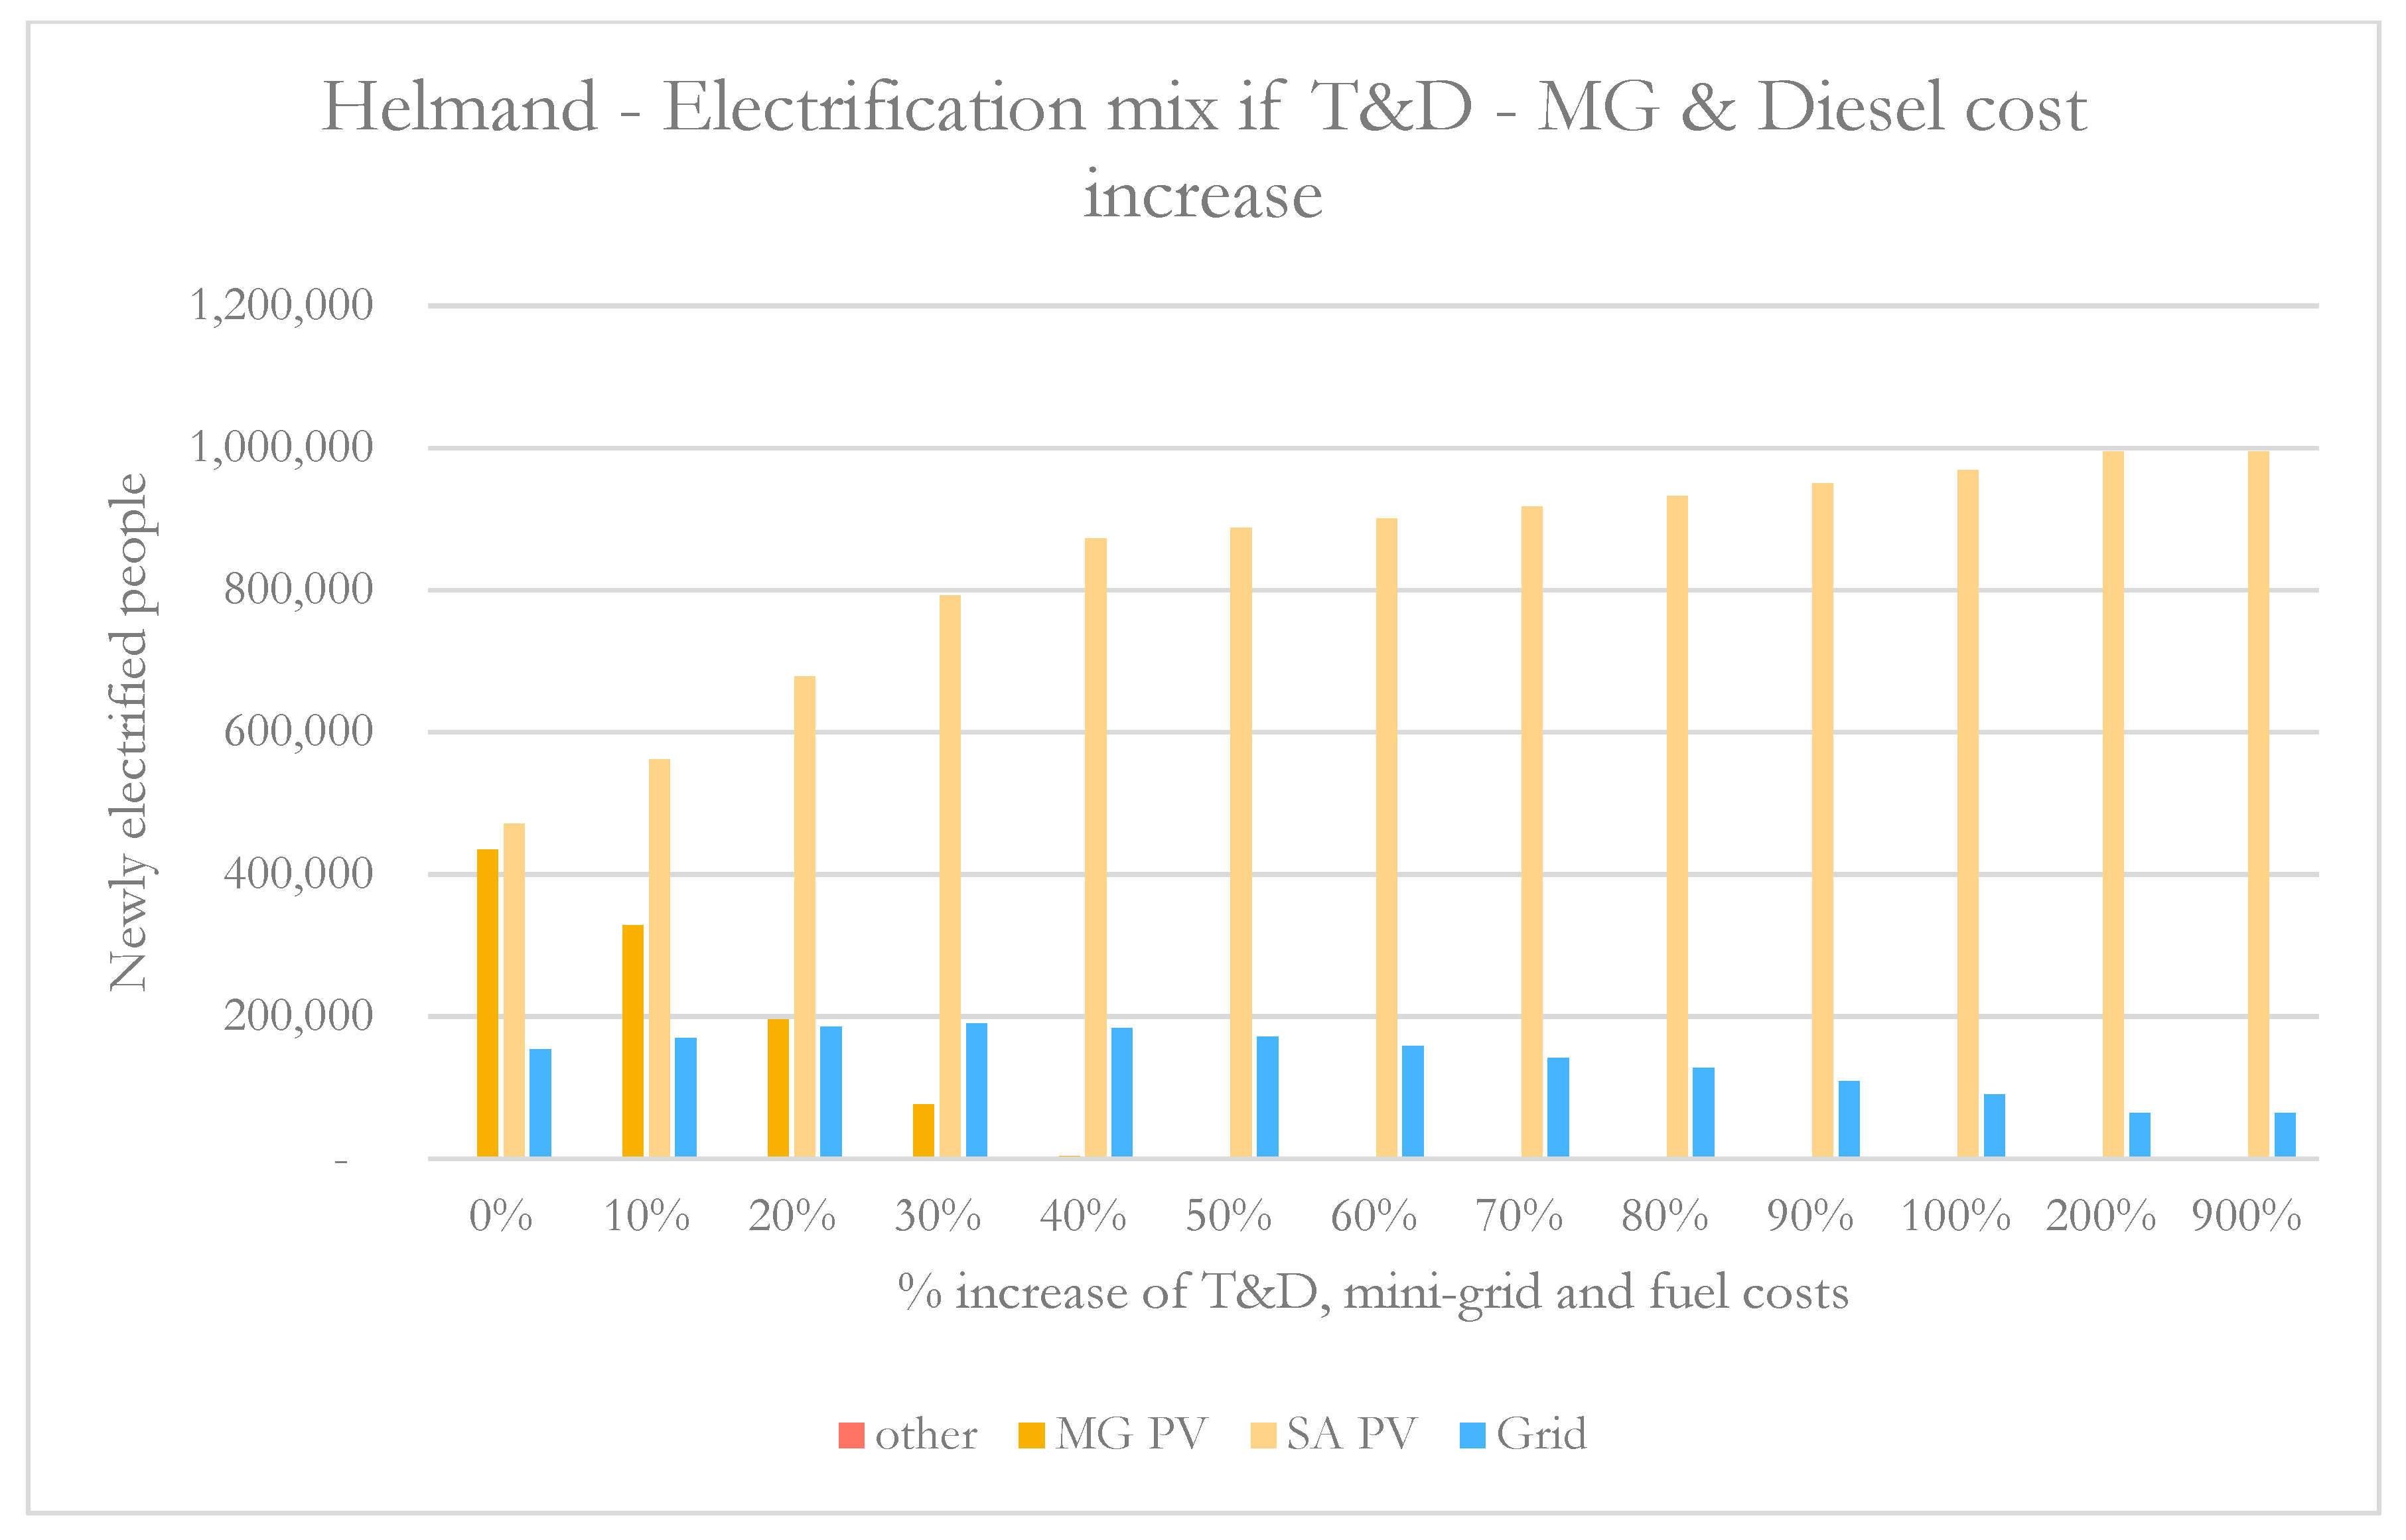
3.4.2. Least Cost Electrification Mix under Risk Premiums
3.5. A Conflict-Adjusted Least Cost Electrification Plan for Afghanistan
3.5.1. Background
3.5.2. Scenarios
4. Results
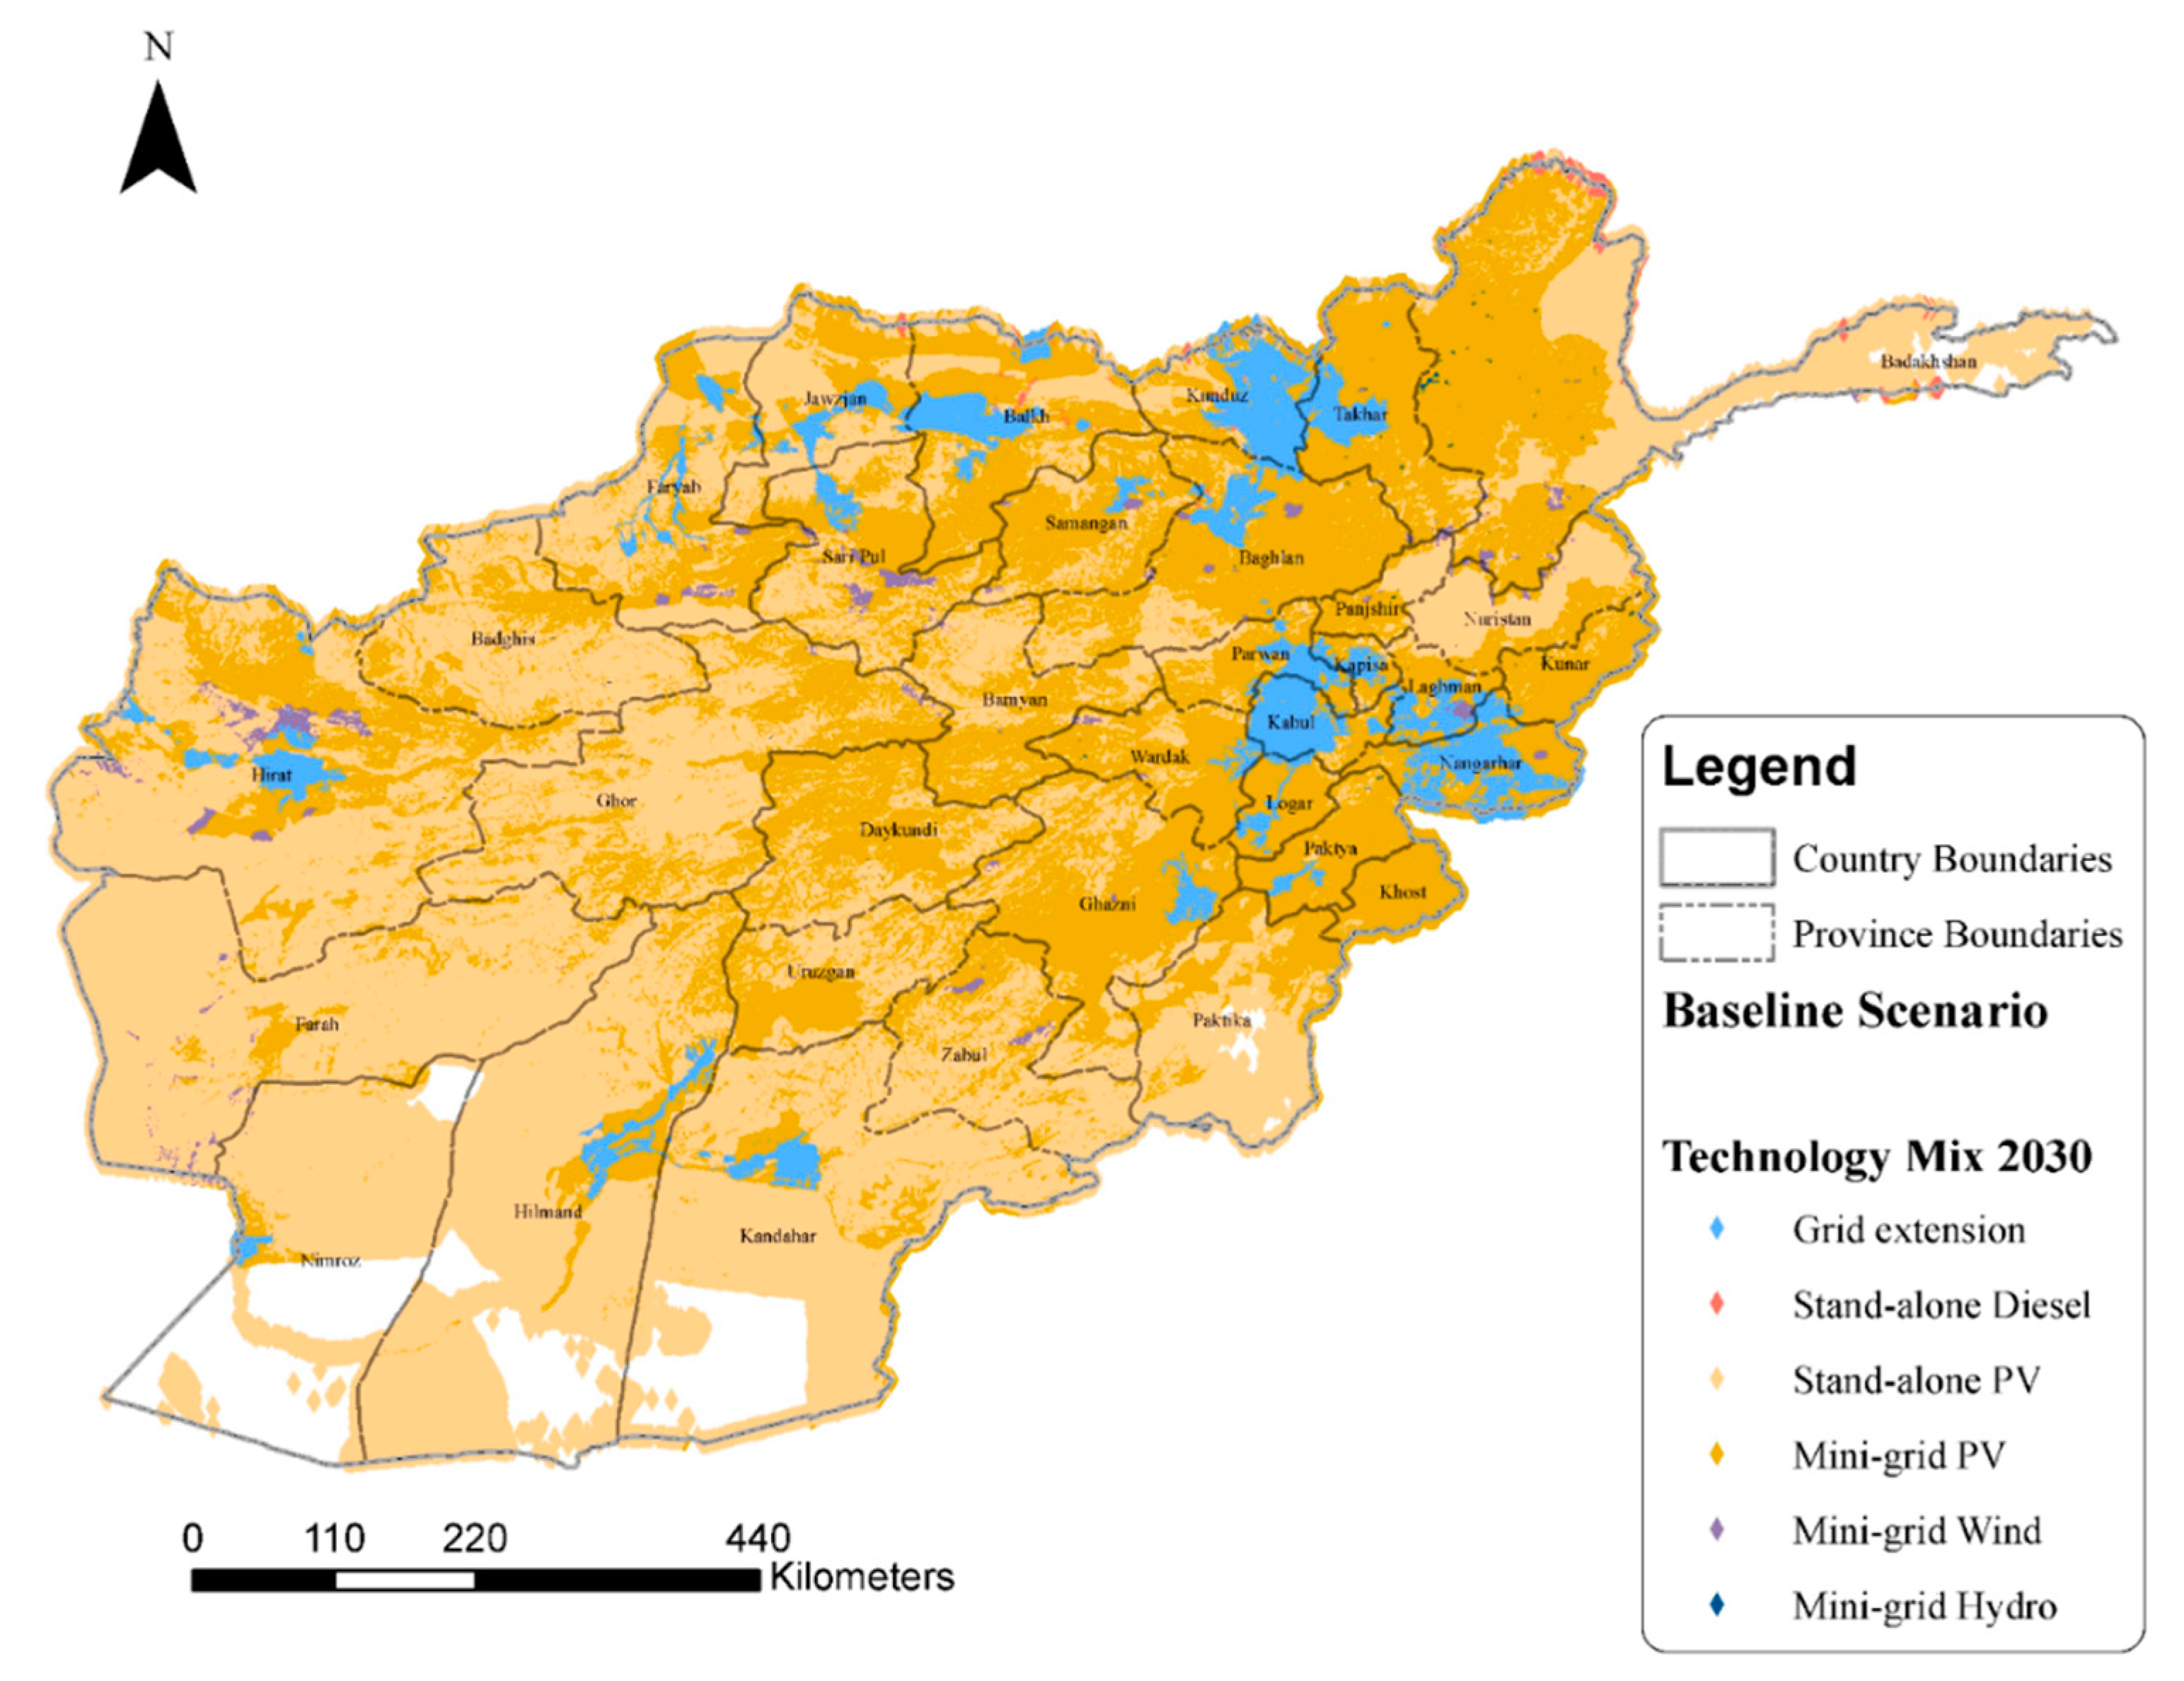
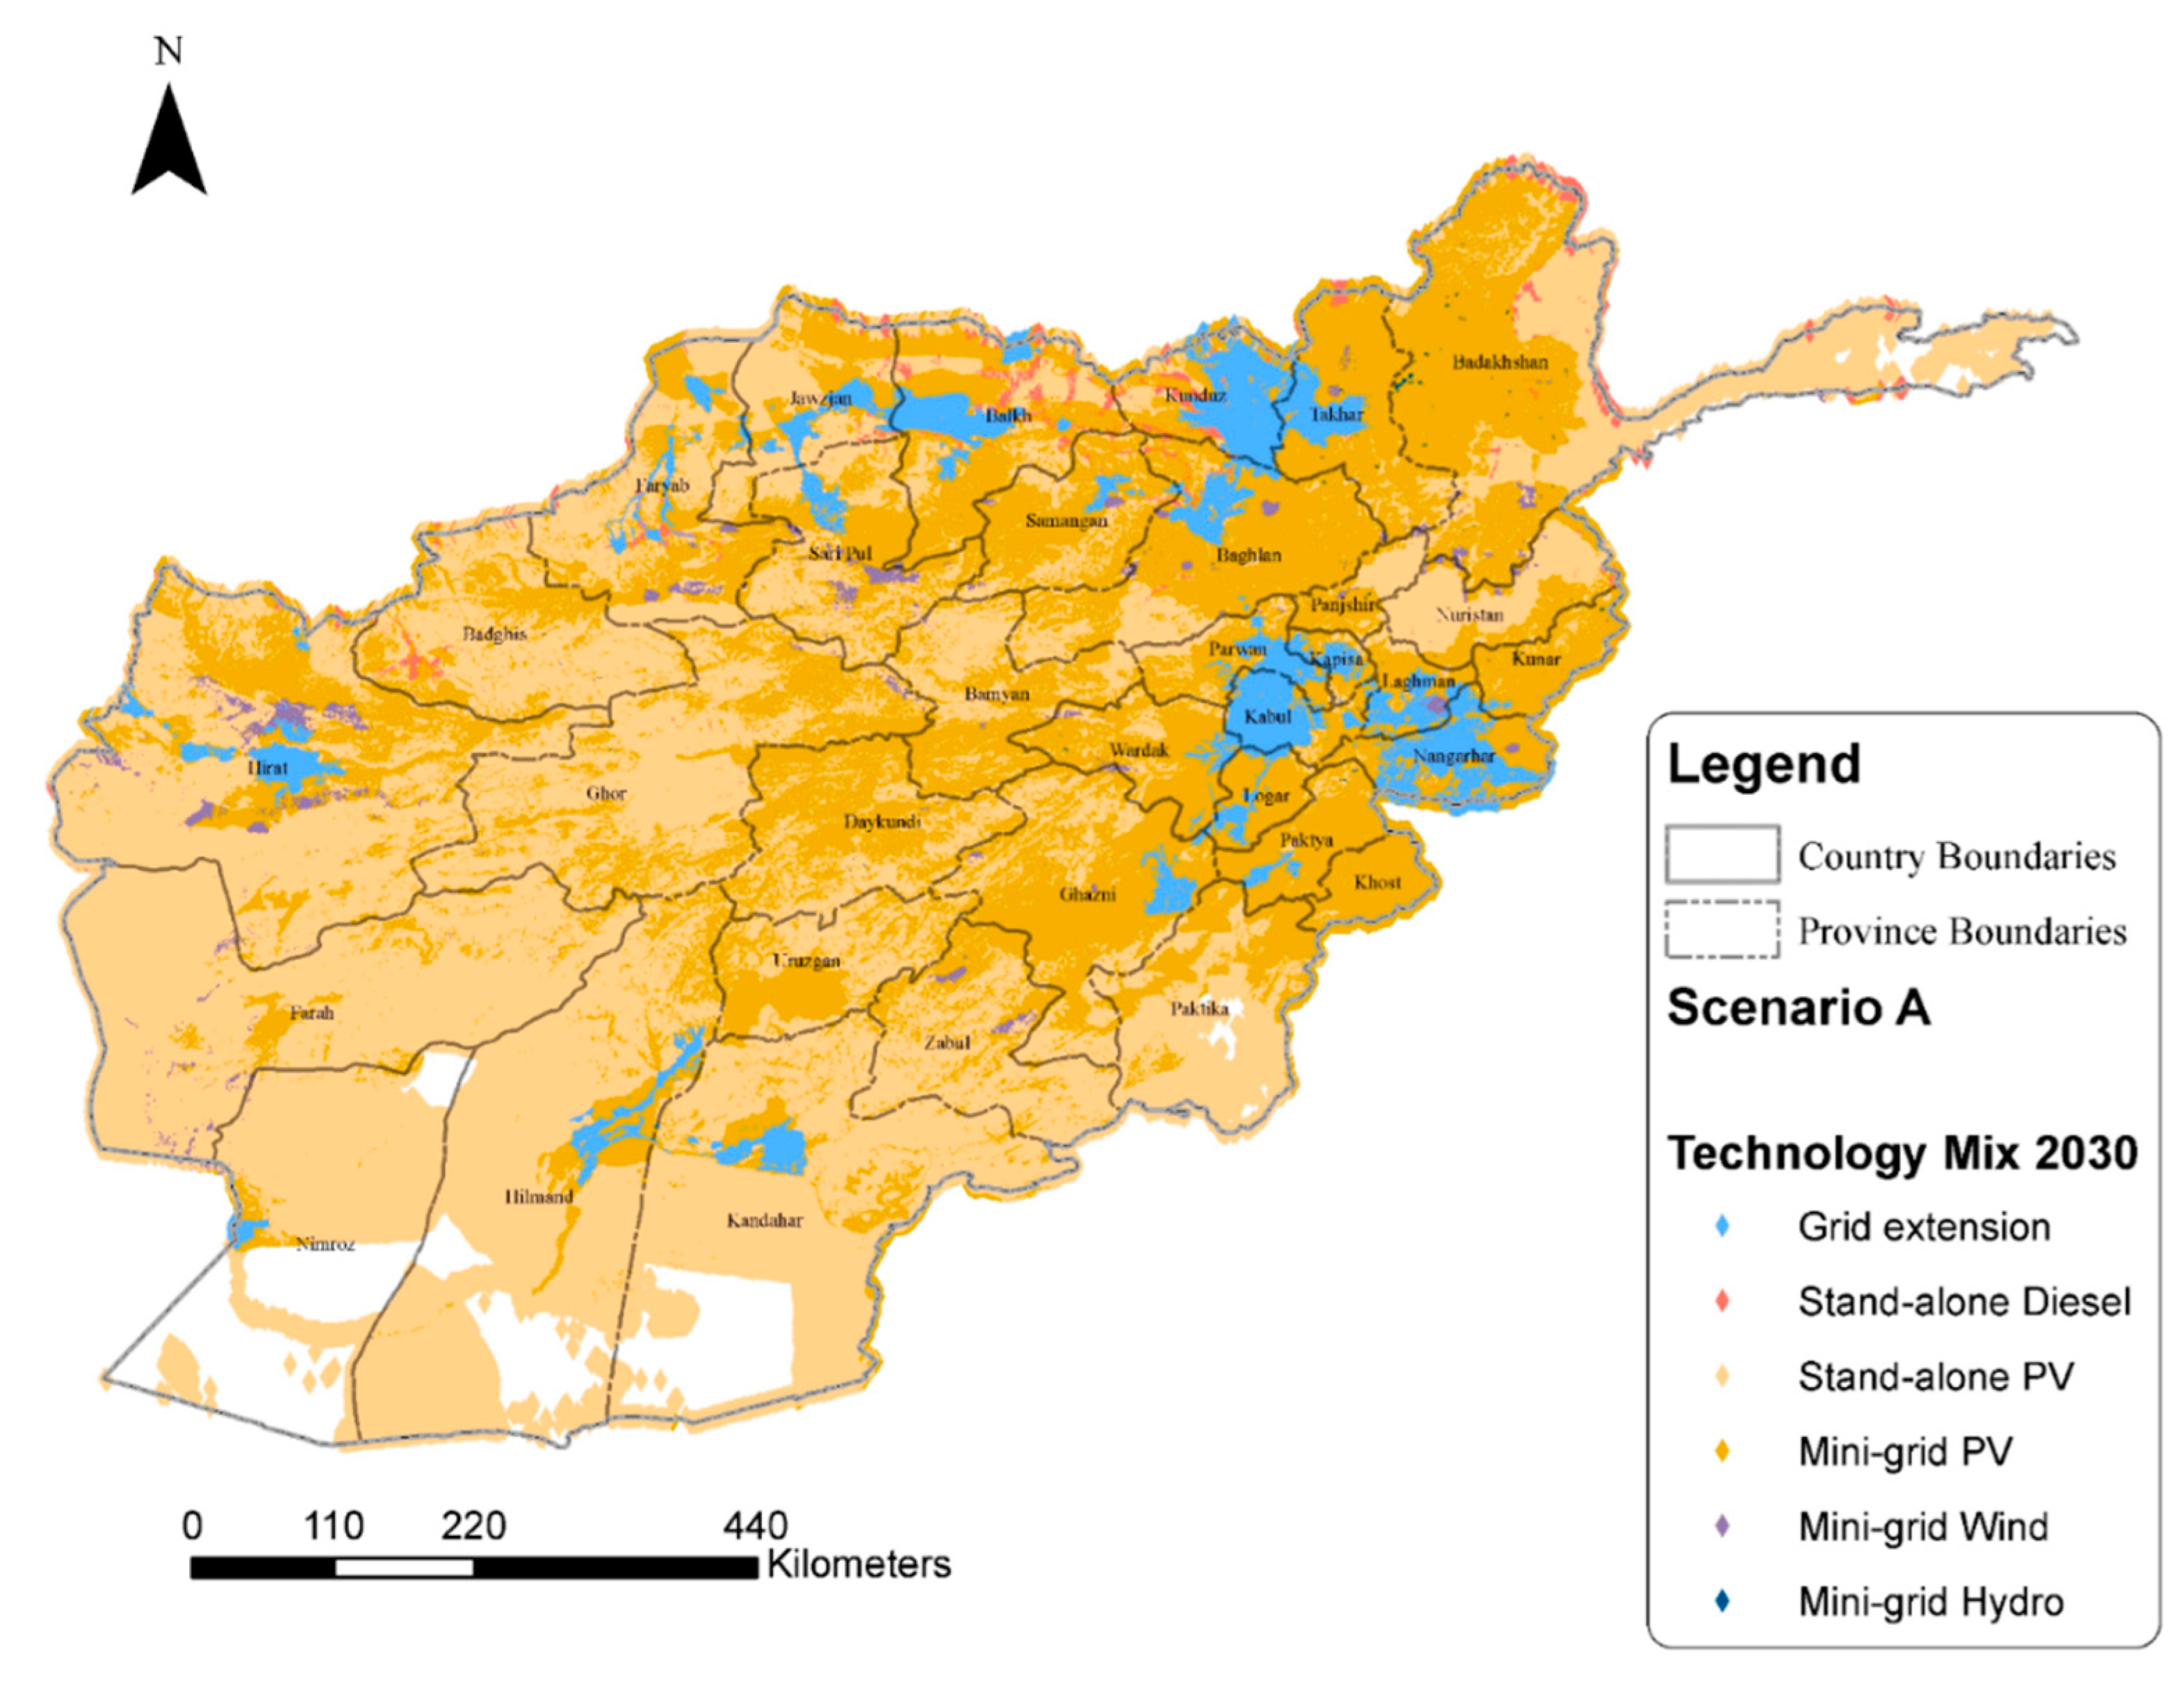
4.1. Least Cost Electrification Mix
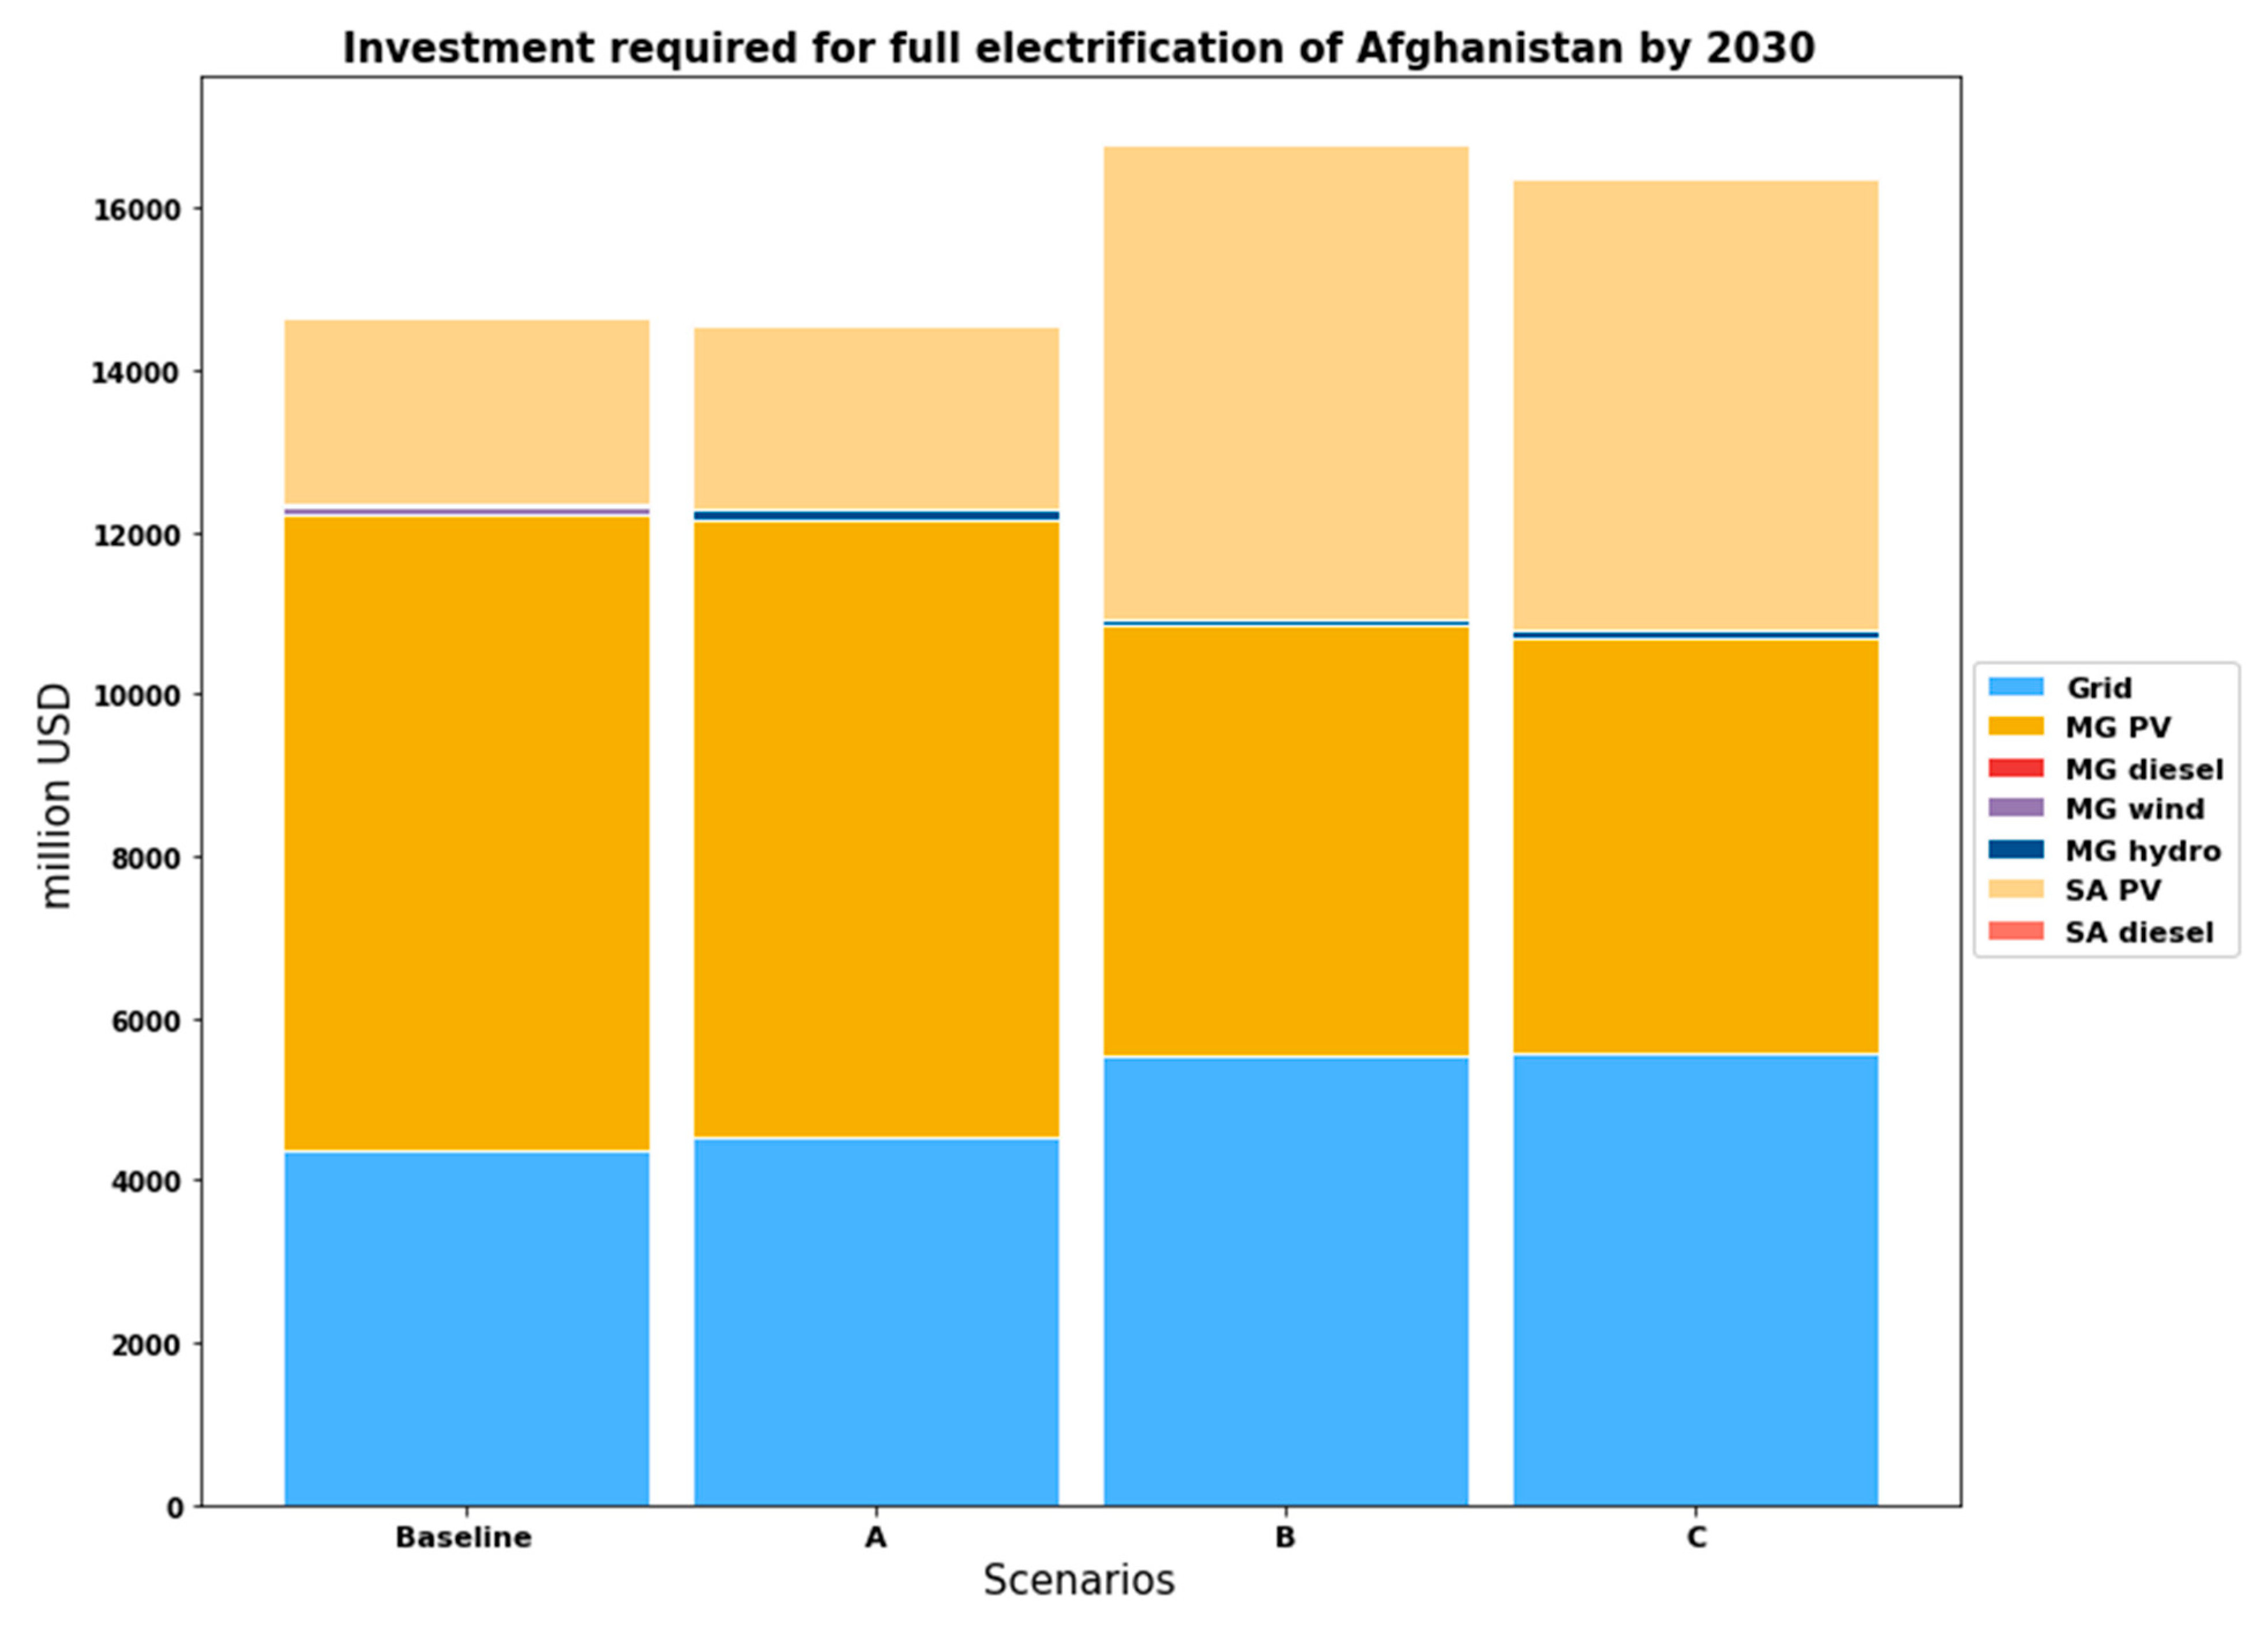
4.2. Capacity and Investment Needs
5. Analysis and Discussion
5.1. Towards a Policy for Electrifying Afghanistan
- The development of a risk-inclusive, cost-benefit, prioritization plan for grid densification along with realistic targets and timetables for the full electrification of settlements that are already connected to the grid and grid extension. To avoid excessively optimistic expectations (and subsequent disappointment), it is important that all energy sector stakeholders know who, where, and when the public utility can electrify.
- Set tariffs that reflect the real cost of electrification and include risk premiums and/or cross-subsidization. The model indicates that densification costs an average of 267.6 USD/capita, while new grid connections require, on average, 481.6 USD/capita (for those within a 50 km radius of the grid). Note that a higher fragility index induces higher grid connection costs that can reach 514.4 and 615.0 USD/capita in areas with high fragility or total unrest, respectively.
- Develop explicit regulation regarding licenses and permits for mini-grid operation. This calls for clear distinction in mandates, jurisdiction, and interactions between all involved stakeholders (e.g., the Ministry of Rural Rehabilitation and Development (MRRD) has a mandate for provision of services (including energy) to rural populations, which overlaps with the Ministry of Energy and Water (MEW) and Da Afghanistan Breshna Sherkat (DABS) mandates). To achieve better results for off-grid electrification, the establishment of a dedicated rural electrification agency, reporting to MRRD and MEW, respectively, should be envisaged.
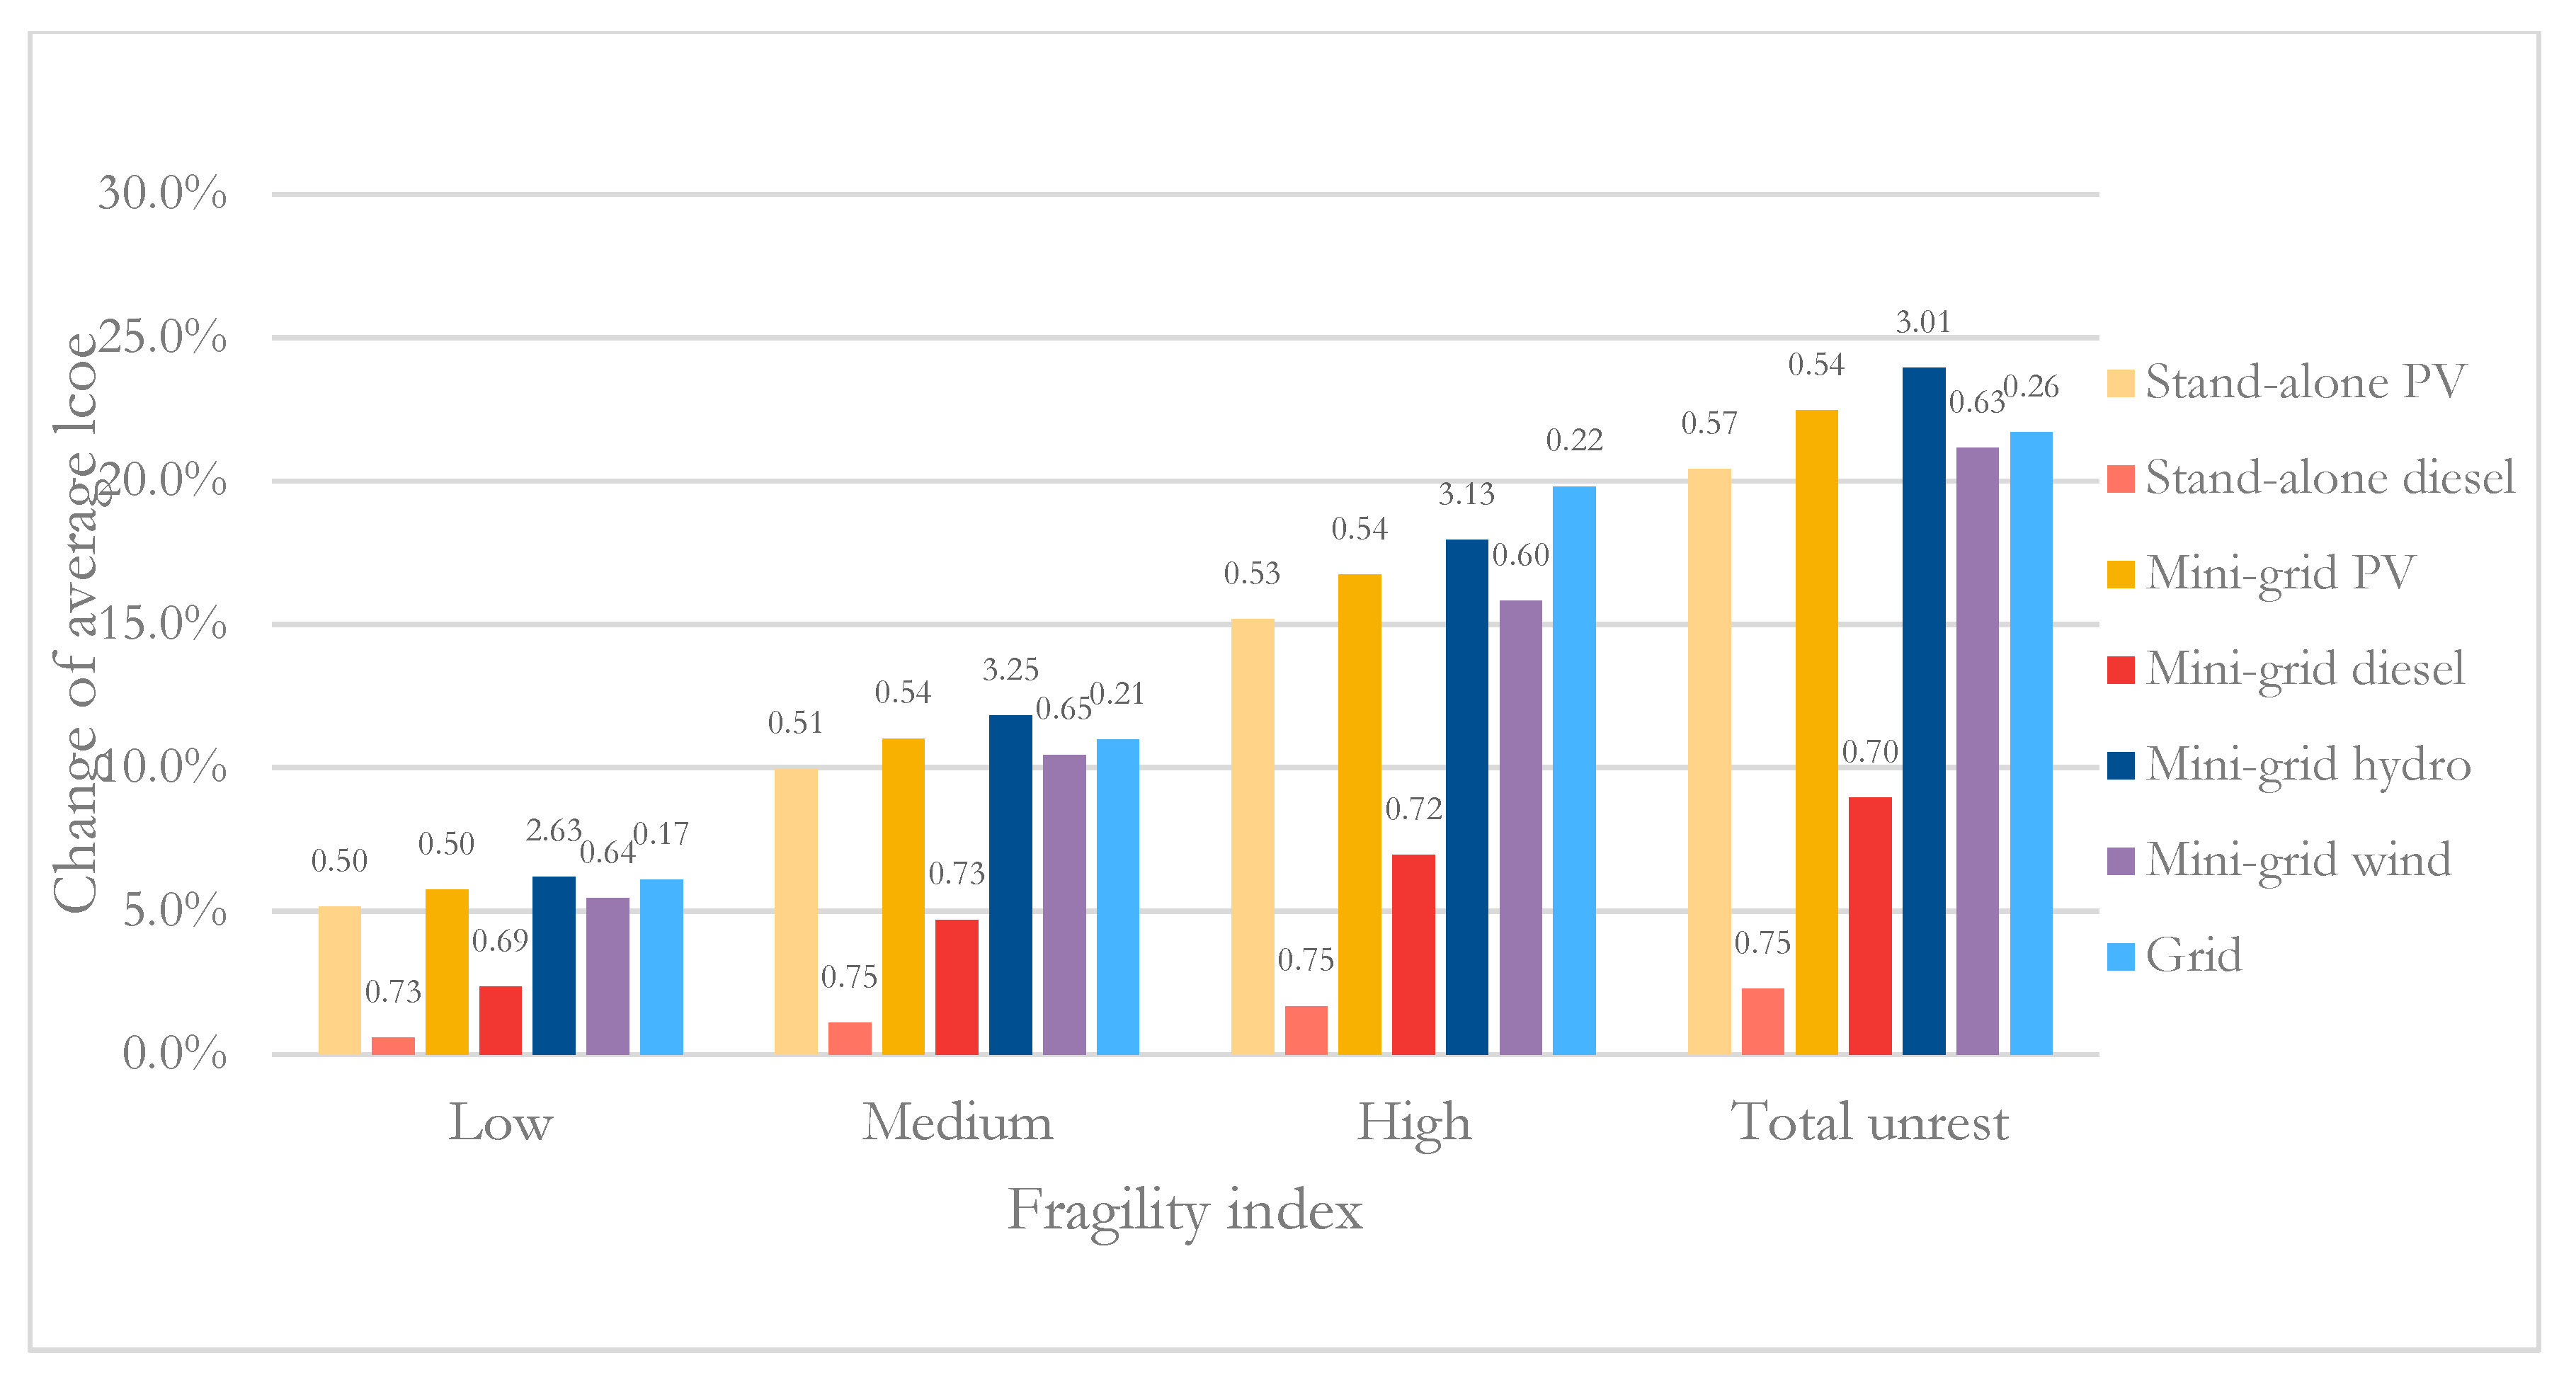
- Results of the analysis indicate that average LCoE can increase considerably with higher fragility (Figure 8). Thus, policy should design (or allow for) flexible tariff schemes that are risk reflective (e.g., off-FiT [79]). Dedicated partial subsidies in fragile areas may be considered to reduce the comparatively higher cost.
- Implement strict technical, safety, and quality standards for mini-grid licensing and operation.
- Provide concessions (import tax reduction, capital subsidization, revenue-based financing) and/or compensation in the event of terrorism (repair grants).
- Develop clear guidelines on grid interconnection (e.g., distributor, generator, buyout model, or mix), because most of the prospective private mini-grid investments are expected in peri-urban areas.
- Direct donor support in rural areas or areas with higher fragility that private investors or public utility cannot support immediately. This can be in the form of subsidies (e.g., up-front payment of grants) for smaller scale off-grid systems. To illustrate, mini-grid PV systems require on average of 481.5 USD/capita, while wind and hydro mini-grids require 455.6 and 424.2, respectively. Stand-alone PV requires, on average, 565.1 USD/capita, four time more than stand-alone diesel with about 129.9 USD/capita.
- Mandate donor’s involvement in efforts that secure long-term sustainability of such systems (e.g., capacity building and maintenance) as well as scale-up over time as demand progressively grows.
5.2. Final Remarks & Conclusion
Author Contributions
Funding
Acknowledgments
Conflicts of Interest
Appendix A. Model Assumptions and Input Parameters
Appendix A.1. Socio-Economic Parameters

| Parameter | Metric | Value 2016 | Value 2030 |
|---|---|---|---|
| Population, total | Million people | 33.73 [83] | 44.310 (estimated based on growth rates, below) |
| Urban population | Percent of total population | 26.3% [84] | 35.8% (estimated based on growth rates, below) |
| Rural population | Percent of total population | 73.7% [84] | 64.2% (estimated based on growth rates, below) |
| Urban growth | Percent growth per year | 3.96% [84] | 3.49% (average value used in the model as 3.65% per year) |
| Rural growth | Percent growth per year | 1.85% | 1.12% (average value used in the model as 1.35% per year) |
| Modelled electricity access | Percent of total population | 30% [57] | 100% |
| Modelled electricity access, urban | Percent of urban population | 89% [57] | 100% |
| Modelled electricity access, rural | Percent of rural population | 11% [57] | 100% |
| People per household, urban | People per household | 7.4 [85] | 7 (assuming 5% decrease over the 15-year period) [86] |
| People per household, rural | People per household | 8.5 [85] | 8.1 (assuming 5% decrease over the 15-year period) [86] |
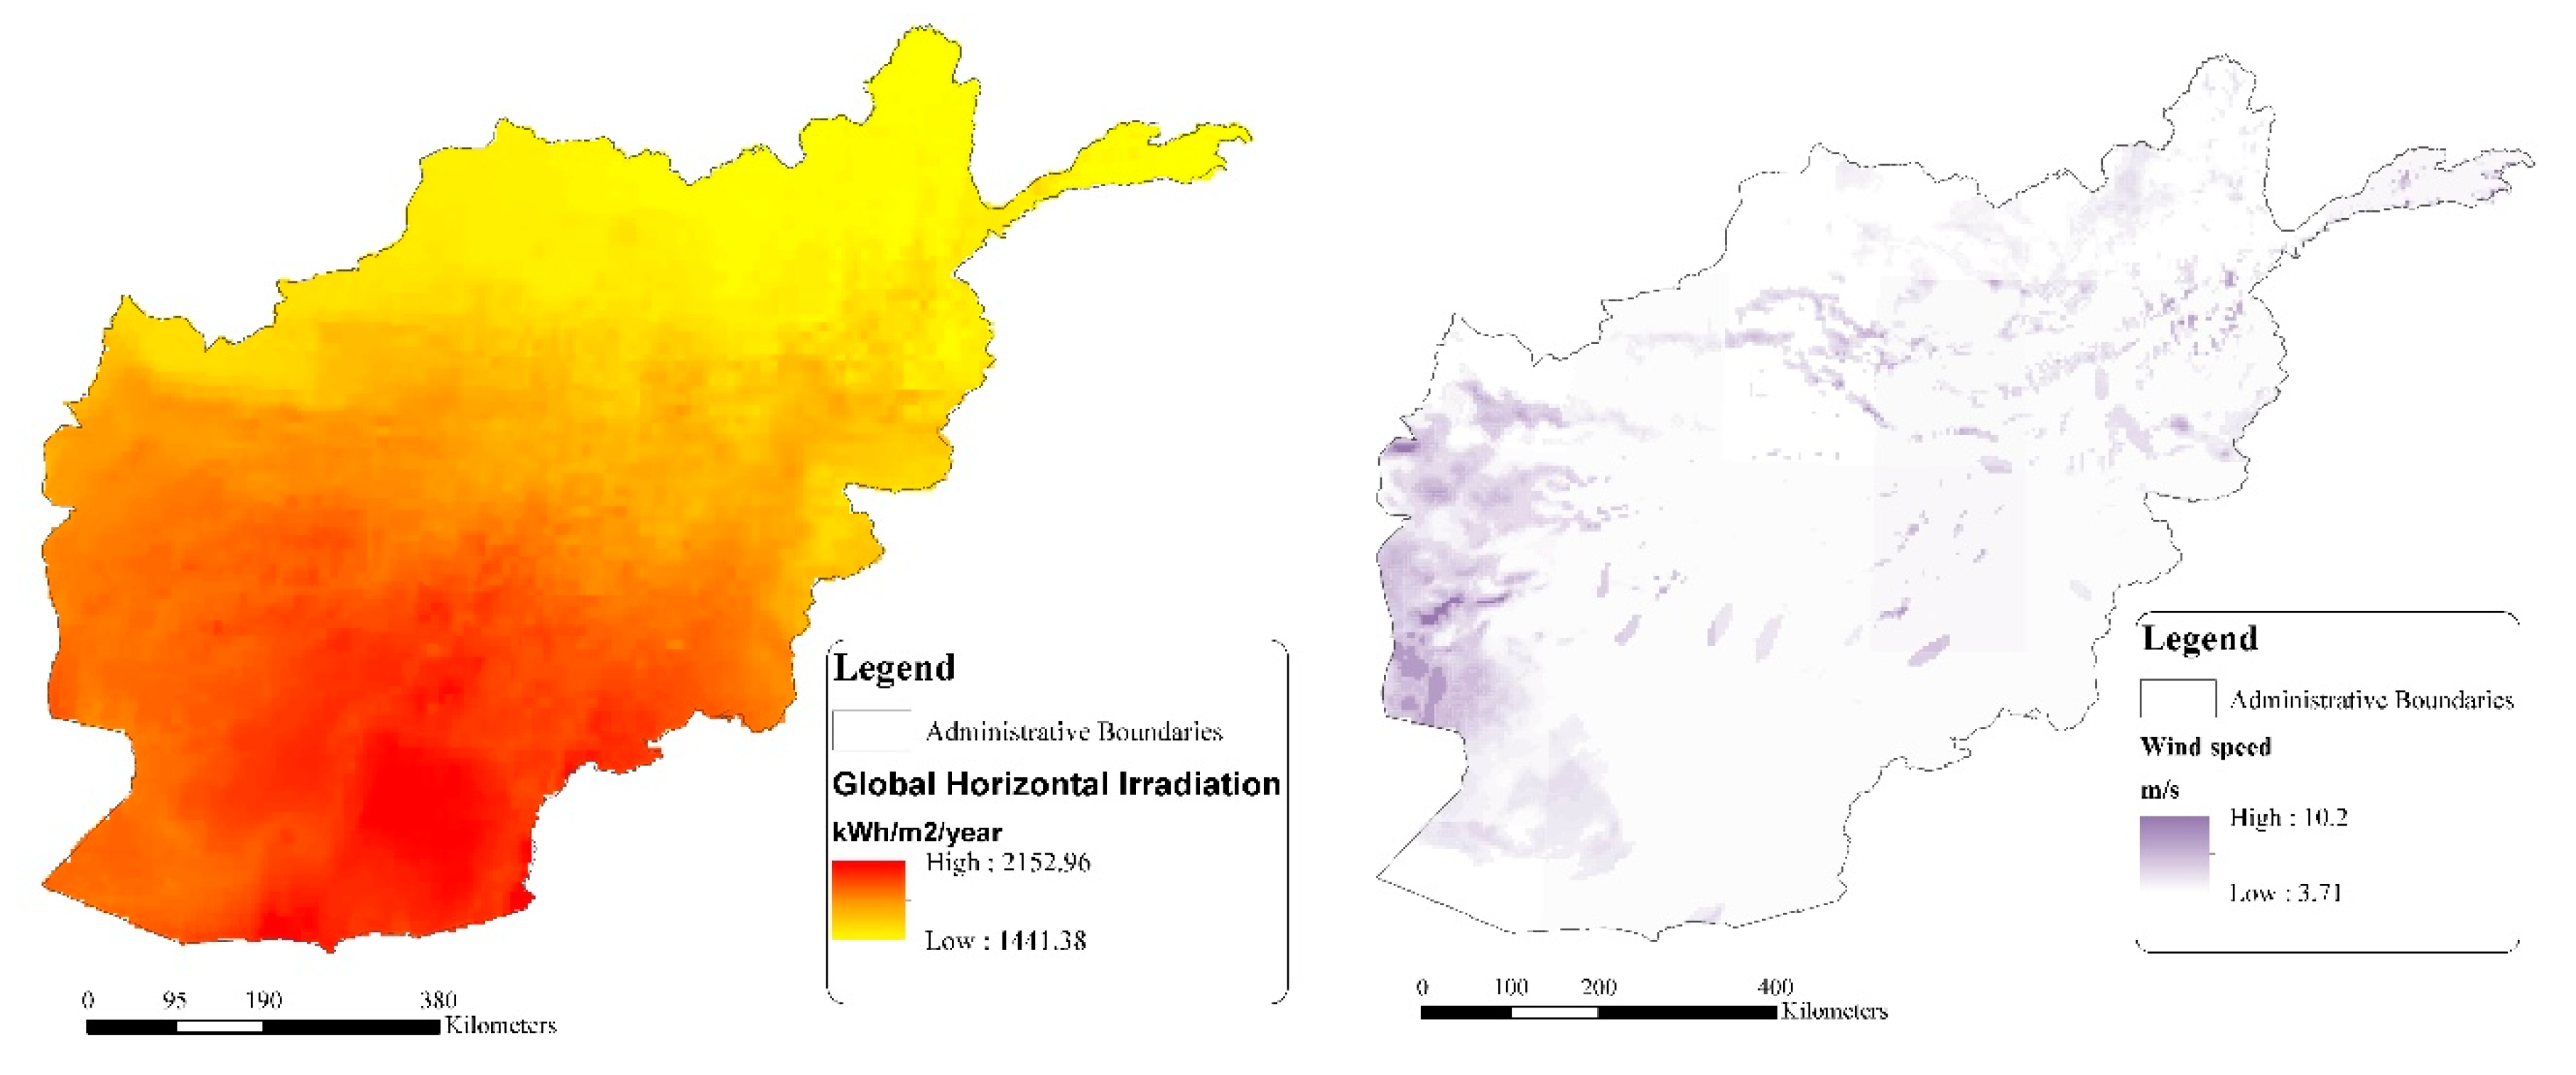
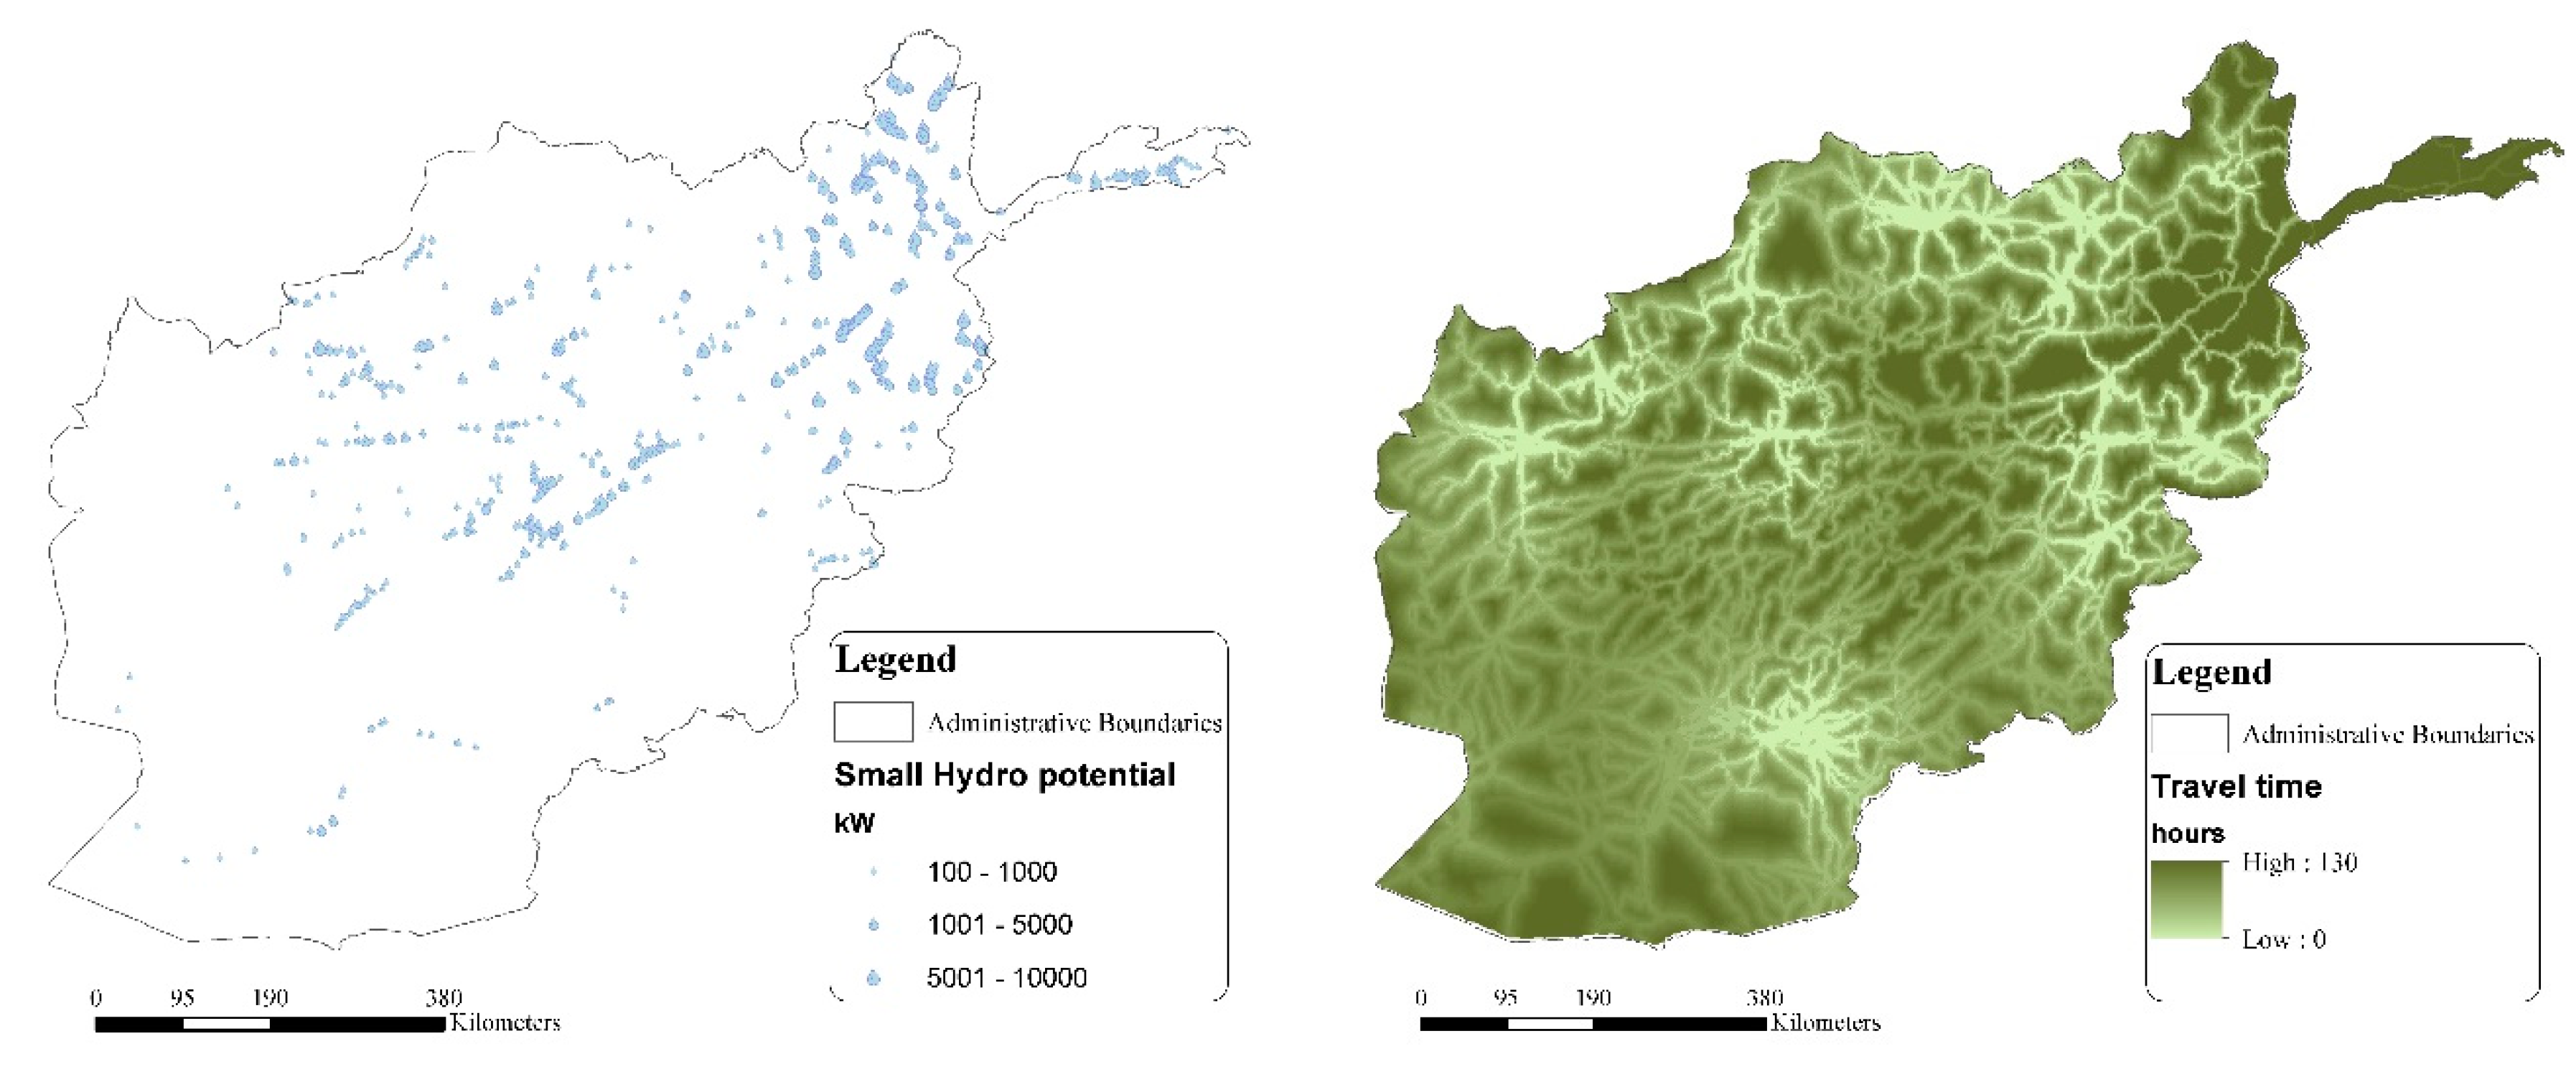
Appendix A.2. “Resource” Mapping


Appendix A.3. Techno-Economic Parameters
| Parameter | Cost Unit |
|---|---|
| High-voltage (HV) lines (~110 kV) | 120,000 USD/km |
| Medium-voltage lines (~20 kV) | 9000 USD/km |
| Low-voltage lines (~0.2 kV) | 5000 USD/km |
| MV/LV transformer (50 kVA) | 3500 USD/unit |
| Transmission losses | 18.3% |
| Connection cost per household | 122 USD |
| Cost of generating electricity | 0.077 USD/kWh |
| Capital investment per kW added | 1970 USD/kW |
| Plant Type | Plant Capacity (kW) | Investment Cost (USD/kW) | O&M Costs (% of Investment Cost/Year) | Fuel Price USD/Liter (Future Value) | Efficiency % | Capacity Factor | Life (Years) |
|---|---|---|---|---|---|---|---|
| Mini-grid Diesel generator | 100 | 1200 | 10.0 | 1.00 | 37 | 0.7 | 15 |
| Mini-grid Small scale hydro | 1000 | 2500 | 2.0 | - | - | 0.5 | 30 |
| Mini-grid Solar PV | 100 | 2600 | 1.8 | - | - | Obtained for each grid point depending on solar availability | 20 |
| Mini-grid Wind turbine | 100 | 2300 | 3.5 | - | - | Obtained for each grid point depending on wind availability | 20 |
| Stand-alone Diesel generator | 1 | 2000 | 10.0 | 1.00 | 28 | 0.5 | 10 |
| Stand-alone Solar PV | 0.4 | 5500 | 1.8 | - | - | Obtained for each grid point depending on solar availability | 15 |
- Portion of financing: 30% equity–70% debt
- Nominal cost of capital: 12% for equity (DABS)–15% for debt (estimate for high risk projects)
- Tax rate: 0% for equity–20% for debt
- Inflation rate–5% for equity (Afghanistan)–1.5% for debt
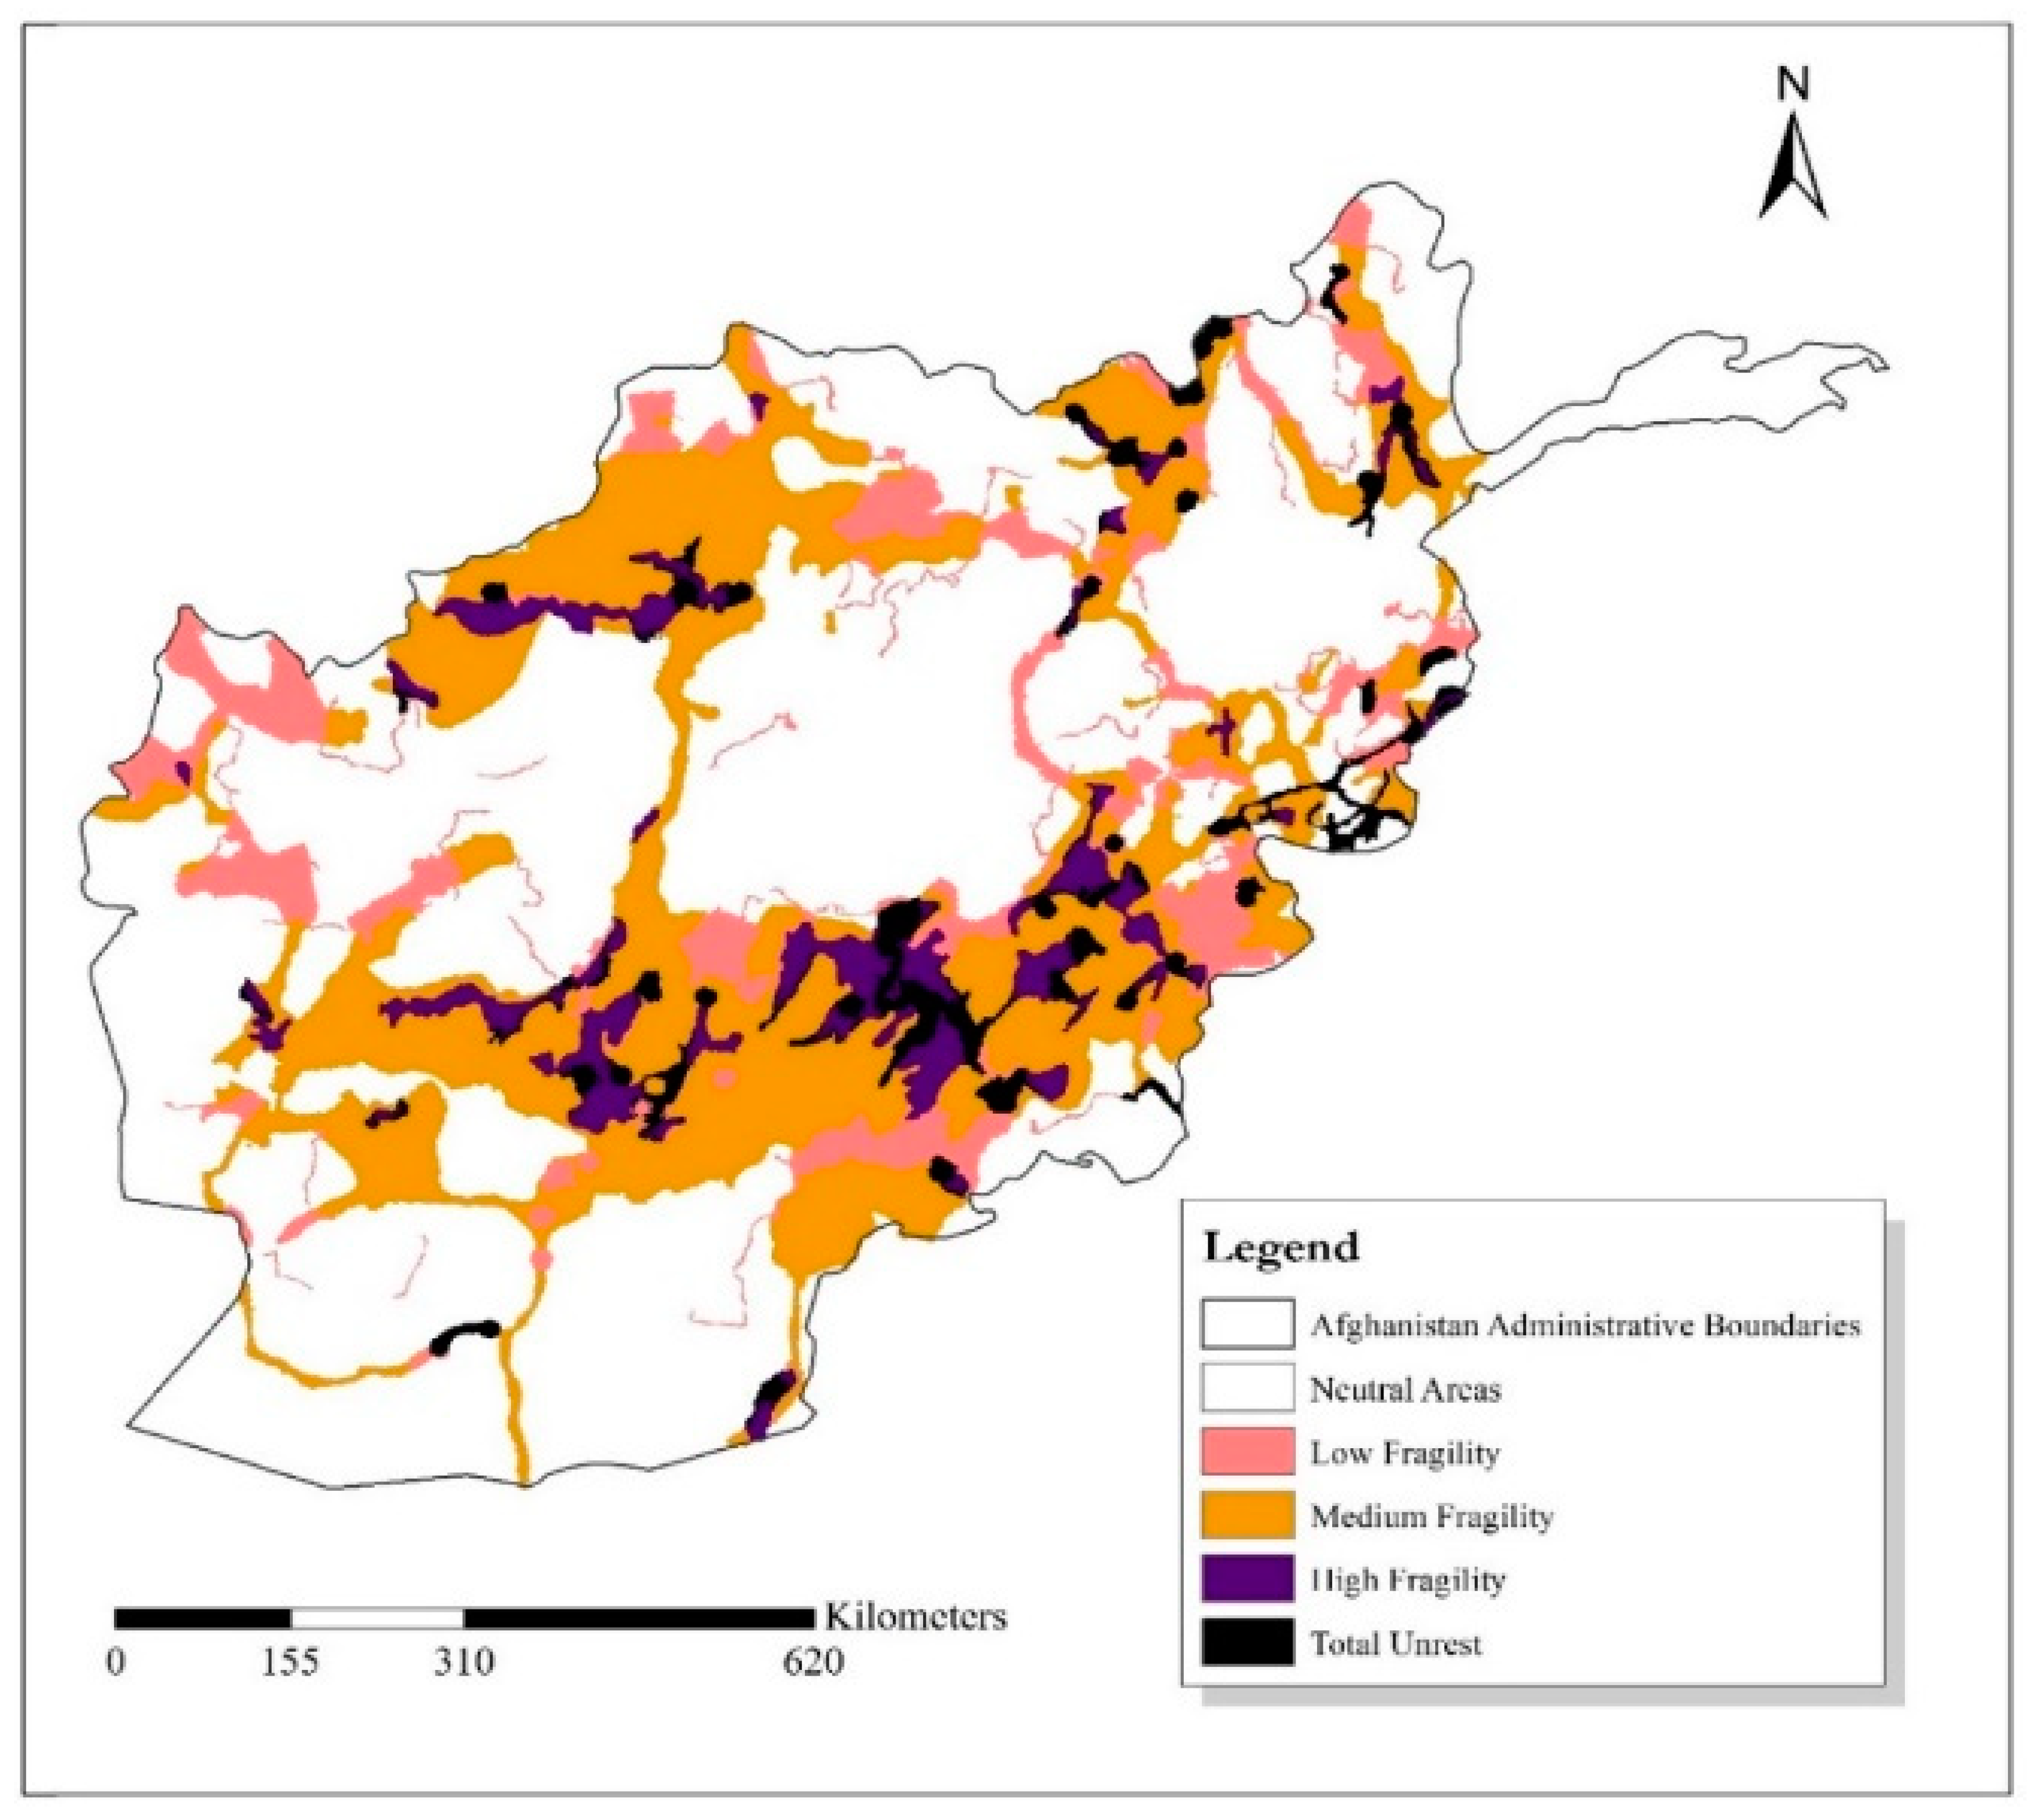
Appendix A.4. Fragility Information

Appendix B
| Baseline Scenario | Scenario A | Scenario B | Scenario C | |||||||||||||||||||
|---|---|---|---|---|---|---|---|---|---|---|---|---|---|---|---|---|---|---|---|---|---|---|
| Province name | Total Area | Fragile Area | Optimal Technology Mix (people) | Investment | Capacity | Optimal Technology Mix (people) | Investment | Capacity | Optimal Technology Mix (%) | Investment | Capacity | Optimal Technology Mix (%) | Investment | Capacity | ||||||||
| (sq. km) | (% of Total) | Grid | Mini-grid | Stand-alone | Million USD | MW | Grid | Mini-grid | Stand-alone | Million USD | MW | Grid | Mini-grid | Stand-alone | Million USD | MW | Grid | Mini-grid | Stand-alone | Million USD | MW | |
| Nimroz | 21,235 | 32.9% | 60,478 | 60,788 | 100,780 | 86.9 | 15.6 | 60,792 | 59,738 | 101,516 | 84.6 | 15.6 | 60,478 | 51,006 | 110,561 | 88.4 | 15.6 | 60,792 | 50,050 | 111,204 | 85.9 | 15.5 |
| Hilmand | 59,033 | 42.8% | 445,758 | 434,874 | 470,665 | 489.5 | 89.6 | 452,613 | 423,802 | 474,882 | 477.9 | 89.3 | 467,792 | 77,065 | 806,440 | 550.0 | 87.1 | 469,877 | 74,489 | 806,931 | 528.8 | 87.0 |
| Kandahar | 51,135 | 52.3% | 1,365,134 | 459,406 | 470,840 | 818.7 | 215.8 | 1,371,273 | 449,325 | 474,782 | 808.3 | 215.5 | 1,367,341 | 222,097 | 705,942 | 854.4 | 214.6 | 1,373,278 | 215,169 | 706,933 | 838.1 | 214.3 |
| Farah | 61,634 | 40.4% | - | 328,395 | 449,815 | 417.0 | 84.0 | - | 324,164 | 454,045 | 405.5 | 84.0 | - | 228,872 | 549,337 | 459.2 | 83.6 | - | 224,158 | 554,051 | 444.8 | 83.6 |
| Zabul | 22,292 | 91.1% | - | 299,969 | 192,610 | 234.9 | 43.9 | - | 292,697 | 199,882 | 230.3 | 43.9 | - | 6,036 | 486,543 | 276.8 | 42.7 | - | 5,209 | 487,370 | 262.4 | 42.7 |
| Paktika | 15,691 | 83.3% | - | 555,829 | 99,320 | 272.4 | 61.7 | - | 553,292 | 101,857 | 269.9 | 61.7 | - | 207,527 | 447,622 | 357.4 | 60.0 | - | 201,564 | 453,585 | 344.0 | 60.0 |
| Ghazni | 29,241 | 79.6% | 544,026 | 1,311,481 | 117,955 | 838.0 | 195.9 | 574,089 | 1,272,580 | 126,793 | 836.9 | 194.4 | 604,985 | 301,656 | 1,066,821 | 1097.7 | 188.4 | 614,360 | 288,374 | 1,070,728 | 1063.8 | 187.9 |
| Uruzgan | 16,630 | 100.0% | 343 | 442,495 | 109,231 | 244.3 | 49.6 | 343 | 437,319 | 114,407 | 241.4 | 49.5 | 343 | 59,812 | 491,914 | 302.9 | 47.8 | 343 | 56,935 | 494,791 | 288.7 | 47.8 |
| Hirat | 69,648 | 35.0% | 1,573,004 | 1,086,329 | 469,015 | 946.1 | 218.8 | 1,586,794 | 1,066,757 | 474,797 | 936.4 | 218.4 | 1,582,080 | 860,144 | 686,125 | 997.2 | 217.4 | 1,592,779 | 834,471 | 701,098 | 983.0 | 217.0 |
| Khost | 5,158 | 92.6% | - | 897,521 | 1,496 | 494.0 | 156.4 | - | 897,440 | 1,577 | 494.0 | 156.4 | - | 766,651 | 132,366 | 661.2 | 155.8 | - | 762,039 | 136,978 | 657.4 | 155.7 |
| Daykundi | 23,170 | 30.7% | - | 600,446 | 134,500 | 342.3 | 68.9 | - | 586,075 | 148,872 | 340.0 | 68.8 | - | 494,018 | 240,928 | 357.6 | 68.4 | - | 481,268 | 253,679 | 351.8 | 68.3 |
| Paktya | 8,316 | 88.1% | 124,602 | 761,021 | 7,698 | 343.9 | 83.6 | 135,876 | 748,802 | 8,643 | 344.3 | 83.0 | 185,806 | 513,088 | 194,427 | 431.3 | 79.5 | 190,459 | 505,191 | 197,670 | 424.5 | 79.2 |
| Ghor | 43,572 | 20.2% | - | 670,173 | 289,969 | 471.5 | 89.8 | - | 658,888 | 301,254 | 465.2 | 89.7 | - | 566,122 | 394,020 | 486.1 | 89.3 | - | 556,555 | 403,586 | 476.5 | 89.2 |
| Wardak | 11,912 | 42.9% | 118,533 | 631,061 | 25,218 | 322.6 | 73.4 | 173,987 | 574,128 | 26,698 | 322.1 | 70.5 | 246,281 | 317,634 | 210,897 | 389.1 | 63.8 | 253,633 | 312,353 | 208,826 | 382.0 | 63.5 |
| Logar | 4,989 | 69.0% | 319,984 | 301,771 | 976 | 292.3 | 70.4 | 333,544 | 288,062 | 1,125 | 306.5 | 69.7 | 332,413 | 137,735 | 152,582 | 424.1 | 69.1 | 333,073 | 136,162 | 153,496 | 423.6 | 69.0 |
| Nangarhar | 9,627 | 63.0% | 2,415,449 | 323,140 | 3,473 | 921.3 | 217.0 | 2,455,609 | 282,437 | 4,016 | 931.7 | 214.7 | 2,423,481 | 150,223 | 168,358 | 1136.9 | 215.7 | 2,440,259 | 132,464 | 169,339 | 1128.9 | 214.3 |
| Bamyan | 17,724 | 4.1% | - | 447,030 | 90,296 | 254.3 | 52.3 | - | 441,877 | 95,449 | 252.4 | 52.3 | - | 439,794 | 97,532 | 255.7 | 52.3 | - | 434,068 | 103,258 | 253.7 | 52.3 |
| Kabul | 5,758 | 52.0% | 8,308,540 | 76,075 | 4,496 | 1,227.2 | 457.6 | 8,310,416 | 73,741 | 4,954 | 1227.4 | 457.5 | 8,316,874 | 45,227 | 27,009 | 1239.8 | 457.0 | 8,317,734 | 43,873 | 27,504 | 1239.5 | 457.0 |
| Laghman | 4,907 | 40.8% | 467,193 | 194,751 | 2,113 | 187.8 | 38.3 | 478,334 | 183,490 | 2,233 | 188.5 | 37.7 | 499,477 | 122,415 | 42,164 | 208.5 | 36.5 | 510,316 | 111,389 | 42,352 | 207.9 | 35.9 |
| Badghis | 26,591 | 46.1% | - | 538,414 | 148,285 | 339.6 | 77.7 | - | 533,263 | 153,436 | 333.5 | 77.4 | - | 344,520 | 342,178 | 391.9 | 76.7 | - | 338,702 | 347,997 | 375.0 | 76.0 |
| Kunar | 6,191 | 62.6% | 21,372 | 761,495 | 3,022 | 382.9 | 111.8 | 38,344 | 743,984 | 3,562 | 383.2 | 110.8 | 400,944 | 259,101 | 125,845 | 471.8 | 71.6 | 400,089 | 249,886 | 135,914 | 425.0 | 69.8 |
| Parwan | 7,599 | 23.1% | 1,033,928 | 318,558 | 16,794 | 308.5 | 85.1 | 1,064,621 | 286,704 | 17,956 | 308.8 | 83.4 | 1,070,503 | 253,844 | 44,933 | 320.8 | 82.9 | 1,073,631 | 249,302 | 46,348 | 320.1 | 82.7 |
| Kapisa | 2,463 | 61.6% | 600,152 | 80,777 | 4,372 | 250.9 | 62.1 | 605,707 | 74,953 | 4,640 | 252.1 | 61.7 | 626,504 | 26,564 | 32,232 | 275.0 | 60.5 | 631,564 | 23,901 | 29,835 | 275.0 | 60.2 |
| Baghlan | 26,964 | 26.2% | 551,098 | 854,310 | 69,683 | 525.4 | 117.9 | 555,634 | 843,463 | 75,994 | 522.9 | 117.4 | 569,897 | 673,307 | 231,886 | 571.1 | 115.4 | 569,103 | 666,190 | 239,798 | 554.7 | 114.4 |
| Sari Pul | 20,010 | 41.6% | 157,713 | 596,282 | 88,679 | 349.5 | 75.4 | 172,420 | 575,777 | 94,476 | 347.9 | 74.6 | 176,593 | 441,930 | 224,150 | 405.8 | 73.6 | 202,085 | 404,439 | 236,149 | 401.3 | 72.0 |
| Nuristan | 11,499 | 35.3% | 964 | 175,851 | 85,510 | 137.9 | 27.0 | 1,629 | 174,664 | 86,032 | 135.3 | 26.9 | 1,086 | 114,432 | 146,807 | 152.5 | 26.7 | 3,756 | 109,513 | 149,056 | 147.1 | 26.3 |
| Panjshir | 4,504 | 0.0% | 6,112 | 139,640 | 21,784 | 76.1 | 16.6 | 8,480 | 137,037 | 22,019 | 75.5 | 16.5 | 6,112 | 139,640 | 21,784 | 76.1 | 16.6 | 7,272 | 138,245 | 22,019 | 75.5 | 16.6 |
| Faryab | 25,532 | 83.1% | 618,923 | 661,361 | 154,400 | 473.5 | 106.5 | 622,445 | 652,475 | 159,764 | 467.6 | 106.1 | 631,438 | 233,083 | 570,163 | 592.0 | 103.7 | 631,538 | 227,504 | 575,641 | 567.1 | 103.0 |
| Samangan | 14,318 | 30.3% | 74,215 | 417,411 | 38,080 | 242.1 | 50.9 | 77,399 | 410,943 | 41,364 | 240.6 | 50.6 | 86,401 | 298,619 | 144,686 | 268.4 | 49.6 | 90,435 | 290,435 | 148,836 | 264.5 | 49.3 |
| Badakhshan | 43,645 | 34.3% | - | 1,440,411 | 123,023 | 760.5 | 173.9 | - | 1,428,291 | 135,142 | 754.5 | 173.5 | - | 1,190,526 | 372,907 | 840.7 | 172.5 | - | 1,166,489 | 396,944 | 821.9 | 171.5 |
| Balkh | 21,601 | 30.7% | 1,386,421 | 598,604 | 47,722 | 521.6 | 130.4 | 1,406,003 | 566,060 | 60,684 | 516.6 | 128.5 | 1,401,737 | 499,299 | 131,711 | 563.0 | 129.0 | 1,418,115 | 469,253 | 145,380 | 555.0 | 127.2 |
| Takhar | 15,785 | 33.0% | 537,292 | 867,618 | 16,182 | 498.6 | 116.0 | 544,371 | 857,718 | 19,003 | 501.8 | 116.8 | 635,813 | 628,808 | 156,470 | 585.4 | 108.1 | 620,641 | 624,780 | 175,670 | 564.1 | 107.6 |
| Jawzjan | 15,136 | 60.4% | 479,786 | 287,616 | 71,621 | 281.3 | 57.6 | 497,454 | 268,769 | 72,801 | 280.0 | 56.4 | 523,866 | 144,543 | 170,615 | 339.4 | 54.3 | 538,516 | 122,935 | 177,573 | 335.1 | 53.2 |
| Kunduz | 10,276 | 80.8% | 1,347,553 | 178,091 | 22,632 | 292.4 | 62.0 | 1,362,909 | 161,102 | 24,265 | 289.1 | 60.5 | 1,365,469 | 86,677 | 96,129 | 359.2 | 60.2 | 1,363,324 | 80,129 | 104,822 | 343.1 | 58.9 |
| Afghanistan | 733,786 | 46.1% | 22,558,574 | 17,798,994 | 3,952,254 | 14,645.7 | 3553.0 | 22,891,088 | 17,329,814 | 4,088,919 | 14,572.5 | 3533.6 | 23,583,713 | 10,902,017 | 9,824,091 | 16,787.3 | 3445.7 | 23,706,975 | 10,587,483 | 10,015,363 | 16,409.9 | 3429.1 |
Appendix C


References
- Fuso Nerini, F.; Tomei, J.; To, L.S.; Bisaga, I.; Parikh, P.; Black, M.; Borrion, A.; Spataru, C.; Castán Broto, V.; Anandarajah, G.; et al. Mapping synergies and trade-offs between energy and the Sustainable Development Goals. Nat. Energy. 2018, 3, 10–15. [Google Scholar] [CrossRef]
- Ozturk, I. A literature survey on energy-growth nexus. Energy Policy 2010, 38, 340–349. [Google Scholar] [CrossRef]
- Cook, P. Infrastructure, rural electrification and development. Energy Sustain. Dev. 2011, 15, 304–313. [Google Scholar] [CrossRef]
- Bos, K.; Chaplin, D.; Mamun, A. Benefits and challenges of expanding grid electricity in Africa: A review of rigorous evidence on household impacts in developing countries. Energy Sustain. Dev. 2018, 44, 64–77. [Google Scholar] [CrossRef]
- International Energy Agency (IEA) and the World Bank. Sustainable Energy for All 2017—Progress toward Sustainable Energy; The World Bank: Washington, DC, USA, 2017. [Google Scholar] [CrossRef]
- The World Bank - Center of Conflict Security and Development (CCSD). Fragility, Conflict and Violence Overview. 2017. Available online: http://www.worldbank.org/en/topic/fragilityconflictviolence/overview (accessed on 6 November 2017).
- Gupta, S.; Clements, B.; Bhattacharya, R.; Chakravarti, S. Fiscal consequences of armed conflict and terrorism in low- and middle-income countries. Eur. J. Polit. Econ. 2004, 20, 403–421. [Google Scholar] [CrossRef]
- Bazilian, M.; Chattopadhyay, D. Considering power system planning in fragile and conflict states. Energy Sustain. Dev. 2016, 32, 110–120. [Google Scholar] [CrossRef][Green Version]
- Korkovelos, A.; Khavari, B.; Sahlberg, A.; Howells, M.; Arderne, C.; Korkovelos, A.; Khavari, B.; Sahlberg, A.; Howells, M.; Arderne, C. The Role of Open Access Data in Geospatial Electrification Planning and the Achievement of SDG7. An OnSSET-Based Case Study for Malawi. Energies 2019, 12, 1395. [Google Scholar] [CrossRef]
- The World Bank. Country Policy and Institutional Assessment, DataBank. 2017. Available online: http://databank.worldbank.org/data/reports.aspx?source=country-policy-and-institutional-assessment (accessed on 6 November 2017).
- The World Bank. Harmonized List of Fragile Situations. 2017. Available online: http://www.worldbank.org/en/topic/fragilityconflictviolence/brief/harmonized-list-of-fragile-situations (accessed on 6 November 2017).
- Mohamed, H. Pirates Seize Oil Tanker Off Coast of Somalia. New York Times. 2017. Available online: https://www.nytimes.com/2017/03/14/world/africa/pirates-somalia.html (accessed on 6 November 2019).
- Brisibe, P.; Akpan, U. Panic as Oil Theft, Illegal Refining Increase in Niger Delta, Vanguard News Niger. 2018. Available online: https://www.vanguardngr.com/2018/06/panic-oil-theft-illegal-refining-increase-niger-delta/ (accessed on 15 December 2018).
- Bhaumik, S. Why do China, India Back Myanmar over the Rohingya Crisis? South China Morning Post. 2017. Available online: https://www.scmp.com/week-asia/geopolitics/article/2115839/why-do-china-india-back-myanmar-over-rohingya-crisis (accessed on 6 November 2019).
- Villalon, C. Attacks on Colombia’s Energy Infrastructure, Stratfor|Worldview. 2012. Available online: https://worldview.stratfor.com/article/attacks-colombias-energy-infrastructure (accessed on 6 November 2019).
- South African History Online, ANC Attacks Koeberg Nuclear Power Station | South African History Online. 2011. Available online: https://www.sahistory.org.za/dated-event/anc-attacks-koeberg-nuclear-power-station-0 (accessed on 15 December 2018).
- National Consortium for the Study of Terrorism and Responses to Terrorism (START). Global Terrorism Database, Glob. Terror. Database—Data File. 2016. Available online: https://www.start.umd.edu/gtd (accessed on 25 April 2018).
- The International Energy Agency (IEA). Energy Access Database. 2017. Available online: https://www.iea.org/energyaccess/database/ (accessed on 6 November 2019).
- Central Statistics Organization (CSO). Afghanistan Living Conditions Survey 2016–2017, Kabul. 2018. Available online: www.cso.gov.af (accessed on 19 August 2019).
- The International Energy Agency (IEA). Energy Access Outlook 2017: From Poverty to Prosperity, International Energy Agency, Paris, France. 2017. Available online: https://www.iea.org/publications/freepublications/publication/WEO2017SpecialReport_EnergyAccessOutlook.pdf (accessed on 16 January 2019).
- National Consortium for the Study of Terrorism and Responses to Terrorism (START). Global Terrorism Database, Glob. Terror. Database. 2016. Available online: https://www.start.umd.edu/gtd/ (accessed on 8 December 2017).
- Yusta, J.M.; Correa, G.J.; Lacal-Arántegui, R. Methodologies and applications for critical infrastructure protection: State-of-the-art. Energy Policy 2011, 39, 6100–6119. [Google Scholar] [CrossRef]
- Rinaldi, S.M.; Peerenboom, J.P.; Kelly, T.K. Identifying, understanding, and analyzing critical infrastructure interdependencies. IEEE Control Syst. Mag. 2001, 21, 11–25. [Google Scholar] [CrossRef]
- Wieser, C.; Rahimi, I.; Redaelli, S. Afghanistan Poverty Status Update: Progress at Risk; World Bank: Washington, DC, USA, 2017; Available online: https://openknowledge.worldbank.org/handle/10986/26668 (accessed on 25 April 2018).
- Trotter, P.A.; Maconachie, R.; McManus, M.C. Solar energy’s potential to mitigate political risks: The case of an optimised Africa-wide network. Energy Policy 2018, 117, 108–126. [Google Scholar] [CrossRef]
- Asian Development Bank (ADB). Fichtner GmbH &Co. KG, Islamic Republic of Afghanistan: Power Sector Master Plan (Financed by the Japan Fund for Poverty Reduction), Stuttgart. 2013. Available online: https://www.adb.org/sites/default/files/project-document/76570/43497-012-afg-tacr.pdf (accessed on 26 April 2018).
- Zerriffi, H.; Dowlatabadi, H.; Strachan, N. Electricity and Conflict: Advantages of a Distributed System. Electr. J. 2002, 15, 55–65. [Google Scholar] [CrossRef]
- TOLOnews. Taliban Cuts Off Uzbekistan’s Electricity To Kabul. 2016. Available online: https://www.tolonews.com/afghanistan/taliban-cuts-uzbekistans-electricity-kabul (accessed on 6 November 2019).
- Burke, M.J.; Stephens, J.C. Political power and renewable energy futures: A critical review. Energy Res. Soc. Sci. 2018, 35, 78–93. [Google Scholar] [CrossRef]
- Pan, J.H.; Peng, W.Y.; Li, M.; Wu, X.Y.; Zerriffi, H.; Elias, B.; Zhang, C.; Victor, D. Rural Electrification in China 1950–2004: Historical Processes and Key Driving Forces; Center for Environmental Science and Policy at Stanford University: Califormia, CA, USA, 2006 26; Available online: https://pesd.fsi.stanford.edu/publications/rural_elec_china (accessed on 26 April 2018).
- Rommel, J.; Radtke, J.; von Jorck, G.; Mey, F.; Yildiz, Ö. Community renewable energy at a crossroads: A think piece on degrowth, technology, and the democratization of the German energy system. J. Clean. Prod. 2018, 197, 1746–1753. [Google Scholar] [CrossRef]
- Willis, K.G.; Garrod, G.D. Electricity supply reliability: Estimating the value of lost load. Energy Policy 1997, 25, 97–103. [Google Scholar] [CrossRef]
- De Nooija, M.; Koopmans, C.; Bijvoet, C. The value of supply security: The costs of power interruptions: Economic input for damage reduction and investment in networks. Energy Econ. 2007, 29, 277–295. [Google Scholar] [CrossRef]
- Praktiknjo, A.J.; Hähnel, A.; Erdmann, G. Assessing energy supply security: Outage costs in private households. Energy Policy 2011, 39, 7825–7833. [Google Scholar] [CrossRef]
- Månsson, A.; Johansson, B.; Nilsson, L.J. Assessing energy security: An overview of commonly used methodologies. Energy 2014, 73, 1–14. [Google Scholar] [CrossRef]
- Küfeoğlu, S.; Lehtonen, M. Comparison of different models for estimating the residential sector customer interruption costs. Electr. Power Syst. Res. 2015, 122, 50–55. [Google Scholar] [CrossRef]
- Löschel, A.; Moslener, U.; Rübbelke, D.T.G. Indicators of energy security in industrialised countries. Energy Policy 2010. [Google Scholar] [CrossRef]
- Farrell, A.E.; Zerriffi, H.; Dowlatabadi, H. Energy Infrastructure and Security. Annu. Rev. Environ. Resour. 2004, 29, 421–469. [Google Scholar] [CrossRef]
- Aven, T. A unified framework for risk and vulnerability analysis covering both safety and security. Reliab. Eng. Syst. Saf. 2007, 92, 745–754. [Google Scholar] [CrossRef]
- Zerriffi, H.; Dowlatabadi, H.; Farrell, A. Incorporating stress in electric power systems reliability models. Energy Policy 2007, 35, 61–75. [Google Scholar] [CrossRef]
- Santos, M.J.; Araújo, M. A methodology to incorporate risk and uncertainty in electricity power planning. Energy 2016, 115, 1400–1411. [Google Scholar] [CrossRef]
- Siddiqui, A.; Fleten, S.-E. How to proceed with competing alternative energy technologies: A real options analysis. Energy Econ. 2010, 32, 817–830. [Google Scholar] [CrossRef]
- Fernandes, B.; Cunha, J.; Ferreira, P. The use of real options approach in energy sector investments. Renew. Sustain. Energy Rev. 2011, 15, 4491–4497. [Google Scholar] [CrossRef]
- Soroudi, A.; Amraee, T. Decision making under uncertainty in energy systems: State of the art. Renew. Sustain. Energy Rev. 2013, 28, 376–384. [Google Scholar] [CrossRef]
- Ioannou, A.; Angus, A.; Brennan, F. Risk-based methods for sustainable energy system planning: A review. Renew. Sustain. Energy Rev. 2017, 74, 602–615. [Google Scholar] [CrossRef]
- Sovacool, B.K. Security of energy services and uses within urban households. Curr. Opin. Environ. Sustain. 2011, 3, 218–224. [Google Scholar] [CrossRef]
- Laldjebaev, M.; Morreale, S.J.; Sovacool, B.K.; Kassam, K.-A.S. Rethinking energy security and services in practice: National vulnerability and three energy pathways in Tajikistan. Energy Policy 2018, 114, 39–50. [Google Scholar] [CrossRef]
- Mainali, B.; Pachauri, S.; Rao, N.D.; Silveira, S. Assessing rural energy sustainability in developing countries. Energy Sustain. Dev. 2014, 19, 15–28. [Google Scholar] [CrossRef]
- Mandelli, S.; Brivio, C.; Colombo, E.; Merlo, M. A sizing methodology based on Levelized Cost of Supplied and Lost Energy for off-grid rural electrification systems. Renew. Energy 2016, 89, 475–488. [Google Scholar] [CrossRef]
- Shonali, P.; Aleh, C. Energy security and energy access: Distinct and interconnected challenges. Curr. Opin. Environ. Sustain. 2011, 3, 199–201. [Google Scholar] [CrossRef]
- Andersen, T.B.; Dalgaard, C.-J. Power outages and economic growth in Africa. Energy Econ. 2013, 38, 19–23. [Google Scholar] [CrossRef]
- Adenikinju, A.F. Electric infrastructure failures in Nigeria: A survey-based analysis of the costs and adjustment responses. Energy Policy 2013, 31, 1519–1530. [Google Scholar] [CrossRef]
- Minnaar, U.J.; Visser, W.; Crafford, J. An economic model for the cost of electricity service interruption in South Africa. Util. Policy 2017, 48, 41–50. [Google Scholar] [CrossRef]
- Oseni, M.O.; Pollitt, M.G. A firm-level analysis of outage loss differentials and self-generation: Evidence from African business enterprises. Energy Econ. 2015, 52, 277–286. [Google Scholar] [CrossRef]
- Patankar, N.; de Queiroz, A.R.; DeCarolis, J.F.; Bazilian, M.D.; Chattopadhyay, D. Building conflict uncertainty into electricity planning: A South Sudan case study. Energy Sustain. Dev. 2019, 49, 53–64. [Google Scholar] [CrossRef]
- Spyrou, E.; Hobbs, B.F.; Bazilian, M.D.; Chattopadhyay, D. Planning power systems in fragile and conflict-affected states. Nat. Energy 2019, 4, 300–310. [Google Scholar] [CrossRef]
- Korkovelos, A.; Bazilian, M.; Mentis, D.; Howells, M. A GIS Approach to Planning Electrification in Afghanistan; World Bank Group: Washington, DC, USA, 2017; Available online: https://energypedia.info/wiki/File:A_GIS_approach_to_electrification_planning_in_Afghanistan.pdf (accessed on 16 June 2017).
- Mentis, D.; Howells, M.; Rogner, H.; Korkovelos, A.; Arderne, C.; Zepeda, E.; Siyal, S.; Taliotis, C.; Bazilian, M.; de Roo, A.; et al. Lighting the World: The first application of an open source, spatial electrification tool (OnSSET) on Sub-Saharan Africa. Environ. Res. Lett. 2017, 12. [Google Scholar] [CrossRef]
- Moksnes, N.; Korkovelos, A.; Mentis, D.; Howells, M. Electrification pathways for Kenya-linking spatial electrification analysis and medium to long term energy planning. Environ. Res. Lett. 2017, 12. [Google Scholar] [CrossRef]
- Mentis, D.; Andersson, M.; Howells, M.; Rogner, H.; Siyal, S.; Broad, O.; Korkovelos, A.; Bazilian, M. The benefits of geospatial planning in energy access—A case study on Ethiopia. Appl. Geogr. 2016, 72, 1–13. [Google Scholar] [CrossRef]
- Szabó, S.; Bódis, K.; Huld, T.; Moner-Girona, M. Sustainable energy planning: Leapfrogging the energy poverty gap in Africa. Renew. Sustain. Energy Rev. 2013, 28, 500–509. [Google Scholar] [CrossRef]
- Szabó, S.; Bódis, K.; Huld, T.; Moner-Girona, M. Energy solutions in rural Africa: Mapping electrification costs of distributed solar and diesel generation versus grid extension. Environ. Res. Lett. 2011, 6, 034002. [Google Scholar] [CrossRef]
- Moner-Girona, M.; Bódis, K.; Huld, T.; Kougias, I.; Szabó, S. Universal access to electricity in Burkina Faso: Scaling-up renewable energy technologies. Environ. Res. Lett. 2016, 11, 084010. [Google Scholar] [CrossRef]
- Trotter, P.A.; McManus, M.C.; Maconachie, R. Electricity planning and implementation in sub-Saharan Africa: A systematic review. Renew. Sustain. Energy Rev. 2017, 74, 1189–1209. [Google Scholar] [CrossRef]
- Waissbein, O.; Glemarec, Y.; Bayraktar, H.; Schmidt, T.S. De-Risking Renewable Energy Investment: A Framework to Support Policy Makers in Selecting Public Investments to Promote Renewable Energy Investment in Developing Countries; OSTI.GOV: New York, NY, USA, 2013; Available online: http://www.undp.org/content/undp/en/home/librarypage/environment-energy/low_emission_climateresilientdevelopment/derisking-renewable-energy-investment.html (accessed on 26 April 2018).
- Aldersey-Williams, J.; Rubert, T. Levelised cost of energy—A theoretical justification and critical assessment. Energy Policy 2019, 124, 169–179. [Google Scholar] [CrossRef]
- Schmidt, T.S. Low-carbon investment risks and de-risking. Nat. Clim. Chang. 2014, 4, 237–239. [Google Scholar] [CrossRef]
- Procasky, W.J.; Ujah, N.U. Terrorism and its impact on the cost of debt. J. Int. Money Financ. 2016, 60, 253–266. [Google Scholar] [CrossRef]
- MengYun, W.; Imran, M.; Zakaria, M.; Linrong, Z.; Farooq, M.U.; Muhammad, S.K. Impact of terrorism and political instability on equity premium: Evidence from Pakistan. Phys. A Stat. Mech. Its Appl. 2018, 492, 1753–1762. [Google Scholar] [CrossRef]
- Sell, A. Inflation: Does it matter in project appraisal? Proj. Apprais. 1997, 12, 107–118. [Google Scholar] [CrossRef]
- Mswane, L.M.; Gaunt, C.T. Lightning performance improvement of the Swaziland electricity board transmission system (66kV & amp; 132kV lines)—Results of the pilot project. In 2005 IEEE Power Engineering Society Inaugural Conference and Exposition in Africa; IEEE: Piscataway, NJ, USA, 2005; pp. 364–370. [Google Scholar] [CrossRef]
- The World Bank. Access to Electricity (% of population) | Data. 2017. Available online: http://data.worldbank.org/indicator/EG.ELC.ACCS.ZS (accessed on 16 June 2017).
- Amin, M.; Bernell, D. Power sector reform in Afghanistan: Barriers to achieving universal access to electricity. Energy Policy 2018, 123, 72–82. [Google Scholar] [CrossRef]
- The World Bank. Afghanistan Renewable Energy Development Issues and Options; World Bank: Washington, DC, USA, 2018; Available online: https://openknowledge.worldbank.org/handle/10986/30270 (accessed on 20 August 2019).
- Danish, M.S.S.; Sabory, N.R.; Danish, S.M.S.; Ludin, G.A.; Yona, A.; Senjyu, T. An Open-door Immature Policy for Rural Electrification: A Case Study of Afghanistan. Int. J. Sustain. Green Energy 2016, 6, 8–13. [Google Scholar] [CrossRef]
- Kemausuor, F.; Adkins, E.; Adu-Poku, I.; Brew-Hammond, A.; Modi, V. Electrification planning using Network Planner tool: The case of Ghana. Energy Sustain. Dev. 2014, 19, 92–101. [Google Scholar] [CrossRef]
- Research and Development Solutions LLC, Recommended Project Finance Structures for the Economic Analysis of Fossil-Based Energy Projects. 2008. Available online: https://www.netl.doe.gov/energy-analyses/pubs/Project Finance Parameters-Final Report-Sept 2008_1.pdf (accessed on 15 May 2018).
- Kosai, S.; Yamasue, E. Cost-security analysis dedicated for the off-grid electricity system. Renew. Energy 2018, 115, 871–879. [Google Scholar] [CrossRef]
- Moner-Girona, M.; Ghanadan, R.; Solano-Peralta, M.; Kougias, I.; Bódis, K.; Huld, T.; Szabó, S. Adaptation of Feed-in Tariff for remote mini-grids: Tanzania as an illustrative case. Renew. Sustain. Energy Rev. 2016, 53, 306–318. [Google Scholar] [CrossRef]
- Energydata.info. 2018. Available online: https://energydata.info/dataset?q=afghanista (accessed on 10 January 2019).
- KTH Royal Institute of Technology. Github: OnSSET Afghanistan Least Cost Model. 2018. Available online: https://github.com/KTH-dESA/PyOnSSET/tree/master/Afghanistan_ PyOnSSET (accessed on 10 January 2019).
- Bhatia, M.; Angelou, N. Beyond Connections—Energy Access Redefined; ESMAP: Washington, DC, USA, 2015. [Google Scholar]
- The World Bank. Population, Total | Data. 2015. Available online: https://data.worldbank.org/indicator/SP.POP.TOTL?locations=AF (accessed on 9 May 2018).
- United Nations | DESA Population Division, World Population Prospects—Population Division—United Nations, (n.d.). Available online: https://esa.un.org/unpd/wpp/ (accessed on 18 January 2019).
- Central Statistics Organization (CSO). Demographics and Social Statistics. 2015. Available online: http://cso.gov.af/en/page/demography-and-socile-statistics/demograph-statistics/3897111 (accessed on 9 May 2018).
- Ellis, P.; Roberts, M. Leveraging Urbanization in South Asia: Managing Spatial Transformation for Prosperity and Livability; The World Bank: Washington, DC, USA, 2015. [Google Scholar] [CrossRef]
- Mentis, D.; Hermann, S.; Howells, M.; Welsch, M.; Siyal, S.H. Assessing the technical wind energy potential in africa a GIS-based approach. Renew. Energy 2015, 83, 110–125. [Google Scholar] [CrossRef]
- Korkovelos, A.; Mentis, D.; Siyal, S.; Arderne, C.; Rogner, H.; Bazilian, M.; Howells, M.; Beck, H.; De Roo, A. A Geospatial Assessment of Small-Scale Hydropower Potential in Sub-Saharan Africa. Energies 2018, 11, 3100. [Google Scholar] [CrossRef]
- The Office of the Deputy Minister for Policy. National Energy Supply Program. 2012. Available online: http://policymof.gov.af/infrastructure-development-cluster/national-energy-supply-program/ (accessed on 9 May 2018).
- International Energy Agency. World Energy Outlook. 2016. Available online: https://www.oecd-ilibrary.org/docserver/weo-2016-en.pdf?expires=1526052654&id=id&accname=oid023441&checksum=BDF0D40E70881737D0D0182D4A1678A6 (accessed on 11 May 2018).
- Asian Development Bank. Energy Supply Improvement Investment Program (Formerly Multitranche Financing Facility II: Energy Development 2014–2023) | Economic and Financial Analysis, n.d. Available online: https://www.adb.org/sites/default/files/linked-documents/47282-001-efa.pdf (accessed on 15 May 2018).
- Institute for the Study of War (ISW). Afghanistan Partial Thread Assessment. 2016. Available online: http://www.understandingwar.org/afghanistan (accessed on 9 May 2018).


| Herat Province | Helmand Province |
|---|---|
|
|
| Fragility Index | Cost of Equity Capital | Beta for Security (βf) | Cost of Debt Capital | WACCra (Discount Rate) |
|---|---|---|---|---|
| All Technologies | All Technologies | All Technologies | All Technologies | |
| Total unrest | 12.0% | 1.60 | 24.0% | 17.1% |
| High fragility | 12.0% | 1.45 | 21.8% | 15.8% |
| Medium fragility | 12.0% | 1.30 | 19.5% | 14.5% |
| Low fragility | 12.0% | 1.15 | 17.3% | 13.3% |
| Neutral fragility | 12.0% | 1.00 | 15.0% | 12.0% |
| Fragility Index | Risk Premium (% of Initial Value) | |||||
|---|---|---|---|---|---|---|
| Grid and Mini-Grids | Stand-Alone Systems | |||||
| Capital Cost SAF | O&M Cost SAF | Fuel Cost SAF | Capital Costs SAF | O&M Costs SAF | Fuel Costs SAF | |
| Total unrest | +100% | +100% | +100% | +0% | +0% | +100% |
| High fragility | +60% | +60% | +60% | +0% | +0% | +60% |
| Medium fragility | +39% | +39% | +39% | +0% | +0% | +39% |
| Low fragility | +18% | +18% | +18% | +0% | +0% | +18% |
| Neutral fragility | +0% | +0% | +0% | +0% | +0% | +0% |
© 2020 by the authors. Licensee MDPI, Basel, Switzerland. This article is an open access article distributed under the terms and conditions of the Creative Commons Attribution (CC BY) license (http://creativecommons.org/licenses/by/4.0/).
Share and Cite
Korkovelos, A.; Mentis, D.; Bazilian, M.; Howells, M.; Saraj, A.; Fayez Hotaki, S.; Missfeldt-Ringius, F. Supporting Electrification Policy in Fragile States: A Conflict-Adjusted Geospatial Least Cost Approach for Afghanistan. Sustainability 2020, 12, 777. https://doi.org/10.3390/su12030777
Korkovelos A, Mentis D, Bazilian M, Howells M, Saraj A, Fayez Hotaki S, Missfeldt-Ringius F. Supporting Electrification Policy in Fragile States: A Conflict-Adjusted Geospatial Least Cost Approach for Afghanistan. Sustainability. 2020; 12(3):777. https://doi.org/10.3390/su12030777
Chicago/Turabian StyleKorkovelos, Alexandros, Dimitrios Mentis, Morgan Bazilian, Mark Howells, Anwar Saraj, Sulaiman Fayez Hotaki, and Fanny Missfeldt-Ringius. 2020. "Supporting Electrification Policy in Fragile States: A Conflict-Adjusted Geospatial Least Cost Approach for Afghanistan" Sustainability 12, no. 3: 777. https://doi.org/10.3390/su12030777
APA StyleKorkovelos, A., Mentis, D., Bazilian, M., Howells, M., Saraj, A., Fayez Hotaki, S., & Missfeldt-Ringius, F. (2020). Supporting Electrification Policy in Fragile States: A Conflict-Adjusted Geospatial Least Cost Approach for Afghanistan. Sustainability, 12(3), 777. https://doi.org/10.3390/su12030777