Abstract
In this paper, a control approach for improving the overall efficiency of a wastewater treatment plant (WWTP) is presented. It consists of a cascaded control system that uses a global performance indicator as the controlled variable to drive the plant to operating conditions that satisfies trade-offs involved in the WWTP operation, improving the global performance of the plant. The selected global performance indicator is the N/E index that measures the ratio between the amount of nitrogenated compounds eliminated (kgN) and the energy (kWh) required to achieve that goal. This index links the variables of the activated sludge process with the energy consumed in the whole plant, thus the control strategy takes actions based on plantwide considerations. An external Proportional Integral (PI) controller changes the DO set point according to the N/E index and the basic dissolved oxygen (DO) control scheme in the activated sludge process follows this reference changes varying the aeration intensity. An outer loop with an event-based controller is used to compute the index values when the DO concentration is driven to excessively low limits, preventing long operation periods in this undesirable condition. Simple proportional integral controllers (PI) are used to adapt the strategy to the automation systems available in WWTPs. The implementation in the Benchmark Simulation Model 2 (BSM2) demonstrates the potential of the proposed approach. The results show the possibilities of the N/E index to be used as an indicator of global performance of WWTPs. It provides a link between water line objectives and energy consumption in the whole plant that can be exploited to introduce plantwide considerations in alternative control strategies formulated to drive the plant to operating conditions that optimize the overall process efficiency.
1. Introduction
Municipal wastewater treatment plants (WWTPs) are public benefit processes focused on the attainment of environmental objectives rather than economic benefits. Removing pollutants from wastewater entails consumption of energy, use of chemicals, and treatment of sludge in excess, which are operating expenses that cannot be compensated with economic profitable products. In addition, the operation of a WWTP involves environmental impacts such as direct emissions of greenhouse gases (GHG) from biological processes, indirect emissions of GHG from energy use (electricity and heating), and sludge disposed to land and toxicity of chemicals [1,2]. Such environmental costs affect process sustainability, which plays an important role in process management in the actual context. Therefore, even the effectiveness of pollution removal is the main goal of WWTP operation, and the appropriated management of resources and prevention of unnecessary emissions to air and soil must be considered to ensure the economic feasibility and the sustainability of WWTP operation. It means that operating conditions that satisfy the compromise between these conflicting objectives must be selected from the overall assessment of plant performance that considers the interaction between the different units and subsystems that comprise the plant (water line, sludge line, and gas line) [3,4,5].
A number of performance indicators have been defined to address the cost-effective operation and sustainability of WWTPs [4,6,7,8]. The impact of greenhouse (GHG) emissions associated with wastewater treatment has been introduced as an important factor in the evaluation of plant performance in [3,9], and Life Cycle Assessment (LCA) has been used to evaluate sustainable operation of WWTPs in [1,2,10] and integrated water systems in [8,11], providing a wider perspective for the evaluation of economic performance and sustainability in the operation of these processes. The available quantitative indicators of performance provide an instrument to carry out a comprehensive analysis of the impact of operating conditions on the efficiency of the plant. The analysis allows for measuring cause–effect relationships between different operating variables and identifying specific situations that need improvement. The information provided by different performance indicators and efficiency indices that measure and link different aspects of the operation make it possible to take process control decisions that produce an integral improvement of performance [4,8].
Different control strategies to improve the operation of WWTPs have been proposed in a significant number of works ([12,13,14,15,16,17,18], but the evaluation of performance and the optimization objectives, in the case of optimizing control strategies ([15,16,17,18]), concerns the quality of the effluent and economic aspects. Since pollution removal takes place in the activated sludge process (ASP) in the water line, the control strategies are applied to regulate dissolved oxygen (DO) in the aerobic zone or ammonium concentration in the effluent through manipulation of aeration intensity, and nitrates concentration in the anoxic zone. Few works are found in the literature ([5,19]) dealing with the implementation of control strategies to improve the overall performance of WWTPs introducing plantwide considerations. Moreover, few works [1,2] evaluate the effect of the control system performance considering its impact on the whole plant behavior in terms of economic and environmental costs. In this work, a control approach is proposed that uses a measure of global efficiency of the plant as the controlled variable with the aim of introducing some sense of optimization in the control actions addressing effluent quality goals and energy consumption in the whole plant. However, the consideration of efficiency as a controlled variable also affects operation costs and emissions of CO associated with energy use and biological processes.
Most of the works addressing the advanced control and optimization of WWTPs have employed recognized simulation platforms as Benchmark Simulation Model 1 (BSM1), Benchmark Simulation Model 2 (BSM2) and their modifications to test their strategies. The BSM2 [20] represents the water line and the sludge line of a typical municipal WWTP. It integrates the Benchmark Simulation Model 1 (BSM1) that represents the activated sludge process [21]. The BSM2 [20] is selected as the simulation platform for the evaluation of the proposed control strategy.
Optimization methods and advanced control strategies are barely used in real practice; such complex strategies are not attractive in an industry with economic limitations. Real WWTPs are run adopting reasonable compromise solutions between operation objectives based on operators expertise. The analysis of performance concentrates on energy consumption that is the most important factor affecting operation and environmental costs [8,22,23], and it is involved in the majority of the control actions. The regulation of the ASP variables is performed using the available control strategies: open-loop and simple ON–OFF and PI (Proportional Integral) feedback and feed-forward loops [20,21,24,25]. Some applications of advanced control strategies in real plants [26,27,28,29] and the development of decision support systems for WWTPs that uses online sensors and information from accessible data-bases to compute performance indicators associated with energy consumption [22,30] demonstrate that technical limitations to the implementation of control systems to improve the operation of WWTPs are being sorted out.
A typical municipal WWTP where activated sludge process (ASP) performs removal of nitrogenated compounds and organic matter is considered in this work; therefore, the efficiency index selected as a controlled variable is the ratio between the quantity of nitrogenated compounds eliminated in the activated sludge process (kgN) and the energy (kWh) required by the whole plant to eliminate that amount of nitrogenated compounds which is demoted N/E index ([31,32]). Thus, the index connects ASP process performance with energy consumption in the whole plant giving a holistic perspective to the control strategy. The manipulated variable to regulate the N/E index is the set-point for the dissolved oxygen (DO) concentration in the aerobic zone of the ASP. An upper level PI controller provides the DO set-points that produce the desired efficiency to the lower level DO control loop. The integration of existing DO control system and the use of simple PI controllers increases the possibilities of implementing the proposed approach in real WWTPs using the available online sensors, laboratory measurements, and automation systems.
One of the key points of the proposed control approach (N/E control strategy) is the implementation of an event-based control algorithm to avoid DO inadmissible values in the aerobic and N/E unreachable set-points. Due to the variable characteristics of the influent load and temperature, the biological capacity for nitrogen removal can be limited in some situations. In order to attain efficiency requirements given by N/E set-point when nitrogen removal capacity is limited, the use of energy is reduced leading DO set-point to their minimum values. The manipulated variable can be forced outside the recommended limits for a prolonged period producing deterioration of performance and unsafe conditions for a biological system. Then, an event-based control algorithm that adapts an N/E index set-point to reachable values when inadmissible DO values are detected is integrated into the control scheme.
The use of an integral performance indicator as a controlled variable is a contribution of this work that introduces a holistic perspective to control strategy, and the attainment of a desired of process efficiency has a positive impact of effluent quality, energy management, and emissions of CO. A comprehensive analysis of performance is carried out to compare existing PI based control strategies applied to WWTP and the proposed N/E control strategy. The evaluation of performance is carried out considering average values of performance indicators on an annual basis and dynamic evolution of selected indices along the operation period (one year). The selected indicators measure the characteristics affected by the evaluated control strategies treatment effectiveness, energy consumption, and CO emissions.
The rest of the paper is organized as follows. The WWTP system and the control schemes are described in Section 2, and global performance indicators are presented in Section 3. The evaluation of the existing WWTP control strategies is presented in Section 4. The proposed control strategy is described in Section 5. Section 6 is devoted to the comparison of the best existing WWTP control strategy and the best N/E control design, closing with some conclusions to the article.
2. Description of Process and Control Strategies
The Benchmark Simulation Model 2 (BSM2) is a standard simulation platform that represents the water line and the sludge line of a municipal WWTP that uses activated sludge process to perform biological nitrogen removal [33,34]. The BSM2 plant layout (Figure 1) includes, in the water line, a primary clarifier and the activated sludge process (ASP) for biological treatment. The sludge line comprises a thickener for the sludge in the excess from activated sludge process, an anaerobic digester to stabilize a mixture of the thickened sludge and sludge from primary clarifier and a dewatering unit. The liquids collected in the thickening and dewatering steps are stored and recycled ahead of the primary settler. The ASP is represented by a modification of the benchmark simulation model 1 (BSM1) ([21]) that consists of five biological reactors connected in series with internal nitrogen recycle flow (), sludge recycle flow (), and purge flow (). The BSM2 is designed for an influent flow of 20,648.36 m/d and a biodegradable chemical oxygen demand (COD) in the influent of 592.53 mg/L. The total volume of the bioreactor system is 12,000 m, 1500 m for each anoxic tank and 3000 m each aerobic tank.
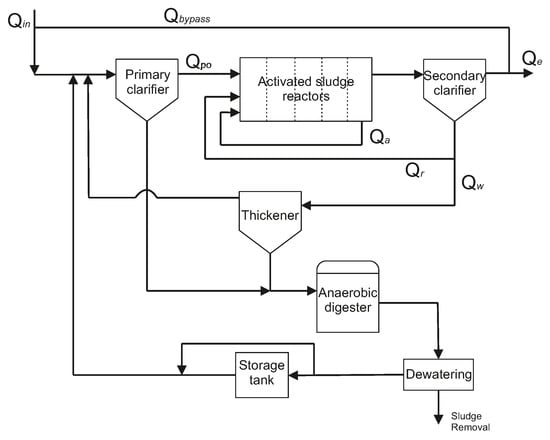
Figure 1.
BSM2 plant with notation used for flow rates.
The biological processes occurring in the activated sludge process reactors are described using 13 state variables and eight biological processes [21,35] by Activated Sludge Model 1 (ASM1), the clarifier is described using Tackacs model [36], and Anaerobic Digestion Model 1 (ADM1) is used for anaerobic digestion process [37].
The performance of biological treatments carried out in WWTPs is strongly affected by the frequent and large disturbances in the influent flow and load. Then, the BSM2 model includes a characteristic influent profile that describes daily flow rate dynamics (low rate at night, high rate during day time), weekend effects, holiday and seasonal effects and incorporates household and industrial pollutants. The average flow rate is 20,668 m/d, the maximum peak reaches 85,841 m/d, and the minimum is 5146 m/d. This is considered in the BSM2 influent profile that contains an average concentration of 52.2 g/m of total nitrogen and 592.2 g/m of COD (chemical oxygen demand). Sinus functions are used to describe daily and seasonal temperature variation, then a warm and a cold season are distinguished. The average temperature is 15 C, the highest values is 20 C, and the lowest is 10 C. A detailed description of dynamic influent profile generation can be found in [38]. The influent data describe an operation period of a year in a plant located in the Northern hemisphere starting July 1st. Data provided by simulation protocol describe 609 operation days with a sampling time of 15 min, but evaluation is performed using data from day 245 to day 609. Annual profiles of the characteristic influent variables, influent flow (Q), total nitrogen concentration (), COD concentration, and temperature (T) considering weekly average values are presented in (Figure 2).

Figure 2.
Weekly average values of characteristic influent variables in the operating horizon (one year): flow (), total nitrogen concentration (), COD concentration and temperature (T).
The effluent quality is usually described in terms of , ammonium , COD, S, TSS, and BOD concentrations. In the BSM2 model, these metrics are estimated considering the variables of the ASM1 model. The effluent quality requirements in BSM2 model are gN/m, COD gCOD/m, S gN/m, TSS gSS/m, BOD gBOD/m. Biological elimination of nitrogenated compounds and organic matter to reach those effluent quality levels takes place in ASP. In the nitrification process, nitrogenated compounds (mostly ammonium NH) are oxidized to nitrates as part of aerobic growth of autotrophic bacteria that depends on the availability of free dissolved oxygen in the system (DO). Nitrifiers growth follows Monod kinetics; it is minimal at DO levels below 0.5 g/m, then increases with DO concentration until maximum growth rate is reached approximately at DO levels of 2 g/m [24,39]. Oxygen demand depends on the load of wastewater to be treated, but nitrification is affected also by temperature and solids retention time (SRT). Nitrates () produced in the aerobic zone are transported to anoxic zone by internal recirculation () where denitrification process takes place by means of heterotroph microorganisms growth. Oxygen is taken from nitrates that are reduced to nitrogen gas (N) using organic matter as substrate.
2.1. Description of Operation and Control Strategies
The control actions in the WWTP are focused on the regulation of activated sludge process variables but interactions between different units of water and sludge line, and impact of influent disturbances must be considered to attain the optimal operating conditions from a global viewpoint. The control handles available in the ASP process are: the airflow rate, the internal recirculation (), the sludge recirculation (), the sludge purge flow (), and external carbon dosage () as manipulated variables. All of these control handles are represented in the BSM2 model, but the oxygen transfer coefficient (KLa) is used instead of airflow rate. The oxygen transfer coefficient (KLa) measures oxygen transfer efficiency in terms of air flow-rate, the dynamics of the air bubbles formation, and diffusion phenomena.
In practice, the most commonly used control structures using the mentioned control handles are:
- Dissolved oxygen control in the aerobic basin (DO control). The set-point for DO is given by the operator with values between 1.5–2 g/m, maximum growth rate is achieved at DO concentration of 2 g/m, and non-desirable reactions promoted by filamentous microorganisms can occur at the DO concentration below 1.5 g/m. In practice, a cascade scheme is implemented, the inner loop controls the airflow rate manipulating a valve position, and the external loop controls DO concentration manipulating the airflow rate. The time constant of the loop is about 30 min [24].
- Ammonium-based supervisory control. This control scheme is applied to reduce aeration costs or to reduce peaks of ammonium concentration in the effluent ([13]. An upper loop is added to the DO control scheme to compute DO set-points as a function of the measured ammonium concentration in the effluent ()). The set-point is selected between 1 g/m–4 g/m.
- Nitrates control in the anoxic zone. is used as manipulated variable for the closed loop regulation of , BSM1 platform ([21]) uses a set-point of 1 g/m. When external carbon source is required, carbon dosage () is used to regulate nitrates concentration . In practice, open loop control of nitrates is performed keeping the appropriated values of and .
- Open loop control of both recycle flows. The sludge age is regulated with purge flow (), since growth rate decreases with temperature is reduced in winter to increase the sludge age. The external recirculation () is used to regulate the Food to Microorganism Ratio (F:M); it is usual to maintain a equal to influent flowrate.
One of two, DO control or ammonium control, can be implemented combined with the other control strategies. Feed-forward control can be used also to reduce the effect of disturbances. The commented control strategies have been applied on the BSM2 platform ([1,2,5,19]). Figure 3 presents the block diagrams of these typical close loop strategies and their implementation in the BSM2 plant.

Figure 3.
Activated sludge process control schemes: DO control, cascade control, DO+NO control. Different colors are used to identify the control loops in blocks and process layout
The default operation strategy proposed in BSM2 plant includes:
- Feedback DO control in the aerobic zone manipulating directly the oxygen transfer coefficient KLa (the aeration equipment is not modeled in the simulator).
- Carbon dosage to improve nitrification: m added to the first reactor in the anoxic zone (An external source with a concentration of 40,000 g/m is used).
- Fixed values of internal and external recycle flowrate: m/d and m/d, computed to maintain the appropriated nitrates concentration levels in the anoxic zone and fed to the microorganism (F:M) ratio respectively.
- Sludge age regulation manipulating the purge flow: m/d in the warm season and m/d in the cold season.
DO control scheme (DO Default), in default BSM2 operation strategy, consists of a PI loop that regulates the DO concentration in the fourth aeration tank to a constant set-point of 2 g/m manipulating the oxygen transfer coefficient (KLa) of the three aerated reactors. KLa, for the 4th reactor is the controller output while KLa and KLa are calculated using a gain of 1 and 0.5 for the 3rd and 5th reactors, respectively.
In this work, the existing control strategies considered to evaluate their impact on overall plant performance in comparison with the proposed control strategy based on the control of the N/E index are:
- DO + NO control that combines the default DO control scheme and PI control of nitrates concentration in the anoxic zone () manipulating the internal recycle flow .
- Ammonium based supervisory control (Cascade) that controls the ammonium concentration in the 5th reactor () using an external PI loop that computes the DO set-point for the internal loop given by the DO default scheme. Two different set-points are considered for the cascade scheme, = 1 g/m for strict ammonium regulation (Cascade = 1), and = 4 g/m for relaxed ammonium regulation (Cascade = 4).
In both cases, strategies for carbon dosage, external recycle, and sludge age regulation are maintained as in default strategy. The internal recycle is kept constant with cascade control as in DO default control. The tuning parameters for the PI controllers can be found in [20] for DO controller, in [21] for nitrates controller and in [19] for the ammonium controller.
The control schemes implemented in the ASP of BSM2 plant are described in Figure 3.
2.2. Evaluation Criteria in BSM2
The BSM2 provides a performance assessment framework divided into two levels. The first level serves as a proof that the proposed control strategy has been applied properly using standard metrics of control performance [20]. The second level measures the effect of the control strategy on plant performance accounting for the percentage of time that the effluent limits are not met, the quality of the effluent using the Effluent Quality Index (EQI), and the operation costs using the Overall Cost Index (OCI).
The typical indicators of effluent quality total suspended solids (TSS), biological oxygen demand (BOD), chemical oxygen demand (COD), Kjeldahl nitrogen (), and total nitrogen concentration (N) are computed in BSM2 using the AM1 model variables obtained from simulations: soluble inert organic matter (), readily biodegradable substrate (), particulate inert organic matter (), slowly biodegradable substrate (), active heterotrophic biomass (), active autotrophic biomass (), particulate products arising from biomass decay (), nitrate, nitrite nitrogen (), , and NH Nitrogen (Ammonium) (), soluble biodegradable organic nitrogen (), particulate biodegradable organic nitrogen (). Subscript e is used to denote effluent:
Total suspended solids (TSS):
Biological oxygen demand (BOD):
Chemical oxygen demand (COD)
Kjeldahl nitrogen is the sum of ammonium and organic nitrogen in the effluent:
is calculated as the sum of S and Kjeldahl nitrogen:
The quality of the effluent and the influent are measured using EQI and IQI indices, respectively, that quantifies the amount of pollutants in the water and wastewater averaged over a 364-day observation period and are calculated weighting the different compounds of the effluent load.
EQI defined to evaluate the quality of the effluent is:
IQI is defined to evaluate the quality of the influent. Subscript i is used for influent:
where are weighting factors , , , , , and T is the total time in days.
The BSM2 platform measures the energy consumption using: Aeration energy (AE) that quantifies the amount of energy used for aeration in the ASP as a function of KLa, pumping energy (PE), which is the amount the energy used for pumping in the whole plant (is the summation of pumping energy of each unit), the mixing energy (ME) consumed in the whole plant, and the heating energy (HE) that is the energy required to maintain a temperature of 35 C in the anaerobic digester. These indices are described in [20].
Since anaerobic digester is self-sustainable, the net heating energy is computed assuming that 1 kg of methane (CH) produces 7 kWh of heat [20].
is the net heating energy:
where is the methane production in the anaerobic digester (kg CH/d).
The Overall Cost Index (OCI) is defined to evaluate the operation costs:
where is the sludge production to be disposed, is the consumption of external carbon source, and is the mixing energy.
BSM2 protocol performs an analysis of violations of desired limits of and ammonium (), , and suspended solids (SS) in the effluent in terms of percent of the operation period, frequency (occur), and days equivalent (days).
In the next section, the N/E index and other indicators of process performance are presented to be used for the evaluation of the overall performance of the plant under different control strategies.
3. Assessment of Global WWTP Performance
Methods and key performance indicators are available to address WWTP operation of WWTPs from a global perspective [1,6,7,8,10,23]. In [6], more than 80 performance indicators are presented as part of a performance assessment system for a cost-effective and sustainable management of wastewater services. In [23], an interesting review of performance assessment methods for monitoring and diagnosis of WWTP energy consumption is presented. In [7], some indicators to measure the efficiency of nitrogen removal and the carbon footprint of the removal process are described. On the other hand, Life Cycle Assessment (LCA) has been used to perform a comprehensive analysis of the environmental impact of WWTPs [1,2,10,11] considering different environmental indicators and functional units. An extension of the analysis to the integrated water system is presented in [8]. In practice and in the majority of the works, the main objectives of the analysis of performance are the energy efficiency and the minimization of emissions to water, air, and soil, although factors as maintenance, services, and personnel costs should be included [8].
Some of those available indicators are selected here for supervising and rating the effect of control actions on global efficiency of the plant. Energy consumption is the most important factor affecting operation and environmental costs, and pollution removal is the main objective of plant operation and the major contribution to energy use, then a sensible approach to address energy efficiency is the use of metrics that associate energy consumption and pollution removal [23]. When the objective of performance assessment is energy management, the ratio between energy consumption and pollution removal is considered [23] in this work; it is preferred to express the inverse relationship. Lower values index implies excessive requirement of energy and/or poor pollution elimination; on the contrary, the index increases when energy requirements are reduced and/or a large amount of nitrogenated compounds have been eliminated.
Specifically, an index that describes dynamically the efficiency of the nitrogen removal is selected to be used as an integral performance index; the N/E index describes the ratio between nitrogen removal (kgN) and energy required (kWh) to remove that amount of nitrogen providing a link between pollution elimination and energy consumption in the whole plant. Furthermore, the N/E index connects the water line with sludge line because the energy required in all the units (aeration energy, heating energy for digestion and pumping and mixing energy) is accounted for.
In this work, the dynamic N/E index is used for evaluation and for control purposes. As an N/E index is defined as an integral measure of performance, since nitrogen removal efficiency in terms of energy use has an impact on several aspects of WWTP operation such as operation costs, GHG emissions, organic matter removal, and frequency and amount of violations of desired effluent limits. Thus, the regulation of the N/E index to appropriate values in a close loop control scheme should improve the overall performance of the plant. Using such control approach, the DO set-point which is a critical variable of the activated sludge process is manipulated to produce operating conditions that improves pollution removal, reduce consumption of aeration energy and consequently decrease indirect GHG emissions on the basis of a controlled variable that provides information about the energy requirements of the whole plant to perform such actions.
The N/E index which is computed dynamically at each sampling time. It is described in terms of the BSM2 plant variables and performance indicators described in Section 2.2:
Modifications of and are used in this work to quantify nitrogen removal in ASP. and are the influent and effluent quality indices in terms of nitrogenated compounds:
where are weighting factors reported for (6) and T is the total time.
In order to complement the information provided by N/E index evolution, other efficiency indicators are considered to measure the effect of control actions on dynamic performance. Such indicators are the ratio between the amount of COD removed in ASP and the energy required (kWh) to remove that quantity of organic matter (R-COD/E), the treatment efficiency in terms of influent flow (D-TE), and the ratio between available COD and nitrogen in a given reactor i or stream (COD/N).
The COD removal efficiency is computed as:
where is given by Equation (3).
The treatment efficiency with respect to influent flow is:
where and are given by Equations (6) and (7).
The COD/N ratio is computed as the ratio between COD given by Equation (3) and total nitrogen given by Equation (5) in reactor i or in wastage flow ().
The annual average values of selected performance indicators are computed to carry out a comprehensive evaluation of plant performance under different control strategies. The indicators are chosen to measure the quality of the effluent, the efficiency of the treatment, the environmental costs of the treatment, and the economic aspects that have to be taken into account simultaneously to take decisions about the impact of control strategies from a multicriteria analysis. The selected indicators are described below:
Treatment efficiency is the ratio between the pollution removed in the activated sludge process and the pollution load in the influent. The treatment efficiency ():
Carbon dioxide emissions associated with biological processes: It is a measure of the ratio between the CO emissions produced in ASP and anaerobic digestion (AD) and the kg of pollution eliminated in ASP. In ASP, the growth of heterotrophs and decay of bacteria produces CO, but the growth of autotrophs consumes CO, the emissions are estimated using the reactions presented in [40] for the ASM1 model; CO generated by anaerobic digestion (CO) is computed by BSM2 platform:
Energy consumption: Two indicators are considered: the total energy consumed per m of treated wastewater and the net energy consumed per m of treated wastewater considering that biogas is used to supply heat to digester. The total energy consumption:
The net energy consumption:
External energy for aeration: Given that biogas is used to heat the digester, but excess biogas can be available for aeration assuming that 1 kg of CH produces 3.5 kWh of electricity:
Finally, the electricity consumption is used also as a performance indicator:
Radar plots are used to show the simultaneous impact of each control strategy on different performance indicators. The indicators are expressed to increase their values when the desired characteristic is worsened. The diagrams present the ratio between values of the indices for each strategy and the worst value obtained for the group of strategies that are being evaluated, therefore the maximum value of the indices in the plot is 1. The area of the polygons formed in the plots is used to compare the effect on global performance of the control strategies. Indicators used in radar plots decrease their value when they are improved, then strategies that improve simultaneously more indicators will produce smaller polygons.
In summary, the annual based indicators considered for the evaluation of overall performance using radar plots areas are:
- Electricity (Equation (20)) and pumping energy (PE) in the whole plant, aeration energy (AE), and external AE in ASP and HE in the digester to measure energy consumption; and TEQ and NEQ to compare net energy and required energy with respect to volume of treated water in a year.
- CO (Equation (16)) emissions relative to Nitrogen elimination as environmental impact metric.
- Overall cost index (OCI) to evaluate operation costs (Equation (9)).
An evaluation performance of existing PI based control strategies typically implemented in WWTPs is carried out using these sets of dynamic and annual-averaged performance indicators. The minimization of the area of the radar plots is used to deal with the multiple objectives involved in WWTP operation. This information has been used for the design of the proposed control approach based on the regulation of the N/E index. The best existing control strategy is compared with N/E index control approach performing a multicriteria analysis to evaluate its effect on the global WWTP efficiency.
4. Evaluation of Existing PI-Based Control Strategies
A comprehensive evaluation of performance of the WWTP under the PI (Proportional Integral) based control strategies typically implemented in a WWTP is carried out. The influence of control actions of control schemes, namely DO control (DO Default), DO control and nitrates control (DO + NO control), and supervisory ammonium based control (Cascade) on dynamic performance is addressed to detect critical situations that affect pollution removal efficiency and the COD/N ratio. Furthermore, the annual average performance indicators are computed and the multicriteria analysis carried out using the information provided by radar plots of performance indicators and the measurement of the area of the polygons corresponding to each strategy allow for determining the control strategy that produce the best performance from a global viewpoint.
Regarding dynamic behavior analysis, the observation of evolution of N/E and COD/E index along the operation period in Figure 4 and influent variations in Figure 2 make evident the influence of temperature and the effect of variations on load on removal efficiency of the plant. In the periods of lower temperature between weeks 20 and 35, the efficiency indices reach their minimum values. Microorganism growth rate is diminished due to temperature effect, then nitrification and denitrification processes that govern nitrogen and organic matter removal are slower while heating energy requirements of anaerobic digester increases. On the other hand, the oxygen consumption depends on the load of wastewater to be treated that varies over the day, then variations of the influent load due to frequent changes on , and COD concentration produce continuous variations on N/E and R-COD/E indices. However, it can be observed that temperature effect dominates the efficiency of the process. The evolution of the profiles of the N/E and R-COD/E index along the year is similar because organic matter is consumed as substrate by heterotrophic biomass as part of denitrification process.

Figure 4.
Weekly profiles of of N/E index (kgN/kWh) and R-COD/E (kgCOD/kWh) index for the existing control strategies.
Regarding the effect of control strategies, the objective of the implementation of ammonium based supervisory control scheme (Cascade) in real practice [27] is to reduce the use of energy for aeration, which is achieved varying DO set-point. Such reduction on aeration energy reflects as larger values of N/E and COD/E indices in the full operation period as observed in Figure 4, which means major efficiency. The evolution of D-TE, which is treatment efficiency with respect to influent flow, and COD/N ratio in the 2nd reactor is shown in Figure 5. In this case study, it is observed that sensitivity of D-TE index to control actions is significantly lower than N/E and COD/E indices, a minimal effect of control actions on pollution removal with respect to influent flow rate is appreciated, and temperature effect is unnoticed. The dynamic profile for COD/N ratio in the second reactor shows an effect of temperature, with lower values between weeks 20 and 35, and an effect of load variations. Larger values of COD/N ratio are attained with cascade schemes in the full operation period, which implies lower requirements of external carbon, so carbon dosage could be reduced when using such control strategies.
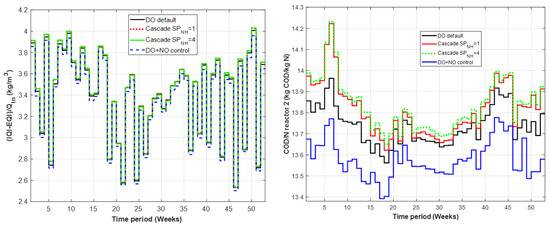
Figure 5.
Weekly profiles of lIQI-EQI/ (kg/m) index and COD/N ratio (gCOD/gN) in the 2nd reactor for the existing control strategies.
As a conclusion of the analysis of the dynamic performance, it is observed that cascade schemes improve pollution removal efficiency with respect to energy use and increases COD/N ratio in the anoxic reactor. Both characteristics represent potential improvements on energy efficiency of WWTPs and environmental impact. Reducing energy consumption implies lower indirect GHG emissions due to energy use, and higher COD/N ratios in the anoxic zone implies a reduction on carbon dosage that is a chemical additive. Moreover, both factors, energy consumption and external carbon source, affect operation costs. Temperature is important for the energetic efficiency of the operation; the indices that quantify energy effects on pollution removal are worsened in the periods of lower temperature, due to kinetic limitations on growth rate and the increased demand of energy from digester. It is important to indicate that the characteristic of cascade schemes that produce those benefits is the continuous variation of DO set-point, to levels below the 2 g/m imposed by DO default and DO+NO control strategies, which results in significant aeration energy savings. Such characteristic is exploited in the formulation of the control strategy proposed in this work. It is important to analyze the effect on DO dynamics of the control movements of cascade strategies, to provide insight of the effect of control actions on the nitrogen removal process that affects energetic efficiency.
Figure 6 shows DO set-points given by the different control strategies, and DO concentration in the 4th reactor of aerobic zone in representatives summer and winter weeks of the year. DO set-point of DO default and DO+NO control strategies is fixed on 2 g/m and DO concentration follows the reference very closely. On the other hand, the DO set-point with cascade schemes is continuously driven to the minimum values of the admissible range in the warmer week and effluent quality goals are attained. It could suggest that maintaining a fixed set-point of 2 g/m in the periods of higher temperature represents unnecessary consumption of energy for aeration. Nevertheless, maintaining DO concentration at their lowest levels as observed between days 272 and 275 in Figure 6 could produce performance deterioration and undesirable reactions [24]. In the winter week, a DO set-point with a cascade scheme exhibits continuous variations between its minimum and maximum admissible values, since lower temperatures make treatment more exigent. In this situation, the cascade scheme computes DO set-points over 2 g/m, which is also unnecessary, since the effect of DO levels above 2 g/m on nitrogen removal is minimal [13].

Figure 6.
N/E index profile in the warmest and coldest periods.
The analysis of performance using averaged values for the full operation period (one year) is carried out; the performance indicators computed for each strategy are reported in Table 1.

Table 1.
Performance indicators for the existing control strategies.
From an overview of performance indicators presented in Table 1, it is corroborated that cascade strategies improve energy efficiency of the WWTP. All the indicators associated with energy use, except pumping energy (PE) and heating energy (HE), are decreased with respect to DO default and DO+NO control strategies; as a consequence, operation costs, measured by OCI, are also reduced. The minimum PE value corresponds to DO+NO control strategy that reduces internal recycle flow to meet the desired nitrates’ reference. The control actions of existing ASP control schemes do not affect HE, which is the same in all cases; it is known that heating requirements of the digester are associated with temperature gradient. Even a slight difference is appreciated, CO emissions are also reduced by cascade strategies. Regarding effluent quality goals, EQI is improved by cascade schemes, violations are reduced in comparison with DO and DO+NO control, but ammonium violations are significantly increased in frequency and magnitude as ammonium set-point is relaxed; consequently, lower DO levels in aerobic reactors are admitted. Another difference observed when comparing cascade strategies with different set-points is that relaxed option improves energy indicators and OCI, but slightly increases EQI and frequency.
Radar plot that represents simultaneously the set of performance indicators of the existing control strategies is presented in Figure 7. The area of the polygon corresponding to each control strategy is reported in Table 1. The larger area corresponds to DO+NO strategy and the lower area corresponds to cascade strategy with ; this means that it is the control strategy that reduces in a larger amount, a larger number of performance indicators. Then, according to the proposed assessment method, cascade strategy with (Cascade ) produce the major improvement of performance from a holistic perspective.

Figure 7.
Radar plot of performance indicators for the existing control strategies.
It is observed that varying DO set-point to attain the desired values of ammonium concentration () produces an improvement of global performance. The information about DO dynamics given by Figure 8 is useful for the design of the proposed N/E control approach.

Figure 8.
DO set-point and DO concentration (g/m) in the 4th reactor in representative weeks of the warmest and coldest periods.
5. N/E Index Control Approach
The proposed process control approach uses the N/E index described in Section 3 as the controlled variable in a cascaded PI based strategy that uses the dissolved oxygen (DO) concentration in the aerobic zone of the ASP as the manipulated variable. As in the cascade control scheme for regulation of ammonium concentration, an external PI controller provides the DO set-point to the internal DO control loop, but, in this case, the DO set-points are computed considering a measure of the expected efficiency of the plant. Thus, the DO set-point implemented in aerobic reactors lead the plant to operating conditions that improve the ratio between ASP nitrogen removal efficacy and the energy required by the whole plant, which provides a holistic perspective as well as optimizing characteristics to control strategy.
A variable N/E set-point is considered to account for the effect of load and temperature variations. In order to introduce a sense of optimization to control actions, a range of variation of N/E set-point that improves the N/E efficiency observed with the typical strategies is applied to WWTPs. An event-based control algorithm determines N/E set-point movements, and the algorithm is formulated to avoid DO inadmissible values in the aerobic zone and unreachable N/E set-points. The block diagram representing the proposed strategy and the control scheme in the plant is presented in Figure 9. The external PI controller tuning is performed using the Internal Model Control (IMC) approach of [41]. A detailed description of controller tuning is presented in Appendix A.
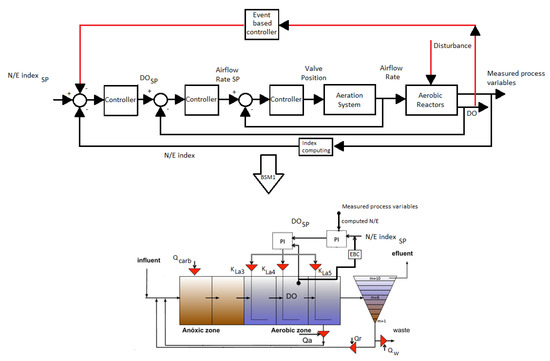
Figure 9.
Block diagram representing the proposed N/E control strategy.
The purpose of this work is to concentrate on the analysis of the effects of the N/E index using DO concentration as the only manipulated variable. The external carbon source control is one of the more effective ways of guaranteeing the availability of a carbon source, therefore ensuring the heterotrophic denitrification, but it is not considered in the proposed strategy. Then, external carbon dosage is maintained as in BSM2 strategy, and a constant is added to the first anoxic reactor.
In order to determine the appropriated algorithm to vary N/E set-point, the relation between N/E requirements and DO dynamics is evaluated considering fixed N/E set-points. When DO control, DO+NO control, and ammonium based cascade control strategies are applied, the N/E index ranges between 2.5 and 4.2 kgN/kWh for weekly average values (Figure 4) and the variation observed in representative summer and winter weeks (Figure 10) ranges between 9 kgN/KWh and 1 kgN/kWh, but peaks and valleys of N/E index values occur in a short time horizon, and the proposed strategy contemplates a larger time horizon. Therefore, the range of variation of N/E set-point is selected considering the weekly variations of N/E index. The maximum value observed in the weekly profile is 4.2 kgN/kWh, so N/E index set-point should be higher to improve efficiency; the possibility of increasing the maximum N/E value up to 4.5 kgN/kWh or to 5 kgN/kWh is considered.

Figure 10.
N/E index profile in the warmest and coldest periods.
The first step to design the event-based controller is to analyze the impact on manipulated variable of N/E index tracking considering constant set-points. Then, the behavior of DO set-points computed by external PI controller when implementing the proposed N/E control strategy for constant N/E set-points of 4.2 kgN/kWh, 4.5 kgN/kWh and to 5 kgN/kWh is observed. The range of admissible values for DO set-point in BSM2 platform is 0.5 to 4 g/m.
Figure 11 shows control movements under N/E control in representative winter and summer weeks. The first observation is that the trend of DO set-point movements to track the constant N/E reference in the warmer and colder season is opposite to that observed with the cascade scheme (Figure 8). DO set-points with frequent variations between 3.5 g/m and 0.5 g/m are computed in summer weeks with N/E control, while DO set-points with a cascade scheme in the same week tend to the minimum admissible values. The cascade scheme produces lower DO set-points because ammonium reference can be easily attained with lower DO requirements at higher temperatures. In the case of N/E control, the possibility of improving nitrogen removal at higher temperature is exploited increasing or decreasing aeration (i.e., DO set-points) when it affects positively N/E index. It is noticed that the peaks of set-point movements decrease as N/E reference increases. On the other hand, DO set-points tend to the minimum admissible values with N/E control in winter week, while cascade control varies DO set-points between 3.5 g/m and 0.5 g/m. At low temperatures, nitrogen removal capacity of microorganisms (nitrifiers) is significantly reduced, then N/E efficiency decreases and the imposed N/E set-point can be unreachable. The control system tries to achieve the desired reference, leading DO set-point to the minimum levels (Figure 11) to reduce aeration energy consumption. In these conditions, the control actions that force the N/E index to higher values produce performance deterioration instead of improving plant efficiency. Therefore, the event-based controller introduced in the proposed N/E control approach is based on the observation of DO dynamics, to detect those situations where the manipulated variable is forced outside the recommended limits for a prolonged period of time and adapt gradually N/E index set-point to reachable values.
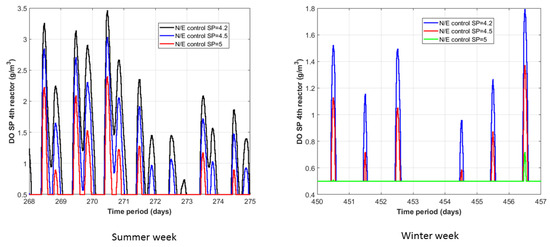
Figure 11.
DO set-point movements in the 4th aerobic reactor when N/E index control strategy is applied considering constant N/E set-points.
5.1. Event-Based Controller Algorithm
The rationale of the event-based controller is based on the following operating rule: it should reduce the N/E index set-point when DO levels reach the minimum allowed values and the desired reference can not be attained, but the set-point should be increased when DO levels are high enough to request more N/E efficiency. Performing these actions in a continuous way produces an N/E index set-point trajectory associated with DO dynamics.
The DO levels are monitored at a given sampling time (); then, when minimum DO levels are detected, the N/E index set-point is reduced by a certain amount () to adapt the N/E efficiency requirements to real possibilities of the process. Once higher DO levels are detected, the N/E index set-point is increased to improve N/E efficiency.
The parameters considered in the proposed event-based strategy are:
- : Sampling time at which the event-based detector will operate.
- : Lower value for the DO that should be avoided.
- : Increments on the N/E set-point that should be performed at each event.
- , : Maximum and minimum values for the N/E index.
The logic of the event-based reference update is as follows:
Inputs: DO, N/E index set-point (), if
=min(, -),
else
=min(, +).
end
This procedure is executed every , and the N/E reference will therefore remain constant during the time interval. An example of the actions of the event-based algorithm on dynamic response is presented in (Figure 12), where it is possible to observe how an N/E index set-point is decreased in a magnitude given by each time period given by while DO levels reach the minimum value; if DO increases, then N/E index is increased in each until minimum DO levels are detected again.

Figure 12.
Actions of the event-based algorithm to change the index set-point.
The DO set-point can vary between 0.5 and 4 g/m, then = 0.5 g/m is a fixed value, but the rest of the parameters can be modified by designer: , , and . In the next section, event-based strategy with different tuning parameters is evaluated. The idea is to select the combination of parameters of event-based controllers that produce the major improvement in global performance when implementing the N/E control approach and comparing that design with the best existing strategy, which is the ammonium-based control with = 1 (Cascade = 1).
Tuning of Event-Based N/E Controller Parameters
It has been observed in Figure 11 that a constant N/E set-point of 5 kgN/kWh leads DO set-point to the minimum value along the whole week; then, it is assumed that higher N/E set-points are not recommended. The maximum N/E index observed in the evaluation of existing strategies is 4.2 kgN/kWh and the idea of the proposed control approach is to improve that value. Therefore, values of the event-based controller to be evaluated are: 4.2 kgN/kWh, 4.5 kgN/kWh, and 5 kgN/kWh while is fixed on 2 kgN/kW to provide a back-off with respect to the minimum observed for existing control strategies.
The following procedure has been completed to find the best event-based controller parameters: For each value, different sampling times are tested: 15 min, 30 min, 60 min, and 120 min. For 4.2 kgN/kW and 5 kgN/kW, and the best sampling time, different values of are considered: 0.25, 0.5, and 0.75 kgN/kWh.
In order to illustrate how N/E set-point trajectory and DO set-point vary with sampling time and parameters of the event-based controller, details of the set-point movements with different and for = 5 kgN/kW and = 2 kgN/kW are presented in Figure 13. In the figure, it is possible to observe that affects the sensitivity and frequency of N/E set-point movements. The smaller , which is 15 min, produces more trajectories between and since increasing the frequency of DO monitoring makes it possible to detect more situations where DO levels reach the minimum that can be unnoticed with larger sampling times. As a consequence, DO set-point movements with smaller are more frequent and smaller in magnitude. Regarding the effect of , in Figure 13, it can be observed that larger produce abrupt variations of N/E index set-point while variations are gradual with smaller ; then, larger produce more trajectories between and that are reflected as more frequent and smaller variations in DO set-point.

Figure 13.
Effect of and on N/E index set-point and DO set-points.
The effect of N/E control approach with each set of tuning parameters on overall efficiency is evaluated using the radar plots of performance indicators to find the best combination of parameters. The radar plots for each combination of parameters have been obtained, and the area of the polygons formed by each one is computed. The areas of the plots obtained for fixed kgN/kWh and different are reported in Table 2. It is observed that the lowest area corresponds to sampling time of 30 min in all cases, which is the approximate time constant of the DO control loop.
Table 2.
Radar area of N/E control strategy with different and sampling time and kgN/kWh.
The areas of the polygons obtained in the radar plots for different values of with kgN/kWh, kgN/kWh, and min are presented in Table 3. The lowest area is obtained for kgN/kWh in both cases.
Table 3.
Radar area of N/E control strategy with different and .
Finally, the areas of the polygons obtained in the radar plots for different values of with the best and : = 0.5 kgN/kWh and min are presented in Table 4. The lowest area is obtained for = 5 kgN/kWh.
Table 4.
Radar area of N/E control strategy with different , = 30 min and kgN/kWh.
Finally, Figure 14 shows the dynamics of the proposed N/E control approach in a representative week with the best parameters of the event-based controller: = 5 kgN/kWh, = 30 min and = 0.5 kgN/kWh. It is observed that N/E index dynamic response follows the N/E set-point trajectory given by an event based controller adjusting DO set-point. DO set-point is adjusted by KLa movements computed by an internal DO controller.

Figure 14.
Dynamics of the proposed N/E control approach, N/E tracking, and DO control variables in a representative summer week.
6. Effect on Process Behavior and Global Performance: N/E Control Strategy vs. Existing Strategies
In Section 4, it was demonstrated that the typical control strategy that produces the major improvement of overall performance is the ammonium-based control with = 1 (Cascade = 1). In this section, Cascade = 1 strategy is compared with the proposed N/E control approach using the best set of tuning parameters: kgN/kWh, min, kgN/kWh in terms of the dynamic behavior of efficiency indicators and key operation variables and global performance improvement achieved in the whole operation period.
The evolution of N/E and R-COD/E in the evaluation period is presented in Figure 15. Similar patterns of the indicators are produced by both strategies, but, in most of the operating period (weeks 10 to 48), the N/E control strategy produces similar or higher values of the N/E index than cascade control. N/E efficiency increases with cascade control in the first 10 weeks corresponding to higher temperatures when cascade scheme tends to lead DO set-point to the lower bound, but, the rest of the time, the N/E control strategy produces equal or better N/E values, especially in the colder period (weeks 20 to 35), when cascade strategy tries to compensate for temperature effect increasing DO set-point and N/E control reduces DO set-point to increase N/E efficiency. Similar observations are made respect to R-COD/E profile, with the particularity that a major improvement of the index is observed in the colder period with N/E control strategy.
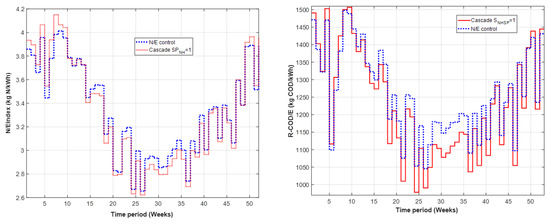
Figure 15.
Weekly profiles of of N/E index (kgN/kWh) and R-COD/E (kgCOD/kWh) index for Cascade and N/E control approach.
The evolution of D-TE and COD/N ratio in the 2nd reactor is shown in Figure 16. As in the case of existing control strategies, a minimal effect of control strategies on D-TE profile (pollution removal with respect to influent flow rate) is observed, and the evolution of COD/N ratio in the second reactor shows that slightly larger values are obtained with N/E control strategy in most of the operation period, especially in the colder weeks (Week 20–35) that indicate that availability of organic matter to be used as substrate is improved in some degree.

Figure 16.
Weekly profiles of IQI-EQI/ (kg/m) index and COD/N ratio (gCOD/gN) in the 2nd reactor for Cascade = 1 and N/E control approach.
Annual average values of performance indicators are computed for both control strategies and presented in Table 5. The effect of executing control actions based on the regulation of an efficiency index that accounts for energy requirement of the full plant is notorious, and all performance indicators associated with energy use are improved with N/E control strategy except pumping energy (PE) and heating energy (HE) that are not affected by control actions. It was a positive effect of cascade control scheme that has been leveraged with the regulation of the efficiency index. The operation costs (OCI) are reduced due to energy savings and the amount of CO emissions is similar with both strategies. Regarding effluent quality requirements, EQI is worsened with N/E control as well as violations, but violations are reduced in frequency and magnitude. This trend is observed in a radar plot shown in Figure 17. The global effect of control strategies on performance is quantified with an area of the polygon formed in radar plot (Table 5), that is reduced approximately 10% with N/E control strategy.
Table 5.
Comparison of performance indicators for Cascade and N/E control strategy.

Figure 17.
Radar plot of performance indicators for the comparison between Cascade and N/E control strategy.
Finally, a comparison of dynamic performance based on the observation of effluent quality indicators as EQI and total nitrogen concentration in the effluent () is made between DO default, Cascade , and N/E control. Those dynamic profiles are presented in Figure 18, to show that an N/E control strategy produces lower values of than the other strategies in the whole operation period. is directly involved in the N/E index used as a control variable. On the other hand, EQI that measures other impacts on effluent quality is slightly improved by N/E control in the warmer weeks of the operation period but is worsened in the colder weeks.

Figure 18.
Evolution of the EQI index and /Q in the whole operation period—weekly average values.
The use of the simple PI controllers makes feasible the full-scale implementation of the proposed N/E control strategy. It is possible to compute the N/E index using online measures from available sensors to estimate nitrogen removal term, and energy term can be computed from power data from pumps, blowers, and heating equipment. The rest of the variables involved in the proposed control scheme have been implemented in previous works [27,28] using available DO sensors, ammonium sensors, and nitrate sensors.
7. Conclusions
In this paper, the N/E index, defined as the ratio between the amount of nitrogenated compounds eliminated (kgN) and the energy (kWh) required by the whole plant to eliminate that amount of nitrogen (N/E index), is used as a global indicator of plant performance. The evaluation of existing control strategies (DO control, cascade control of effluent ammonium concentration, and combined nitrates and DO control) in the BSM2 model showed that cascade control ( g/m) produces the best performance from a global viewpoint, exhibiting the lower values of most of the performance indicators associated with energy use, CO emissions, effluent quality, and effluent violations. In the implementation of control approach based on the control of N/E index, the event-based control algorithm is used to produce a variable N/E set-point that detects when inadmissible values of DO concentration (0.5 g/m) are reached. PI controllers prove themselves to be effective to introduce some sense of optimization in the control approach producing the control actions that lead the N/E index to the desired values with a simple control law. From the evaluation of different tuning parameters for the event-based N/E control approach, the best parameters were determined: kgN/kWh, kgN/kWh, min, kgN/kWh. The N/E index control approach using the best tuning parameters reduced the area of the polygonal figure of radar plot by 9% when comparing with the best existing strategy (cascade control g/m) that is associated with the simultaneous improvement of more performance indicators. These results show the possibilities of the N/E index to be used as an indicator of global performance of WWTPs. It provides a link between water line objectives and energy consumption in the whole plant that can be exploited to introduce plantwide considerations in alternative control strategies formulated to drive the plant to operating conditions that optimize the overall process efficiency. The combination with other efficiency indicators is considered for future work.
The use of the simple PI controllers makes feasible the full-scale implementation of the proposed N/E control strategy. It is possible to compute the N/E index using online measures from available sensors to estimate nitrogen removal term, and energy term can be computed from power data from pumps, blowers, and heating equipment [22]. The rest of variables involved in the proposed control scheme have been implemented in previous works [27,28] using available DO sensors, ammonium sensors, and nitrate sensors.
Author Contributions
S.R., R.V. and P.V. conceived and designed the general approach; S.R performed the simulations; M.F. and M.M. contributed to the simulation interpretations; writing-review and editing, S.R., R.V. and P.V.; supervision, R.V.; S.R. wrote the paper. All authors have read and agreed to the published version of the manuscript.
Funding
This work has received funds from the Ministerio de y Competitividad (MINECO) projects DPI2015- 67341-C2-1-R, DPI2016-77271-R, and also with FEDER funding. APC have been covered from such projects.
Acknowledgments
The authors wish to thank the support of the Spanish Government through the Ministerio de Economía y Competitividad (MINECO) projects DPI2015-67341-C2-1-R, DPI2016-77271-R, and also with FEDER funding. The authors would also like to thank the WWTP of Salamanca (Aqualia) for allowing our research group to visit, and sharing the plant, in addition to the IWA Task Group from the Department of Industrial Electrical Engineering and Automation (IEA), Lund University, Sweden (Ulf Jeppsson, Christian Rosen) for the BSM1 models.
Conflicts of Interest
The authors declare no conflicts of interest.
Appendix A
Appendix A.1. N/E Index Controller Tuning
An appropriated controller tuning is important also for control system performance. The internal PI controller that manipulates KLa of the aerobic reactors to regulate DO in the 4th reactor uses the default tuning parameters of BSM2 platform [20]. Therefore, it can be considered as an already existing controller. For the tuning of the external PI that manipulates DO set-point to regulate N/E index, the identification of the model of the system is necessary. This controller is tuned on the basis of a first order filter with unitary gain and time constant of 0.1 that represent physical delay of the process. To obtain the model, step changes are applied to the DO set-point considering constant influent flow and influent concentrations corresponding to BSM2 steady state operation. The N/E index response (Figure A1) is obtained and approximated with a first order model:
On the basis of this first order model, an Internal Model Control (IMC) approach is followed to design the PI controller. [41]. The resulting PI controller parameters obey the following expressions that relate PI parameters with first order model:
A tuning value of = 0.8 has been taken.

Figure A1.
N/E index response to step changes in DO concentration.
References
- Meneses, M.; Concepcion, H.; Vrecko, D.; Vilanova, R. Life Cycle Assessment as an environmental evaluation tool for control strategies in wastewater treatment plants. J. Clean. Prod. 2015, 107, 653–661. [Google Scholar] [CrossRef]
- Meneses, M.; Concepcion, H.; Vilanova, R. Joint Environmental and Economical Analysis of Wastewater Treatment Plants Control Strategies: A Benchmark Scenario Analysis. Sustainability 2016, 8, 360. [Google Scholar] [CrossRef]
- Flores-Alsina, X.; Arnell, M.; Amerlinck, Y.; Corominas, L.; Gernaey, K.V.; Guo, L.; Lindblom, E.; Nopens, I.; Porro, J.; Shaw, A.; et al. Balancing effluent quality, economic cost and greenhouse gas emissions during the evaluation of (plant-wide) control/operational strategies in WWTPs. Sci. Total Environ. 2014, 466–467, 616–624. [Google Scholar] [CrossRef] [PubMed]
- Gordon, G.T.; McCann, B.P. Basis for the development of sustainable optimisation indicators for activated sludge wastewater treatment plants in the Republic of Ireland. WAter Sci. Technol. 2014, 71, 131–138. [Google Scholar] [CrossRef] [PubMed]
- Barbu, M.; Santin, I.; Vilanova, R. Applying Control Actions for Water Line and Sludge Line To Increase Wastewater Treatment Plant Performance. Ind. Eng. Chem. Res. 2018, 57, 5630–5638. [Google Scholar] [CrossRef]
- Quadros, S.; Joao Rosa, M.; Alegre, H.; Silva, C. A performance indicators system for urban wastewater treatment plants. Water Sci. Technol. 2010, 62, 2398–2407. [Google Scholar] [CrossRef]
- Mauricio-Iglesias, M.; Garrido, J.M.; Lema, J.M. Operation of an innovative WWTP with environmental objectives. A model-based analysis. IFAC-PapersOnLine 2016, 49, 539–543. [Google Scholar] [CrossRef]
- Puleo, V.; Notaro, V.; Freni, G.; La Loggia, G. Multicriteria performance analysis of an integrated urban wastewater system for energy management. J. Hydroinformatics 2017, 19, 865–878. [Google Scholar] [CrossRef]
- Flores-Alsina, X.; Corominas, L.; Snip, L.; Vanrolleghem, P.A. Including greenhouse gas emissions during benchmarking of wastewater treatment plant control strategies. Water Res. 2011, 45, 4700–4710. [Google Scholar] [CrossRef]
- Rodriguez-Garcia, G.; Molinos-Senante, M.; Hospido, A.; Hernández-Sancho, F.; Moreira, M.; Feijoo, G. Environmental and economic profile of six typologies of wastewater treatment plants. Water Res. 2011, 45, 5997–6010. [Google Scholar] [CrossRef]
- Lemos, D.; Dias, A.C.; Gabarrell, X.; Arroja, L. Environmental assessment of an urban water system. J. Clean. Prod. 2013, 54, 157–165. [Google Scholar] [CrossRef]
- Stare, A.; Vrečko, D.; Hvala, N.; Strmčnik, S. Comparison of control strategies for nitrogen removal in an activated sludge process in terms of operating costs: A simulation study. Water Res. 2007, 41, 2004–2014. [Google Scholar] [CrossRef] [PubMed]
- Rieger, L.; Jones, R.M.; Dold, P.; Bott, C. Ammonia-based feedforward and feedback aeration control in activated sludge processes. Water Environ. Res. 2014, 86, 63–73. [Google Scholar] [CrossRef] [PubMed]
- Santin, I.; Pedret, C.; Vilanova, R. Fuzzy Control and Model Predictive Control Configurations for Effluent Violations Removal in Wastewater Treatment Plants. Ind. Eng. Chem. Res. 2015, 54, 2763–2775. [Google Scholar] [CrossRef]
- Machado, V.C.; Gabriel, D.; Lafuente, J.; Baeza, J.A. Cost and effluent quality controllers design based on the relative gain array for a nutrient removal WWTP. Water Res. 2009, 43, 5129–5141. [Google Scholar] [CrossRef] [PubMed]
- Vega, P.; Revollar, S.; Francisco, M.; MartÃn, J. Integration of set point optimization techniques into nonlinear MPC for improving the operation of WWTPs. Comput. Chem. Eng. 2014, 68, 78–95. [Google Scholar] [CrossRef]
- Santin, I.; Pedret, C.; Vilanova, R. Applying variable dissolved oxygen set point in a two level hierarchical control structure to a wastewater treatment process. J. Process. Control. 2015, 28, 40–55. [Google Scholar] [CrossRef]
- Revollar, S.; Vega, P.; Vilanova, R.; Francisco, M. Optimal Control of Wastewater Treatment Plants Using Economic-Oriented Model Predictive Dynamic Strategies. Appl. Sci. 2017, 7, 813. [Google Scholar] [CrossRef]
- Barbu, M.; Vilanova, R.; Meneses, M.; Santin, I. On the evaluation of the global impact of control strategies applied to wastewater treatment plants. J. Clean. Prod. 2017, 149, 396–405. [Google Scholar] [CrossRef]
- Alex, J.; Benedetti, L.; Copp, J.; Gernaey, J.; Jeppsson, U.; Nopens, I.; Pons, M.; Rosen, C.; Steyer, J.; Vanrolleghem, P. Benchmark Simulation Model no. 2 (BSM2). In Technical Report 3, IWA Taskgroup on Benchmarking of Control Strategies for WWTPs; International Water Association: London, UK, 2018. [Google Scholar]
- Alex, J.; Benedetti, L.; Copp, J.; Gernaey, J.; Jeppsson, U.; Nopens, I.; Pons, M.; Rieger, L.; Rosen, C.; Steyer, J.; et al. Benchmark Simulation Model no. 1 (BSM1). In Technical Report 1, IWA Taskgroup on Benchmarking of Control Strategies for WWTPs; Dpt. of Industrial Electrical Engineering and Automation, Lund University: Lund, Sweden, 2008. [Google Scholar]
- Torregrossa, D.; Schutz, G.; Cornelissen, A.; Hernández-Sancho, F.; Hansen, J. Energy saving in WWTP: Daily benchmarking under uncertainty and data availability limitations. Environ. Res. 2016, 148, 330–337. [Google Scholar] [CrossRef]
- Longo, S.; d’Antoni, B.M.; Bongards, M.; Chaparro, A.; Cronrath, A.; Fatone, F.; Lema, J.M.; Mauricio-Iglesias, M.; Soares, A.; Hospido, A. Monitoring and diagnosis of energy consumption in wastewater treatment plants. A state of the art and proposals for improvement. Appl. Energy 2016, 179, 1251–1268. [Google Scholar] [CrossRef]
- Amand, L.; Olsson, G.; Carlsson, B. Aeration control-a review. Water Sci. Technol. 2013, 67, 2374–2398. [Google Scholar] [CrossRef] [PubMed]
- Olsson, G. ICA and me a subjective review. Water Res. 2012, 46, 1585–1624. [Google Scholar] [CrossRef] [PubMed]
- O’Brien, M.; Mack, J.; Lennox, B.; Lovett, D.; Wall, A. Model predictive control of an activated sludge process: A case study. Control. Eng. Pract. 2011, 19, 54–61. [Google Scholar] [CrossRef]
- Rieger, L.; Takács, I.; Siegrist, H. Improving Nutrient Removal While Reducing Carbon Footprint at Three Swiss WWTPs Thanks to Advanced Control. Water Environ. Res. 2012, 84, 170–188. [Google Scholar] [CrossRef]
- Mulas, M.; Tronci, S.; Corona, F.; Haimi, H.; Lindell, P.; Heinonen, M.; Vahala, R.; Baratti, R. An application of predictive control to the Viikinmäki wastewater treatment plant. IFAC Proc. Vol. 2013, 46, 18–23. [Google Scholar] [CrossRef]
- Drewnowski, J. Advanced Supervisory Control System Implemented at Full-Scale WWTP—A Case Study of Optimization and Energy Balance Improvement. Water 2019, 11, 1218. [Google Scholar] [CrossRef]
- Torregrossa, D.; Castellet-Viciano, L.; Hernández-Sancho, F. A data analysis approach to evaluate the impact of the capacity utilization on the energy consumption of wastewater treatment plants. Sustain. Cities Soc. 2019, 45, 307–313. [Google Scholar] [CrossRef]
- Revollar, S.; Vilanova, R.; Francisco, M.; Vega, P. PI Dissolved Oxygen control in wastewater treatment plants for plantwide nitrogen removal efficiency. IFAC-PapersOnLine 2018, 51, 450–455. [Google Scholar] [CrossRef]
- Revollar, S.; Vega, P.; Francisco, M.; Vilanova, R. A hierachical Plant wide operation in wastewater treatment plants: Overall efficiency index control and event-based reference management. In Proceedings of the 2018 22nd International Conference on System Theory, Control and Computing (ICSTCC), Sinaia, Romania, 10–12 October 2018; pp. 201–206. [Google Scholar]
- Jeppsson, U.; Pons, M.N.; Nopens, I.; Alex, J.; Copp, J.; Gernaey, K.; Rosen, C.; Steyer, J.P.; Vanrolleghem, P. Benchmark Simulation Model No 2: General protocol and exploratory case studies. Water Sci. Technol. 2007, 56, 67–78. [Google Scholar] [CrossRef]
- Nopens, I.; Benedetti, L.; Jeppsson, U.; Pons, M.N.; Alex, J.; Copp, J.B.; Gernaey, K.V.; Rosen, C.; Steyer, J.P.; Vanrolleghem, P.A. Benchmark Simulation Model No 2: Finalisation of plant layout and default control strategy. Water Sci. Technol. 2010, 62, 1967–1974. [Google Scholar] [CrossRef] [PubMed]
- Henze, M.; Grady, C.; Gujer, W.; Marais, G.; Matsuo, T. Activated Sludge Model 1. In IAWQ Scientific and Technical Report 1; IAWQ: London, UK, 1987. [Google Scholar]
- Takács, I.; Patry, G.; Nolasco, D. A dynamic model of the clarification-thickening process. Water Res. 1991, 25, 1263–1271. [Google Scholar] [CrossRef]
- Batstone, D.; Keller, J.; Angelidaki, R.; Kalyuzhnyi, S.; Pavlostathis, S.; Rozzi, A.; Sanders, W.; Siegrist, H.; Vavilin, V. Anaerobic Digestion Model No.1, STR No.13; IWA Publishing: London, UK, 2002. [Google Scholar]
- Gernaey, K.V.; Flores-Alsina, X.; Rosen, C.; Benedetti, L.; Jeppsson, U. Dynamic Influent Pollutant Disturbance Scenario Generation Using a Phenomenological Modelling Approach. Environ. Model. Softw. 2011, 26, 1255–1267. [Google Scholar] [CrossRef]
- Makinia, J. Mathematical Model and Computer Simulation of Activated Sludge Systems; IWA Publishing: London, UK, 2010. [Google Scholar]
- Takacs, I.; Vanrolleghem, P. Elemental Balances in Activated Sludge Modelling; IWA Publishing: London, UK, 2006. [Google Scholar]
- Rivera, D.E.; Morari, M.; Skogestad, S. Internal model control: PID controller design. Ind. Eng. Chem. Process Des. Dev. 1986, 25, 252–265. [Google Scholar] [CrossRef]
© 2020 by the authors. Licensee MDPI, Basel, Switzerland. This article is an open access article distributed under the terms and conditions of the Creative Commons Attribution (CC BY) license (http://creativecommons.org/licenses/by/4.0/).