The Causality between Participation in GVCs, Renewable Energy Consumption and CO2 Emissions


Abstract
1. Introduction
2. Literature Review
2.1. Measurement of Participation in GVCs
2.2. Impacts of Participation in GVCs on Environment and Energy Consumption
2.3. Relationship between CO2 Emissions and Renewable Energy
3. Methodology and Data
3.1. Methodology
3.2. Data Selection and Description
4. Empirical Results and Discussion
4.1. System-GMM PVAR Causality Results
4.2. Variance Decomposition
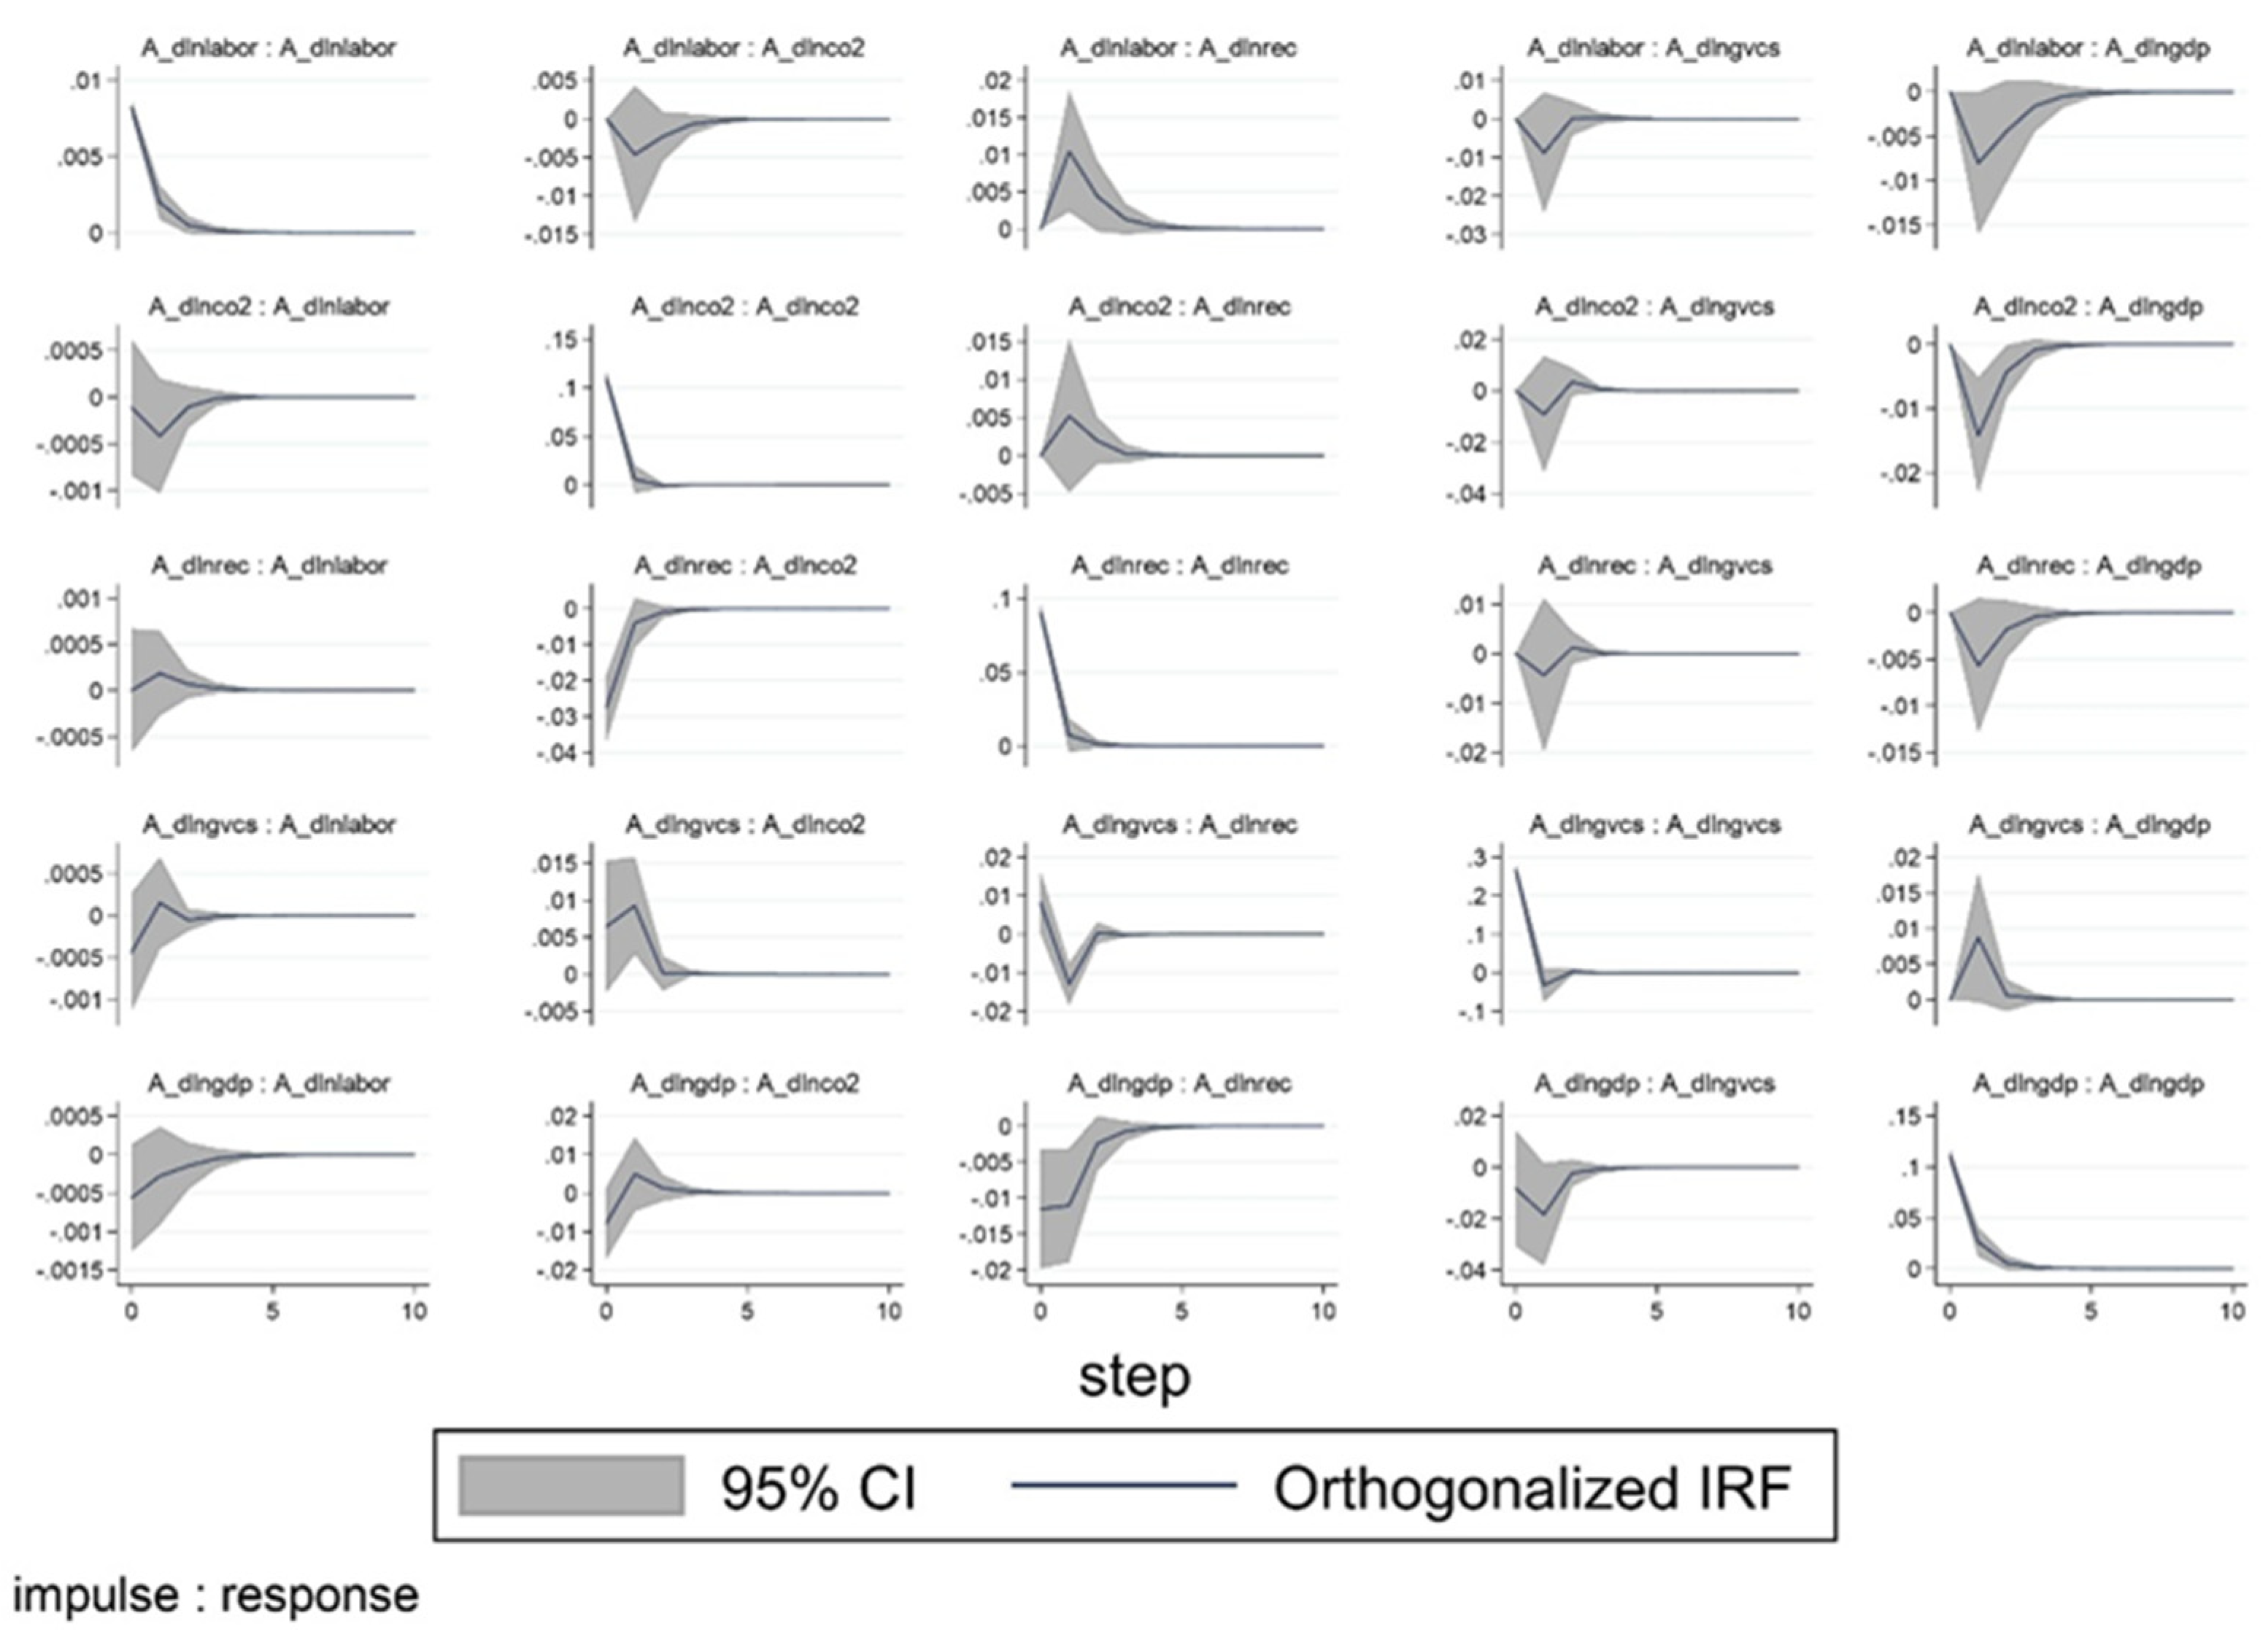
4.3. Impulse-Response Function (IRF) Analysis
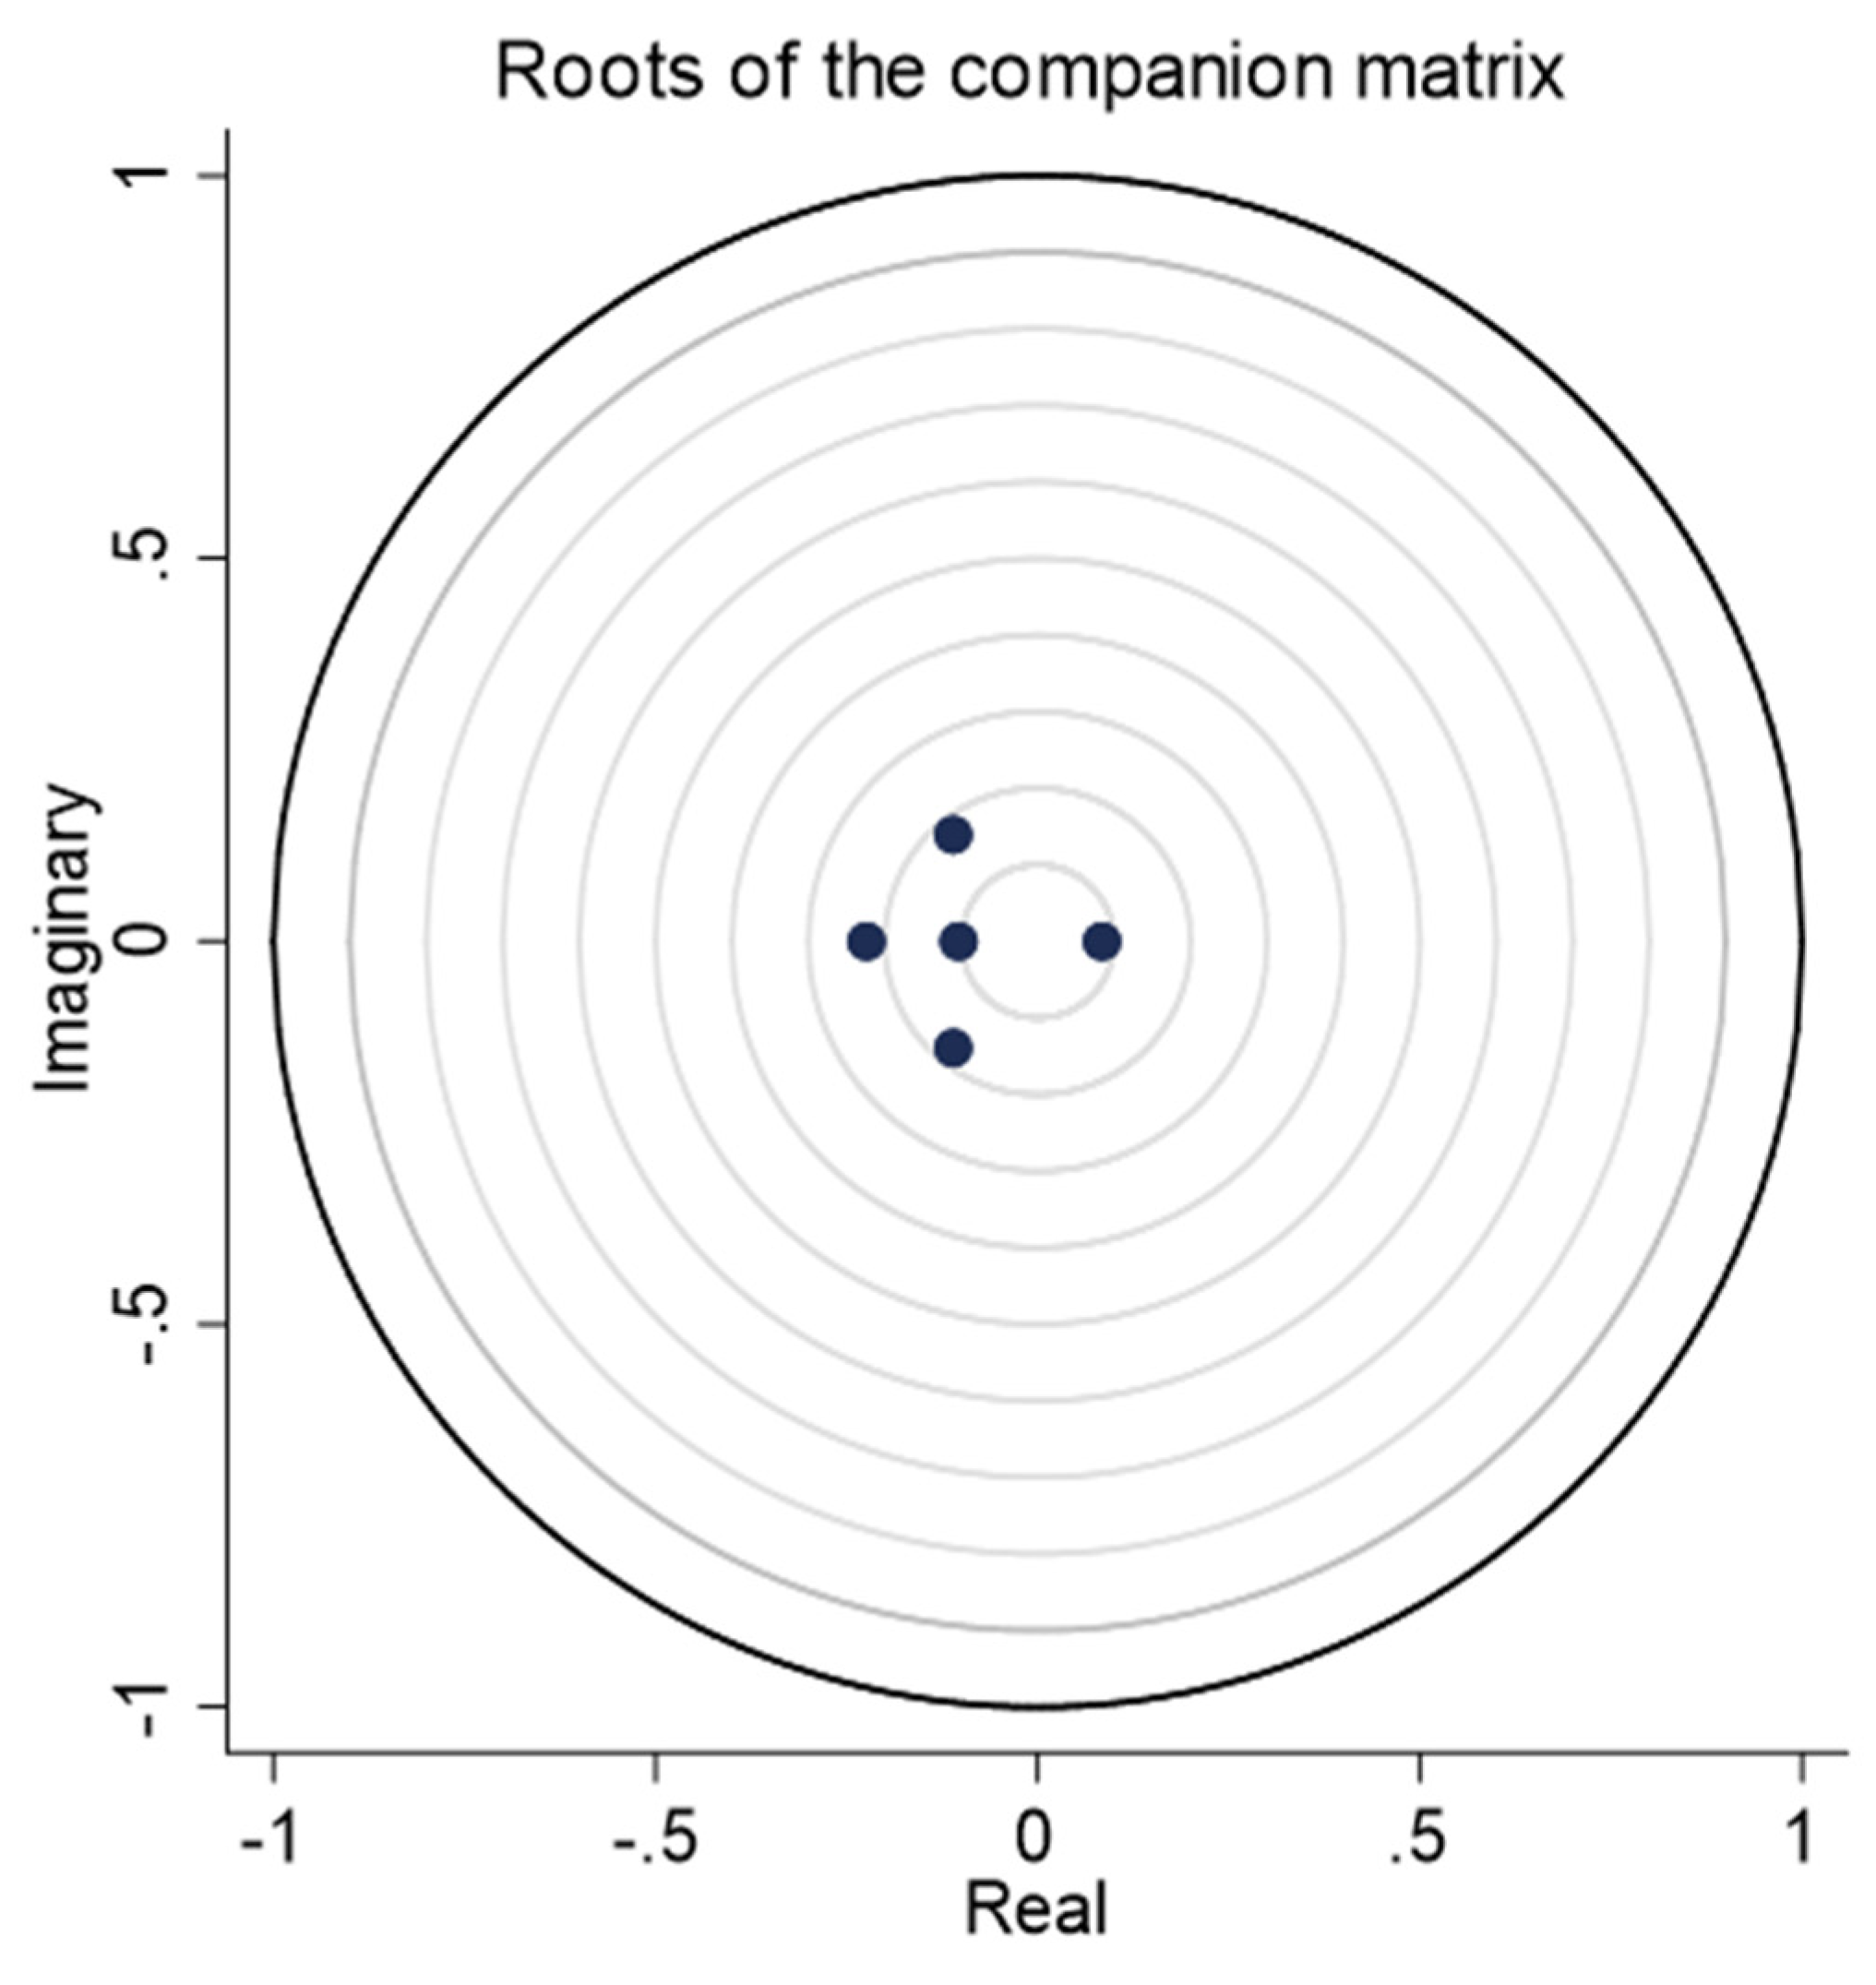
4.4. Robustness Check
5. Conclusions
Author Contributions
Funding
Conflicts of Interest
Appendix A
| Asia–Pacific (29) |
| Australia; Bangladesh; Bhutan; Brunei Darussalam; Cambodia; China; Fiji; Hong Kong SAR, China; India; Indonesia; Japan; Korea, Dem. People’s Rep.; Korea, Rep.; Lao PDR; Malaysia; Maldives; Mongolia; Myanmar; Nepal; New Zealand; Pakistan; Papua New Guinea; Samoa; Philippines; Singapore; Sri Lanka; Thailand; Vanuatu; Vietnam. |
| Middle East and North Africa (17) |
| Algeria; Bahrain; Egypt, Arab Rep.; Iran, Islamic Rep; Iraq; Israel; Jordan; Kuwait; Lebanon; Malta; Morocco; Oman; Qatar; Saudi Arabia; Syrian Arab Republic; Tunisia; United Arab Emirates. |
| Caribbean–Latin America (27) |
| Antigua and Barbuda; Argentina; Bahamas; Barbados; Belize; Bolivia; Brazil; Chile; Colombia; Costa Rica; Cuba; Dominican Republic; Ecuador; El Salvador; Guatemala; Haiti; Honduras; Jamaica; Mexico; Nicaragua; Panama; Paraguay; Peru; Suriname; Trinidad and Tobago; Uruguay; Venezuela, RB. |
| Sub-Saharan Africa (38) |
| Angola; Botswana; Burundi; Cabo Verde; Cameroon; Central African Republic; Chad; Congo, Dem. Rep.; Cote d’Ivoire; Djibouti; Eswatini; Gabon; Gambia; Ghana; Kenya; Lesotho; Liberia; Madagascar; Malawi; Mali; Mauritania; Mauritius; Mozambique; Namibia; Niger; Nigeria; Rwanda; Sao Tome and Principe; Senegal; Seychelles; Sierra Leone; Somalia; South Africa; South Sudan; Tanzania; Togo; Uganda; Zambia. |
| Global (172) |
| Afghanistan; Albania; Andorra; Armenia; Aruba; Austria; Azerbaijan; Belgium; Bermuda; Bosnia and Herzegovina; British Virgin Islands; Bulgaria; Canada; Cayman Islands; Croatia; Cyprus; Czech Republic; Denmark; Estonia; Finland; France; French Polynesia; Georgia; Germany; Greece; Greenland; Hungary; Iceland; Ireland; Italy; Kazakhstan; Kyrgyz Republic; Latvia; Liechtenstein; Lithuania; Luxembourg; Macao SAR, China; Monaco; Montenegro; Netherlands; New Caledonia; North Macedonia; Norway; Poland; Portugal; Romania; Russian Federation; San Marino; Slovak Republic; Slovenia; Spain; Sweden; Switzerland; Tajikistan; Turkey; Turkmenistan; Ukraine; United Kingdom; United States; Uzbekistan; West Bank and Gaza; Asia–Pacific countries; Middle East and North Africa countries; Caribbean–Latin America countries; sub-Saharan Africa countries. |
Appendix B

| Forecast Horizon | Impulse Variable | ||||
|---|---|---|---|---|---|
| dlngdp | dlngvcs | dlnrec | dlnco2 | dlnlabor | |
| dlngdp | |||||
| 1 | 1 | 0 | 0 | 0 | 0 |
| 5 | 0.9893361 | 0.0025948 | 0.0001838 | 0.0045337 | 0.0033517 |
| 10 | 0.989336 | 0.0025948 | 0.0001838 | 0.0045337 | 0.0033517 |
| dlngvcs | |||||
| 1 | 0.032321 | 0.967679 | 0 | 0 | 0 |
| 5 | 0.034139 | 0.963852 | 0.0002032 | 0.0017404 | 0.0000654 |
| 10 | 0.034139 | 0.963852 | 0.0002032 | 0.0017404 | 0.0000654 |
| dlnrec | |||||
| 1 | 0.0031008 | 0.0006187 | 0.9962805 | 0 | 0 |
| 5 | 0.0044322 | 0.0048201 | 0.9906688 | 0.0000601 | 0.0000188 |
| 10 | 0.0044322 | 0.0048201 | 0.9906688 | 0.0000601 | 0.0000188 |
| dlnco2 | |||||
| 1 | 0.0098183 | 0.0005127 | 0.0324005 | 0.9572686 | 0 |
| 5 | 0.0098265 | 0.0026184 | 0.0318704 | 0.95025 | 0.0054347 |
| 10 | 0.0098265 | 0.0026184 | 0.0318704 | 0.95025 | 0.0054347 |
| dlnlabor | |||||
| 1 | 0.0004509 | 0.0007894 | 0.0000475 | 0.0022884 | 0.9964238 |
| 5 | 0.000443 | 0.0008376 | 0.0015875 | 0.0035019 | 0.9936301 |
| 10 | 0.000443 | 0.0008376 | 0.0015875 | 0.0035019 | 0.9936301 |
| Forecast Horizon | Impulse Variable | ||||
|---|---|---|---|---|---|
| A_dlngdp | A_dlngvcs | A_dlnrec | A_dlnco2 | A_dlnlabor | |
| A_dlngdp | |||||
| 1 | 1 | 0 | 0 | 0 | 0 |
| 5 | 0.9685149 | 0.005721 | 0.0026714 | 0.0165631 | 0.0065297 |
| 10 | 0.9685128 | 0.005721 | 0.0026715 | 0.0165631 | 0.0065316 |
| A_dlngvcs | |||||
| 1 | 0.0009344 | 0.9990656 | 0 | 0 | 0 |
| 5 | 0.0055822 | 0.9917179 | 0.0002837 | 0.0013485 | 0.0010677 |
| 10 | 0.0055822 | 0.9917179 | 0.0002837 | 0.0013486 | 0.0010677 |
| A_dlnrec | |||||
| 1 | 0.0159327 | 0.0076805 | 0.9763867 | 0 | 0 |
| 5 | 0.0294922 | 0.0264432 | 0.9259253 | 0.0034593 | 0.0146801 |
| 10 | 0.0294925 | 0.0264431 | 0.9259233 | 0.0034593 | 0.0146817 |
| A_dlnco2 | |||||
| 1 | 0.0098183 | 0.0005127 | 0.0324005 | 0.9572686 | 0 |
| 5 | 0.0098265 | 0.0026184 | 0.0318704 | 0.95025 | 0.0054347 |
| 10 | 0.0098265 | 0.0026184 | 0.0318704 | 0.95025 | 0.0054347 |
| A_dlnlabor | |||||
| 1 | 0.0159275 | 0.0060485 | 0.0007268 | 0.0000284 | 0.9772688 |
| 5 | 0.0993128 | 0.0071406 | 0.0015168 | 0.0039228 | 0.8881068 |
| 10 | 0.0993129 | 0.0071406 | 0.0015169 | 0.0039229 | 0.8881066 |
| Forecast Horizon | Impulse Variable | ||||
|---|---|---|---|---|---|
| C_dlngdp | C_dlngvcs | C_dlnrec | C_dlnco2 | C_dlnlabor | |
| C_dlngdp | |||||
| 1 | 1 | 0 | 0 | 0 | 0 |
| 5 | 0.9756536 | 0.0013499 | 0.0015821 | 0.0058516 | 0.0155626 |
| 10 | 0.9756536 | 0.0013499 | 0.0015821 | 0.0058516 | 0.0155626 |
| C_dlngvcs | |||||
| 1 | 0.015681 | 0.984319 | 0 | 0 | 0 |
| 5 | 0.0186041 | 0.9775121 | 0.0009434 | 0.0025021 | 0.0004382 |
| 10 | 0.0186041 | 0.9775121 | 0.0009434 | 0.0025022 | 0.0004383 |
| C_dlnrec | |||||
| 1 | 0.0035186 | 0.0022672 | 0.9942143 | 0 | 0 |
| 5 | 0.0047287 | 0.0083537 | 0.9818271 | 0.0019437 | 0.0031469 |
| 10 | 0.0047287 | 0.0083537 | 0.9818271 | 0.0019437 | 0.0031469 |
| C_dlnco2 | |||||
| 1 | 0.0094439 | 0.0119188 | 0.0614551 | 0.9171823 | 0 |
| 5 | 0.0134228 | 0.0113824 | 0.0588137 | 0.8834816 | 0.0328995 |
| 10 | 0.0134228 | 0.0113824 | 0.0588137 | 0.8834816 | 0.0328995 |
| C_dlnlabor | |||||
| 1 | 0.0000293 | 0.0007297 | 0.0007281 | 0.0024042 | 0.9961088 |
| 5 | 0.0027462 | 0.0008535 | 0.0008787 | 0.0104012 | 0.9851205 |
| 10 | 0.0027462 | 0.0008535 | 0.0008787 | 0.0104012 | 0.9851205 |
| Forecast Horizon | Impulse Variable | ||||
|---|---|---|---|---|---|
| M_dlngdp | M_dlngvcs | M_dlnrec | M_dlnco2 | M_dlnlabor | |
| M_dlngdp | |||||
| 1 | 1 | 0 | 0 | 0 | 0 |
| 5 | 0.9327897 | 0.0047878 | 0.0006104 | 0.0572782 | 0.0045341 |
| 10 | 0.9327785 | 0.0047883 | 0.0006116 | 0.0572853 | 0.0045363 |
| M_dlngvcs | |||||
| 1 | 0.0804942 | 0.9195058 | 0 | 0 | 0 |
| 5 | 0.1397596 | 0.8098994 | 0.0065298 | 0.0072645 | 0.0365466 |
| 10 | 0.1397675 | 0.8098409 | 0.0065295 | 0.0072955 | 0.0365665 |
| M_dlnrec | |||||
| 1 | 0.000492 | 0.0324807 | 0.9670274 | 0 | 0 |
| 5 | 0.0007078 | 0.0318093 | 0.9002398 | 0.0067105 | 0.0605325 |
| 10 | 0.0007092 | 0.0318093 | 0.900238 | 0.0067106 | 0.0605329 |
| M_dlnco2 | |||||
| 1 | 0.0188852 | 0.000034 | 0.0025907 | 0.9784901 | 0 |
| 5 | 0.0342636 | 0.0023953 | 0.0067691 | 0.8374305 | 0.1191416 |
| 10 | 0.0342653 | 0.0023968 | 0.006769 | 0.8374217 | 0.1191472 |
| M_dlnlabor | |||||
| 1 | 4.71e−06 | 0.0124864 | 0.0337619 | 0.0111924 | 0.9425546 |
| 5 | 0.0038516 | 0.0126314 | 0.0406818 | 0.0126392 | 0.9301959 |
| 10 | 0.003854 | 0.0126313 | 0.0406818 | 0.0126393 | 0.9301935 |
| Forecast Horizon | Impulse Variable | ||||
|---|---|---|---|---|---|
| S_dlngdp | S_dlngvcs | S_dlnrec | S_dlnco2 | S_dlnlabor | |
| S_dlngdp | |||||
| 1 | 1 | 0 | 0 | 0 | 0 |
| 5 | 0.9939538 | 0.0000101 | 0.0001115 | 0.0008216 | 0.005103 |
| 10 | 0.9939475 | 0.0000101 | 0.0001117 | 0.0008216 | 0.0051092 |
| S_dlngvcs | |||||
| 1 | 0.0570274 | 0.9429726 | 0 | 0 | 0 |
| 5 | 0.0493443 | 0.8210868 | 0.001686 | 0.011641 | 0.116242 |
| 10 | 0.0493382 | 0.8209726 | 0.0016901 | 0.0116396 | 0.1163596 |
| S_dlnrec | |||||
| 1 | 0.0009768 | 0.0100072 | 0.989016 | 0 | 0 |
| 5 | 0.0040452 | 0.0097622 | 0.9534488 | 0.000163 | 0.0325808 |
| 10 | 0.0040453 | 0.0097618 | 0.9534098 | 0.0001631 | 0.0326201 |
| S_dlnco2 | |||||
| 1 | 0.0136769 | 0.0174686 | 0.1555864 | 0.8132681 | 0 |
| 5 | 0.0142864 | 0.016486 | 0.1478383 | 0.7712708 | 0.0501184 |
| 10 | 0.0142858 | 0.016485 | 0.1478309 | 0.771222 | 0.0501763 |
| S_dlnlabor | |||||
| 1 | 0.0053845 | 0.0001842 | 0.0017887 | 0.0036807 | 0.9889619 |
| 5 | 0.0050332 | 0.0001584 | 0.0081326 | 0.0032284 | 0.9834474 |
| 10 | 0.0050332 | 0.0001584 | 0.0081391 | 0.0032279 | 0.9834414 |
Appendix C


References
- Yuan, X.C.; Wei, Y.M.; Wang, B.; Mi, Z. Risk management of extreme events under climate change. J. Clean. Prod. 2017, 166, 1169–1174. [Google Scholar] [CrossRef]
- Mohammadi, A.; Cowie, A.L.; Anh Mai, T.L.; Brandão, M.; Anaya de la Rosa, R.; Kristiansen, P.; Joseph, S. Climate-change and health effects of using rice husk for biochar-compost: Comparing three pyrolysis systems. J. Clean. Prod. 2017, 162, 260–272. [Google Scholar] [CrossRef]
- Deschenes, O. Temperature, human health, and adaptation: A review of the empirical literature. Energy Econ. 2014, 46, 606–619. [Google Scholar] [CrossRef]
- Charfeddine, L.; Kahia, M. Impact of renewable energy consumption and financial development on CO2 emissions and economic growth in the MENA region: A panel vector autoregressive (PVAR) analysis. Renew. Energy 2019, 139, 198–213. [Google Scholar] [CrossRef]
- Pei, J.; Meng, B.; Wang, F.; Xue, J.; Zhao, Z. Production sharing, demand spillovers and CO2 Emissions: The case of Chinese regions in global value chains. Singap. Econ. Rev. 2018, 63, 275–293. [Google Scholar] [CrossRef]
- Liu, H.; Zong, Z.; Hynes, K.; De Bruyne, K. Can China reduce the carbon emissions of its manufacturing exports by moving up the global value chain? Res. Int. Bus. Financ. 2019, 51, 101101. [Google Scholar] [CrossRef]
- Thorlakson, T.; De Zegher, J.F.; Lambin, E.F. Companies’ contribution to sustainability through global supply chains. Proc. Natl. Acad. Sci. USA 2018, 115, 2072–2077. [Google Scholar] [CrossRef]
- Pérez, K.; González-Araya, M.C.; Iriarte, A. Energy and GHG emission efficiency in the Chilean manufacturing industry: Sectoral and regional analysis by DEA and Malmquist indexes. Energy Econ. 2017, 66, 290–302. [Google Scholar] [CrossRef]
- Mundaca, G. How much can CO2 emissions be reduced if fossil fuel subsidies are removed? Energy Econ. 2017, 64, 91–104. [Google Scholar] [CrossRef]
- Lin, B.; Zhu, J. Energy and carbon intensity in China during the urbanization and industrialization process: A panel VAR approach. J. Clean. Prod. 2020, 168, 780–790. [Google Scholar] [CrossRef]
- Wang, C.; Wang, F.; Zhang, X.; Yang, Y.; Su, Y.; Ye, Y.; Zhang, H. Examining the driving factors of energy related carbon emissions using the extended STIRPAT model based on IPAT identity in Xinjiang. Renew. Sustain. Energy Rev. 2017, 67, 51–61. [Google Scholar] [CrossRef]
- Shuai, C.; Shen, L.; Jiao, L.; Wu, Y.; Tan, Y. Identifying key impact factors on carbon emission: Evidences from panel and time-series data of 125 countries from 1990 to 2011. Appl. Energy 2017, 187, 310–325. [Google Scholar] [CrossRef]
- Ozturk, I. Measuring the impact of alternative and nuclear energy consumption, carbon dioxide emissions and oil rents on specific growth factors in the panel of Latin American countries. Prog. Nucl. Energy 2017, 100, 71–81. [Google Scholar] [CrossRef]
- Foxon, T.; Pearson, P. Overcoming barriers to innovation and diffusion of cleaner technologies: Some features of a sustainable innovation policy regime. J. Clean. Prod. 2008, 1, 148–161. [Google Scholar] [CrossRef]
- Gosens, J.; Lu, Y. From lagging to leading? Technological innovation systems in emerging economies and the case of Chinese wind power. Energy Policy 2013, 60, 234–250. [Google Scholar] [CrossRef]
- Pietrobelli, C.; Bank, I.D.; Dc, W.; Rabellotti, R.; Orientale, P. Global value chains meet innovation systems: Are there learning opportunities for developing countries? World Dev. 2011, 39, 1261–1269. [Google Scholar] [CrossRef]
- Ferrarini, B.; De Vries, G.J. What Accounts for the Growth of Carbon Dioxide Emissions in Advanced and Emerging Economies? The Role of Consumption, Technology, and Global Supply Chain Trade. Asian Development Bank Economics Working Paper Series. 2015, 458, 1–27. [Google Scholar] [CrossRef][Green Version]
- Achabou, M.A.; Dekhili, S.; Hamdoun, M. Environmental Upgrading of Developing Country Firms in Global Value Chains. Bus. Strategy Environ. 2017, 26, 224–238. [Google Scholar] [CrossRef]
- Khattak, A.; Stringer, C.; Benson-Rea, M.; Haworth, N. Environmental upgrading of apparel firms in global value chains: Evidence from Sri Lanka. Compet. Chang. 2015, 19, 317–335. [Google Scholar] [CrossRef]
- Örgün, B.O. GVCs participation as development strategy. Procedia-Soc. Behav. Sci. 2014, 150, 1287–1296. [Google Scholar] [CrossRef]
- Song, M.; Wang, S. Participation in global value chain and green technology progress: Evidence from big data of Chinese enterprises. Environ. Sci. Pollut. Res. 2017, 24, 1648–1661. [Google Scholar] [CrossRef] [PubMed]
- Hauknes, J.; Knell, M. Embodied knowledge and sectoral linkages: An input—output approach to the interaction of high- and low-tech industries. Res. Policy 2009, 38, 459–469. [Google Scholar] [CrossRef]
- Bi, K.; Huang, P.; Ye, H. Risk identification, evaluation and response of low-carbon technological innovation under the global value chain: A case of the Chinese manufacturing industry. Technol. Forecast. Soc. Chang. 2015, 100, 238–248. [Google Scholar] [CrossRef]
- Jiang, X.; Liu, Y. Global value chain, trade and carbon: Case of information and communication technology manufacturing sector. Energy Sustain. Dev. 2015, 25, 1–7. [Google Scholar] [CrossRef]
- Javorcik, B.S. Does foreign direct investment increase the productivity of domestic firms? In search of spillovers through backward linkages. Am. Econ. Rev. 2003, 94, 605–627. [Google Scholar] [CrossRef]
- Ramanathan, U.; Bentley, Y.; Pang, G. The role of collaboration in the UK green supply chains: An exploratory study of the perspectives of suppliers, logistics and retailers. J. Clean. Prod. 2014, 70, 231–241. [Google Scholar] [CrossRef]
- De Marchi, V.; Di Maria, E.; Ponte, S. The greening of global value chains: Insights from the furniture industry. Compet. Chang. 2013, 17, 299–318. [Google Scholar] [CrossRef]
- De Marchi, V.; Giuliani, E.; Rabellotti, R. Do global value chains offer developing countries learning and innovation opportunities? Eur. J. Dev. Res. 2018, 30, 389–407. [Google Scholar] [CrossRef]
- Closs, D.J.; Speier, C.; Meacham, N. Sustainability to support end-to-end value chains: The role of supply chain management. J. Acad. Mark. Sci. 2011, 39, 101–116. [Google Scholar] [CrossRef]
- Manning, S.; Boons, F.; Von Hagen, O.; Reinecke, J. National contexts matter: The co-evolution of sustainability standards in global value chains. Ecol. Econ. 2012, 83, 197–209. [Google Scholar] [CrossRef]
- Khattak, A.; Stringer, C. Environmental Upgrading in Pakistan’s Sporting Goods Industry in Global Value Chains: A Question of Progress? Bus. Econ. Rev. 2017, 9, 43–64. [Google Scholar] [CrossRef]
- Kumar, A.; Jain, V.; Kumar, S. A comprehensive environment friendly approach for supplier selection. Omega 2014, 42, 109–123. [Google Scholar] [CrossRef]
- Cashore, B.; Auld, G.; Bernstein, S.; Mcdermott, C. Can Non-state Governance ‘Ratchet Up’ Global Environmental Standards? Lessons from the Forest Sector. Rev. Eur. Community Int. Environ. Law 2007, 16, 158–172. [Google Scholar] [CrossRef]
- Geibler, J. Von Market-based governance for sustainability in value chains: Conditions for successful standard setting in the palm oil sector. J. Clean. Prod. 2013, 56, 39–53. [Google Scholar] [CrossRef]
- Guide, V.D.R.; Jayaraman, V.; Linton, J.D. Building contingency planning for closed-loop supply chains with product recovery. J. Oper. Manag. 2003, 21, 259–279. [Google Scholar] [CrossRef]
- Jiang, X.; Green, C. The Impact on Global Greenhouse Gas Emissions of Geographic Shifts in Global Supply Chains. Ecol. Econ. 2017, 139, 102–114. [Google Scholar] [CrossRef]
- Liu, H.; Li, J.; Long, H.; Li, Z.; Le, C. Promoting energy and environmental efficiency within a positive feedback loop: Insights from global value chain. Energy Policy 2018, 121, 175–184. [Google Scholar] [CrossRef]
- Elhedhli, S.; Merrick, R. Green supply chain network design to reduce carbon emissions. Transp. Res. Part D 2012, 17, 370–379. [Google Scholar] [CrossRef]
- Bonilla, D.; Keller, H.; Schmiele, J. Climate policy and solutions for green supply chains: Europe’s predicament. Supply Chain Manag. 2015, 20, 249–263. [Google Scholar] [CrossRef]
- Coe, N.M. Review of International Political Economy Missing links: Logistics, governance and upgrading in a shifting global economy. Rev. Int. Political Econ. 2013, 37–41. [Google Scholar]
- Memedovic, O. Fuelling the global value chains: What role for logistics capabilities? Lauri Ojala Jean-Paul Rodrigue Tapio Naula. Int. J. Technol. Learn. Innov. Dev. 2008, 1, 353–374. [Google Scholar] [CrossRef]
- Poulsen, R.T.; Ponte, S.; Sornn-Friese, H. Environmental upgrading in global value chains: The potential and limitations of ports in the greening of maritime transport. Geoforum 2018, 89, 83–95. [Google Scholar] [CrossRef]
- Kaltenegger, O.; Löschel, A.; Pothen, F. The effect of globalisation on energy footprints: Disentangling the links of global value chains. Energy Econ. 2017, 68, 148–168. [Google Scholar] [CrossRef]
- Spaiser, V.; Scott, K.; Owen, A.; Holland, R. Consumption-based accounting of CO2 emissions in the sustainable development Goals Agenda. Int. J. Sustain. Dev. World Ecol. 2019, 26, 282–289. [Google Scholar] [CrossRef]
- Wang, S.; Zhao, Y.; Wiedmann, T. Carbon emissions embodied in China–Australia trade: A scenario analysis based on input–output analysis and panel regression models. J. Clean. Prod. 2019, 220, 721–731. [Google Scholar] [CrossRef]
- Davis, S.J.; Caldeira, K. Consumption-based accounting of CO2 emissions. Proc. Natl. Acad. Sci. USA 2010, 107, 5687–5693. [Google Scholar] [CrossRef]
- Gereffi, G. Commodity Chains and Global Capitalism; Korzeniewicz, M., Ed.; ABC-CLIO: London, UK, 1994. [Google Scholar]
- Gereffi, G. Shifting governance structures in global commodity chains, with special reference to the Internet. Am. Behav. Sci. 2001, 44, 1616–1637. [Google Scholar] [CrossRef]
- Hummels, D.; Ishii, J.; Yi, K.-M. The nature and growth of vertical specialization in world trade. J. Int. Econ. 2001, 54, 75–96. [Google Scholar] [CrossRef]
- Daudin, G.; Rifflart, C.; Schweisguth, D. Who Produces for Whom in the World Economy? Can. J. Econ./Revue Canadienne d’Économique 2011, 44, 1403–1437. [Google Scholar] [CrossRef]
- Johnson, R.C.; Noguera, G. Accounting for intermediates: Production sharing and trade in value added. J. Int. Econ. 2012, 86, 224–236. [Google Scholar] [CrossRef]
- Koopman, R.; Wang, Z. The value-added structure of gross exports and global production network. In Proceedings of the Final WIOD Conference Causes and Consequences of Globalization, Groningen, The Netherlands, 24–26 April 2012; pp. 24–26. [Google Scholar]
- Koopman, R.; Powers, W.; Wang, Z.; Wei, S. Give credit where credit is due: Tracing value added in global production chains. NBER Work. Pap. Ser. 2010. [CrossRef]
- Koopman, R.; Wang, Z.; Wei, S.-J. Tracing value-added and double counting in gross exports. Am. Econ. Rev. 2014, 104, 459–494. [Google Scholar] [CrossRef]
- Tan, K.G.; Nguyen, L.; Duong, T.; Chuah, H.Y. Impact of exchange rates on ASEAN’s trade in the era of global value chains: An empirical assessment. J. Int. Trade Econ. Dev. 2019, 28, 1–29. [Google Scholar] [CrossRef]
- Amendolagine, V.; Presbitero, A.F.; Rabellotti, R.; Sanfilippo, M. Local sourcing in developing countries: The role of foreign direct investments and global value chains. World Dev. 2019, 113, 73–88. [Google Scholar] [CrossRef]
- Balié, J.; Davide Del, P.; Magrini, E.; Montalbano, P.; Nenc, S. Food and agriculture global value chains: new evidence from Sub-Saharan Africa. In Governance for Structural Transformation in Africa; Palgrave Macmillan: London, UK, 2019; pp. 251–276. [Google Scholar] [CrossRef]
- Del Prete, D.; Giovannetti, G.; Marvasi, E. Global value chains: New evidence for North Africa. Int. Econ. 2018, 153, 42–54. [Google Scholar] [CrossRef]
- Chiou, T.; Kai, H.; Lettice, F.; Ho, S. The influence of greening the suppliers and green innovation on environmental performance and competitive advantage in Taiwan. Transp. Res. Part E 2011, 47, 822–836. [Google Scholar] [CrossRef]
- Pathikonda, V.; Farole, T. The capabilities driving participation in global value chains. J. Int. Commer. Econ. Policy 2017, 8, 1750006. [Google Scholar] [CrossRef]
- Meng, B.; Glen, P.; Meng, B.; Peters, G.P.; Wang, Z. Tracing greenhouse gas emissions in global value chains. Stanf. Cent. Int. Dev. Wording Pap. 2015, 525, 1–97. [Google Scholar]
- Salim, R.A.; Rafiq, S. Why do some emerging economies proactively accelerate the adoption of renewable energy? Energy Econ. 2012, 34, 1051–1057. [Google Scholar] [CrossRef]
- Liu, X.; Zhang, S.; Bae, J. The impact of renewable energy and agriculture on carbon dioxide emissions: Investigating the environmental Kuznets curve in four selected ASEAN countries. J. Clean. Prod. 2017, 164, 1239–1247. [Google Scholar] [CrossRef]
- Jebli, M.B.; Youssef, S.B.; Ozturk, I. Testing environmental Kuznets curve hypothesis: The role of renewable and non-renewable energy consumption and trade in OECD countries. Ecol. Indic. 2016, 60, 824–831. [Google Scholar] [CrossRef]
- Dogan, E.; Seker, F. Determinants of CO2 emissions in the European Union: The role of renewable and non-renewable energy. Renew. Energy 2016, 94, 429–439. [Google Scholar] [CrossRef]
- Dong, K.; Sun, R.; Hochman, G. Do natural gas and renewable energy consumption lead to less CO2 emission? Empirical evidence from a panel of BRICS countries. Energy 2017, 141, 1466–1478. [Google Scholar] [CrossRef]
- Dong, K.; Sun, R.; Li, H.; Liao, H. Does natural gas consumption mitigate CO2 emissions: Testing the environmental Kuznets curve hypothesis for 14 Asia-Pacific countries. Renew. Sustain. Energy Rev. 2018, 94, 419–429. [Google Scholar] [CrossRef]
- Al-Mulali, U.; Ozturk, I. The investigation of environmental Kuznets curve hypothesis in the advanced economies: The role of energy prices. Renew. Sustain. Energy Rev. 2016, 54, 1622–1631. [Google Scholar] [CrossRef]
- Balsalobre-Lorente, D.; Shahbaz, M.; Roubaud, D.; Farhani, S. How economic growth, renewable electricity and natural resources contribute to CO2 emissions? Energy Policy 2018, 113, 356–367. [Google Scholar] [CrossRef]
- Bölük, G.; Mert, M. Fossil & renewable energy consumption, GHGs (greenhouse gases) and economic growth: Evidence from a panel of EU (European Union) countries. Energy 2014, 74, 439–446. [Google Scholar]
- Zoundi, Z. CO2 emissions, renewable energy and the Environmental Kuznets Curve, a panel cointegration approach. Renew. Sustain. Energy Rev. 2017, 72, 1067–1075. [Google Scholar] [CrossRef]
- Bhattacharya, M.; Awaworyi, S.; Reddy, S. The dynamic impact of renewable energy and institutions on economic output and CO2 emissions across regions. Renew. Energy 2017, 111, 157–167. [Google Scholar] [CrossRef]
- Menyah, K.; Wolde-Rufael, Y. CO2 emissions, nuclear energy, renewable energy and economic growth in the US. Energy Policy 2010, 38, 2911–2915. [Google Scholar] [CrossRef]
- Pata, U.K. Renewable energy consumption, urbanization, financial development, income and CO2 emissions in Turkey: Testing EKC hypothesis with structural breaks. J. Clean. Prod. 2018, 187, 770–779. [Google Scholar] [CrossRef]
- Dong, K.; Sun, R.; Hochman, G.; Zeng, X.; Li, H.; Jiang, H. Impact of natural gas consumption on CO2 emissions: Panel data evidence from China’s provinces. J. Clean. Prod. 2017, 162, 400–410. [Google Scholar] [CrossRef]
- Ben Jebli, M.; Ben Youssef, S. The environmental Kuznets curve, economic growth, renewable and non-renewable energy, and trade in Tunisia. Renew. Sustain. Energy Rev. 2015, 47, 173–185. [Google Scholar] [CrossRef]
- Dong, K.; Sun, R.; Jiang, H.; Zeng, X. CO2 emissions, economic growth, and the environmental Kuznets curve in China: What roles can nuclear energy and renewable energy play? J. Clean. Prod. 2018, 196, 51–63. [Google Scholar] [CrossRef]
- Sinha, A.; Shahbaz, M. Estimation of environmental Kuznets curve for CO2 emission: Role of renewable energy generation in India. Renew. Energy 2018, 119, 703–711. [Google Scholar] [CrossRef]
- Love, I.; Zicchino, L. Financial development and dynamic investment behavior: Evidence from panel VAR. Q. Rev. Econ. Financ. 2006, 46, 190–210. [Google Scholar] [CrossRef]
- Cai, X.; Che, X.; Zhu, B.; Zhao, J.; Xie, R. Will developing countries become pollution havens for developed countries? An empirical investigation in the Belt and Road. J. Clean. Prod. 2018, 198, 624–632. [Google Scholar] [CrossRef]
- Balié, J.; Del Prete, D.; Magrini, E.; Montalbano, P.; Nenci, S. Does Trade Policy Impact Food and Agriculture Global Value Chain Participation of Sub-Saharan African Countries? Am. J. Agric. Econ. 2019, 101, 773–789. [Google Scholar] [CrossRef]
- De Vries, G.J.; Ferrarini, B. What Accounts for the Growth of Carbon Dioxide Emissions in Advanced and Emerging Economies? The Role of Consumption, Technology and Global Supply Chain Participation. Ecol. Econ. 2017, 132, 213–223. [Google Scholar] [CrossRef]
- Sun, C.; Li, Z.; Ma, T.; He, R. Carbon efficiency and international specialization position: Evidence from global value chain position index of manufacture. Energy Policy 2019, 128, 235–242. [Google Scholar] [CrossRef]
- Hamilton, J.D. Time Series Analysis; Princeton university press: Princeton, NJ, USA, 1994. [Google Scholar]
- Lütkepohl, H. New Introduction to Multiple Time Series Analysis; Springer Science & Business Media: Berlin, Germany, 2005. [Google Scholar]
- Abrigo, M.R.M.; Love, I. Estimation of panel vector autoregression in Stata. Stata J. 2016, 16, 778–804. [Google Scholar] [CrossRef]
- Sims, C.A. Macroeconomics and Reality. Econom. J. Econom. Soc. 1980, 48, 1–48. [Google Scholar] [CrossRef]


| Author(s) | Country(ies) | Period | Methodology | Results |
|---|---|---|---|---|
| Menyah and Wolde-Rufael [73] | US | 1960-2007 | Granger causality test | There is no causality running from RE to CO2 emissions. |
| Pata [74] | Turkey | 1974-2014 | ARDL/FMOLS/CCR | RE has no effect on CO2 emissions. |
| Dong et al. [75] | China | 1995-2014 | Panel FMOLS/DOLS | Natural gas consumption→ CO2 Natural gas consumption has a significant negative impact on CO2 emissions |
| Ben Jebli and Ben Youssef [76] | Tunisia | 1980-2009 | ARDL/VECM Granger causality approach | CO2→RE (short run) In the long-run, RE impacts weakly and negatively CO2 emissions when using the model with exports, and this impact is statistically insignificant when using the model with imports. |
| Dong et al. [77] | China | 1993-2016 | ARDL/VECM Granger causality test | In both the short and long run, nuclear energy and renewable energy play important roles in mitigating CO2 emissions |
| Sinha and Shahbaz [78] | India | 1971-2015 | ARDL | RE was found to have significant negative impacts on CO2 emissions |
| Salim and Rafiq [62] | Brazil, China, Philippines, India, Turkey, Indonesia | 1980-2006 | FMOLS/DOLS/Granger causality methods | RE↔ income; (short run) RE↔ pollutant emission (short run) |
| Balsalobre-Lorente et al. [69] | EU-5 countries | 1985-2016 | EKC model | Renewable electricity consumption→CO2; Renewable electricity consumption improves environmental quality. |
| Bölük and Mert [70] | 16 EU countries | 1990-2008 | Panel fixed effect model | RE contributes around 1/2 less per unit of energy consumed than fossil energy consumption in terms of GHG emissions in EU countries. |
| Dong et al. [66] | BRICS countries | 1985-2016 | VECM panel Granger causality tests | Gas consumption↔ CO2 RE↔ CO2 |
| Liu et al. [63] | ASEAN-4 countries (Malaysia, Thailand Indonesia, Philippines,) | 1970-2013 | Panel OLS/FMOLS/ DOLS/ VECM Granger causality test | RE↔ CO2 (long run) The increasing RE decreases CO2 emissions. |
| Al-mulali and Ozturk [68] | 27 advanced economies | 1990-2012 | Panel FMOLS/ VEC granger causality | RE→CO2 Renewable energy can reduce the CO2 emissions. |
| Dong et al. [77] | 14 Asia–Pacific countries | 1970-2016 | Panel FMOLS/ Panel VECM Granger causality method | Natural gas consumption↔ CO2 (short run and long run) Natural gas consumption has a significantly negative effect on CO2 emissions. |
| Zoundi [71] | 25 African countries | 1980-2012 | DOLS/FMOLS | Renewable energy has a negative effect on CO2 emissions, coupled with an increasing long run effect. |
| Dogan and Seker [65] | EU-15 countries | 1980-2012 | DOLS | RE↔ CO2 RE mitigates the CO2 emissions. |
| Bhattacharya et al. [72] | 85 developing and developed countries | 1992-2012 | System-GMM/FMOLS | Growth of RE has a significant negative impact on CO2 emissions. |
| Jebli et al. [64] | OECD-25 countries | 1980-2010 | FMOLS/DOLS | RE↔ CO2 (long run) RE reduces CO2 emissions. |
| Dependent Variables | ||||||||
|---|---|---|---|---|---|---|---|---|
| Panel A: Global | ||||||||
| Independent variables | dlngdp | dlngvcs | dlnrec | dlnco2 | dlnlabor | |||
| L.dlngdp | −0.0854 ** | −0.0598 *** | −0.0120 | −0.000389 | ||||
| (−2.39) | (−3.40) | (−0.55) | (−0.25) | |||||
| L.dlngvcs | 0.0368 ** | −0.0637 *** | 0.0313 * | −0.000208 | ||||
| (2.15) | (−3.99) | (1.85) | (−0.20) | |||||
| L.dlnrec | −0.0204 | 0.00723 | −0.0107 | −0.00288 | ||||
| (−1.49) | (0.50) | (−0.81) | (−1.57) | |||||
| L.dlnco2 | −0.0796 *** | −0.0620 * | 0.00823 | −0.00259 * | ||||
| (−2.67) | (−1.78) | (0.37) | (−1.86) | |||||
| L.dlnlabor | −0.653 | −0.133 | 0.0264 | 0.821 ** | ||||
| (−1.12) | (−0.57) | (0.05) | (1.98) | |||||
| Panel B: Asia–Pacific | ||||||||
| Independent variables | A_dlngdp | A_dlngvcs | A_dlnrec | A_dlnco2 | A_dlnlabor | |||
| A_L.dlngdp | −0.194 ** | −0.0837 ** | 0.0449 | −0.00138 | ||||
| (−1.99) | (−2.37) | (1.04) | (−0.48) | |||||
| A_L.dlngvcs | 0.0373 ** | −0.0507 *** | 0.0333 *** | 0.00101 | ||||
| (2.00) | (−5.65) | (2.64) | (1.01) | |||||
| A_L.dlnrec | −0.103 ** | −0.0749 | −0.0272 | 0.000979 | ||||
| (−2.46) | (−0.97) | (−0.68) | (0.38) | |||||
| A_L.dlnco2 | −0.131 *** | −0.0861 | 0.0487 | −0.00356 | ||||
| (−3.16) | (−0.84) | (1.08) | (−1.32) | |||||
| A_L.dlnlabor | −0.980 * | −1.075 | 1.271 ** | −0.563 | ||||
| (−1.89) | (−1.11) | (2.54) | (−1.05) | |||||
| Dependent Variables | |||||
|---|---|---|---|---|---|
| Panel A: Caribbean–Latin America | |||||
| Independent variables | C_dlngdp | C_dlngvcs | C_dlnrec | C_dlnco2 | C_dlnlabor |
| C_L.dlngdp | −0.0822 * | −0.0441 * | 0.0509 | 0.00435 | |
| (−1.90) | (−1.78) | (1.24) | (0.87) | ||
| C_L.dlngvcs | 0.0349 | −0.0698 * | −0.00824 | 0.000585 | |
| (0.80) | (−1.88) | (−0.21) | (0.15) | ||
| C_L.dlnrec | 0.0244 | −0.0406 | −0.00827 | −0.000917 | |
| (0.64) | (−1.18) | (−0.19) | (−0.28) | ||
| C_L.dlnco2 | −0.0922 *** | −0.0439 | 0.0431 | −0.0108 *** | |
| (−3.39) | (−1.15) | (1.38) | (−2.85) | ||
| C_L.dlnlabor | −1.226 ** | 0.178 | −0.458 | 1.634 ** | |
| (−2.08) | (0.70) | (−1.62) | (2.44) | ||
| Panel B: Middle East North Africa (MENA) | |||||
| Independent variables | M_dlngdp | M_dlngvcs | M_dlnrec | M_dlnco2 | M_dlnlabor |
| M_L.dlngdp | −0.439 *** | −0.0206 | −0.191 *** | −0.00603 | |
| (−7.23) | (−0.14) | (−2.85) | (−1.13) | ||
| M_L.dlngvcs | 0.0609 | −0.133 | 0.00221 | −0.00168 | |
| (1.41) | (−1.00) | (0.04) | (−0.35) | ||
| M_L.dlnrec | 0.0113 | 0.0551 *** | 0.00458 | 0.00272 | |
| (0.50) | (2.64) | (0.12) | (1.57) | ||
| M_L.dlnco2 | −0.273 *** | 0.0412 | 0.250 | 0.00241 | |
| (−5.29) | (0.66) | (1.59) | (0.46) | ||
| M_L.dlnlabor | −0.268 | −2.384 *** | −5.742 *** | −3.773 *** | |
| (−0.35) | (−2.83) | (−2.66) | (−3.46) | ||
| Panel C: Sub-Saharan Africa | |||||
| Independent variables | S_dlngdp | S_dlngvcs | S_dlnrec | S_dlnco2 | S_dlnlabor |
| S_L.dlngdp | 0.00277 | −0.0114 | −0.0690 ** | 0.000317 | |
| (0.05) | (−1.28) | (−1.99) | (0.26) | ||
| S_L.dlngvcs | 0.00520 | 0.00473 | −0.0147 | 0.0000974 | |
| (0.20) | (0.76) | (−0.52) | (0.12) | ||
| S_L.dlnrec | 0.0628 | −0.0812 | 0.000732 | 0.00935 | |
| (0.61) | (−0.48) | (0.01) | (1.50) | ||
| S_L.dlnco2 | 0.0355 | −0.139 ** | 0.00720 | 0.000487 | |
| (0.80) | (−2.48) | (0.52) | (0.45) | ||
| S_L.dlnlabor | 1.556 | 10.82 *** | 1.266 *** | −5.069 *** | |
| (1.63) | (2.97) | (3.02) | (−2.64) | ||
| Dependent Variables | |||||
|---|---|---|---|---|---|
| Global | |||||
| Independent variables | dlngdp | dlngvcs | dlnrec | dlnco2 | dlnlabor |
| L.dlngdp | 5.725 ** | 11.532 *** | 0.299 | 0.060 | |
| (0.017) | (0.001) | (0.585) | (0.806) ** | ||
| L.dlngvcs | 4.602 ** | 15.902 *** | 3.418 * | 0.041 | |
| (0.032) | (0.000) | (0.064) | (0.839) | ||
| L.dlnrec | 2.216 | 0.247 | 0.659 | 2.453 | |
| (0.137) | (0.619) | (0.417) | (0.117) | ||
| L.dlnco2 | 7.111 *** | 3.163 * | 0.137 | 3.462 * | |
| (0.008) | (0.075) | (0.711) | (0.063) | ||
| L.dlnlabor | 1.259 | 0.325 | 0.003 | 3.904 ** | |
| (0.262) | (0.569) | (0.959) | (0.048) | ||
| Asia–Pacific | |||||
| Independent variables | A_dlngdp | A_dlngvcs | A_dlnrec | A_dlnco2 | A_dlnlabor |
| L.A_dlngdp | 3.949 ** | 5.634 ** | 1.074 | 0.226 | |
| (0.047) | (0.018) | (0.300) | (0.634) | ||
| L.A_dlngvcs | 3.989 ** | 31.973 *** | 6.962 *** | 1.015 | |
| (0.046) | (0.000) | (0.008) | (0.314) | ||
| L.A_dlnrec | 6.030 ** | 0.933 | 0.461 | 0.144 | |
| (0.014) | (0.334) | (0.497) | (0.704) | ||
| L.A_dlnco2 | 10.004 *** | 0.712 | 1.167 | 1.730 | |
| (0.002) | (0.399) | (0.280) | (0.188) | ||
| L.A_dlnlabor | 3.566 * | 1.240 | 6.432 ** | 1.111 | |
| (0.059) | (0.265) | (0.011) | (0.292) | ||
| Caribbean–Latin America | |||||
| Independent variables | C_dlngdp | C_dlngvcs | C_dlnrec | C_dlnco2 | C_dlnlabor |
| L.C_dlngdp | 3.597 * | 3.179 * | 1.535 | 0.764 | |
| (0.058) | (0.075) | (0.215) | (0.382) | ||
| L.C_lngvcs | 0.647 | 3.544 * | 0.043 | 0.023 | |
| (0.421) | (0.060) | (0.836) | (0.879) | ||
| L.C_dlnrec | 0.405 | 1.403 | 0.037 | 0.077 | |
| (0.524) | (0.236) | (0.847) | (0.781) | ||
| L.C_lnco2 | 11.509 *** | 1.325 | 1.896 | 8.151 *** | |
| (0.001) | (0.250) | (0.168) | (0.004) | ||
| L.C_lnlabor | 4.313 ** | 0.484 | 2.629 | 5.943 ** | |
| (0.038) | (0.487) | (0.105) | (0.015) | ||
| Dependent Variables | |||||
|---|---|---|---|---|---|
| MENA | |||||
| Independent variables | M_dlngdp | M_dlngvcs | M_dlnrec | M_dlnco2 | M_dlnlabor |
| L.M_dlngdp | 52.334 *** | 0.019 | 8.123 *** | 1.278 | |
| (0.000) | (0.892) | (0.004) | (0.258) | ||
| L.M_lngvcs | 1.980 | 1.000 | 0.001 | 0.120 | |
| (0.159) | (0.317) | (0.972) | (0.729) | ||
| L.M_dlnrec | 0.253 | 6.985 *** | 0.014 | 2.449 | |
| (0.615) | (0.008) | (0.905) | (0.118) | ||
| L.M_lnco2 | 27.992 *** | 0.433 | 2.529 | 0.212 | |
| (0.000) | (0.510) | (0.112) | (0.645) | ||
| L.M_lnlabor | 0.120 | 8.010 *** | 7.068 *** | 11.945 *** | |
| (0.729) | (0.005) | (0.008) | (0.001) | ||
| Sub-Saharan Africa | |||||
| Independent variables | S_dlngdp | S_dlngvcs | S_dlnrec | S_dlnco2 | S_dlnlabor |
| L.S_dlngdp | 0.002 | 1.640 | 3.950 ** | 0.069 | |
| (0.960) | (0.200) | (0.047) | (0.792) | ||
| L.S_lngvcs | 0.040 | 0.573 | 0.268 | 0.015 | |
| (0.842) | (0.449) | (0.605) | (0.904) | ||
| L.S_dlnrec | 0.373 | 0.230 | 0.000 | 2.263 | |
| (0.541) | (0.631) | (0.996) | (0.132) | ||
| L.S_lnco2 | 0.638 | 6.130 ** | 0.267 | 0.207 | |
| (0.424) | (0.013) | (0.605) | (0.649) | ||
| L.S_lnlabor | 2.660 | 8.825 *** | 9.147 *** | 6.993 *** | |
| (0.103) | (0.003) | (0.002) | (0.008) | ||
© 2020 by the authors. Licensee MDPI, Basel, Switzerland. This article is an open access article distributed under the terms and conditions of the Creative Commons Attribution (CC BY) license (http://creativecommons.org/licenses/by/4.0/).
Share and Cite
Wu, Z.; Hou, G.; Xin, B. The Causality between Participation in GVCs, Renewable Energy Consumption and CO2 Emissions. Sustainability 2020, 12, 1237. https://doi.org/10.3390/su12031237
Wu Z, Hou G, Xin B. The Causality between Participation in GVCs, Renewable Energy Consumption and CO2 Emissions. Sustainability. 2020; 12(3):1237. https://doi.org/10.3390/su12031237
Chicago/Turabian StyleWu, Zhiheng, Guisheng Hou, and Baogui Xin. 2020. "The Causality between Participation in GVCs, Renewable Energy Consumption and CO2 Emissions" Sustainability 12, no. 3: 1237. https://doi.org/10.3390/su12031237
APA StyleWu, Z., Hou, G., & Xin, B. (2020). The Causality between Participation in GVCs, Renewable Energy Consumption and CO2 Emissions. Sustainability, 12(3), 1237. https://doi.org/10.3390/su12031237