Article

Analysis of China’s Manufacturing Industry Carbon Lock-In and Its Influencing Factors

1
Key Laboratory of Geospatial Technology for Middle and Lower Yellow River Regions, Kaifeng 475004, China
2
College of Environment and Planning, Henan University, Kaifeng 475004, China
*
Author to whom correspondence should be addressed.
Sustainability 2020, 12(4), 1502; https://doi.org/10.3390/su12041502
Submission received: 18 November 2019 / Revised: 1 February 2020 / Accepted: 3 February 2020 / Published: 18 February 2020

Abstract

:
There are industry lock-in and regional lock-in phenomena in China’s manufacturing industry carbon emissions. However, the existing researches often focus on global carbon emissions, which is not adverse to finding the main problems of manufacturing industry carbon emissions. The biggest contributions of this study are the identification of the industry lock-in and regional lock-in of China’s manufacturing industry and the finding of the regional factors that affect the carbon lock-in of the manufacturing industry, which points out the direction for the low-carbon transformation of the local manufacturing industry. This paper is based on the IPCC (Intergovernmental Panel on Climate Change) carbon emissions coefficient method and energy consumption data from 2000 to 2016 to count the manufacturing industry carbon emissions of 30 provinces in China (except Hong Kong, Macao, Taiwan and Tibet). On this basis, the paper uses a spatial–temporal geographical weighted regression (GTWR) model to analysis the regional influencing factors of the high-carbon manufacturing industry. Results demonstrate that China’s high-carbon manufacturing industry mainly concentrates on the ferrous metal processing industry, non-metallic mineral manufacturing industry and other sectors. In addition, the carbon emissions of high-carbon manufacturing industries are mainly concentrated in Bohai Bay and the North China Plain. The industrial structure and economic scale are the main reasons for the regional carbon lock-in of the high-carbon manufacturing industry, and the strength of the lock-in has continued to increase. Resource endowment is a stable factor of carbon lock-in in high-carbon regions. Technological progress helps to unlock carbon, while foreign direct investment results in the enhancement of carbon regional lock-in. This study focuses on the regional factors of carbon lock-in in the manufacturing industry, hoping to provide decision support for the green development of China’s manufacturing industry.

1. Introduction

China is undergoing rapid industrialization and the rigid demand of economic growth for energy consumption maintains a high growth trend. Carbon emissions in energy consumption may bring great pressure on the sustainable development of economy, society and environment. The manufacturing industry is the main driving force of industrial economic growth in China. It produces strong negative feedback to the environment while bringing high economic benefits. Since 2000, the proportion of manufacturing industry carbon emissions has exceeded 66.7% of the total industrial carbon emissions [1]. Therefore, how to achieve the carbon emissions reduction of the manufacturing industry has become an urgent problem. However, the carbon emissions of China’s manufacturing industry have a significant industry concentration and lock-in. From 2000 to 2016, the ferrous metal processing industry, non-metallic mineral manufacturing industry, petroleum smelting industry, chemical raw material product industry and non-ferrous metal metallurgic processing industry accounted for more than 81.59% of carbon emissions in the whole manufacturing industry [1]. Therefore, it is of great practical significance to clarify the causes of carbon lock-in in these high-carbon manufacturing industries and to analyze the factors of carbon emissions regional lock-in.
Many studies on the content and method of manufacturing industry carbon emissions have been reported. Most of the existing researches focus on developed countries or regions. For example, Hammond et al. [2] used the LMDI (Logarithmic Mean Divisia Index) method to decompose and analyze the influencing factors of manufacturing industry carbon emissions in the UK, and believed that energy intensity was the primary factor that led to the reduction of carbon emissions. Kopidou et al. [3] also used the LMDI method to explore the impact of fuel mixing and economic growth on manufacturing industry carbon emissions in Europe. They found that economic growth and resource intensity were the main driving forces of carbon emissions growth and the optimization of the energy structure had a limited effect on carbon emissions reduction. Diakoulaki et al. [4] decomposed the carbon increment of 14 European Union countries from 1990 to 2003 and found that the output effect and energy intensity were the main factors affecting the carbon emissions growth. Clara et al. [5] took Germany and Colombia as examples, and found that, although the total energy consumption of the manufacturing industry in the two countries increased, the energy intensity showed a downward trend. In addition, because China is one of the major carbon emissions countries, the academia has done a lot of research on the carbon emissions of China’s manufacturing industry. Among them, Chang et al. [6] used structural decomposition analysis (SDA) to find that the decrease of carbon intensity was conducive to the decrease of carbon emissions, but the increase of investment scale would lead to carbon emissions growth. Lee et al. [7] estimated the shadow price of the carbon emissions of 30 manufacturing industries in China based on the input distance function, and believed that using capital to improve the production efficiency of coal, oil and other industries would make it easier for China to achieve the goal of “green and low-carbon development”. Huw [8] analyzed the essence and consequences of China’s economic rise by taking the manufacturing industry as the leading role, and believed that the possibility of China’s economic growth slowing down in the short term was low. Lin et al. [9] calculated the carbon emissions transfer between different industrial sectors in China based on the input–output method and used regression analysis to find that energy consumption was the main factor leading to carbon emissions growth and that energy-saving technology could significantly reduce energy intensity, thus reducing carbon emissions.
Through reading the literature, we found that researchers usually covered the whole manufacturing industry in terms of the carbon emissions of the manufacturing industry and few scholars studied the issue of the carbon emissions industry lock-in of the manufacturing industry, which easily leads to the lack of pertinence of research and is not conducive to the carbon unlocking of the high-carbon manufacturing industry. In addition, in the analysis of carbon emissions influencing factors, researchers usually paid attention to the influencing factors of carbon emissions in the whole region. However, due to regional heterogeneous characteristics, there are significant differences in economic development level, natural resource reserves, opening-up degree and infrastructure construction in different regions. On this basis, whether there are differences in the key factors leading to carbon emissions in different regions needs to be further discussed. In addition, although related research has clarified the regional differences in manufacturing industry carbon emissions, there is still a lack of literature on the long-term spatial–temporal evolution of carbon emissions and the key factors of the regional lock-in of carbon emissions.
So, as far as China’s manufacturing industry is concerned, is there industry lock-in in its carbon emissions? What is the mechanism that leads to its lock-in? In addition, in the case of carbon lock-in in the high-carbon industry, is there regional lock-in in manufacturing industry carbon emissions? What are the key factors that lead to the regional lock-in? In order to answer these questions, this paper is based on the IPCC carbon emissions coefficient method and the energy consumption data from 2000 to 2016 to count the carbon emissions of 30 provinces in China. Based on the regional perspective, the GTWR model is used to study the regional factors of carbon emissions. This paper aims to provide a decision-making reference for China’s manufacturing industry to break the carbon lock-in and realize low-carbon transformation.

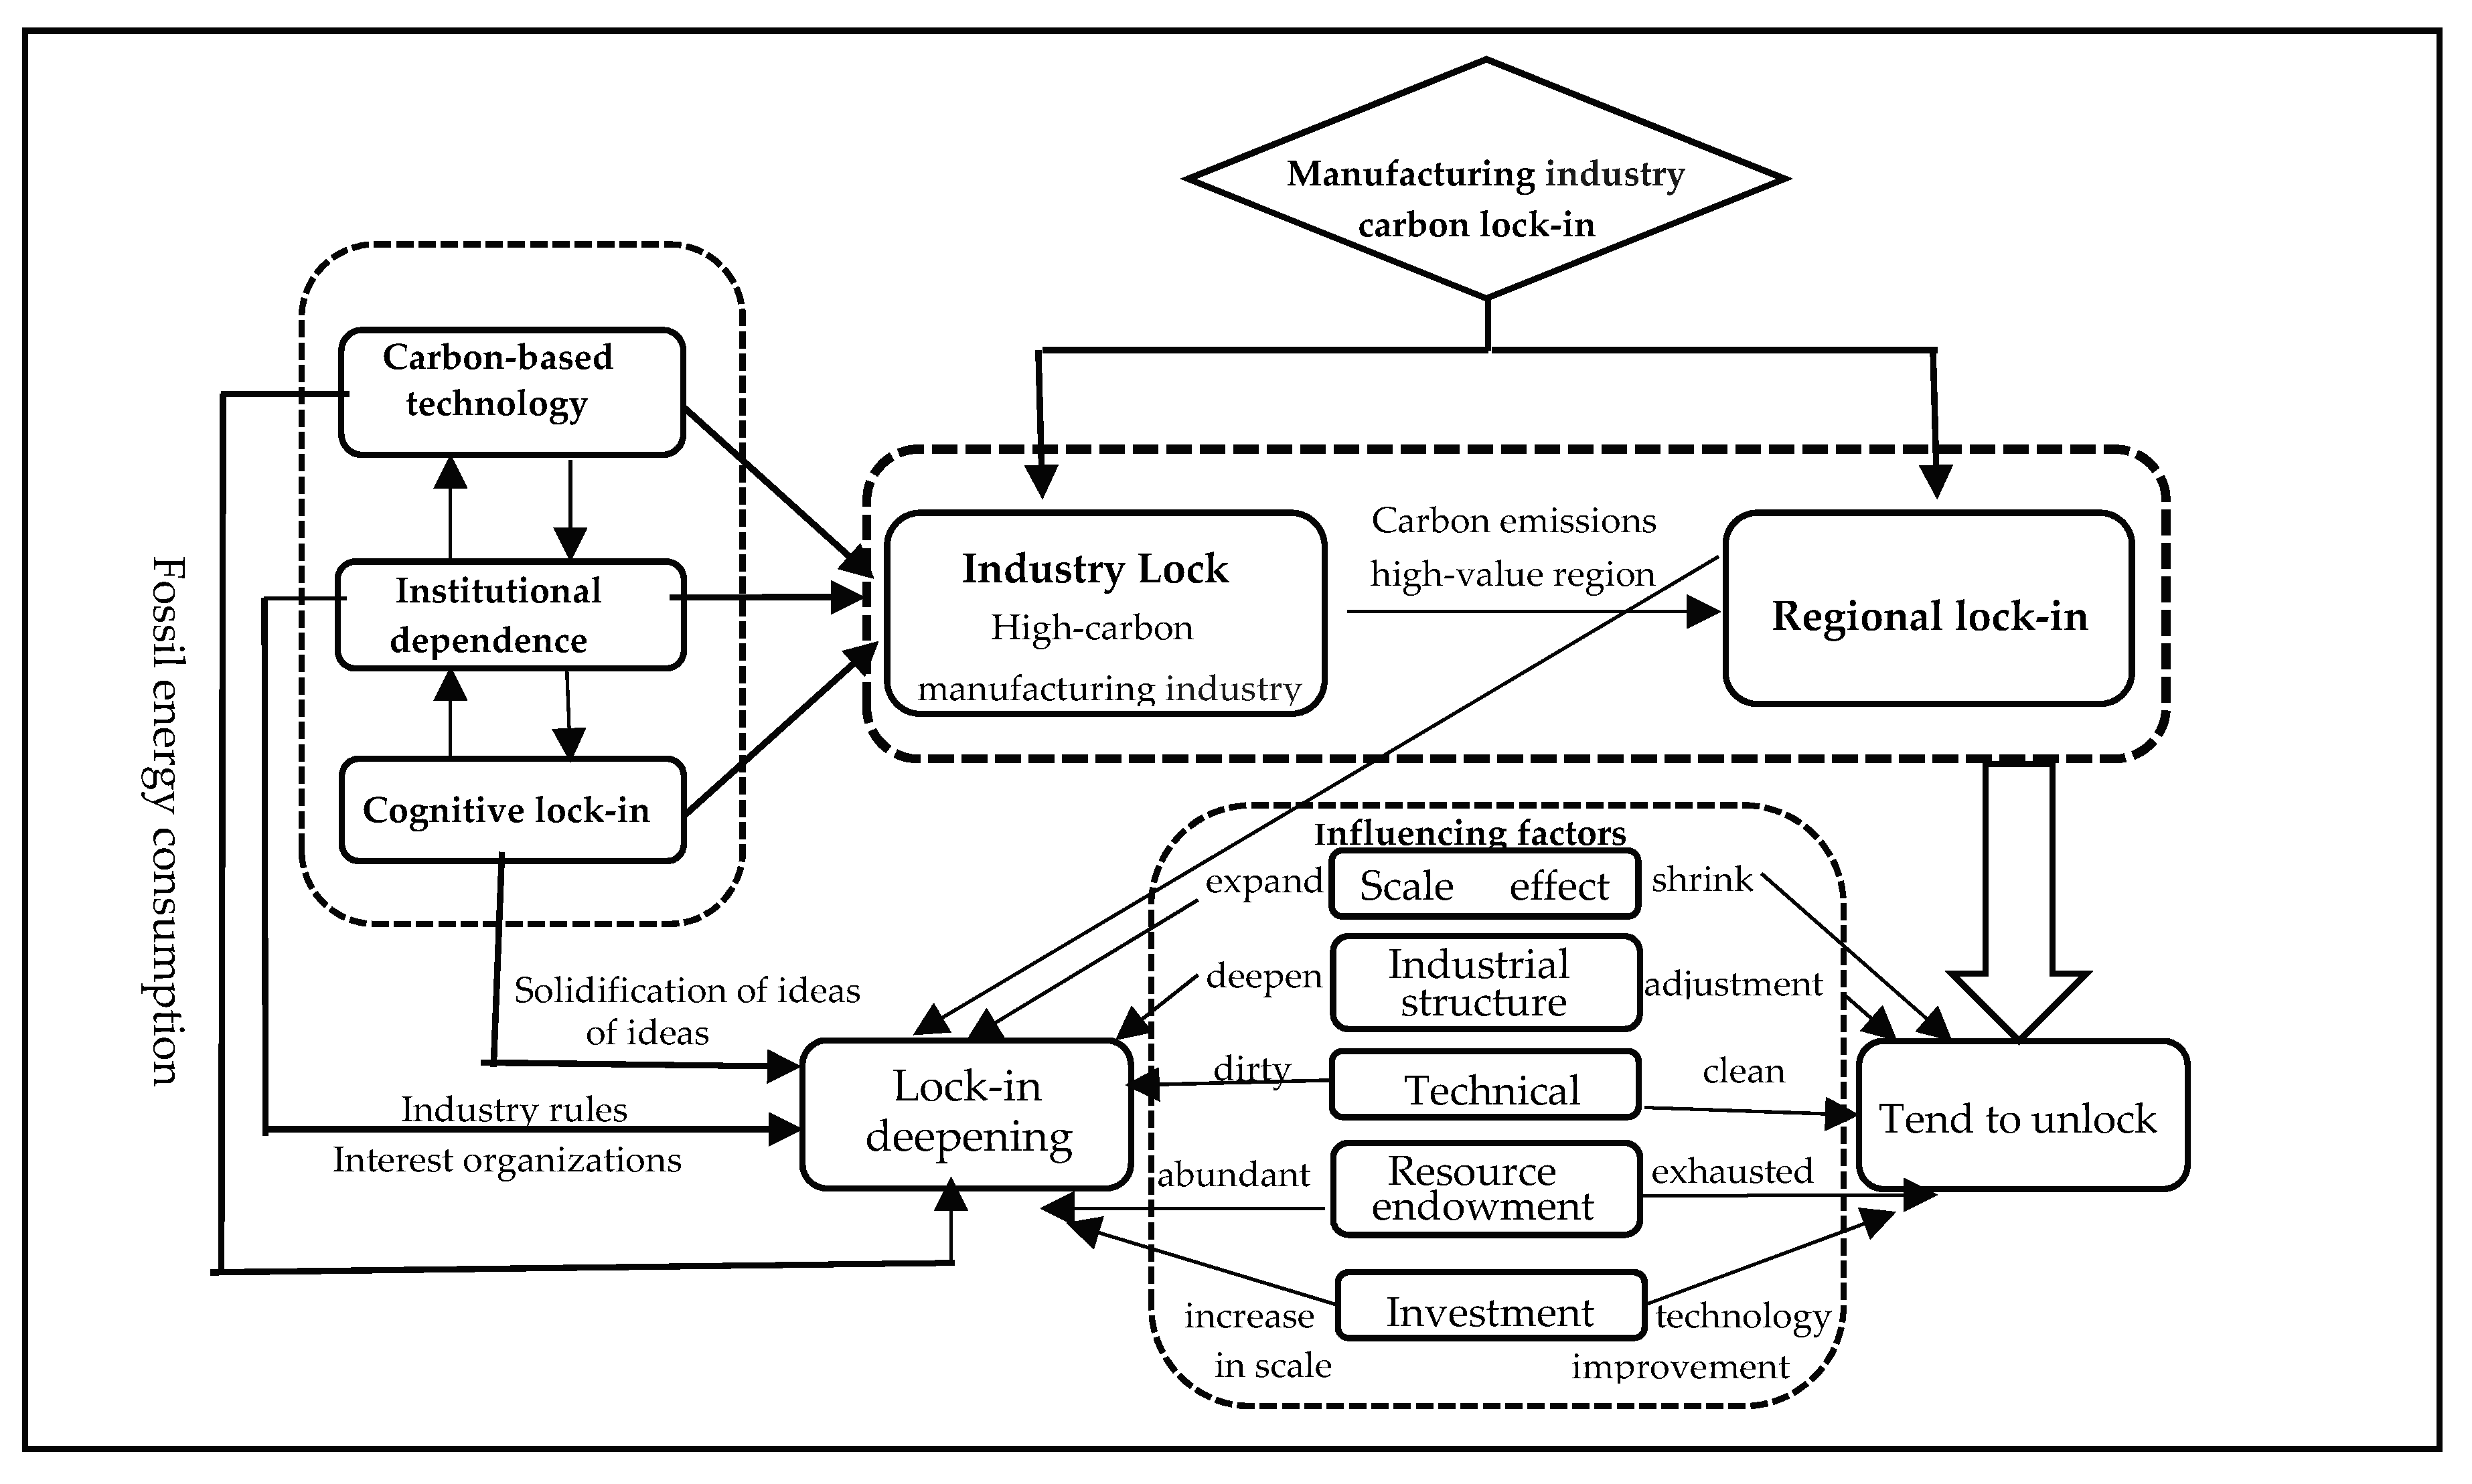
2. Analysis Framework

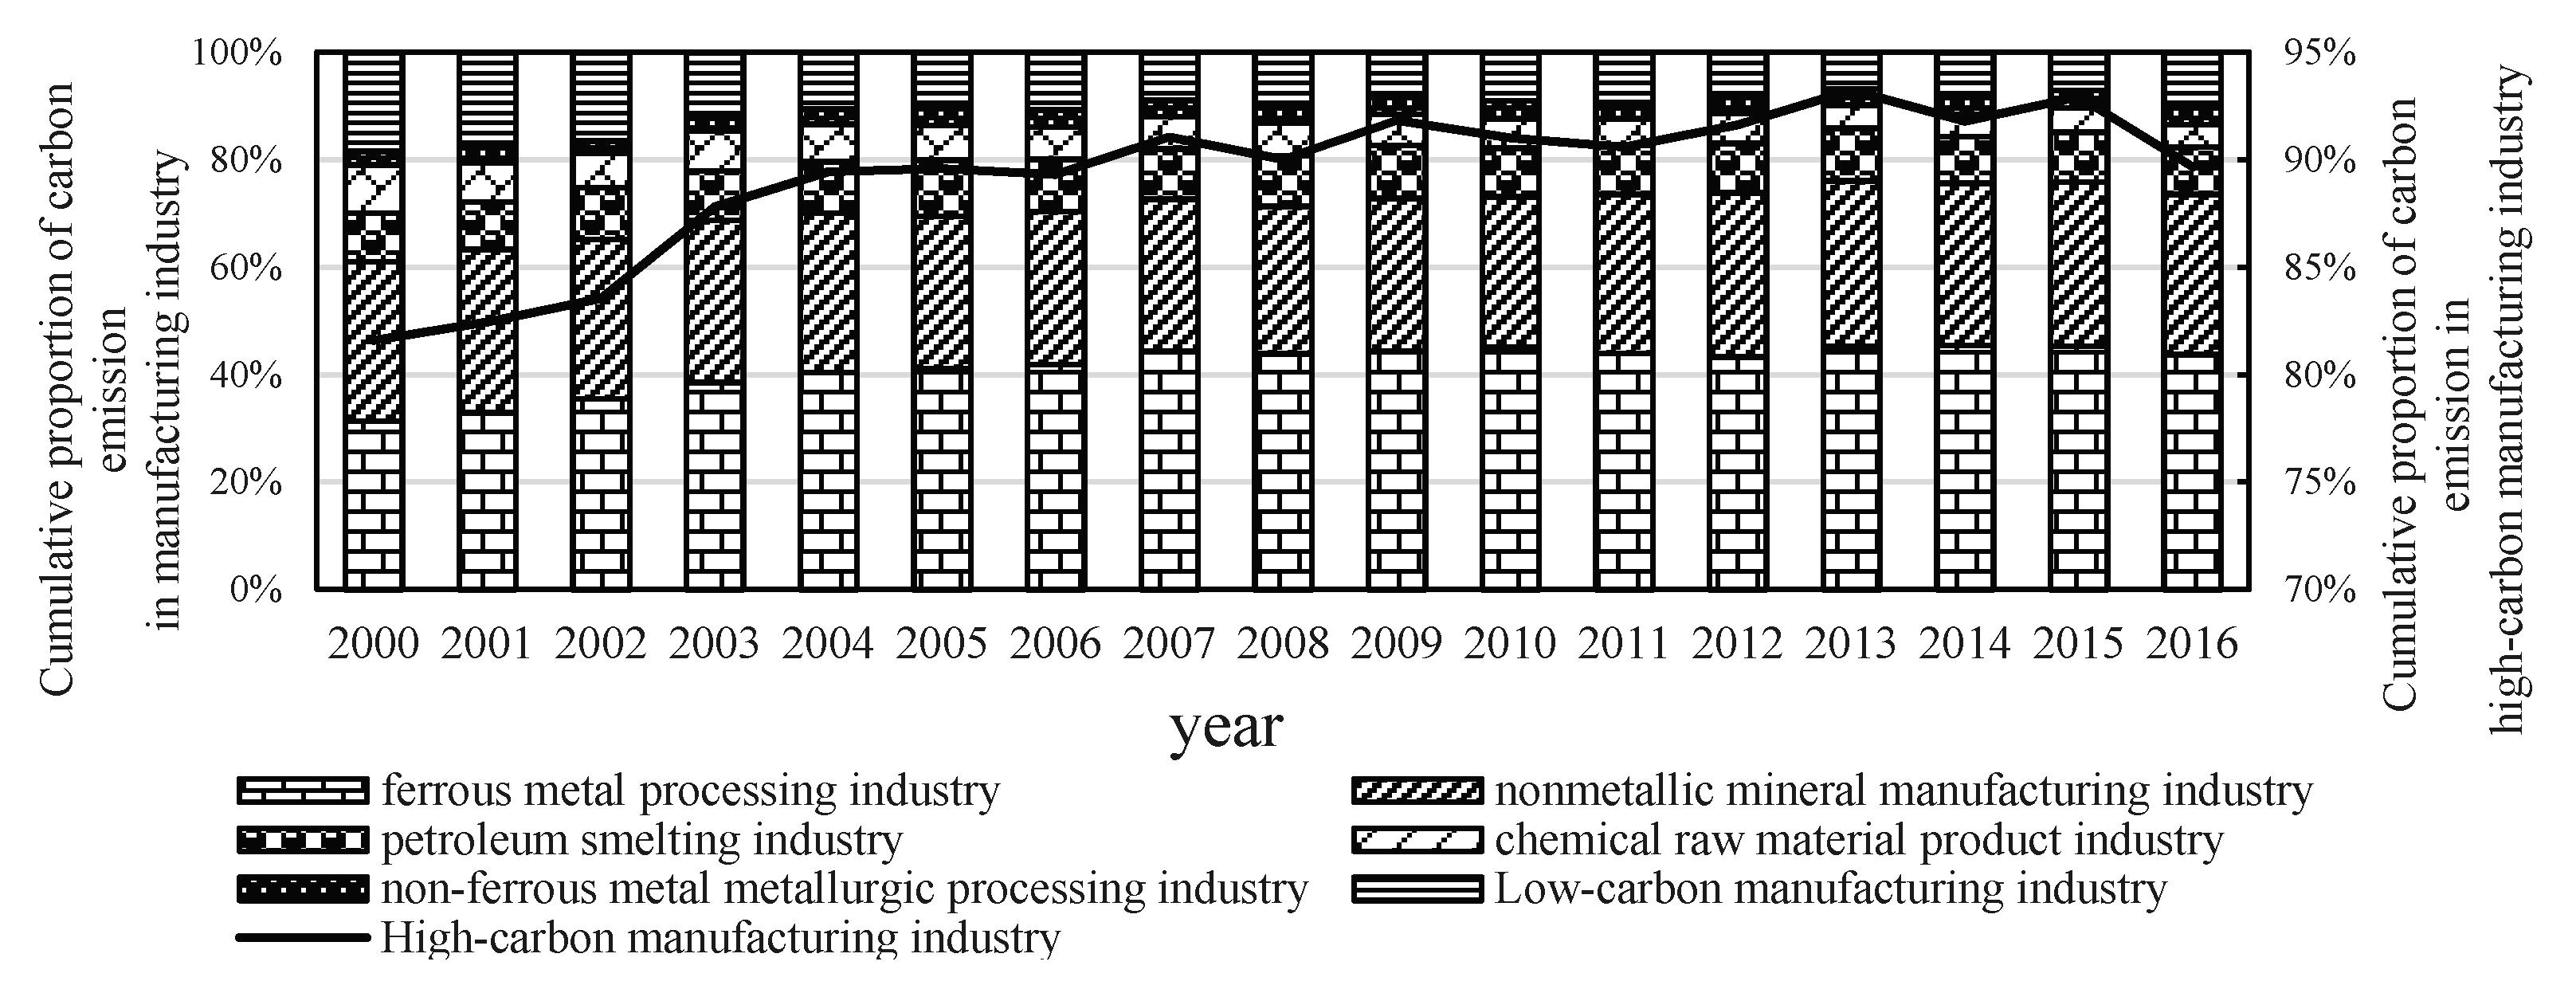
2.1. Carbon Lock-In of High-Carbon Manufacturing Industry

“Carbon lock-in” was first proposed by Unruh [10], who pointed out that once the carbon-based technology trapped in fossil energy is stable, under the positive feedback of increasing returns to scale, the stakeholders develop the system around high-carbon technology, thus gradually forming a “techno-institutional complex” (TIC). In addition, Unruh [11] further pointed out that the carbon-based technology is locked in fossil energy due to the path dependence formed by the interaction with the system, thus strengthening the carbon lock-in [12,13]. For the high-carbon manufacturing industry, due to industry attribute factors, its production activities rely on the deep processing of mineral resources. The dependence on the high consumption of fossil energy is an inevitable choice for the early development of the high-carbon manufacturing industry. However, under the positive feedback mechanism of increasing returns to scale, the production activities of high-carbon industries form a long-term dependence on fossil energy, hinder the development and promotion of clean energy and restrict the innovation of low-carbon technology [14]. At the same time, participants who benefit from the existing technology system have formed a series of industry rules and strengthen them in order to maintain their own economic interests, and the relevant institutional system has been continuously improved to form institutional lock-in. Due to the interaction of social, economic and institutional factors, the technology system lock-in is further deepened, which makes it difficult for the high-carbon manufacturing industry to achieve carbon unlocking (Figure 1).

2.2. Carbon Lock-In of High-Carbon Regional and Influencing Factors

“Regional lock-in” is considered to be a phenomenon of regional development [15]. Due to time and historical factors, some systems in regional development self-reinforce and evolve on specific paths [16]. The regional lock-in of manufacturing industry carbon emissions is mainly realized by the regional lock-in of high-carbon manufacturing industry production activities. Its essence is formed by the internal carbon-based technology, institutional dependences and a series of external factors affecting the economic development of the high-carbon manufacturing industry.
As far as the influencing factors are concerned, resource endowment, investment intensity, industrial structure, market factors, technological effects, industrial policies and other factors have an impact on the production and development of the high-carbon manufacturing industry [17,18,19,20,21,22,23,24] and cause the regional lock-in of carbon emissions from different aspects. In the early stage of the economic development of the high-carbon manufacturing industry, due to industry attribute factors, the areas with abundant mineral resources lead to a higher return rate on capital and the increasing return on scale makes the capital continuously concentrate to the areas with higher resource endowment levels, which leads to the continuous expansion of production scale. In addition, the carbon-based technology with fossil energy consumption as the main body leads to the carbon emissions locked in the regions with higher resource endowment levels. However, with the continuous development of the high-carbon manufacturing industry economy, mineral resources in many regions are beginning to dry up, capital investment efficiency is low and infrastructure such as transportation and information equipment are constantly improving [25]. Market factors in many regions will gradually surpass resource endowment, which has a significant impact on the production layout of the high-carbon manufacturing industry, but at the same time, the energy consumption structure dominated by fossil energy will not be fundamentally improved and the carbon emissions of the manufacturing industry will form a new round of regional lock-in (Figure 1).

3. Research Methods and Selection of Variables

3.1. High-Carbon Industry Lock-In

Firstly, the manufacturing industry carbon emissions of different provinces were calculated by the carbon emissions coefficient method:
C i = k = 1 30 C i k = m = 1 q E i k m × F i k m + E i k d × F i k d + E i k r × F i k r
where Ci refers to the total manufacturing industry carbon emissions of province i (i = 1,2, ……… 30) (10,000 t); Cik is the total carbon emissions of the industry k in the i province (k = 1,2, ……… 30) (10,000 t); Eikm is the energy consumption of fossil type m of industry k in the i province (10,000 t); Fikm is the CO2 emissions coefficient of fossil type m of industry k in the i province (10,000 t); Eikd and Eikr are the electricity and thermal power consumptions of industry k in the i province (10,000 t); and Fikd and Fikr are the CO2 emissions coefficients of the electricity and thermal power of industry k in the i province (10,000 t). The carbon emissions coefficient referred to the Guideline on IPCC National Greenhouse Gas List in 2006. It has to be noted that Fikd has temporal and spatial differences due to the different average carbon emissions factors of regional power grids in different provinces.
Secondly, we identified the high-carbon lock-in industries. The total carbon emissions of 30 manufacturing industries in China from 2000 to 2016 were calculated in the order from high to low. The results show that the cumulative carbon emissions of the ferrous metal processing industry, non-metallic mineral manufacturing industry, petroleum smelting industry, chemical raw material product industry and non-ferrous metal metallurgic processing industry account for over 81.59% of the total manufacturing industry carbon emissions. Moreover, all of these five industries occupy the first eight positions of manufacturing industry carbon emissions in 30 provinces. Therefore, they were used as the high-carbon manufacturing industries in China (Figure 2).

3.2. GTWR Model

A traditional multiple linear regression model can interpret the global influences of selected indexes on dependent variables to some extent, but it cannot explain the spatial–temporal heterogeneous characteristics of the influence level [26]. Fotheringham et al. [27] introduced the geographical weighted regression (GWR) model by quantifying the spatial heterogeneous characteristics of the influencing factors of economic development. The GWR model applied the spatial position of geographical objects as one of the regression parameters and implemented local regression fitting by observing adjacent sample data. However, the GWR model cannot study the panel data of long-time series scientifically. To overcome this limitation, Huang et al. [28,29] included the time dimension into the GWR model and constructed a spatial–temporal geographical weight matrix to process the non-stationary temporal and spatial panel data of different provinces.
Since panel data with spatial–temporal characteristics were chosen in this study, carbon emissions factors may make data non-stationary because of spatial–temporal complexity and dependence. As a result, the GTWR model was used to measure the spatial–temporal characteristics of carbon emissions factors in the high-carbon manufacturing industry. The GTWR model can be expressed as:
Y i = β 0 ( μ i , v i , t i ) + a = 1 n β a ( μ i , v i , t i ) X i a + ε i
where Yi is the carbon emissions of the i province (i = 1,2, ……… 30); n is the number of influencing factors (n = 1,2, ……… 6); ( μ i , v i , t i ) is the space–time coordinates of the i province; β 0 ( μ i , v i , t i ) is the space–time intercept term of the i province; β a ( μ i , v i , t i ) is the regression coefficient of variable a of the i province, which refers to the weight of the model function in the space–time coordinates ( μ i , v i , t i ) ; Xia is the value of the explanatory variable a of the i province; and ε i is the residual error.

3.3. Index Selection of Carbon Emissions Influencing Factors

In order to reflect the regional influence factors in the carbon emissions of the high-carbon manufacturing industry under the background of rapid industrialization, referring to the existing literature [16,17,18,19,20,21,22,23] and combining the availability of data and the problem of multi-collinearity among independent variables, this paper selected variables such as scale effect, structural effect, technological effect, resource endowment and foreign direct investment (Table 1).
(1) Scale effect (P): There are obvious regional differences in the impact of scale effect on high-carbon manufacturing carbon emissions. Among them, when the high-carbon manufacturing industry is in the stage of increasing returns to economic scale, with the continuous expansion of regional output scale, the demand for energy consumption also increases, and under the rigid condition of fossil energy consumption as the main part, carbon emissions also increase, thus strengthening the regional lock-in of carbon emissions [30]. Since the GDP (gross domestic product) index failed in the collinearity test, the sales value of the high-carbon manufacturing industry was chosen to measure the impact of scale effect on regional carbon lock-in.
(2) Structural effect (IS): In this study, the manufacturing industries with high-carbon lock-in (the ferrous metal processing industry, non-metallic mineral manufacturing industry, etc.) are all high-energy consumption industries. However, at present, it is difficult for the energy consumption structure dominated by fossil fuels to achieve fundamental changes. To some extent, the high-energy consumption industry means the high-carbon emissions industry. Therefore, the higher the proportion of high-carbon manufacturing industries, the more unfavorable it is to achieve regional carbon unlocking [31]. The proportion of high-carbon manufacturing industry employment in the total manufacturing industry was applied to measure the impact of structural effect on regional carbon lock-in.
(3) Technological effect (T): The expenditure of technology cost has obvious biases. Among them, the “green point” of technological progress caused by technological expenditure is the primary factor to reduce carbon emissions [28,32]. However, if the enterprise profits through the development of “dirty” technology, coupled with the path dependence of technological progress, the development of “dirty” new technology will lead to the increase of carbon emissions, further leading to the carbon emissions industry and regional lock-in. In this study, the internal R&D (research and development) expense of the high-carbon manufacturing industry was chosen to measure the influences of technological effect on the carbon emissions industry and regional lock-in.
(4) Resource endowment (RE): Resource endowment is one of the important factors that influence the production layout of enterprises. The development level of coal, oil, ferrous metal, non-ferrous metal and the non-metal mining industry plays a critical role in the production layout of the high-carbon manufacturing industry. In terms of different regions, the higher the development level of coal, oil and other mining industries, the more unfavorable it is to achieve regional carbon unlocking. In this study, the total production and sales volume of the coal mining industry, petroleum mining industry, ferrous metal mining industry, non-ferrous metal mining industry and non-metallic mining industry was chosen to measure the impact of the resource endowment level of the high-carbon manufacturing industry on regional carbon lock-in.
(5) Foreign direct investment (FDI): The environmental impact of foreign investment on host countries has two sides. Part of the research results show that the increase of foreign direct investment is not only conducive to improving the capacity of environmental regulation, but also conducive to the development of clean-energy through the introduction and absorption of advanced technology, so as to achieve carbon emissions reduction. However, another part of the research results believes that the increase of foreign direct investment in the high-carbon manufacturing industry will lead to the increase of production. However, it is difficult for the energy consumption structure dominated by fossil fuels to achieve a breakthrough, which will inevitably lead to the increase of carbon emissions and further strengthen the regional carbon lock-in [27]. In this study, the amount of FDI of the high-carbon manufacturing industry was chosen to measure influences of FDI on regional carbon lock-in.

4. Results and Analysis

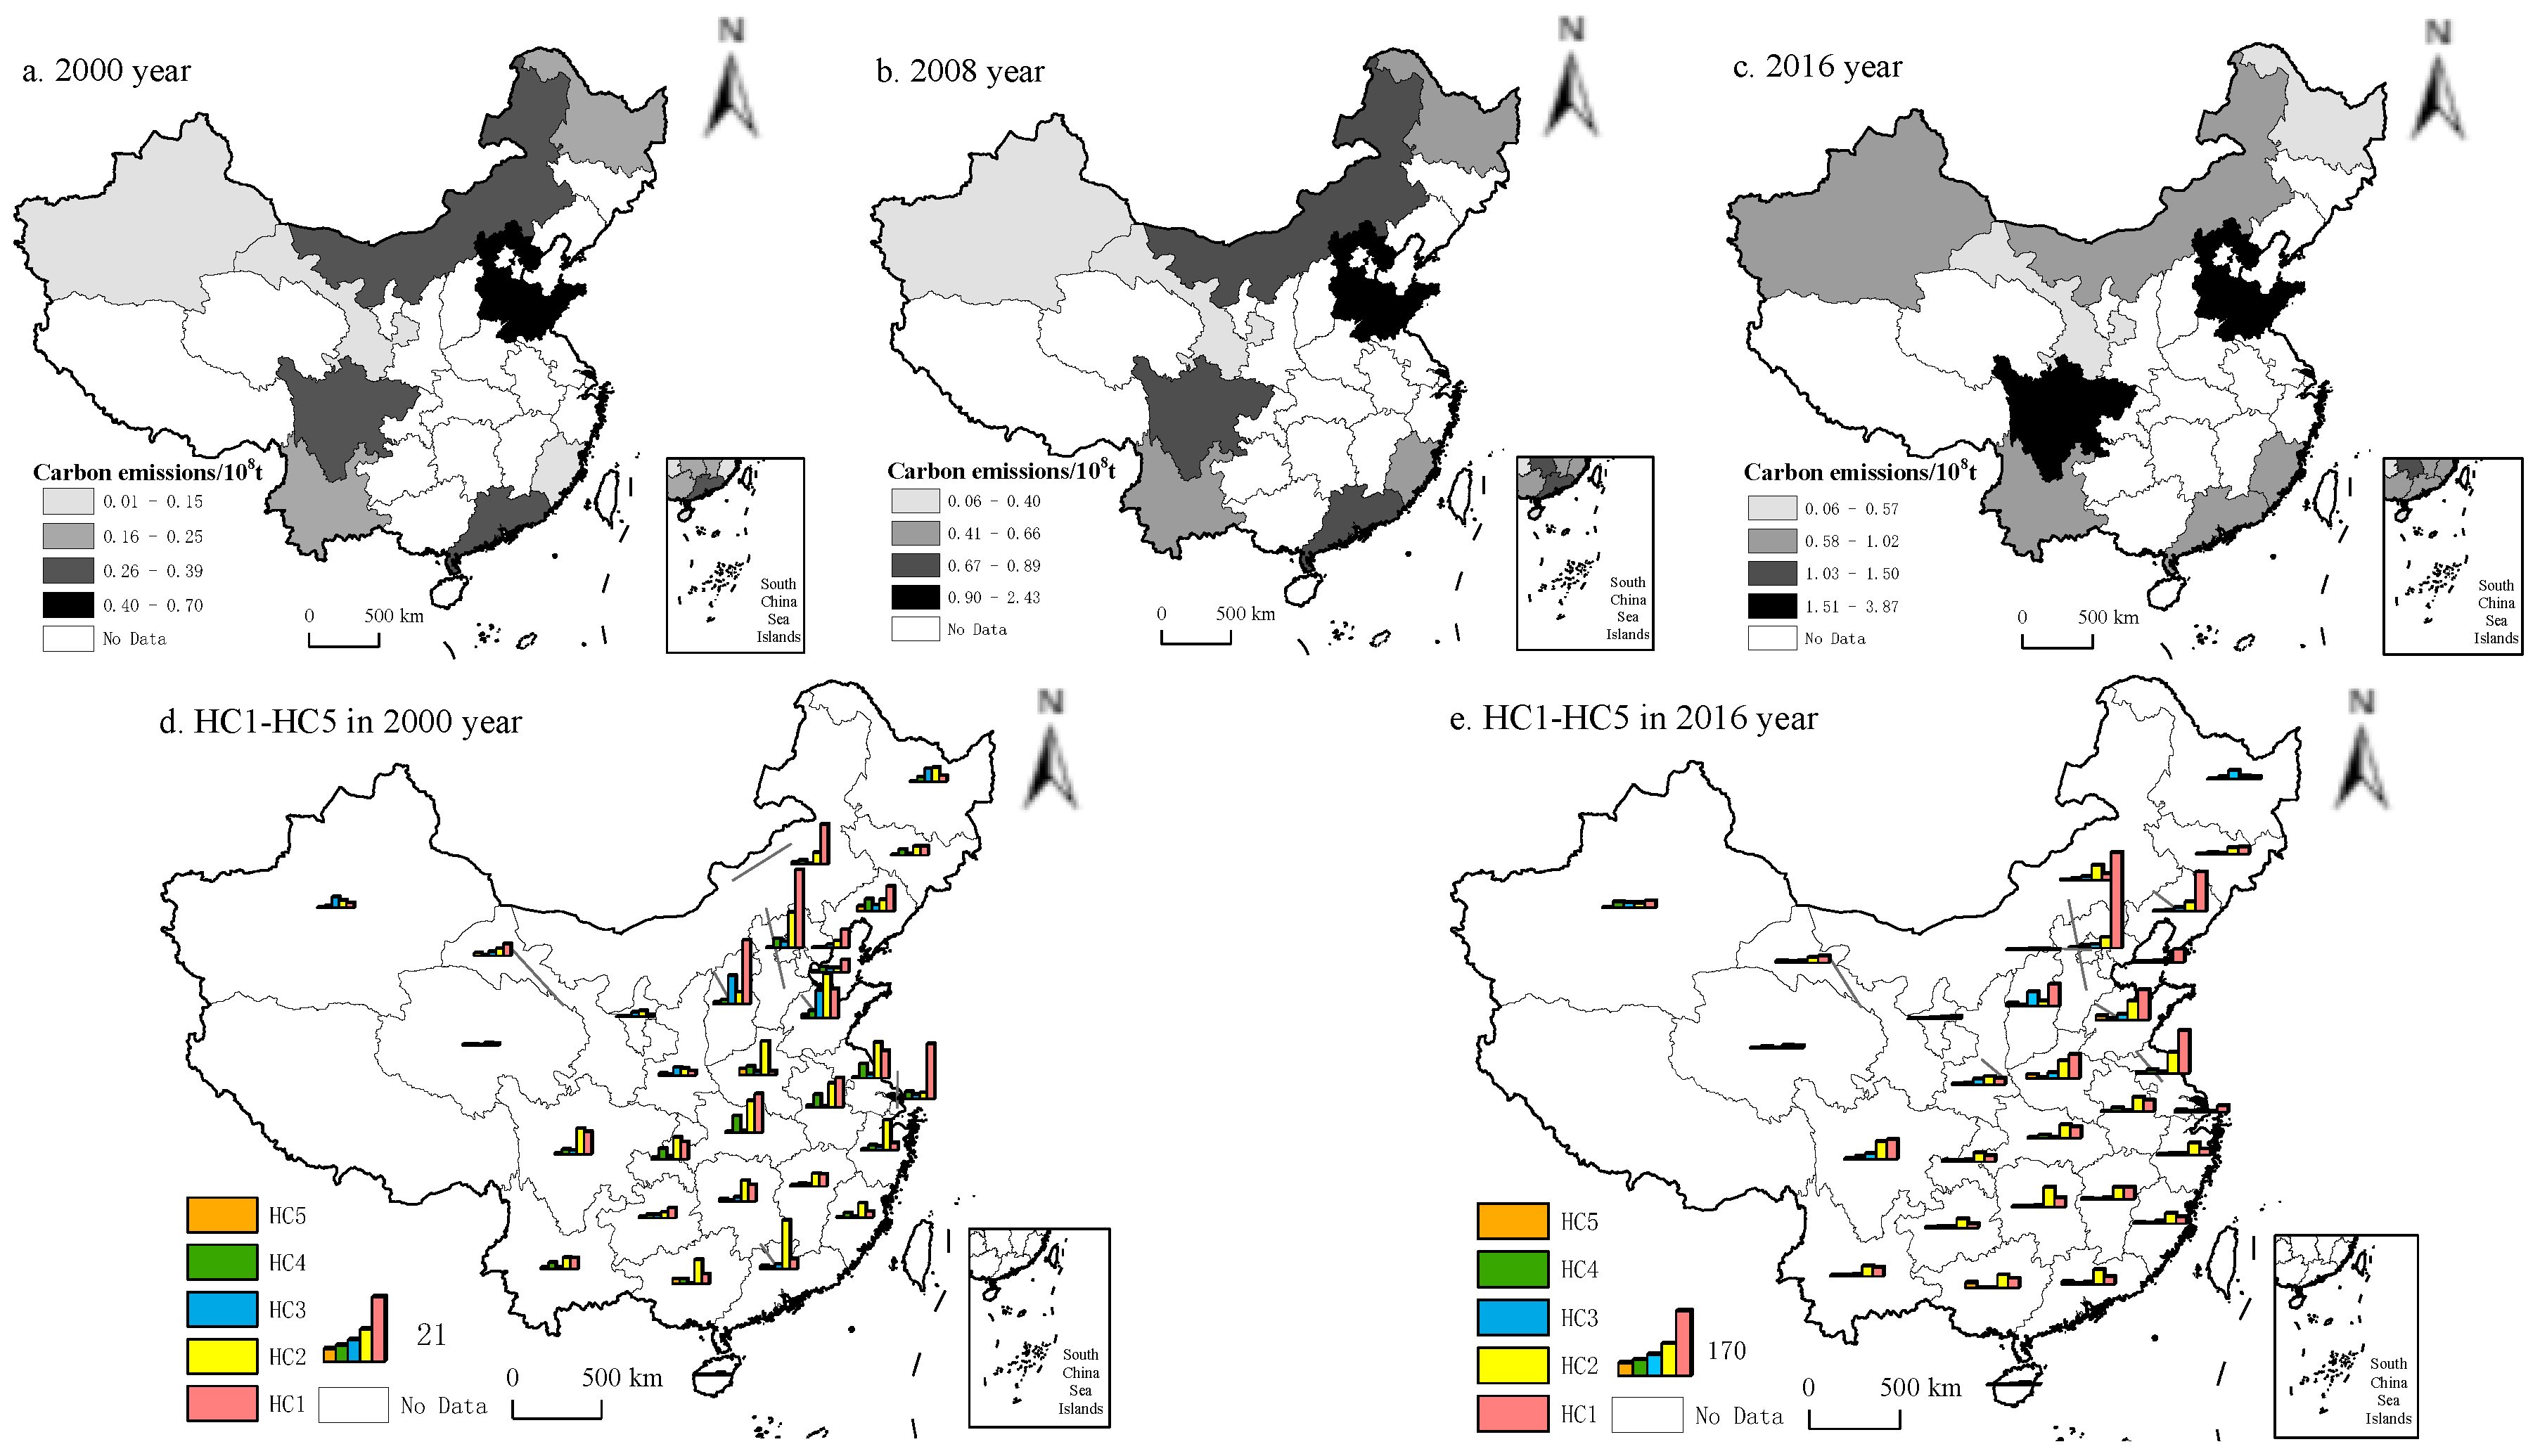
4.1. Spatial–Temporal Differentiation and Regional Lock-In in Carbon Emissions of High-Carbon Manufacturing Industry

(1) There are significant provincial differences in the carbon emissions of the high-carbon manufacturing industry (Figure 3a–c). From 2000 to 2016, except for Beijing, carbon emissions in the rest of the provinces increased to different extents. Hebei, Jiangsu and Shandong showed high carbon growth based on high carbon emissions. Moreover, the carbon emissions of the high-carbon manufacturing industry showed a spatial distribution pattern of high in the East and low in the West. In addition to Sichuan’s higher carbon emissions in 2016, the carbon emissions in the provinces in the Western region were generally low. Specifically, the carbon emissions of the high-carbon manufacturing industry in Sichuan increased greatly from 2000 to 2016 and may be closely related with industrial transfer from Eastern and Central regions [33,34].
(2) The carbon emissions of high-carbon manufacturing industries have significant regional accumulation and lock-in. From 2000 to 2016, provinces that are in the “hot spot” of carbon emissions are concentrated in Bohai Bay (Liaoning, Hebei, Shandong) and the Central region (Shanxi, Henan), which shows that there is a significant regional lock-in effect in carbon emissions.
(3) There are significant industry differences in the carbon emissions of the high-carbon manufacturing industry (Figure 3d,e). From 2000 to 2016, the ferrous metal processing industry presented a high absolute value of carbon emissions, which accounted for more than 39.44% of the total carbon emissions in high-carbon manufacturing industries. In addition, the spatial location of its carbon emission “hot spots” is consistent with the location of the overall high-carbon manufacturing industry. Among them, Hebei Province has the highest carbon emissions and is extremely prominent. The non-metallic mineral manufacturing industry made great contributions to carbon emissions (> 30.46%). Besides, carbon emissions in the non-metallic mineral manufacturing industry presented significant differences divided by the population distribution line (Hu’s line). Provinces in the Eastern regions, such as Jiangsu, Hunan, Shandong and Henan, had high carbon emissions and carbon growth. Differently, provinces in the Western regions had relatively low carbon emissions except for Inner Mongolia. The petroleum smelting industry ranked moderate with respect to carbon emissions and it accounted for more than 9.42% of the total carbon emissions in the high-carbon manufacturing industry. Moreover, the high value regions were mainly in provinces at the middle and lower reaches of the Yellow River (Shanxi, Henan and Shandong) and Heilongjiang Province. Due to the high resource endowment (Changqing, Shengli and Daqing oilfields), the petroleum smelting industry had enough development advantages. However, with the expansion of the economic scale, the high-emission energy consumption structure was not improved, which led to the high carbon emissions. The chemical raw material product industry contributed more than 4.58% of the total carbon emissions in the high-carbon manufacturing industry. Among them, carbon growth in Xinjiang exceeded 0.18 × 10⁸ t. Because of China’s cooperation suggestions for the “Belt and Road”, infrastructures for the development of the chemical raw material product industry in Xinjiang were perfected gradually. Moreover, the Asia–Europe international market expanded continuously, which expanded the scale of production and energy consumption for the chemical raw material product industry in Xinjiang. Therefore, carbon emissions in Xinjiang increased accordingly. The non-ferrous metal metallurgic processing industry had the lowest proportion of carbon emissions in the high-carbon manufacturing industry and the carbon growth exceeded 0.79 × 10⁸ t. With respect to spatial distribution, all provinces had low carbon emissions except Shandong, Henan and Guangxi.

4.2. Analysis of Determinants in Carbon Emissions of High-Carbon Manufacturing Industry

4.2.1. Model Selection of Determinants and Data Preprocessing

(1) Model selection: The above research showed that there were significant regional differences in the carbon emissions of the high-carbon manufacturing industry. Regional differences should be considered in the analysis of carbon emissions factors. Therefore, the regional spatial analysis model was more suitable for this study. However, the GTWR model is based on the GWR model and further grasps the regional differences of different influencing factors on carbon emissions in time, which can provide the analysis of carbon emissions influencing factors in different times and different regions, and also help to find out the key factors that lead to the regional lock-in of carbon emissions in the research period.
In this study, the global Moran’s I index was used to measure the spatial correlation of carbon emissions in China’s high-carbon manufacturing industry from 2000 to 2016. The results are shown in Table 2. The index presented the fluctuating characteristics of rising first and then falling, which indicates that the spatial concentration of carbon emissions in the high-carbon manufacturing industry changed from increasing to a weak decline. Meanwhile, this result passed the significance test of 5%, which also suggests that the carbon emissions between adjacent provinces had a certain degree of spatial spillover effect. Considering all of the above findings, the spatial–temporal geographical weighted regression model (GTWR), which can nest the interaction between time and space, was finally selected to analyze the spatial–temporal differences of the determinants of carbon emissions in different regions.
(2) Data preprocessing: This paper used the space–time panel data. First, in order to reduce the possible multi-collinearity and heteroscedasticity of the determinants, the explanatory and interpreted variables were represented by their natural logarithms. Second, adopting “Strata 15” to test the multi-collinearity of each variables, the test results were as follows. The VIF (Variance inflation factor) of scale effect was the highest, reaching 7.30, and the resource endowment VIF was the lowest (1.54). Besides, the mean of the VIF of the explanatory variable was equal to 5.41. All of them passed the test (VIF < 10), which indicated that there was no multi-collinearity between variables.

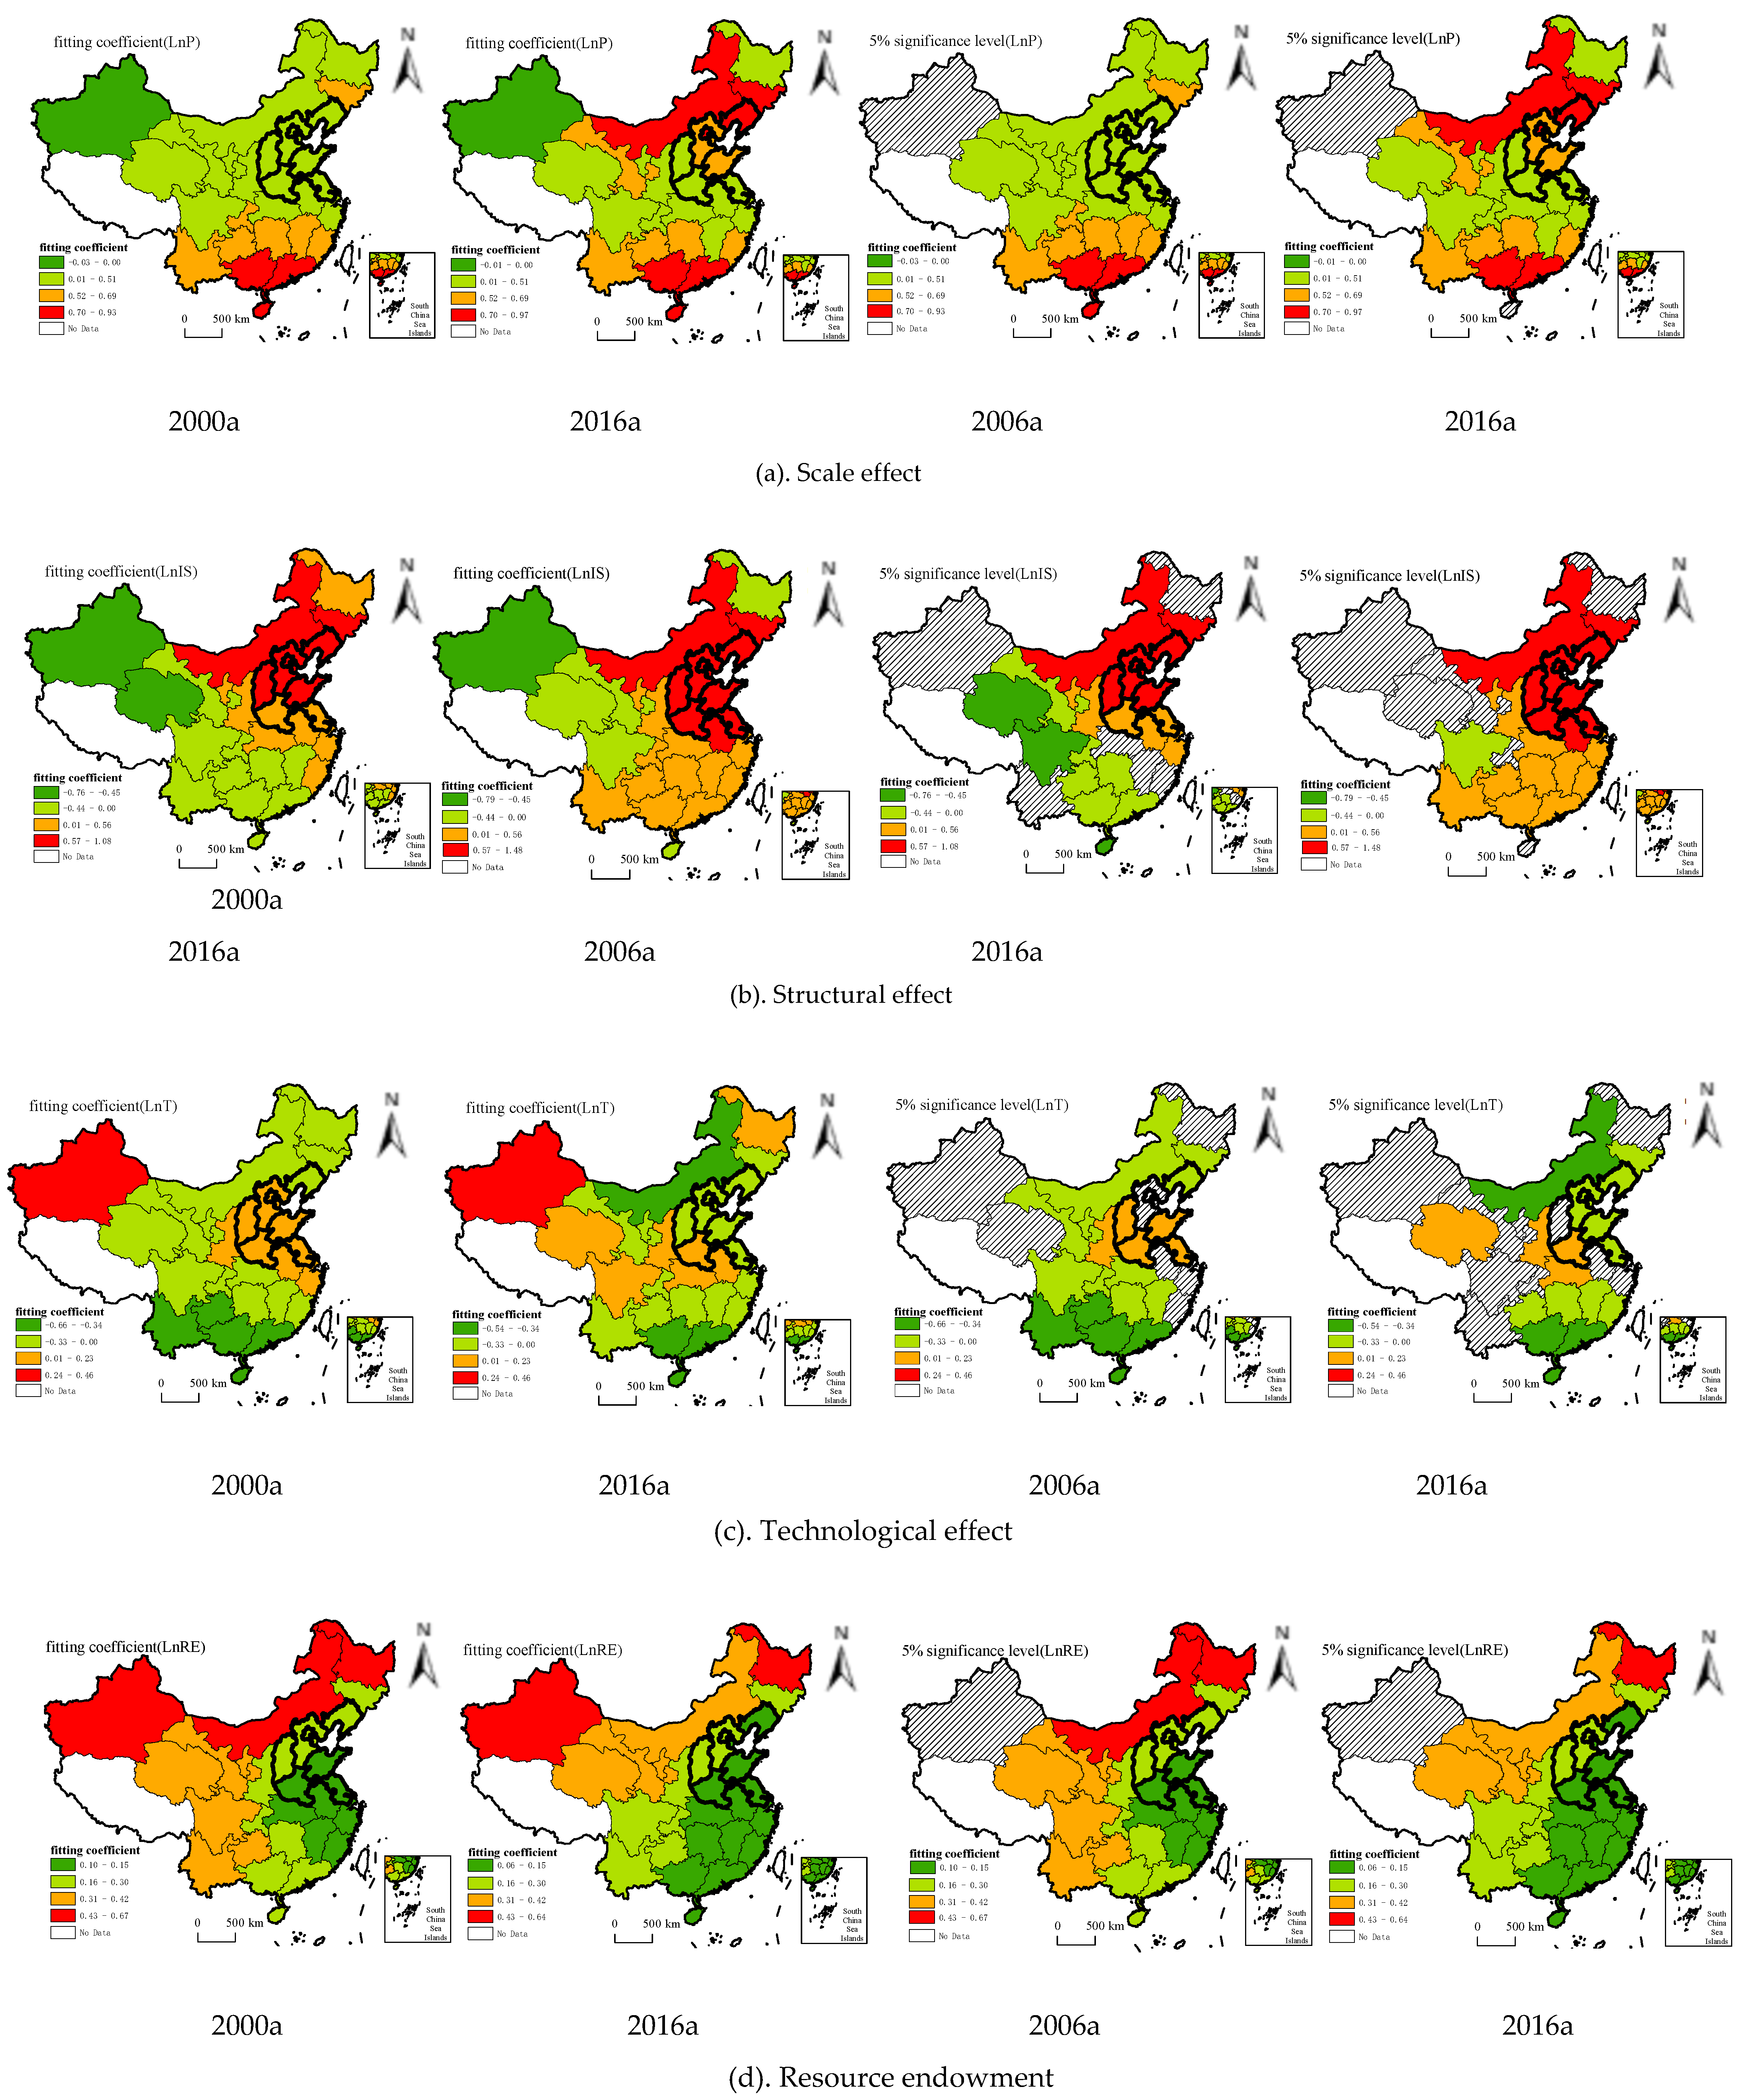
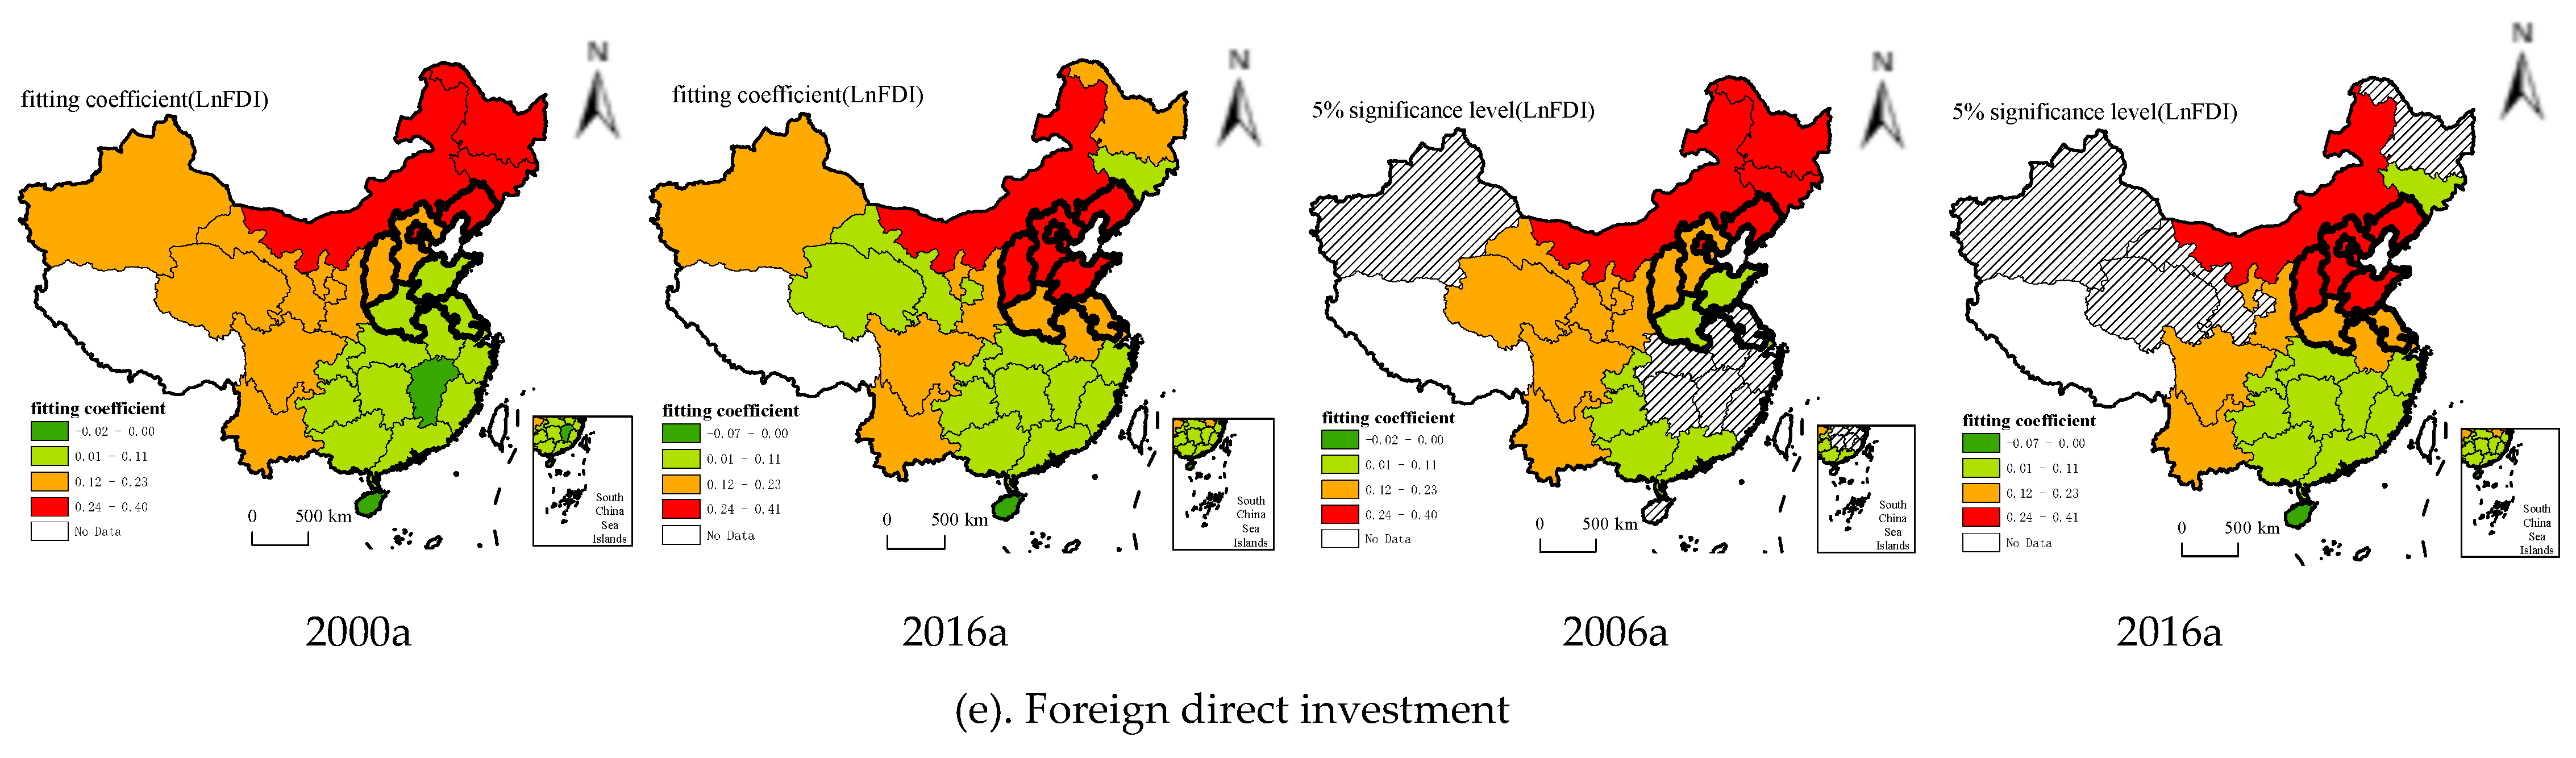
4.2.2. Spatial–Temporal Differentiation of Carbon Emissions Influencing Factors

Based on the above analysis, this paper used the spatial–temporal geographical weighted regression Arcgis10.3 plug-in (Chinese University of Hong Kong, Hong Kong, China), which was developed by Huang et al. [28,29] to analyze the influencing factors of carbon emissions in 2000 and 2016 (in which the bandwidth is automatically optimized, the ratio of spatiotemporal distance parameters is one and the time coordinate T is node years). Where, by using the GTWR model, the R2 was 0.933, the adjusted R2 was 0.929 and the AICc (Akaike information criterion) value was 82.023, indicating a good fitting effect. Secondly, the Nature Breaks Jenks classification method was used to rank the fitting coefficient of various influencing factors on carbon emissions in 2000 and 2016 (it has to be pointed out that the values of the fitting coefficient are the sum of the influencing factors to the carbon emissions of the province and the spillover effect of the carbon emissions in the adjacent provinces). In addition, this article visualized the significance level of the fitting coefficient. The results were as follows (Figure 3):
(1) Scale effect (lnP): Except for Xinjiang, the scale effect had a positive effect on carbon emissions in all provinces, but Xinjiang failed in the significance test of 5% (Figure 4a). In 2000, the fitting coefficient of economic scale to carbon emissions was generally higher in the South than in the North. Among them, the regions with a high fitting coefficient were Guangdong, Guizhou and Hainan. By 2016, the expansion of the high-carbon manufacturing industry economy in the Northern provinces (Inner Mongolia, Jilin, Liaoning, etc.) significantly enhanced its positive effect on carbon emissions. Due to the high degree of the economic development of the high-carbon manufacturing industry in Guangdong Province, compared with other influencing factors, economic scale had a stronger positive effect on carbon emissions. From 2000 to 2016, the economic scale of the high-carbon manufacturing industry in Inner Mongolia, Jilin and Liaoning expanded rapidly, with a large increase in sales value. However, the high-carbonization energy consumption structure was not fundamentally improved, resulting in a high fitting coefficient of economic scale expansion to carbon emissions.
(2) Structural effect (lnIS): In 2000, the high-value regions of the carbon emissions fitting coefficient of the high-carbon manufacturing industry clustered in North China, Jilin and Liaoning. Over time, in 2016, the change of the industrial structure led to the significant increase of carbon emissions in Henan, Anhui and Jiangsu Provinces (Figure 4b). At the same time, the provinces with high carbon emissions caused by the change of industrial structure all passed the significance test of 5%. Compared with other provinces, high-carbon manufacturing industries in Beijing, Tianjin, Hebei, Shanxi, Shandong and Liaoning accounted for a higher proportion of provincial manufacturing industries and had a long history of development. Due to high economic benefits and strong path dependence, it is difficult to achieve carbon emissions reduction through industrial structure adjustment. Anhui and Henan had higher carbon growth due to the high proportion of non-metal processing industries in the manufacturing industry. As for Jiangsu Province, it was the development of the ferrous metal processing industry that led to the increase of carbon emissions.
(3) Technical input (lnT): In 2000, the provinces in which manufacturing industry technology expenditure had a positive effect on carbon emissions concentrated in the North China Plain and its adjacent provinces. Among them, Shaanxi, Shanxi, Henan, Shandong and Jiangsu passed the significance test, and the most significant carbon emissions reduction was in the Southern coastal provinces. Over time, provinces where technology spending had a positive effect on carbon emissions moved Westward in 2016. Among them, Henan, Shaanxi, Hubei and Qinghai passed the significance test. In addition, the impact of technology expenditure on Beijing, Tianjin, Hebei, Shandong and Jiangsu provinces on carbon emissions changed from positive to negative (Figure 4c). This was because the technology expenditure was obviously biased [35,36]. In addition, it will take a certain period of time for the application of new technologies to achieve carbon emissions reduction [23]. Provinces such as Beijing and Tianjin make use of science and technology expenditure to develop “clean” technologies, so as to achieve carbon emissions reduction. However, in Hubei, Qinghai and other provinces, due to the relatively backward production technology, science and technology expenditure mainly improves the utilization rate of fossil energy, while the development and utilization capacity of clean energy is limited, leading to the fact that technology expenditure has not achieved carbon emissions reduction.
(4) Resource endowment (lnRE): From 2000 to 2016, the resource endowment of the provincial high-carbon manufacturing industry had a positive effect on its carbon emissions, and all of them passed the significance test except Xinjiang. In 2000, the fitting coefficient showed an increasing trend from East to West, and the high values were mainly distributed in Inner Mongolia and Heilongjiang. Over time, in 2016, the fitting coefficient of Southwest and South China decreased (Figure 4d). Compared with Eastern and Central China, Western China is rich in coal, oil and other mineral resources, and the economic development of the mining industry has a comparative advantage, which saves the cost of raw material transportation for the high-carbon manufacturing industry, and thus leads to the increase of carbon emissions due to the increase of production scale. In addition, the risk of resource exhaustion is higher in Southwest and South China, and the level of resource endowment is reduced, leading to a decline in the carbon emissions fitting coefficient.
(5) Foreign investment (lnFDI): In 2000, the regions with a high fitting coefficient of foreign investment to carbon emissions were mainly distributed in Northeast China, Inner Mongolia and Beijing. All of them passed the significance test. The fitting coefficients of Jiangxi and Hainan Provinces were negative, but failed to pass the significance test (Figure 4e). With the passage of time, the provinces with high fitting coefficients increased significantly in 2016, mainly distributed in the Bohai Bay and North China provinces. The fitting coefficient of Hainan Province was negative and passed the significance test. This article reflects the positive impact of foreign investment in the carbon emissions of the high-carbon manufacturing industry, contrary to the conclusion of Zhang et al. [32], who believed that foreign investment would introduce higher environmental regulation, energy-saving and emission reduction technologies.
(6) Carbon emissions regional lock-in: It can be seen from Figure 4a–e that the high-carbonization industrial structure was the key factor leading to the regional lock-in of carbon emissions, and compared with 2000, the strength of the lock-in was more intense in 2016, especially in Liaoning and Hebei (in 2016, the carbon emissions fitting coefficient both exceeded 1.04 (Table 3)). Secondly, the expansion of economic scale was also an important factor leading to the high carbon emissions in the lock-in regions. The extent of foreign investment in carbon emissions lock-in regions was strengthened. Technology investment was conducive to carbon emissions reduction in Liaoning, Hebei and Shandong, while exacerbating carbon lock-in in Shaanxi, Henan and Jiangsu. Although the influence degree of resource endowment on carbon emissions regional lock-in decreased slightly, it still showed a positive effect.

5. Conclusions and Implication

Based on provincial energy consumption data for the manufacturing industry, this paper used the IPCC carbon emissions coefficient method and the spatial–temporal geographic weighted regression model to analyze the carbon emissions of China’s high-carbon manufacturing industries and their regional influence factors from 2000 to 2016. The main conclusions are as follows:
(1) “Made in China” has a significant industry lock-in phenomenon of carbon emissions, and it is mainly locked in the ferrous metal processing industry, non-metallic mineral manufacturing industry, petroleum smelting industry, chemical raw material product industry and non-ferrous metal metallurgic processing industry. In addition, except for Beijing, the carbon emissions of high-carbon manufacturing industries have shown positive growth. There are obvious regional differences in carbon emissions, and there are obvious regional agglomerations and lock-in. In addition, there are significant industry differences in high-carbon manufacturing industry carbon emissions. The carbon emissions and carbon increase of ferrous metal processing industries are at absolute high levels, followed by the non-metallic mineral products industry, petroleum smelting processing industry, chemical raw material products industry and non-ferrous metal smelting and processing industry.
(2) From the analysis of GTWR results, there are significant differences in the key factors of carbon emissions in different regions. Among them, the expansion of economic scale is an important factor leading to the growth of carbon emissions in the Southern provinces. However, the high-carbonization of the industrial structure is the primary factor leading to the growth of carbon emissions in North China and Northeast China. Technological expenditures are conducive to carbon reduction in South China and the Southwestern provinces, but have led to increased carbon emissions in Shaanxi, Henan and Hubei Provinces. Resource endowments have significant positive effects on carbon emissions in Northwestern and Southwestern China. However, the provinces with the most significant positive effects of foreign investment on carbon emissions show a spatial–temporal distribution pattern that migrates from Northeast to North China. In addition, in terms of the analysis of carbon emission locked regions, the expansion of economic scale and the high-carbonization of the industrial structure are important factors that lead to the regional lock-in of carbon emissions. Compared to 2000, the degree of carbon emissions lock-in in 2016 is even more significant. In addition, foreign investment in 2016 is also an important factor that causes high carbon emissions in lock-in regions. Therefore, we find that the key to unlocking the carbon emissions lies in the rational adjustment and control of the industrial structure and economic scale of the high-carbon manufacturing industry. In addition, if we want to achieve carbon unlocking in high-carbon regions, we must further optimize the use of foreign investment, develop and promote clean energy and improve carbon-based technologies.
(3) It is the trend to realize the carbon unlocking of the manufacturing industry and take the road of green sustainable development. Firstly, attention shall be paid to “hot” provinces in the carbon emissions of the manufacturing industry. Secondly, heterogeneous characteristics of carbon emissions industries and regions shall be taken into account and more attention shall be paid to carbon emissions in the ferrous metal processing industry and Eastern China. In addition, when formulating measures of carbon emissions reduction, it is necessary to avoid policy equalization. Moreover, China is undergoing rapid industrialization and carbon emissions reduction shall not be achieved at the cost of economic benefits. Instead, provincial high-carbon manufacturing industrial structures shall be further adjusted reasonably (especially in North China and Northeast China). In addition, the increased technological expenditure can reduce carbon emissions in the high-carbon manufacturing industry to a limited extent. Therefore, breaking technological bottlenecks and developing energy-saving and emission-reduction technologies (development and utilization of new energy) are still the key breakthrough points for the government and enterprises to reduce carbon emissions at present. Finally, the spatial heterogeneity and spillover effect of carbon emissions factors in the high-carbon manufacturing industry require provinces to cooperate and formulate carbon emissions reduction policies and develop their own advantages to realize the goal of carbon emissions reduction, so as to further realize the low-carbon green transformation and upgrading of the whole manufacturing industry.

Author Contributions

Conceptualization, X.W. and L.Z.; Methodology, L.Z.; Software, X.W.; Validation, X.W. and L.Z.; Data Curation, X.W. and J.Z.; Writing—Original Draft Preparation, X.W.; Writing—Review and Editing, L.Z. and Y.Q.; Visualization, X.W.; Supervision, L.Z.; Project Administration, L.Z. and Y.Q.; Funding Acquisition, L.Z. and Y.Q. All authors have read and agreed to the published version of the manuscript.

Funding

This research was funded by grants from the National Science Foundation of China (grant numbers 41501588 and 41671536) and the Key Scientific Research Projects of Institutions of Higher Learning in Henan Province in 2017 (grant number 17A170006).

Conflicts of Interest

The authors declare no conflict of interest. The funders had no role in the design of the study, in the writing of the manuscript and in the decision to publish the results.

References

  1. National Statistical Bureau of the People’s Republic of China. China Statistical Yearbook; Statistical Publishing House: Beijing, China, 2000–2016.
  2. Hammond, G.P.; Norman, J.B. Decomposition analysis of energy-related carbon emissions from UK manufacturing. Energy 2012, 41, 220–227. [Google Scholar] [CrossRef] [Green Version]
  3. Kopidou, D.; Tsakanikas, A.; Diakoulaki, D. Common trends and drivers of CO2 emissions and employment: A decomposition analysis in the industrial sector of selected European Union countries. J. Clean. Prod. 2016, 112, 4159–4172. [Google Scholar] [CrossRef]
  4. Diakoulaki, D.; Mandaraka, M. Decomposition analysis for assessing the progress in decoupling industrial growth from CO2 emissions in the EU manufacturing sector. Energy Econ. 2007, 29, 636–664. [Google Scholar] [CrossRef]
  5. Clara Inés Pardo Martínez. Energy efficiency developments in the manufacturing industries of Germany and Colombia 1998–2005. Energy Sustain. Dev. 2009, 13, 89–101. [Google Scholar]
  6. Chang, N.; Lahr, M.L. Changes in China’s production-source CO2 emissions: Insights from structural decomposition analysis and linkage analysis. Econ. Syst. Res. 2016, 28, 224–242. [Google Scholar] [CrossRef]
  7. Lee, M.; Zhang, N. Technical efficiency, shadow price of carbon dioxide emissions, and substitutability for energy in the Chinese manufacturing industries. Energy Econ. 2012, 34, 1492–1497. [Google Scholar] [CrossRef]
  8. Huw, M.K. China as a Global Manufacturing Powerhouse: Strategic Considerations and Structural Adjustment. China World Econ. 2010, 18, 1–32. [Google Scholar]
  9. Lin, B.; Liu, K. How efficient is China’s heavy Industry? A perspective of inputeoutput analysis. Emerg. Mark. Financ. Trade 2016, 52, 2546–2564. [Google Scholar] [CrossRef]
  10. Unruh, G.C. Understanding carbon lock-in. Energy Policy 2000, 28, 817–830. [Google Scholar] [CrossRef]
  11. Unruh, G.C. Escaping carbon lock-in. Energy Policy 2002, 30, 317–325. [Google Scholar] [CrossRef]
  12. Chang, C.L.; McAleer, M.; Zuo, G. Volatility Spillovers and Causality of Carbon Emissions, Oil and Coal Spot and Futures for the EU and USA. Sustainability 2017, 9, 1789. [Google Scholar] [CrossRef] [Green Version]
  13. Chen, H.; He, L.; Chen, J. Impacts of Clean Energy Substitution for Polluting Fossil-Fuels in Terminal Energy Consumption on the Economy and Environment in China. Sustainability 2019, 11, 6419. [Google Scholar] [CrossRef] [Green Version]
  14. Yang, X.M.; Jiao, F.H. The Path, Evolution and Mechanism of the Industry Structure Locking-in for the Coal Resource-based City: A Case Study of Huai Be. Sci. Geogr. Sin. 2015, 35, 1256–1264. [Google Scholar]
  15. Wei, Y.D.; Li, W.; Wang, C. Restructuring industrial districts, scaling up regional development: A study of the Wenzhou model, China. Econ. Geogr. 2007, 83, 421–444. [Google Scholar] [CrossRef]
  16. Yin, Y.M.; Liu, Z.G.; Liu, W.D. Review on the progress of path dependence theory. Foreign Econ. Manag. 2011, 33, 1–7. [Google Scholar]
  17. Tian, Y.S.; Xiong, S.Q.; Ma, X.M. Structural Path Decomposition of Carbon Emission: A Study of China’s Manufacturing Industry. J. Clean. Prod. 2018, 193, 563–574. [Google Scholar] [CrossRef]
  18. De Oliveira Junior, V.B.; Pena, J.G.C.; Salles, J.L.F. An improved plant-wide multiperiod optimization model of a byproduct gas supply system in the iron and steel-making process. Appl. Energy 2016, 164, 462–474. [Google Scholar] [CrossRef]
  19. Moreno, B.; da Silva, P.P. How do Spanish polluting sectors’ stock market returns react to European Union allowances prices? A panel data approach. Energy 2016, 103, 240–250. [Google Scholar] [CrossRef]
  20. Wei, J.; Huang, K.; Yang, S. Driving forces analysis of energy-related carbon dioxide (CO2) emissions in Beijing: An inputeoutput structural decomposition analysis. J. Clean. Prod. 2016, 163, 58–68. [Google Scholar] [CrossRef]
  21. Hasanbeigi, A.; Harrell, G.; Schreck, B. Moving beyond equipment and to systems optimization: Techno-economic analysis of energy efficiency potentials in industrial steam systems in China. J. Clean. Prod. 2016, 120, 53–63. [Google Scholar] [CrossRef]
  22. Xu, R.; Lin, B. Why are there large regional differences in CO2 emissions? Evidence from China’s manufacturing industry. J. Clean. Prod. 2017, 140, 1330–1343. [Google Scholar] [CrossRef]
  23. Xu, B.; Lin, B. Reducing CO2 emissions in China’s manufacturing industry: Evidence from nonparametric additive regression models. Energy 2016, 101, 161–173. [Google Scholar] [CrossRef]
  24. Wang, Y.P.; Yan, W.Y.; Ma, D. Carbon Emissions and Optimal Scale of China’s Manufacturing Agglomeration under Heterogeneous Environmental Regulation. J. Clean. Prod. 2018, 176, 140–150. [Google Scholar] [CrossRef]
  25. Jiang, S.; Yang, C.; Guo, J. Uncovering the Driving Factors of Carbon Emissions in an Investment Allocation Model of China’s High-Carbon and Low-Carbon Energy. Sustainability 2017, 9, 1021. [Google Scholar] [CrossRef] [Green Version]
  26. Diao, B.D.; Ding, L.; Su, P.D. Study on Spatiotemporal Heterogeneity of Industry Driving Factors in PM2.5 Concentration in China. China Popul. Resour. Environ. 2018, 28, 52–62. [Google Scholar]
  27. Stewart Fotheringham, A.; Charlton, M.; Brunsdon, C. The geography of parameter space: An investigation of spatial non-stationarity. Int. J. Geogr. Inf. Sci. 1996, 10, 605–627. [Google Scholar] [CrossRef]
  28. Huang, B. Geographically and Temporally Weighted Regression for Modeling Spatio-temporal Variation in House Prices. Int. J. Geogr. Inf. Sci. 2010, 24, 383–401. [Google Scholar] [CrossRef]
  29. He, Q.Q.; Huang, B. Satellite-based High-resolution PM2.5 Estimation over the Beijing-Tianjin-Hebei region of China Using an Improved Geographically and Temporally Weighted Regression Model. Environ. Pollut. 2018, 236, 1027–1037. [Google Scholar] [CrossRef]
  30. Zhang, W.; Zhou, Y.Y. Increased CO2 Emissions Because of Energy Consumption in Beijing Based on Three-Level Nested I-O Structural Decomposition Analysis. Resour. Sci. 2013, 35, 275–283. [Google Scholar]
  31. Zhang, K.; Wang, D.F. The Interaction and Spatial Spillover between Agglomeration and Pollution. Chin. Ind. Econ. 2014, 315, 70–82. [Google Scholar]
  32. Li, T.; Song, Y.; Shen, J. Clean Power Dispatching of Coal-Fired Power Generation in China Based on the Production Cleanliness Evaluation Method. Sustainability 2019, 11, 6778. [Google Scholar] [CrossRef] [Green Version]
  33. Shi, M.J.; Feng, R.; Zheng, D. Influence of Comparative Advantage and Competitive Advantage on Regional Manufacturing Transfer. Econ. Geogr. 2017, 37, 108–115. [Google Scholar]
  34. Wang, S.J.; Su, Y.X.; Zhao, Y.B. Regional Inequality, Spatial Spillover Effects and Influencing Factors of China’s City-Level Energy-Related Carbon Emissions. Acta Grogr. Sin. 2018, 73, 414–428. [Google Scholar]
  35. Li, Q. Environmental Decentralization and Firm TFP: Evidence from the Data of Chinese Manufacturing Enterprises. J. Clean. Prod. 2017, 43, 133–145. [Google Scholar]
  36. Liu, H.L.; Li, B.T.; Tang, W.H. Manufacturing Oriented Topology Optimization of 3D Structures for Carbon Emissions Reduction in Casting Process. J. Clean. Prod. 2019, 225, 755–770. [Google Scholar] [CrossRef]
Figure 1. Analysis framework in carbon lock-in of manufacturing industry and its influencing factors.
Sustainability 12 01502 g001
Figure 2. Industry lock-in of manufacturing industry carbon emissions.
Sustainability 12 01502 g002
Figure 3. Spatial distribution in carbon emissions of the high-carbon manufacturing industry. Notes: HC1: ferrous metal processing industry; HC2: non-metallic mineral manufacturing industry; HC3: petroleum smelting industry; HC4: chemical raw material product industry; HC5: non-ferrous metal metallurgic processing industry.
Sustainability 12 01502 g003
Figure 4. Spatial–temporal differences of carbon emissions influencing factors.
Sustainability 12 01502 g004aSustainability 12 01502 g004b
Table 1. Qualitative description of variables.
SignsMeaningInterpretationUnit
CCarbon emissionsCarbon emission in the high-carbon manufacturing industry1 million tons
PScale effectSales value in the high-carbon manufacturing industry10,000 persons
ISStructural effectProportion of employees of the high-carbon manufacturing industry in the total manufacturing industry%
TTechnological effectInternal R&D expenses of the high-carbon manufacturing industry100 million yuan
REResource endowmentTotal production and sales volume of the mining industry100 million yuan
FDIForeign direct investmentFDI to the high-carbon manufacturing industry100 million yuan
Notes: Data of above indexes were collected from China Statistics Yearbook, China Energy Statistics Yearbook, China Industrial Statistics Yearbook, China Scientific Statistics Yearbook, statistics yearbook and statistical bulletin of different provinces. R&D expenses, total production and marketing volumes of mining industry and FDI amount were all transformed to the constant price in 2000. In this study, mining industries include coal mining, petroleum mining, ferrous metal mining, non-ferrous metal mining and non-metallic mining industries.
Table 2. Moran’s I index in carbon emissions of high-carbon manufacturing industry.
YearMoran’s IYearMoran’s IYearMoran’s I
20000.263 ***20060.324 ***20120.236 **
20010.287 ***20070.378 ***20130.223 **
20020.292 ***20080.333 ***20140.207 **
20030.298 ***20090.320 ***20150.216 **
20040.321 ***20100.274 ***20160.227 **
20050.321 ***20110.254 ***
Notes: ** means passed the significance test of 5% and *** means passed the significance test of 1%.
Table 3. Fitting coefficient in carbon emissions of high-carbon “regional lock-in”.
ProvinceLiaoningHebeiShandongShanxiHenanJiangsu
Factor 200020162000201620002016200020162000201620002016
LnP0.50 *0.66 *0.40 *0.46 *0.45 *0.47 *0.35 *0.36 *0.43 *0.39 *0.44 *0.45 *
LnIS0.76 *1.04 *0.91 *1.16 *0.58 *0.94 *0.72 *0.91 *0.41 *0.58 *0.33 *0.50 *
LnT−0.06 *−0.18 *0.03−0.02 *0.07 *−0.01 *0.08 *0.06 *0.06 *0.08 *0.05 *0.01 *
LnRE0.25 *0.16 *0.25*0.18 *0.13 *0.10 *0.23 *0.19 *0.11 *0.10 *0.09 *0.08 *
LnFDI0.27 *0.24 *0.20*0.28 *0.06 *0.19 *0.17 *0.25 *0.04 *0.12 *0.020.12 *
Notes: * means passed the significance test of 5%.

