Article

Empirical Research on the Process of Land Resource-Asset-Capitalization—A Case Study of Yanba, Jiangjin District, Chongqing

1
Department of Economics and Management, North China Electric Power University, Baoding 071003, China
2
Institute of Industrial Economics of Chinese Academy of Social Sciences, University of Chinese Academy of Social Sciences, Beijing 102488, China
3
College of Resources and Environmental Sciences, Henan Agricultural University, Zhengzhou 450002, China
4
Sustainable Process Integration Laboratory—SPIL, NETME Centre, Faculty of Mechanical Engineering, Brno University of Technology—VUT Brno, Technická 2896/2, 616 69 Brno, Czech Republic
*
Author to whom correspondence should be addressed.
Sustainability 2020, 12(3), 1236; https://doi.org/10.3390/su12031236
Submission received: 4 January 2020 / Revised: 5 February 2020 / Accepted: 5 February 2020 / Published: 8 February 2020
(This article belongs to the Special Issue Agrodiversity and Sustainable Land Management)

Abstract

:
As an effective land policy that can invigorate rural construction areas and balance urban and rural development, land tickets not only concretely embody the land resource-asset-capitalization process, but also bring economic benefits to the farmers concerned. However, from the perspective of resource-asset-capitalization, the specific environmental impacts and economic costs of the process in land tickets and the changes in the values of ecosystem services need to be considered. This paper uses land tickets in Yanba, Jiangjin, Chongqing as an example, combined with life cycle assessment (LCA), life cycle cost assessment (LCC), and methods for the evaluation of ecosystem services to quantify the environmental load, economic costs, and changes in the value of ecosystem services in the process of land resource-asset-capitalization. Moreover, through this analysis, we attempted to determine the contributions of different environmental indicators and the key links restricting the whole process of land resource-asset-capitalization. On this basis, through a sensitivity analysis, we explored the possibility of reducing environmental impact during the whole process of land resource-asset-capitalization. Through this research, we sought to explore the realization process of land tickets and to enrich the empirical research on land resource-asset-capitalization.

1. Introduction

At present, the outlook for China’s natural resources is not optimistic. The total amount of natural resources is abundant, but the per capita occupancy is very low [1]. Rapid economic growth also precipitates a period of a substantial increase in resource consumption. Due to the influence of national macro-control, resource prices cannot reflect real situations of resource scarcity, leading to a serious phenomenon of an unreasonable utilization of resources [2,3], which is particularly reflected in land resources. The contradiction between humans and the land has long been a difficult problem for sustainable development [4,5]. This contradiction is mainly reflected in the extreme mismatch between the rapidly growing population and limited land resources, and the resulting destruction of resources and the environment [6]. Although China has a vast territory, its per capita available land resources are very limited due to the uneven development of its economy, the uneven distribution of its resources, and its large population base. At the same time, with the adjustment of China’s macroeconomic policies and the changes in personal development intentions, increasingly more rural people have begun to leave the countryside for better development opportunities in cities [7,8,9,10]. However, due to limited land resources, a large amount of cultivated, high-quality land will inevitably be occupied to meet the needs of the increasing urban population in the process of China’s urbanization. If a series of compensation measures are not taken, the ultimate result of this development model is likely to endanger China’s red line of 120 million hectares of arable land and aggravate the contradiction between humans and the land. Taking China’s land resources as an example, it is necessary to explore the future of China’s land resources under the background of economic development.
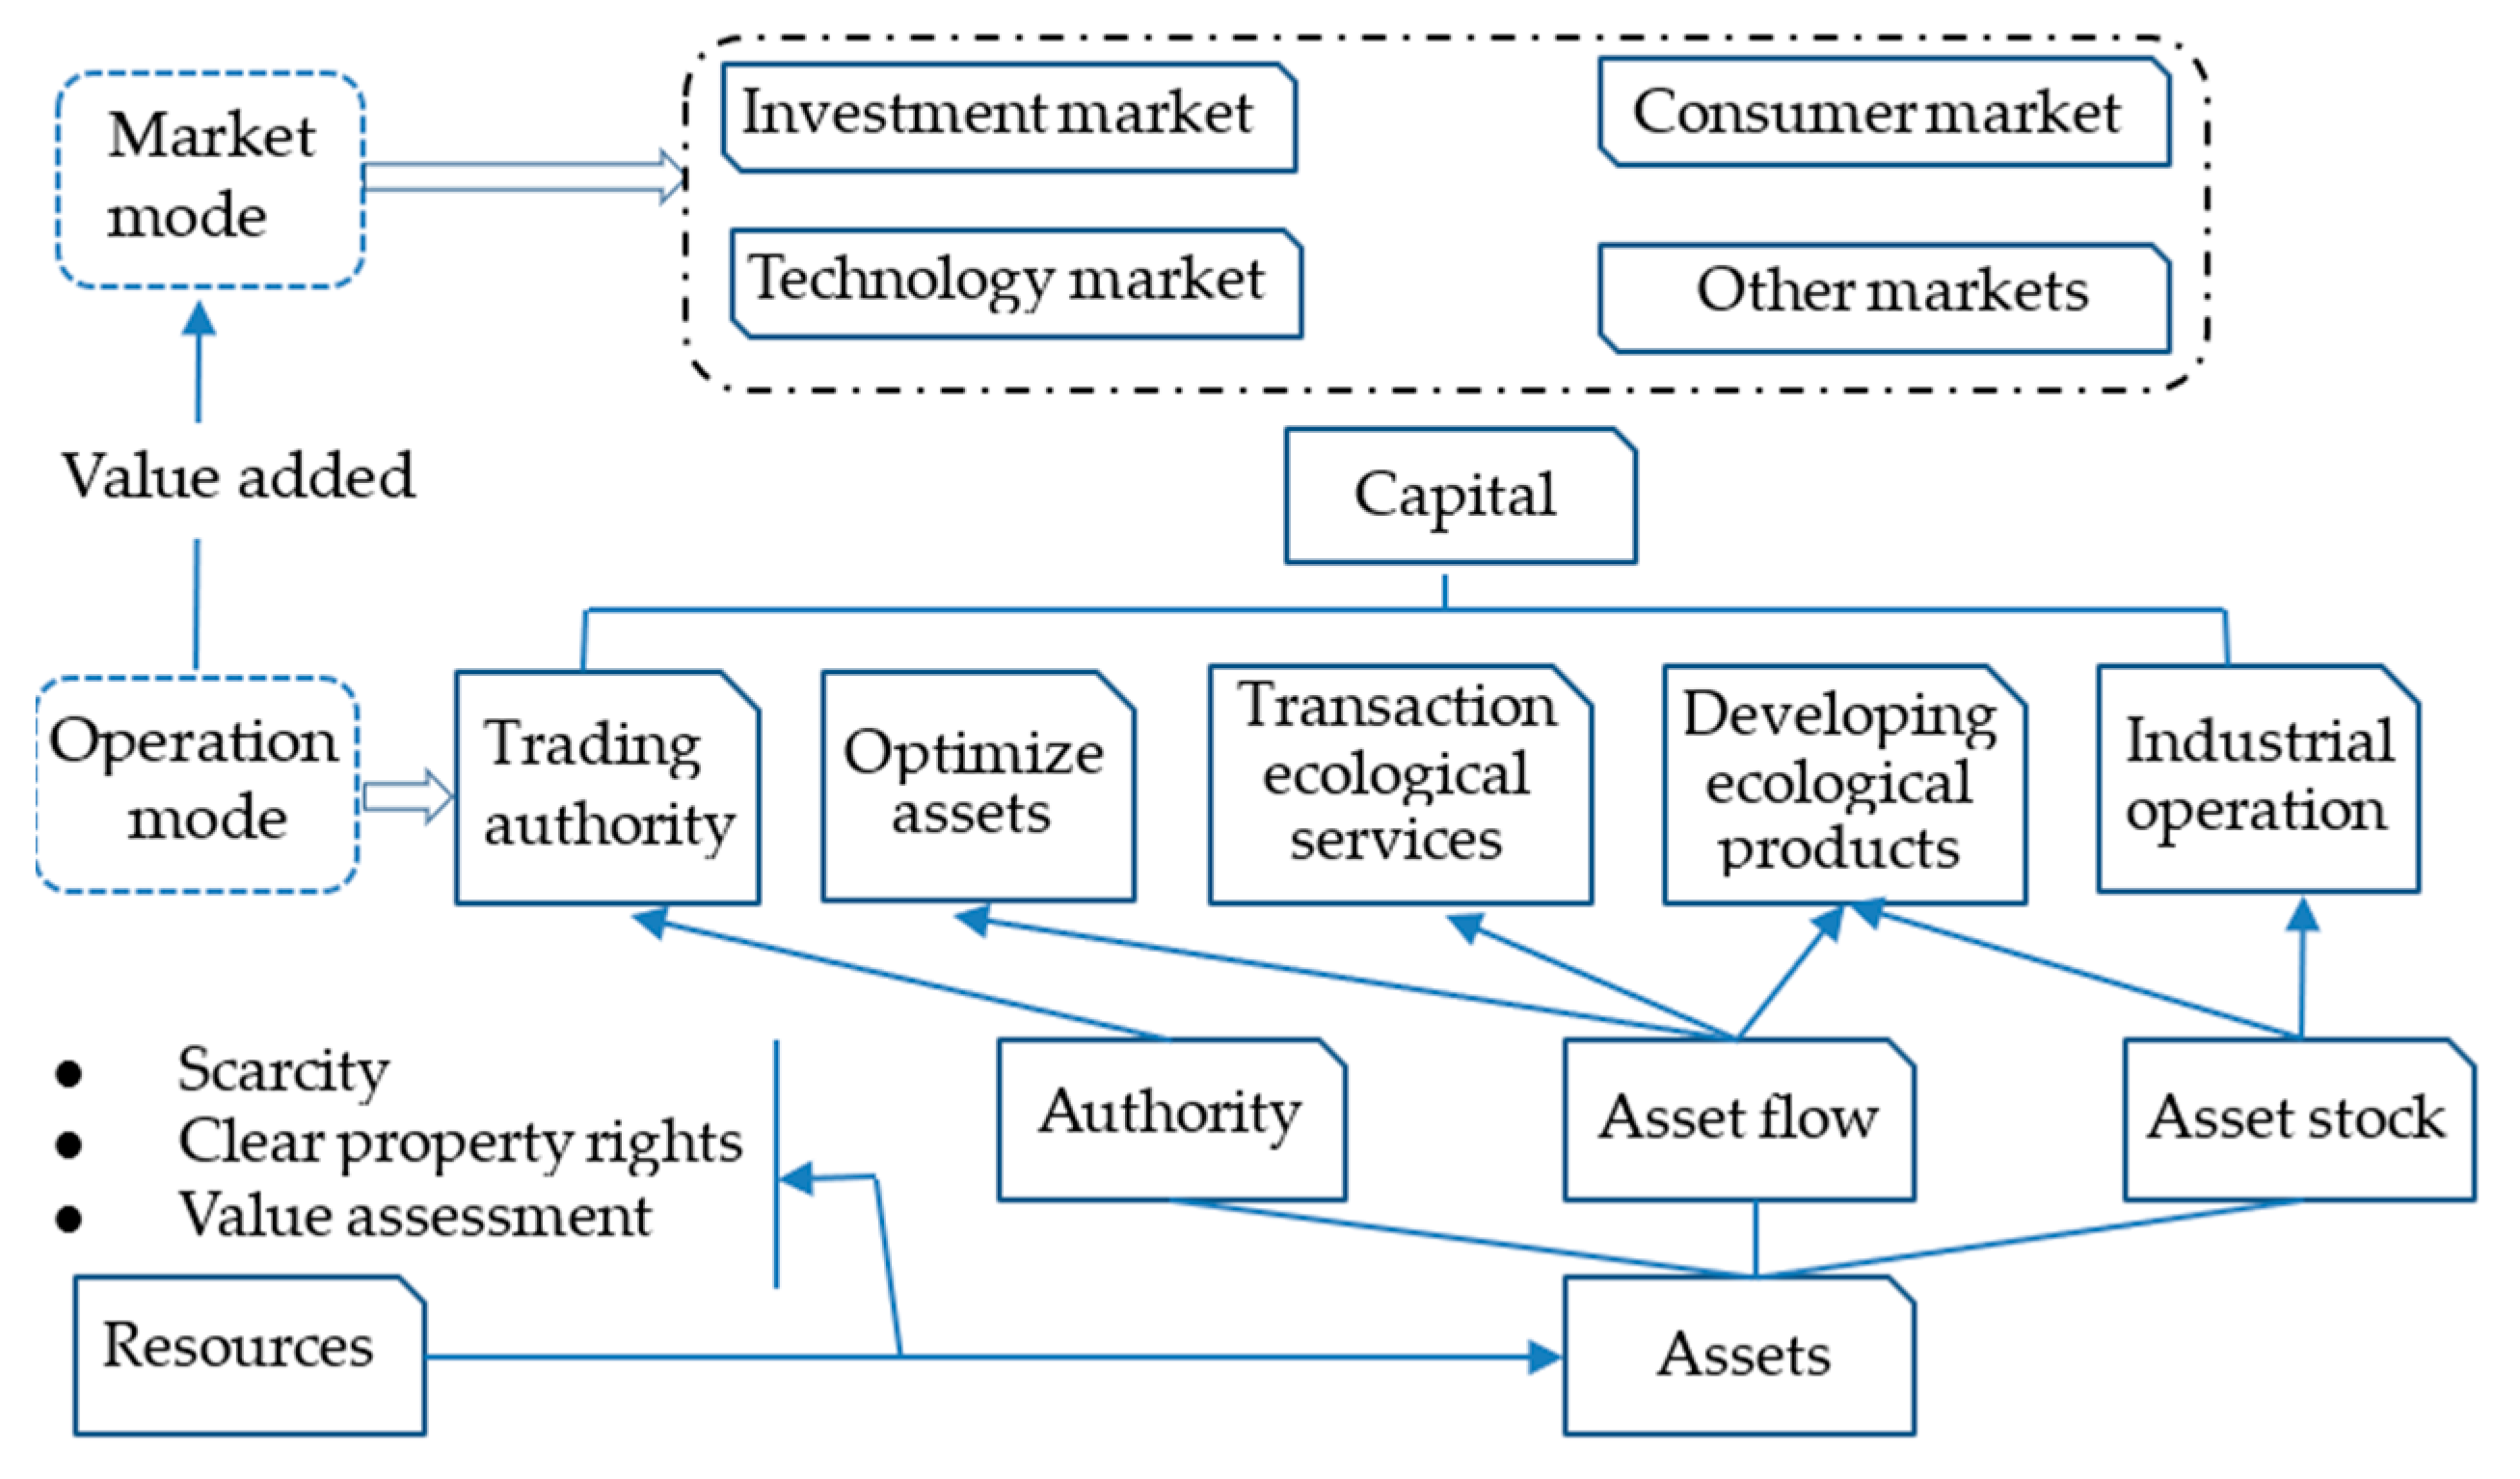
In order to develop and utilize land resources rationally, the Chinese government began to attach importance to the capitalization construction of natural resources. The “resource-asset-capital” trinity of land resource management idea, put forward by the Ministry of Natural Resources of the People’s Republic of China, is the most prominent of these measures. The Ministry of Natural Resources noted that natural resources should be managed gradually according to the “trinity” relationship of resources to assets and assets to capital, to revitalize existing limited natural resources and to help utilize idle natural resources to the greatest extent. The operation and transformation form of resource-asset-capitalization is shown in Figure 1. Accelerating the study of the land resource-asset-capitalization process is conducive to exploring the future development direction of land resources under the premise of social, economic, and environmentally sustainable development, and realizing the purpose of “protecting resources, manifesting assets, and activating capital” [11].
There are few studies on the capitalization proposition of land resources. The existing studies mainly focus on the theoretical framework and operational form of capitalization among land resources. In terms of the theoretical framework, Gao et al. [12] analyzed the status of social subjects, ecological objects, market platforms, technical powers, and institutional guarantees in the capitalized operation system. Liu and Fan [13] mainly discussed the maintenance and added value of state-owned land assets in the first capitalization stage, and pointed out that only by mastering the basic rules of capital operation can the capitalization of state-owned land assets be promoted for sustainable development. Li [14] emphasized the importance of establishing a sustainable ecological value mechanism for theoretically realizing ecological capitalization and emphasized the positive role of public participation in the capitalization process. In terms of the operation form of the capitalization of land resources, because “land tickets” are the first form of capitalization of land resources in China, there is not much global research on this aspect. However, the capitalization of land resources can also be understood as a type of farmland system reform and an effective response to urban expansion and farmland protection. Therefore, international studies in this area have been more focused on urban expansion and farmland protection. Urban expansion involves the development stage, influencing factors, and formation mechanism of land expansion, as well as the problems of the layout of urban and rural construction with expansion, which covers economic, social, ecological, and other aspects [15,16,17,18,19]. In terms of farmland protection, scholars have conducted many beneficial studies, mainly pertaining to the causes of farmland protection [20], objectives [21], methods [22,23], effects [24,25], the public’s willingness to support farmland protections [26,27], and saving soil for sustainability [28], which would help promote the innovation of farmland conservation methods. In terms of land tickets, the research mainly focuses on the operational links and operational effects of land tickets [29,30,31], and the price mechanisms of land tickets [32].
Through a literature review, we found that the research on land resource-asset-capitalization and land tickets has been mainly concentrated on the theory of carding and actual operational forms, without the necessary focus on the process of land resource-asset-capitalization. Few scholars have combined those two aspects organically, and few scholars can quantifiably analyze the environmental–economic effect in the whole process of land resource-asset-capitalization. Based on this consideration, this paper uses land tickets in Yanba village, Jiangjin district, Chongqing (which is a typical land resource-asset-capitalization mode) as an example. On the basis, this paper integrates life cycle environmental–economic assessment and the value evaluation of ecosystem services to explore the economic and environmental effects in the whole process of land resource-asset-capitalization for land tickets, as well as the value changes in ecosystem services. Moreover, the key links and elements with the most significant environmental effects in the process of land resource-asset-capitalization were explored through a sensitivity analysis to analyze the sustainability of the process.

2. Materials and Methods

2.1. Chongqing Land Tickets

In 2007, the Chinese government approved Chongqing as a pilot area for comprehensive urban-rural supporting reform. On this basis, in order to solve the problems of the growth of both urban and rural construction land, and to establish an institutional channel for realizing land and property rights for farmers, the Chongqing government initiated land tickets. The operations of land tickets are divided into three steps. The first step is reclamation. Secondly, land tickets are publicly traded by the Chongqing country land exchange. Finally, the main body who purchased the land tickets chooses the land to be developed that conforms to the overall planning of urban and rural area use and applies for transfer procedures with the land tickets. By the end of April 2018, Chongqing had traded land tickets with a total value of 49.41 billion Yuan, covering an area of 16,806.67 hectares [33]. In the realization of economic benefits in the process of capitalization, the following benefits are also realized: (1) Strengthening the protection of arable land. By the end of April 2018, Chongqing had used 11,560 hectares of land tickets and occupied 7246.67 hectares of cultivated land [33], with greater subsidies and less occupation of farmland. (2) Boosting poverty alleviation and income. A total of 10,986.67 hectares of land tickets and 32.49 billion Yuan were traded in poor areas [33]. (3) Promoting regional coordination. Seventy percent of the traded land tickets originated from the northeast and southeast of Chongqing, which are relatively backward in their economic development. Over 95% of the used land tickets pertained to the main city and western Chongqing, realizing long-distance and large-scale economic feedback. (4) Promoting coordinated interactions between urban and rural areas in terms of "people, land, and finance". By April 2018, with land tickets as the link, cities fed back more than 49 billion Yuan to rural areas. The lands between urban and rural areas offer more than 16,666.67 hectares, and 136,300 urban residents who settled in cities have benefited from land tickets of more than 11 billion Yuan [33].
According to the resource-asset-capitalization process, the production process of land tickets, especially reclamation, is included in the resource-asset process in this paper, because this is the process that produces assets. We also focus on the process of realizing the rights of land assets. We classify the outcome of the production of land tickets, which causes changes in ecosystem services and results in economic benefits through the process of asset-capitalization, because in this process, the value of land is increased.

2.2. General Situation of the Study Area

The study area is located at 29°9′32′′ N, 106°9′0′′ E. This is a hilly area, with the elevation of the reclaimed sections between 220 m and 370 m, small topographic changes within the block, and a relative elevation difference between 2 m and 20 m. The homestead and yard are all almost horizontal, and the slopes of the other ancillary areas are within 10°. The distribution of each area is relatively concentrated, with an average distance of about 500 m, and the surrounding areas are mainly dry land. The soil in the study area is mainly grey and purple soil. The soil quality is fertile, and the cultivated layer is well preserved. The total nitrogen is 0.078%, total phosphorus is 0.104%, total potassium is 2.680%, and soil pH is 6.2. The surface water in the study area is mainly surface runoff, which is formed by natural rainfall. The average rainfall is 1294.3 mm. In recent years, agricultural production has been mainly based on traditional production, supplemented by simple mechanical work. In the study area, ordinary crops are mainly planted, including corn, sweet potato, and wheat.

2.3. Life Cycle Assessment

As an effective method to evaluate product environmental factors and their potential impacts throughout the entire lifecycle of the product (the so-called cradle to grave), life cycle assessments (LCAs) have been widely applied to quantify the environmental load caused by products and production processes since LCA was first proposed [34]. At present, LCA is widely used in production process research, specifically involving the planting industry, the food industry, waste disposal, and other aspects. The application of LCA in many fields has shown a systematic, diversified, and refined development trend [35,36,37]. The LCA evaluation method mainly includes the following four steps: Goal and scope definition, life cycle inventory (LCI) analysis, impact assessment, and result interpretation [38,39]. Among these steps, the goal and scope definition form the basis of an LCA evaluation, which mainly includes three aspects: The evaluation objective, functional unit, and system boundary [40].

2.3.1. Evaluation Objective

In this paper, the LCA is mainly used to quantify the process of land resource-asset-capitalization from the perspective of the environment and environment–economy. Through a sensitivity analysis, this paper intends to determine the key factors for the process of capitalization, thereby providing a basis for quantifying the environmental impact and economic cost of the process of resource-asset-capitalization.

2.3.2. Functional Unit

According to the situation of the study area, 1 hectare of land tickets was selected as the functional unit. The selection of a functional unit is helpful for the data collation and result analysis.

2.3.3. System Boundary

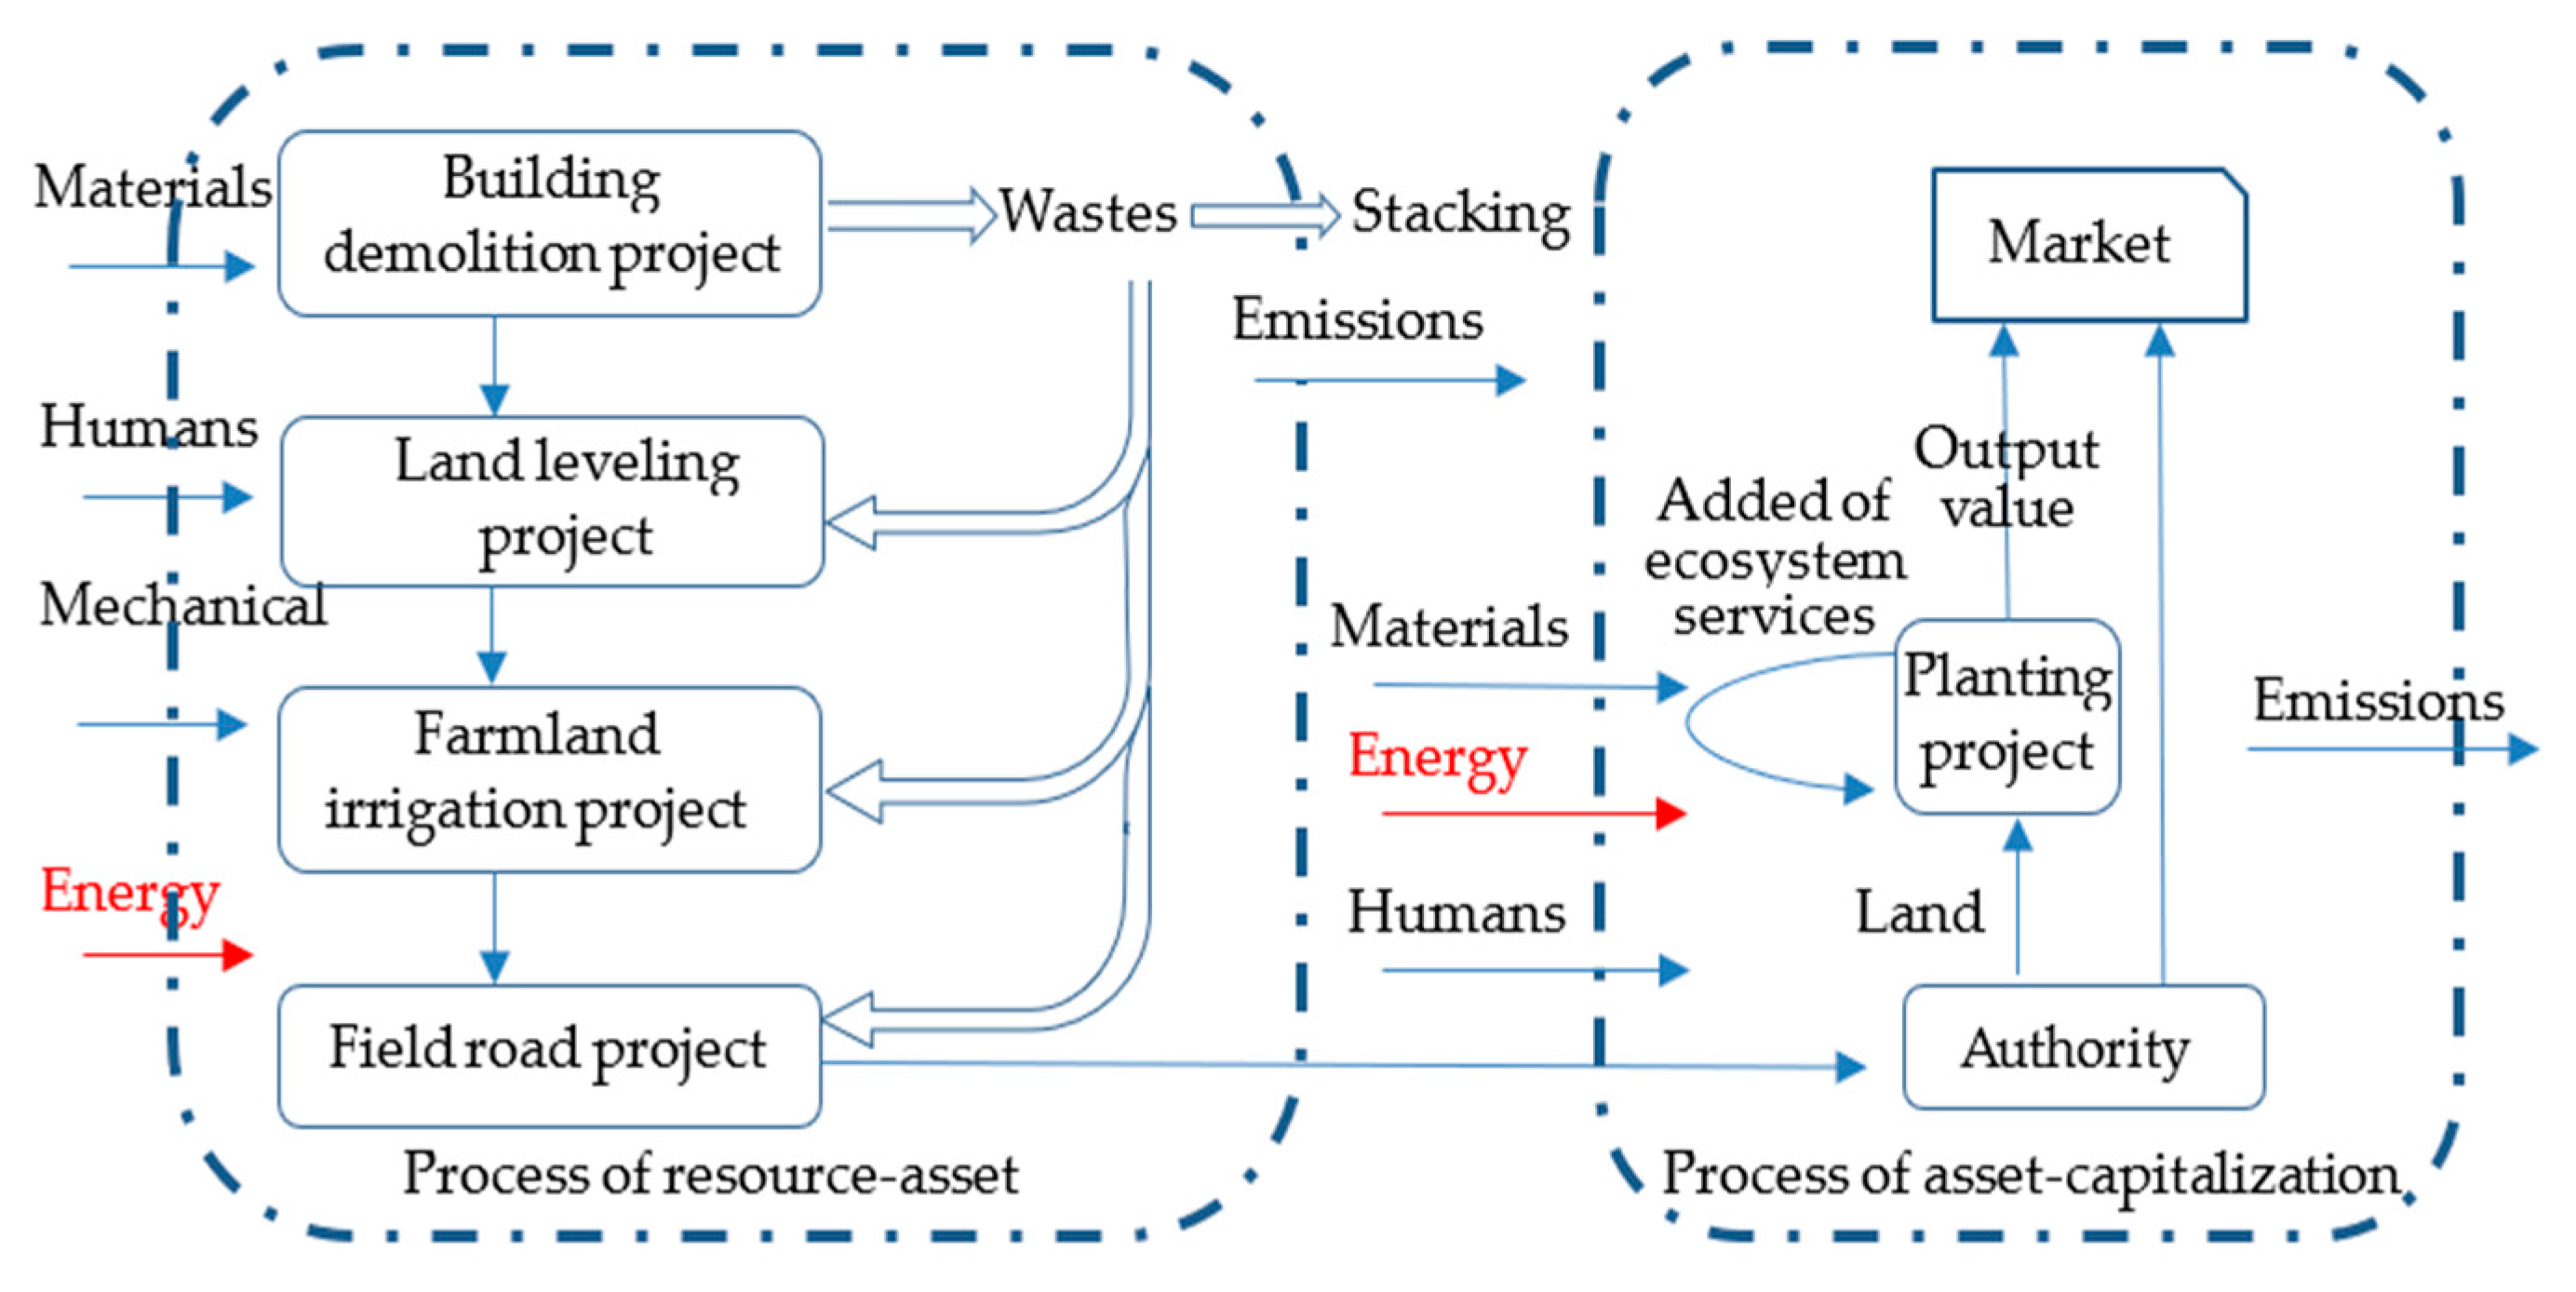
In this paper, the resource-asset process of the land reclamation process is divided into four parts: A building demolition project, land leveling project, farmland irrigation project, and field road project. The outcome of the production of land tickets, which resulted in the changes in ecosystem services (value added), and the eventual economic benefits, are classified as the process of asset-capitalization. Figure 2 illustrates the system boundary of this paper.
In Figure 2, the left half presents the life cycle assessment of the resource-asset process, which involves materials, humans, mechanical equipment, and energy input from the building demolition to the planting project over the whole procedure. Eighty-percent of the main waste generated by the demolition of the building is reused, and the remainder is piled up on the site. The right half of Figure 2 mainly describes the value-added accounting of ecosystem services in the land asset-capitalization process, as well as the economic value accounting of transaction property rights and the planting project.

2.3.4. Data Sources

All the original data were obtained through field research of Chongqing Sanhe land improvement Co., Ltd. in May 2018. By recording the input and output data of the whole life cycle, the real situation of land resource-asset-capitalization process is presented as comprehensively as possible. Because of the heavy machinery in the building demolition project, land leveling project, farmland irrigation project, and field road project involved in the determination of the mode of transportation and transportation distance, our research group, through communication with enterprise technical personnel, determined the different mode of transportation for large equipment to be large trucks. The mean distance from the Jiangjin district to the reclamation area is 38.3 km, and the mean distance from Longhua to the reclamation area is 14.3 km. The data inventory of each sub-module for 1 hectare of land tickets produced is shown in Table 1, Table 2 and Table 3.

2.3.5. Impact Categories and Impact Assessment Methodology

At present, a variety of LCA evaluation methods (such as tools for the reduction and assessment of chemical and other environmental impacts (TRACI) [41], the environmental design of industrial products (EDIP) [42], and Recipe [
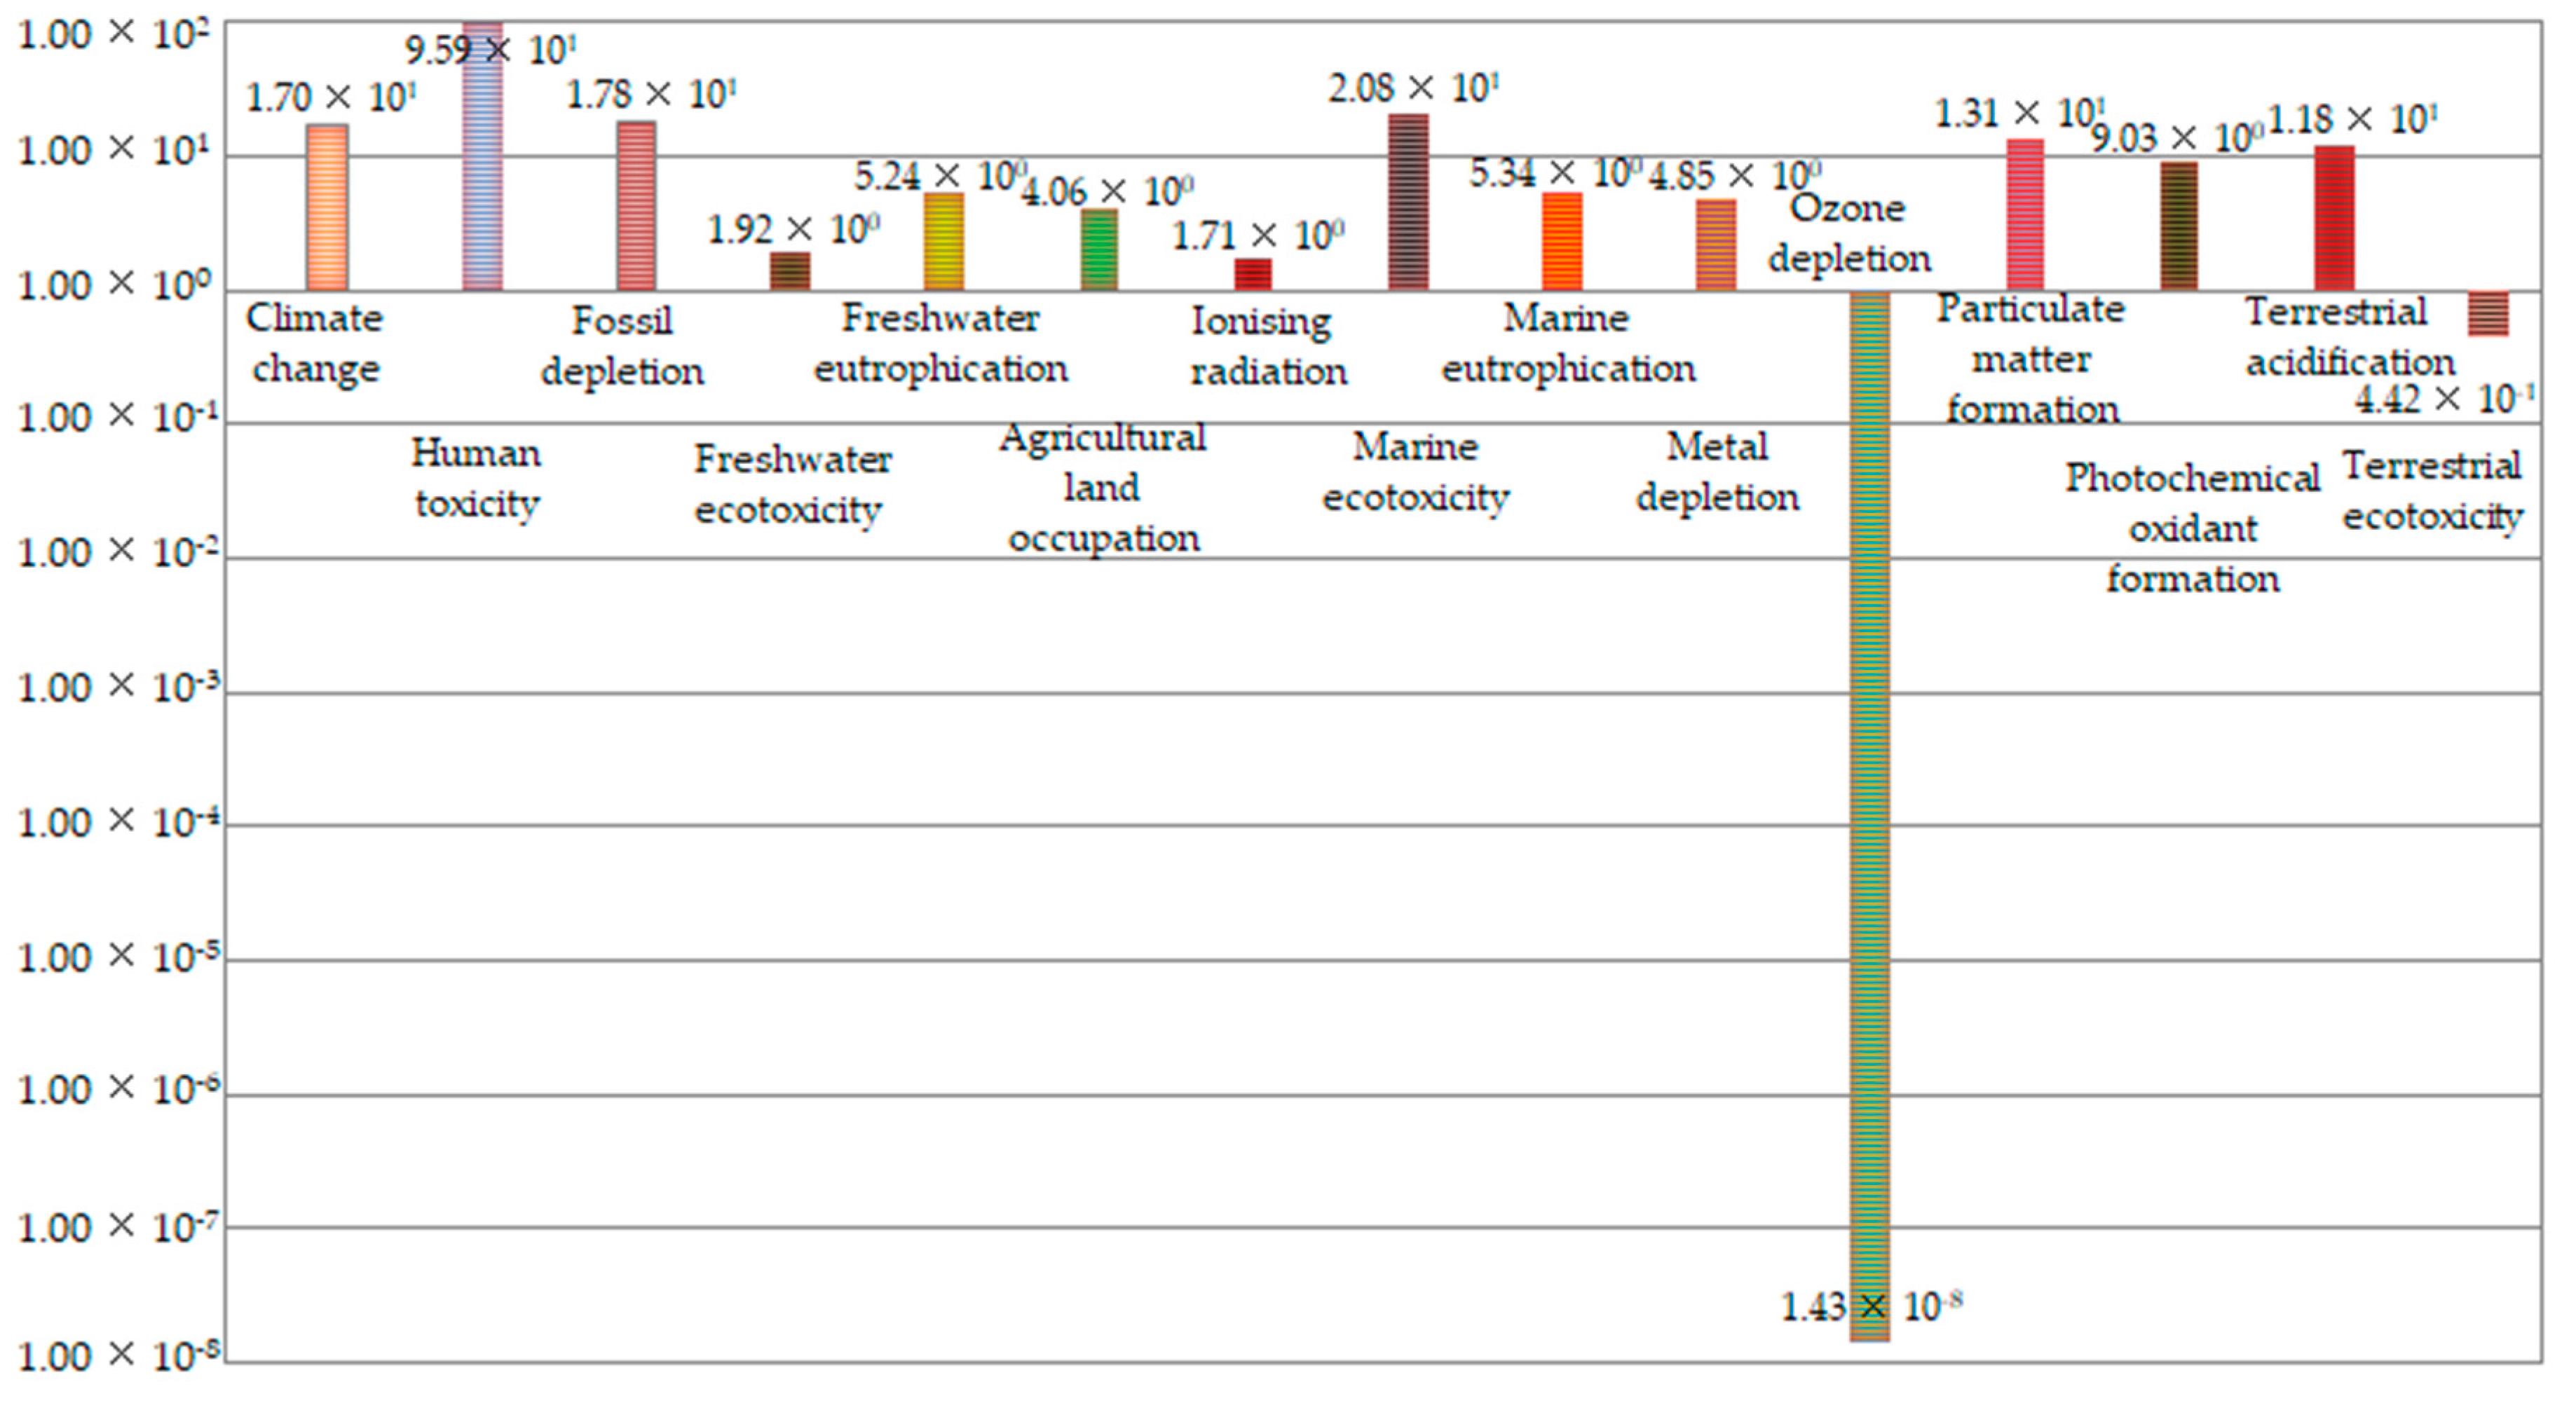
43]) have been widely used to evaluate the environmental impact of different products and different processes of production. This paper used Recipe to evaluate the environmental impact of the process of land resource-asset-capitalization. Recipe can evaluate the burden of production process on the environment comprehensively and objectively [
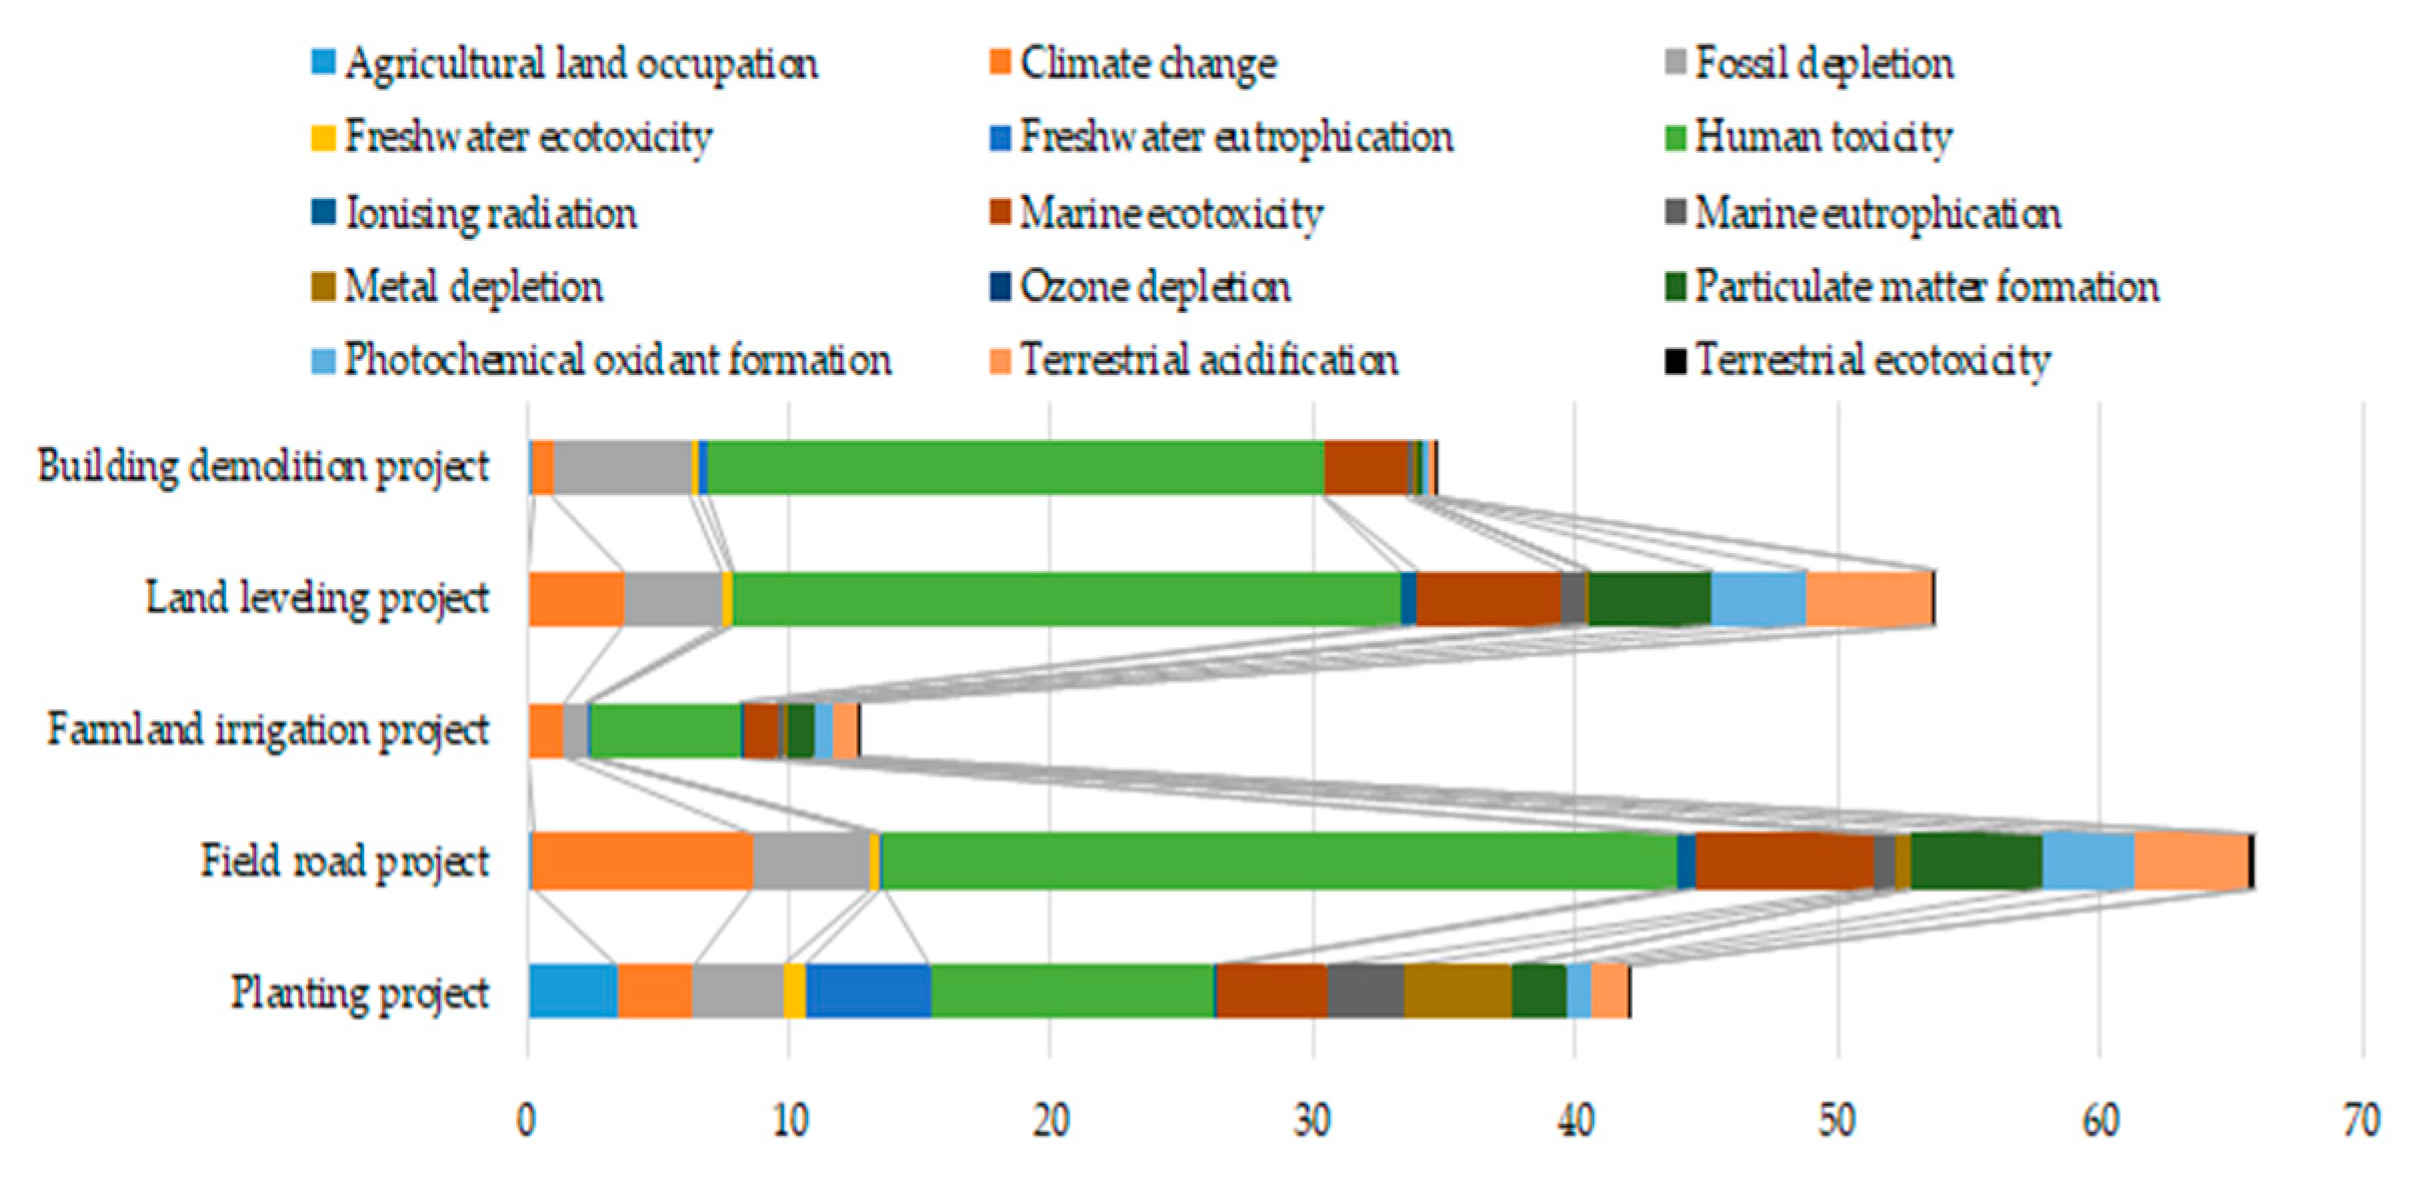
44]. Based on the research of this paper, 15 indicators were selected for analysis and research. These indicators are Climate change, Human toxicity, Fossil depletion, Freshwater ecotoxicity, Freshwater eutrophication, Ionizing radiation, Marine ecotoxicity, Marine eutrophication, Metal depletion, Ozone depletion, Particulate matter formation, Photochemical oxidant formation, Terrestrial acidification, Agricultural land occupation, and Terrestrial ecotoxicity.

2.3.6. Life Cycle Cost

Through the application of life cycle assessment (LCA) and life cycle cost (LCC) evaluation methods, the environmental impact assessment and economic evaluation of the whole life cycle of land resource-asset-capitalization can be realized [45]. Through field research, the costs of direct materials, energy, direct labor, and mechanical equipment over the whole life cycle process are all considered. Table 1, Table 2 and Table 3 also show the cost of each part of the life cycle process corresponding to the functional units.

2.4. Value Assessment of Ecosystem Services

According to the communique of the agriculture ministers conference of Organization for Economic Co-operation and Development (OECD) in 1998, in addition to providing the basic functions of food and fiber, agricultural land can also shape the natural landscape and provide respectable environmental benefits [
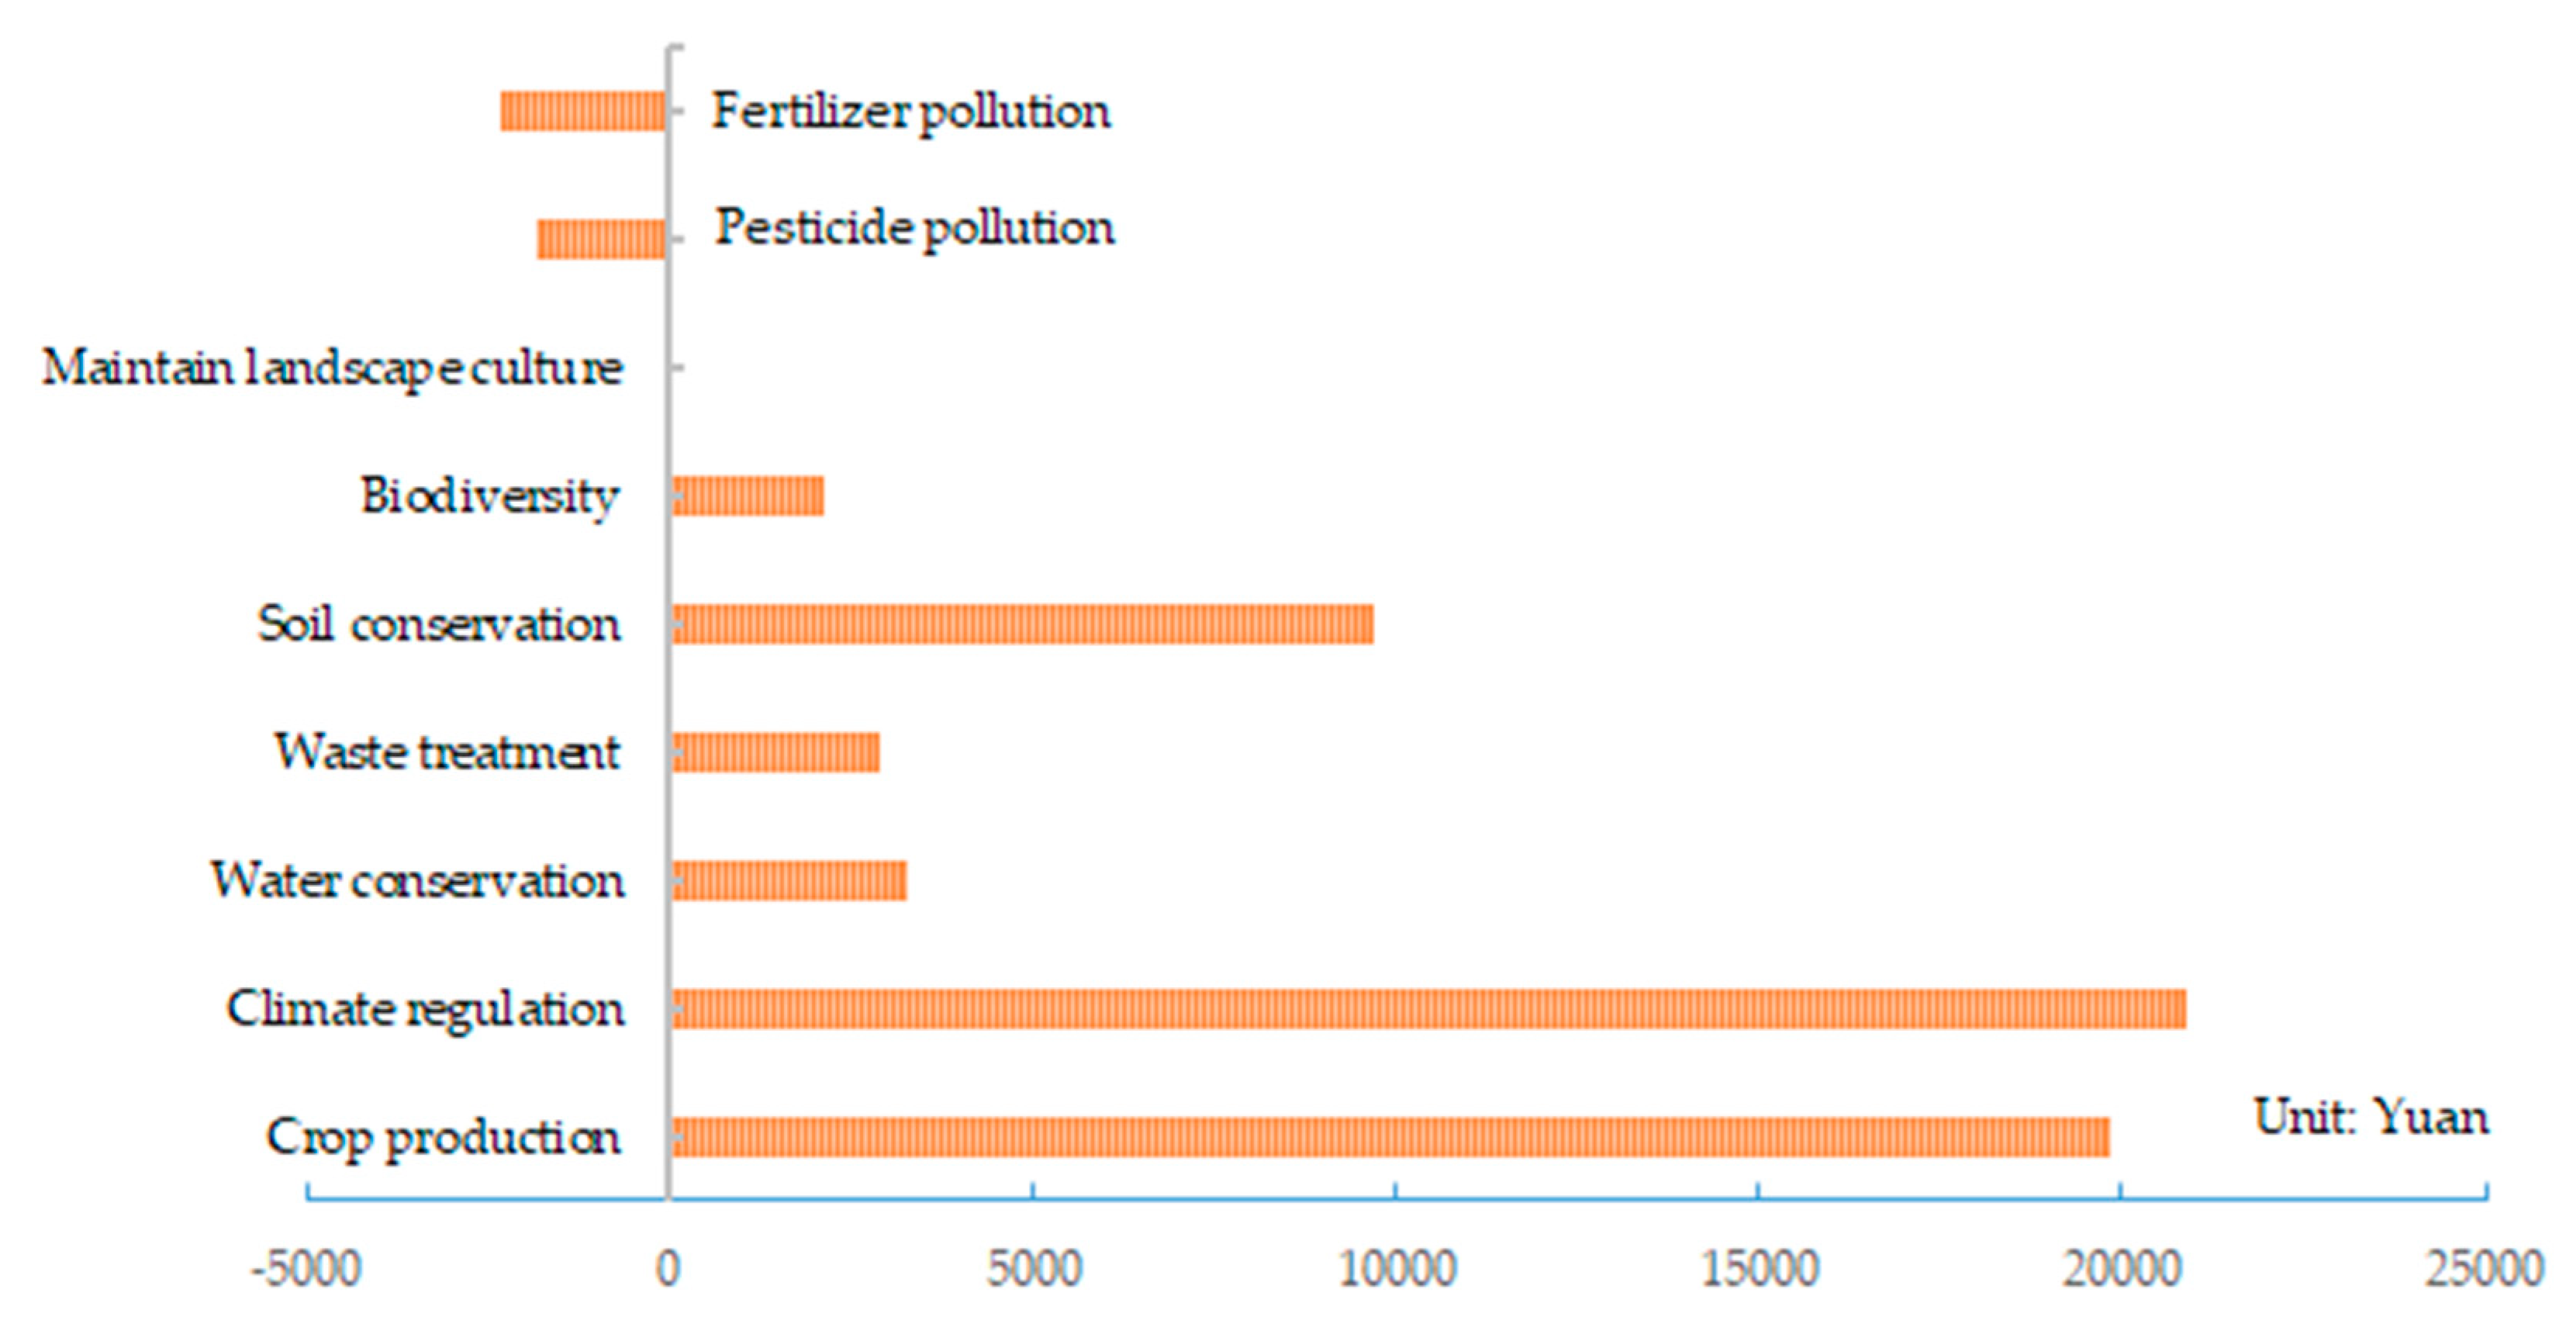
46]. Therefore, it is very meaningful to evaluate the changes in farmland ecosystem services caused by the process of land resource-asset-capitalization. The Millennium Ecosystem Assessment divides ecosystem services into four categories: Provisioning services, regulating services, supporting services, and cultural services, which have been widely recognized and supported [47,48]. Therefore, based on the references of the farmland ecosystem services research status quo and the characteristics of the land resource-asset-capitalization process, we divided agricultural land ecosystem services into five categories that consist of provisioning services, regulating services, supporting services, cultural services, and negative services—a total of nine kinds of services. The detailed descriptions and calculation methods for these agricultural land ecosystem services are shown in Table 4.

3. Results

3.1. Environmental Impact Assessment of Land Resource-Asset-Capitalization Process

Relying on GaBi9.2.0.58, this paper uses LCA to calculate the overall environmental cost of the land resource-asset-capitalization process. The specific results are shown in Table 5.
Table 5 shows the environmental equivalent value of the per functional unit in the process of land resource-asset-capitalization. Compared with the non-capitalization of land resources, although the process of land resource-asset-capitalization will produce relevant economic benefits, the environmental costs caused by this process cannot be ignored. In addition, if the impact of the land resource-asset-capitalization process on the environment is numerically analyzed, the contributions of different inputs to different environmental indicators is different. For different environmental protection purposes, different raw materials should be considered because of the different environmental indicators.
Due to the different units of the 15 environmental indicators in Table 5, it is impossible to directly compare the overall contribution of different environmental indicators to the environmental load in the process of land resource-asset-capitalization. In order to facilitate this comparison, standardization and weight assignment are required. This paper used thinkstep LCIA Survey 2012, Global, ReCiPe 1.08 (E), excl biogenic carbon as the weight, and ReCiPe 1.08 (E), Mid-point Normalization, World, and excl biogenic carbon as the normalization for the results in Table 5. The results are shown in Figure 3.
It can be seen from the Figure 3 that in the process of land resource-asset-capitalization, the input of energy, raw materials, tools, and transportation will cause a certain burden on the environment. The most significant impact on the environment among the six indicators comes from Human toxicity, Marine ecotoxicity, Fossil depletion, Climate change, Particulate matter formation, and Terrestrial acidification. The least significant impact on the environment among the six indicators comes from Ozone depletion, Terrestrial ecotoxicity, Ionizing radiation, Freshwater ecotoxicity, Agricultural land occupation, and Metal depletion. Due to the difference in the contribution of the environmental emissions caused by different inputs to different environmental indicators, we should focus on the indicators with the most significant impact on the environment and seek effective measures to reduce the environmental costs of the corresponding indicators.
As shown in the calculation results, compared with the non-implementation of land capitalization policy, when only considering the impact of the whole process of land resource-asset-capitalization on the environment, the whole life cycle of the process will create a certain load on the environment. Which link contributes the most to the whole process of land resource-asset-capitalization? What is the proportion of different links in different environmental indicators? Based on the above calculations, the contributions of five different links of land resource-asset-capitalization to environmental indicators are specifically analyzed. The specific results are shown in Figure 4 and Figure 5.
It can be seen from Figure 4 that, for different environmental indicators, the contributions of different links to the environmental indicators are different. As mentioned above, in the whole process of land resource-asset-capitalization, the most significant indicator of environment impact is Human toxicity. Figure 4 shows that the field road project has the most significant influence on Human toxicity, followed by the land leveling project, building demolition project, planting project, and farmland irrigation project, respectively. The analysis of the specific composition of each environmental index provides a basis for accurately reducing the impact of a single index on the environment.
The most significant indicator of the overall environmental impact of land resource-asset-capitalization has been calculated above. However, differences may exist when specific links are considered. As can be seen from Figure 5, during the whole life cycle of land resource-asset-capitalization, the field road project has the most significant impact on the environment. Based on the composition of the environmental indicators in the field road project, Human toxicity is the most significant and accounts for 45.98%, followed by Climate change, Marine ecotoxicity, Particulate matter formation, and Fossil depletion, with a proportion of 12.76%, 10.26%, 7.63%, and 6.83%, respectively. For the field road project, the indicators with the least impact on the environment are Ozone depletion, Freshwater eutrophication, Terrestrial ecotoxicity, and Agricultural land occupation. In the rest of the links, the land leveling project, planting project, building demolition project, and farmland irrigation project are ranked in descending order of their impact on the environment. There are also differences in the proportion of different environmental indicators in the above links.

3.2. Analysis of Integrated Environment-Cost Factors of Land Resource-Asset-Capitalization

While environmental indicators are important, economic indicators cannot be ignored in evaluating the process of land resource-asset-capitalization. Thus, this section introduces the life cycle cost into the analysis framework and comprehensively combines the environmental impact after standardization and weighting with the environment-cost in the process of land resource-asset-capitalization.
Figure 6 shows the relationship between the costs and the environmental impact after standardization and weighting of the different links in the process of land resource-asset-capitalization. The maximum environmental cost does not negatively affect the maximum economic cost. As mentioned above, the field road project can cause the maximum environmental impact. However, the associated economic cost is less than the building demolition project and the land leveling project costs. This phenomenon is mainly caused by including a large number of mechanical and labor costs in the building demolition project, which results in high economic costs. At the same time, the environmental impact of labor cannot be measured. The transportation distance is much closer while using the machinery and equipment allocated to the functional unit, so the added value of its environmental cost is far less than the added value of its economic costs. The environmental load and economic costs of the farmland irrigation project are not obvious, and there are some differences in the environmental load and economic costs among different types of planting projects. The overall environmental load of the planting project is higher than that of the building demolition project, but the economic cost is significantly lower. Therefore, it is necessary to further analyze the different processes of land resource-asset and asset-capitalization.

3.3. Analysis of the Process of Land Resource-Asset

In the mode of land tickets in Chongqing, the stage of land resource-asset mainly includes four links: The building demolition project, land leveling project, farmland irrigation project, and field road project. This section further analyzes the relationship between the economic costs and environmental impacts of the inputs in different links during the stage of land resource-asset. The specific results are shown in Table 6.
It can be seen from Table 6 that, as mentioned above, the highest economic cost is not premised on the maximum environmental impact. In the links of the building demolition project, land leveling project, and field road project, the economic cost of Equipment and Transportation is relatively high, while the environmental impact is relatively low. This is mainly due to the short transportation distance and allocation to the functional unit. At the same time, it is important to note that the number of stone slabs removed in the building demolition project due to inadequate demolition and a low level of reuse cannot meet the demand for stone slabs in the land leveling project, farmland irrigation project, or field road project, which means that the stone slabs should be purchased externally to meet the demands of the above three links. The input of the stone slab will greatly increase the environmental load and economic cost of the links, which is the main reason that the environmental impact of the land leveling project and farmland irrigation project are higher than that of the building demolition project. In the comprehensive analysis of the above four links, we should focus on raw materials with relatively high economic and environmental impacts in different links, such as diesel in building demolition project, diesel, stone slabs in the land leveling project, and cement, stone slabs, and concrete in the farmland irrigation project and filed road project. On the one hand, the recycling efficiency of raw materials should be improved; on the other hand, substitutes with relatively low market prices should be considered to reduce the economic cost and environmental impact of inputs in the links without affecting the quality.

3.4. Analysis of the Process of Land Asset-Capitalization

This case mainly involves the conversion from rural abandoned homesteads to farmland. After the completion of the land resource-asset, the subsequent crop growing process involves the inputs of pesticides, fertilizer, electricity, and other raw materials. The input of raw materials will not only cause an increase in economic cost, but will also have certain environmental impacts on the process of asset-capitalization. The relationship between the environmental impacts and economic costs of different inputs in the process of asset-capitalization is shown in Figure 7. Overall, there is no significant positive correlation between environmental impacts and economic costs. The input of organic fertilizer causes relatively large environmental damage, which mainly depends on the composition and dosage of organic fertilizer. Tap water has a relatively small environmental impact, but a relatively large economic cost. When reducing the adverse effects in the process of land asset-capitalization is considered from the perspective of the cost–environmental impact, measures such as the replacement of organic fertilizer and the reduction of the costs of water can be considered.
The ultimate goal in the process of land asset-capitalization is to cultivate the reclaimed land and increase farmers’ income. If we only consider the environmental impact and economic cost, we will deviate from the original intention of land asset-capitalization. Therefore, this paper defines the index of environmental benefits after being normalized and weighted, which is the net economic output of different cropping patterns divided by environmental indicators after being normalized and weighted, to weigh the environment-economic benefits of the process in land asset-capitalization comprehensively. Since its value reflects the net economic output caused by the unit environmental load, the larger the indicator value, the better. The specific results are shown in Table 7. From the perspective of the net income per unit of environmental load, the net income generated by sweet potato planting is the largest, followed by corn planting and wheat planting.
The result of the process of land asset-capitalization will lead to changes in the ecosystem services in the study area before and after asset-capitalization. For this reason, the changes of ecosystem services are calculated here. Since the land was an idle homestead before reclamation, according to the previous research results, the value of its ecosystem services was set at zero [56]. The changes in ecosystem services can be regarded as the added value of the economic benefits caused by the process of land asset-capitalization. According to Table 4, the changes in ecosystem services before and after the process of land asset-capitalization are calculated. The results are shown in Figure 8.
It can be seen from Figure 8 that, after land asset-capitalization, a series of changing values in ecosystem services will be generated due to crop cultivation and soil improvement. The positive benefit of the changing values in ecosystem services is about 58,720.04 Yuan, while the negative benefit is 4166.66 Yuan. The ratio of the absolute value of positive and negative is more than 10, which indicates that the positive function of the changing values in ecosystem services in the process of land asset-capitalization is dominant and far outweighs the negative impacts. Among the changes, the change of Climate regulation is the most significant, followed by Crop production, Soil conservation, Water conservation, Waste treatment, and Biodiversity. Because the study area does not involve tourism and has no income from tickets, etc., the value of the Maintain landscape culture is not included. In addition, since the use of chemical fertilizer during the process of crop planting will cause the accumulation of heavy metals in crops, and the use of pesticides will have an impact on crop quality and biodiversity, the values of Fertilizer pollution and Pesticide pollution are negative.

4. Discussions

4.1. Sensitivity Analysis of Environmental Impacts in the Process of Resource-Asset-Capitalization

It can be seen from the results that the process of land resource-asset-capitalization will cause some damage to the environment. From the perspective of material and energy, can we explore alternative materials with relatively low potential environmental impacts to reduce the environmental cost, thereby achieving the goal of optimizing the process of land resource-asset-capitalization? In this way, sensitivity analysis is necessary. As can be seen above, the most significant indicators of environmental impacts in the process of land resource-asset-capitalization are Human toxicity (Ht), Marine ecotoxicity (Me), Fossil depletion (Fd), Climate change (Cc), Particulate matter formation (Pmf), and Terrestrial acidification (Ta); the sensitivity analysis of raw materials can be realized according to the above six indicators. Compared to the baseline operating conditions, each of these operating parameters increases by 10%, while the other elements are kept constant [57]. We explore the impact of six environmental indicators on the whole process of land resource-asset-capitalization resulting from the parameter changes. The results are shown in Table 8, Table 9 and Table 10.
As can be seen from the above tables, there are differences in the sensitivity of raw materials to the main environmental indicators in the process of land resource-asset-capitalization. Therefore, for different environmental protection purposes, depending on the differences in the sensitivity of inputs to various environmental indicators, there is the possibility to reduce the potential impact of the process of land resource-asset-capitalization on the environment. Some raw materials have a weaker impact on the main environmental indicators, such as tap water, cast iron components, etc., which are not shown here. From the perspective of the environmental impact of raw materials on the whole process of land resource-asset-capitalization, changes in the use of stone slabs and diesel are the most sensitive to environmental indicators. Taking the impact on Human toxicity as an example, if the repeated utilization rate of a stone slab is increased by 10%, the overall degree of impact on Human toxicity will be reduced by 4.62%, which shows the importance of further improving the efficiency of resource use in the land resource-asset-capitalization process. When starting from different links and considering the possibility of reducing the environmental costs of the links, it is necessary to focus on the sensitivity of the raw material inputs in different links. As can be seen from Table 8, Table 9 and Table 10, in addition to the focus on stone slabs and diesel, for building demolition projects, gasoline needs to be considered; in farmland irrigation projects and field road projects, cement and concrete need to be considered, and in planting projects, organic fertilizer and pesticides need to be considered. Under the premise of technology, we need to actively find materials with relatively low environmental costs to replace the original raw materials.

4.2. Value Composition Analysis of Land Resource-Asset-Capitalization

The realization of the value in the process of land resource-asset-capitalization is carried out through transactions. By relying on the transaction market of land tickets, the process of land resource-asset-capitalization can finally realize added value, wherein, through changes in land use, the values of additional physical, human, and financial resources; value-added ecosystem services; and land development rights refer to differences in the demand for specific areas of land based on regional development differences that are transferred spatially. The values of additional materials, as well as human and financial resources, mainly include reclamation costs and compensation costs during the production processes of land tickets. The cost of land reclamation has been described above, and the compensation cost mainly includes compensation for buildings and above-ground structures, for land use rights, for housing subsidies, and for rural collective organizations. According to the relevant policies and regulations, these calculations were based on 1,440,000 Yuan/ha, 270,000 Yuan/ha, 342,000 Yuan/ha, and 255,000 Yuan/ha, respectively. According to the results of Geng [58], the value of land development rights is quantified by multiplying the difference between the average price of the commercial housing market and the investment amount by the land value added tax. The composition of land resource-asset-capitalization is shown in Table 11.
As can be seen from Table 11, the value composition of land resource-asset-capitalization in the study area is significantly different from the corresponding actual price, and the actual price is far lower than the real value. In addition, in the value composition of land resource-asset-capitalization, land development rights account for the largest proportion, which also indirectly confirms the important role of land tickets in optimizing the allocation of spatial land resources and promoting the differentiation of regional development. Moreover, we can see from the results that the actual price of land tickets set by the government is far from reflecting the actual value of land tickets. The main reasons for this situation are as follows. Firstly, when the government sets the actual market price of land tickets, it tends to pay more attention to the economic and social benefits of land tickets, but ignores its ecological benefits—that is, the added-value of ecosystem services in the process of land resource-asset-capitalization. Secondly, due to the influence of local real estate price, the real value of land tickets possesses an "abnormal value" to some extent, which is difficult to match with the real price. Therefore, the government needs to regulate the healthy development of the local real estate market reasonably and restrain the bubble of the real estate market to make the value of land tickets more reasonable. At the same time, a moderate relaxation of the interventions and restrictions on the price of land tickets could make the price of land tickets match the value of land tickets to the greatest extent, allowing the value of land tickets to become more market-referenced.

5. Conclusions

As an effective land policy to balance urban and rural development, the policy of land tickets has been widely studied since it was proposed. This paper analyzed the process of resource-asset-capitalization by using land tickets in Yanba, Jiangjin, Chongqing as an example. The conclusions are as follows.
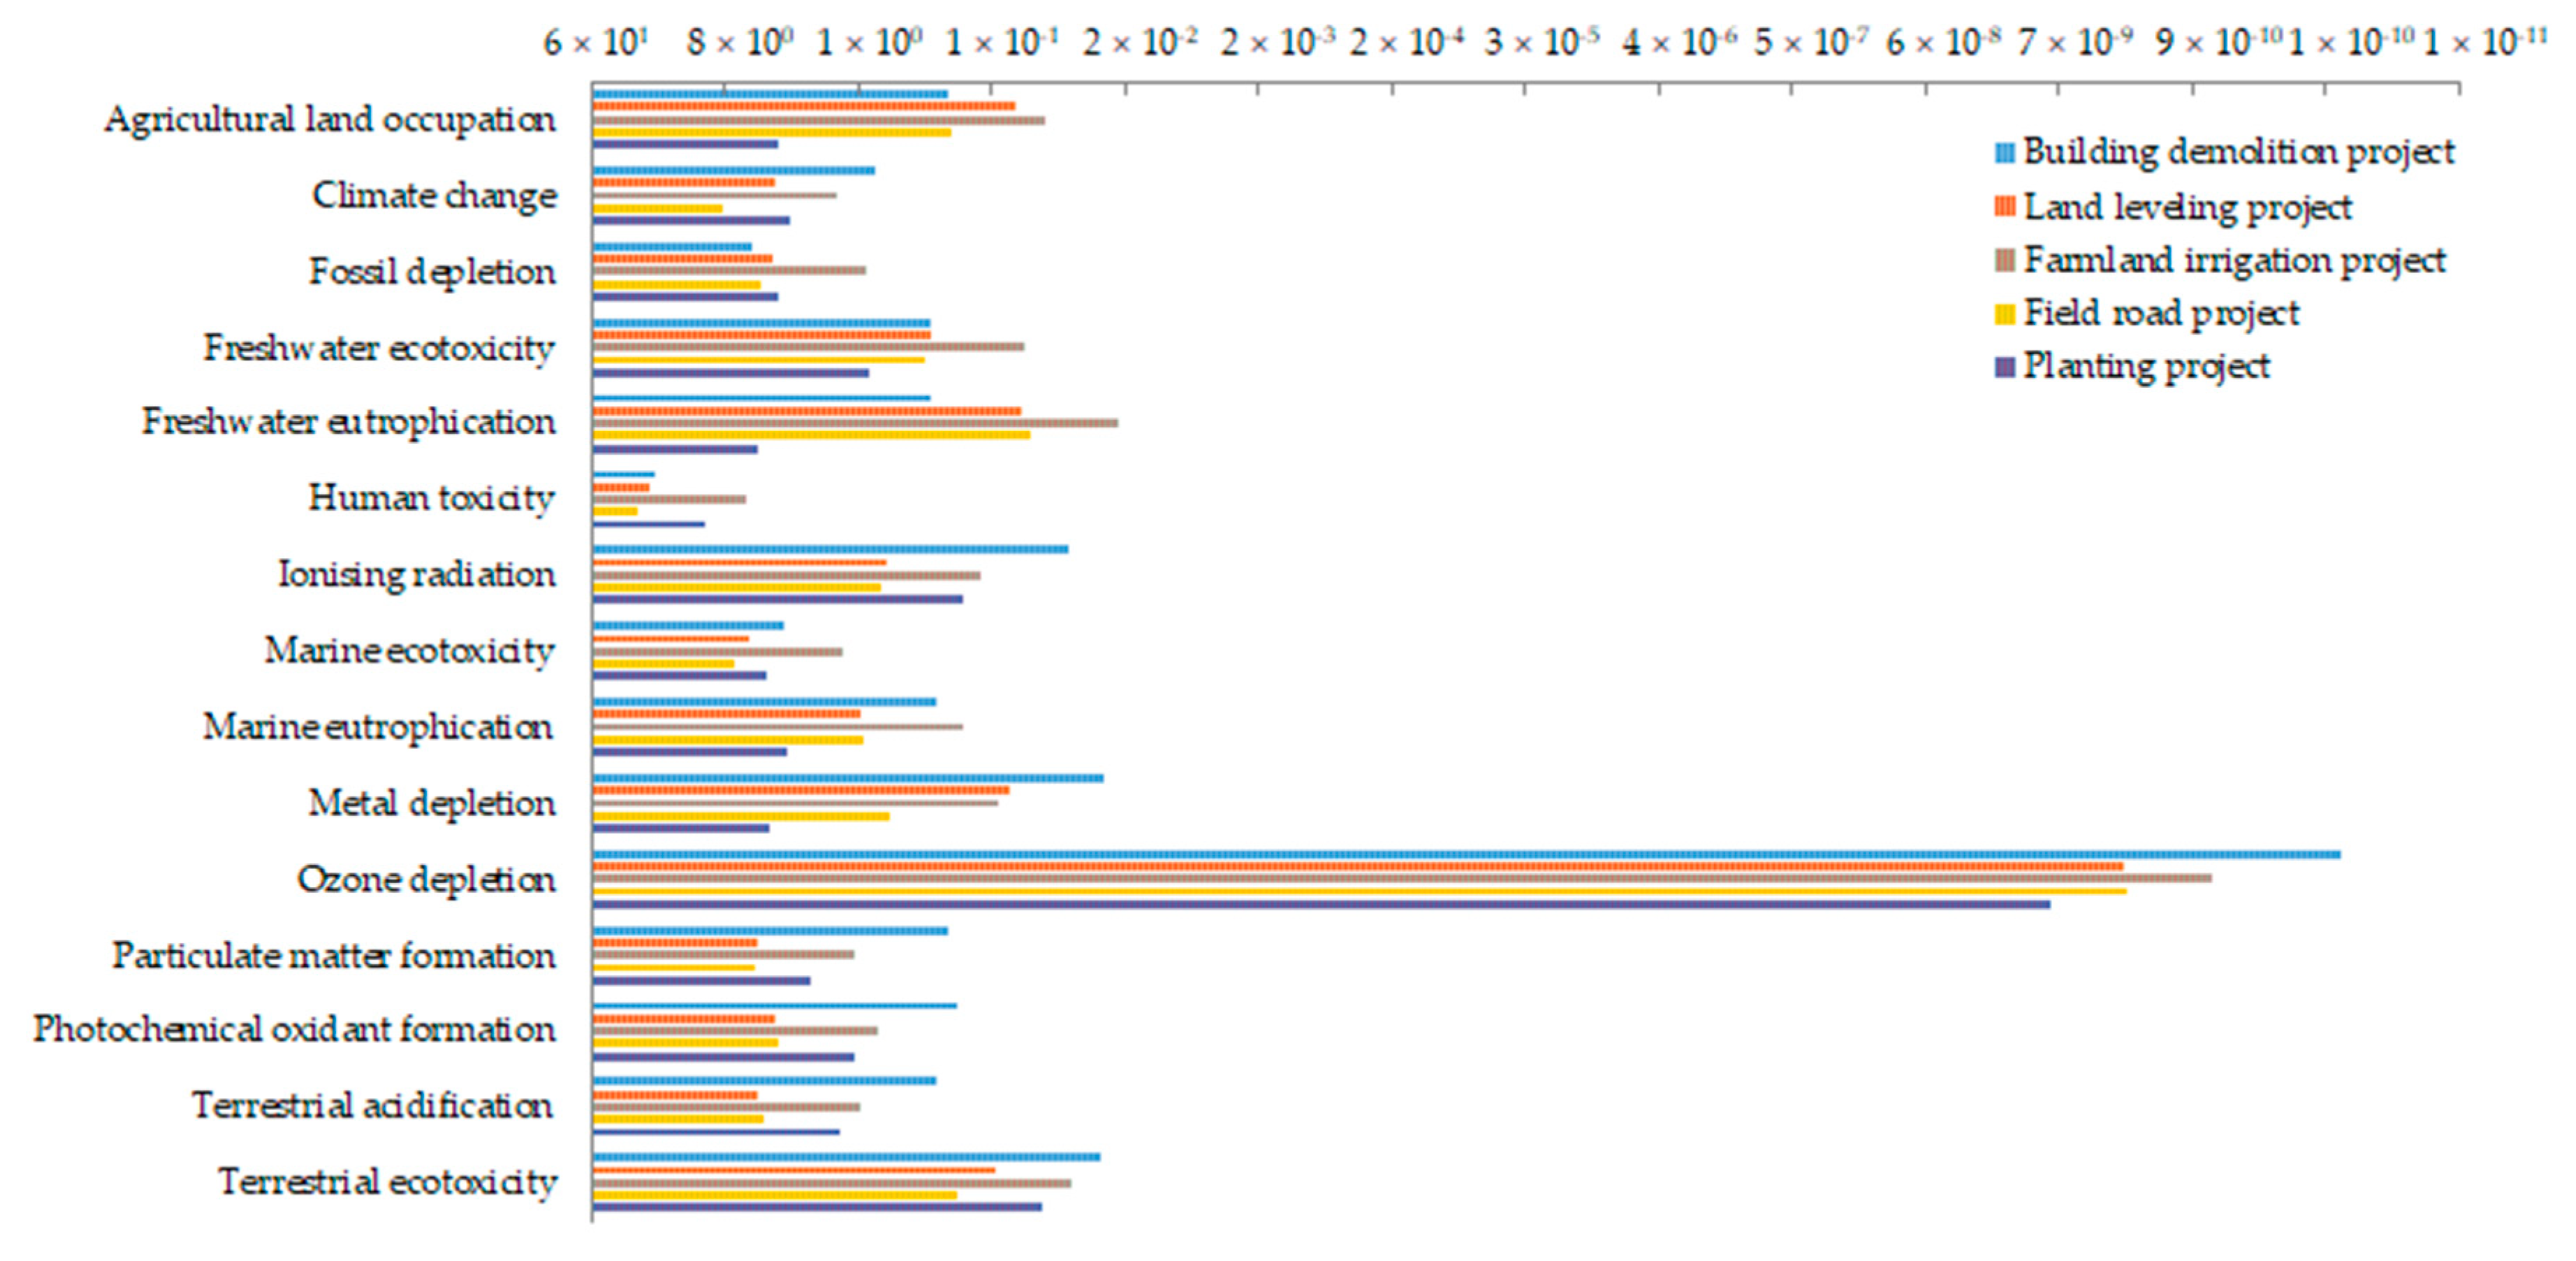
Considering the process of land resource-asset-capitalization from the environmental perspective, the six indicators with the most significant impact on the environment over the whole process are Human toxicity, Marine ecotoxicity, Fossil depletion, Climate change, Particulate matter formation, and Terrestrial acidification. If one only considers specific links in the whole life cycle process of land resource-asset-capitalization, the field road project has the most significant impact on the environment.
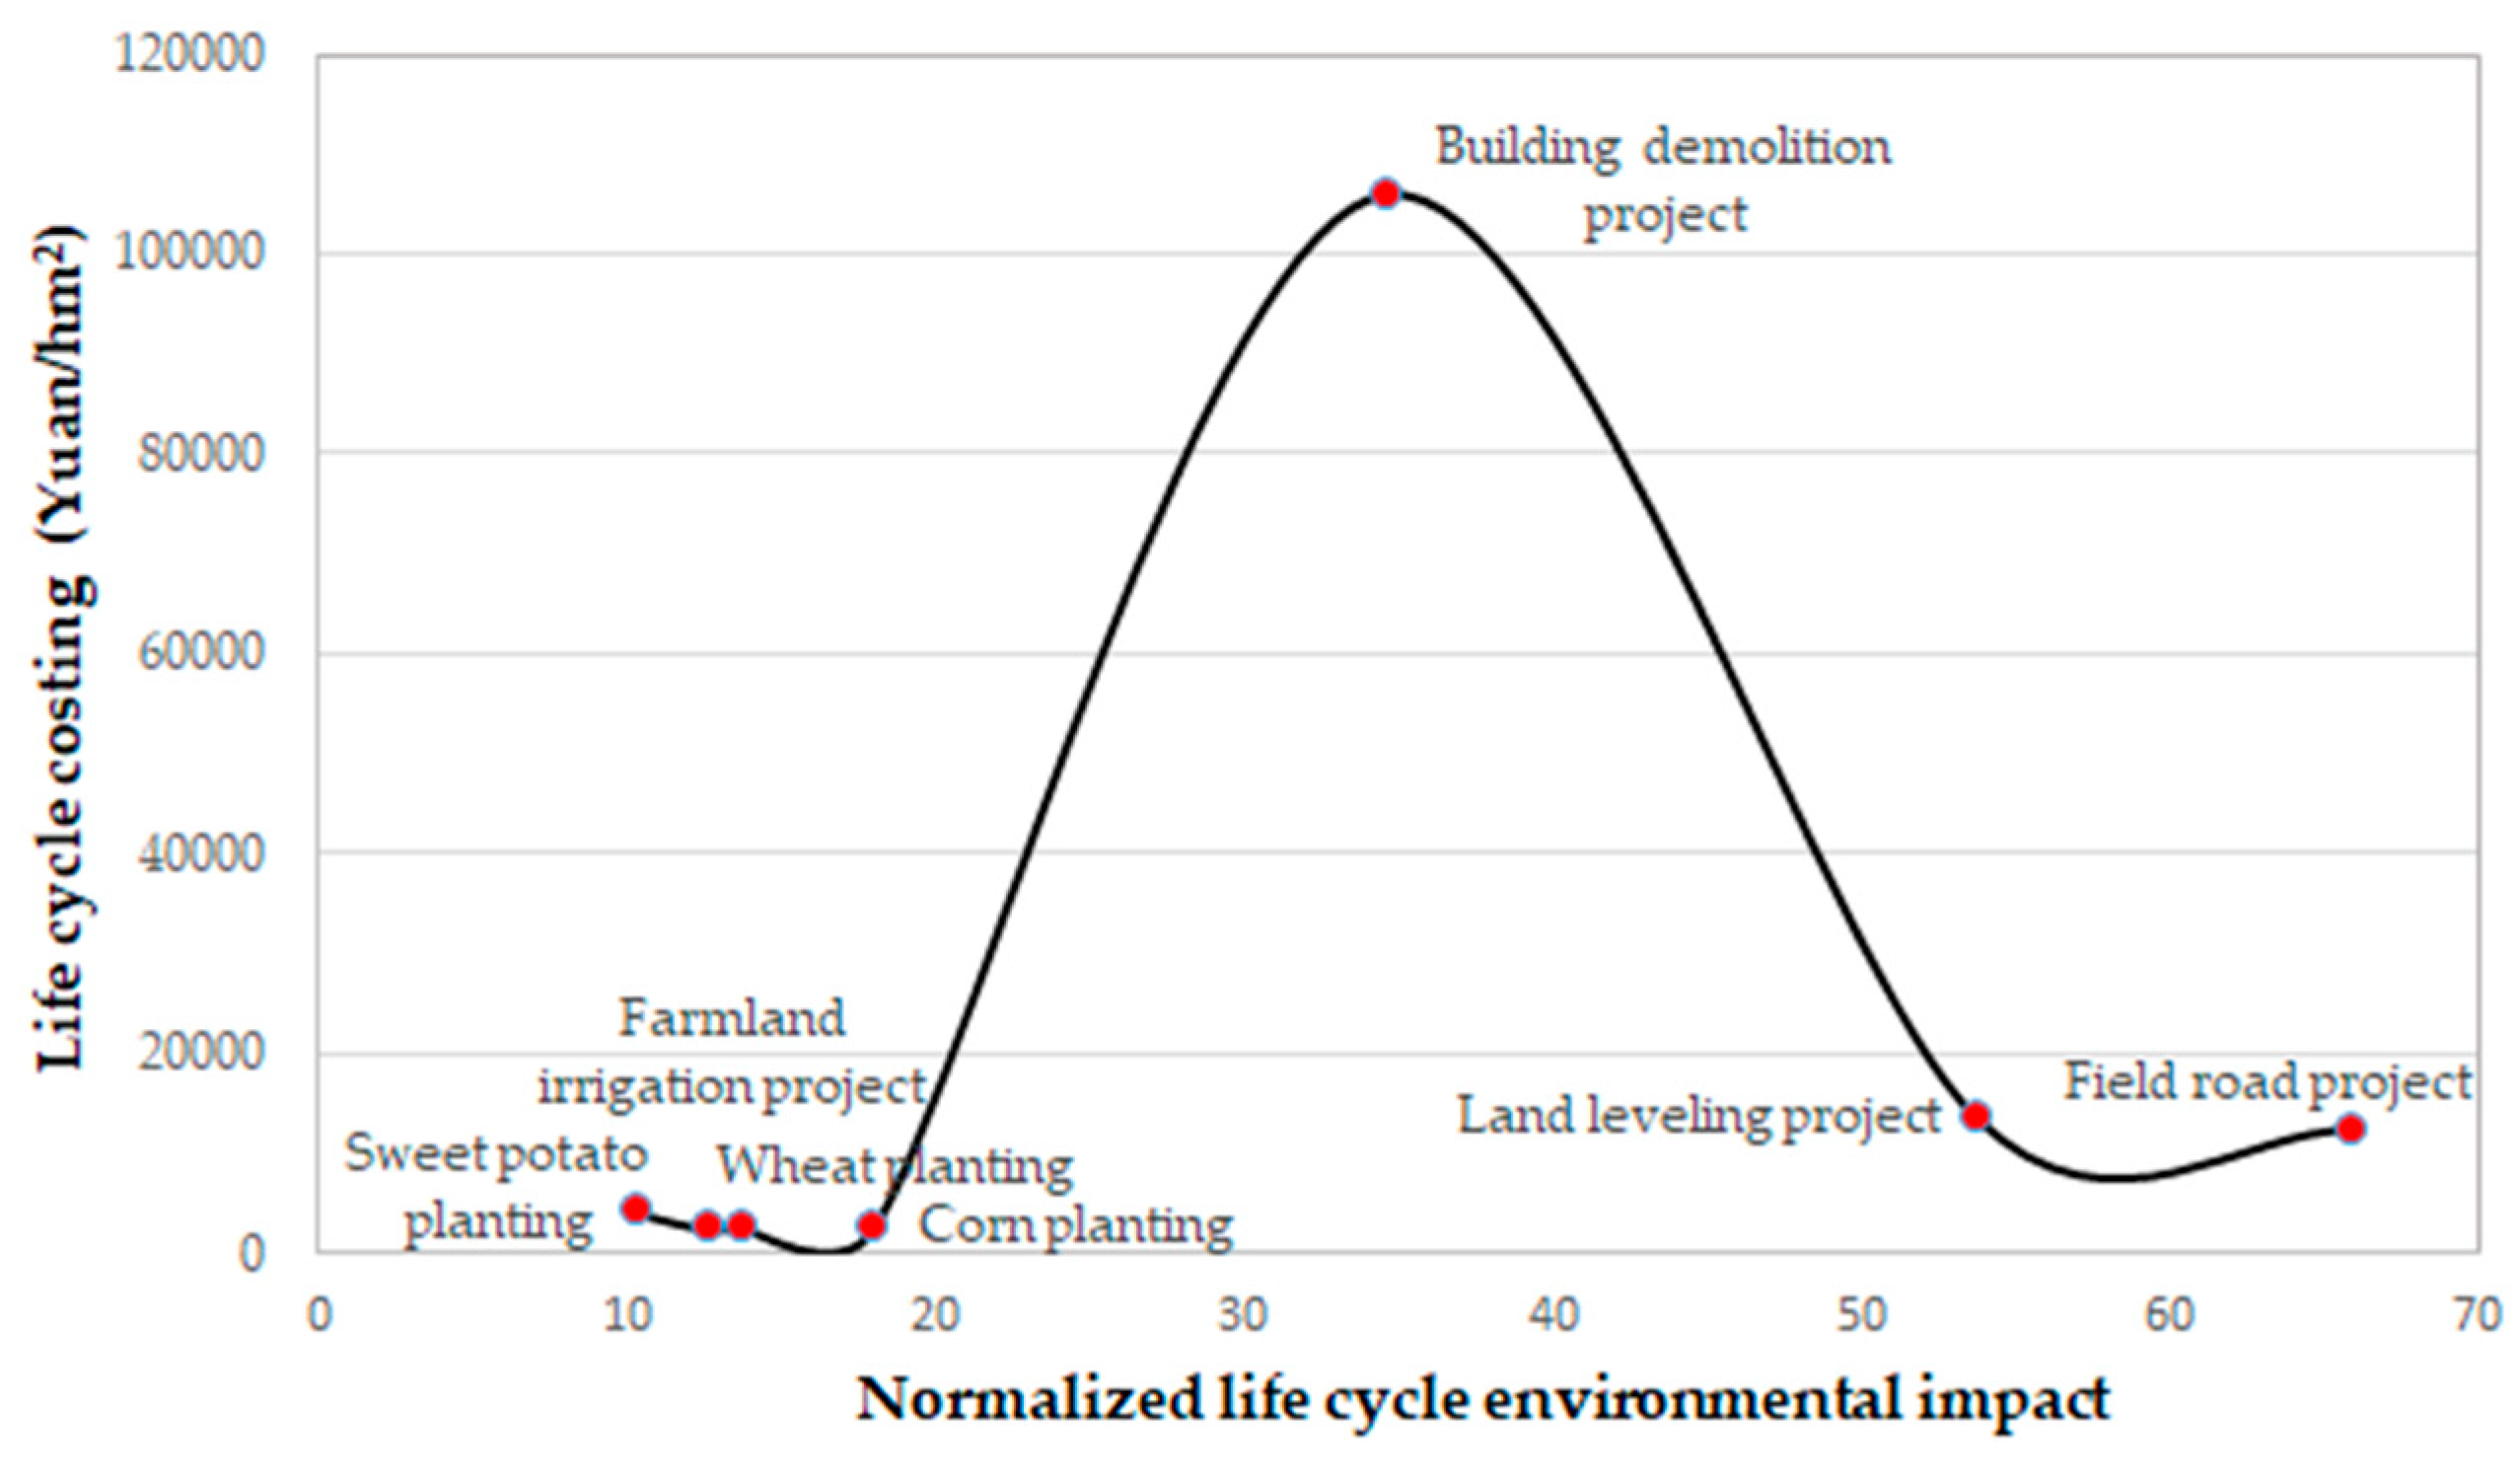
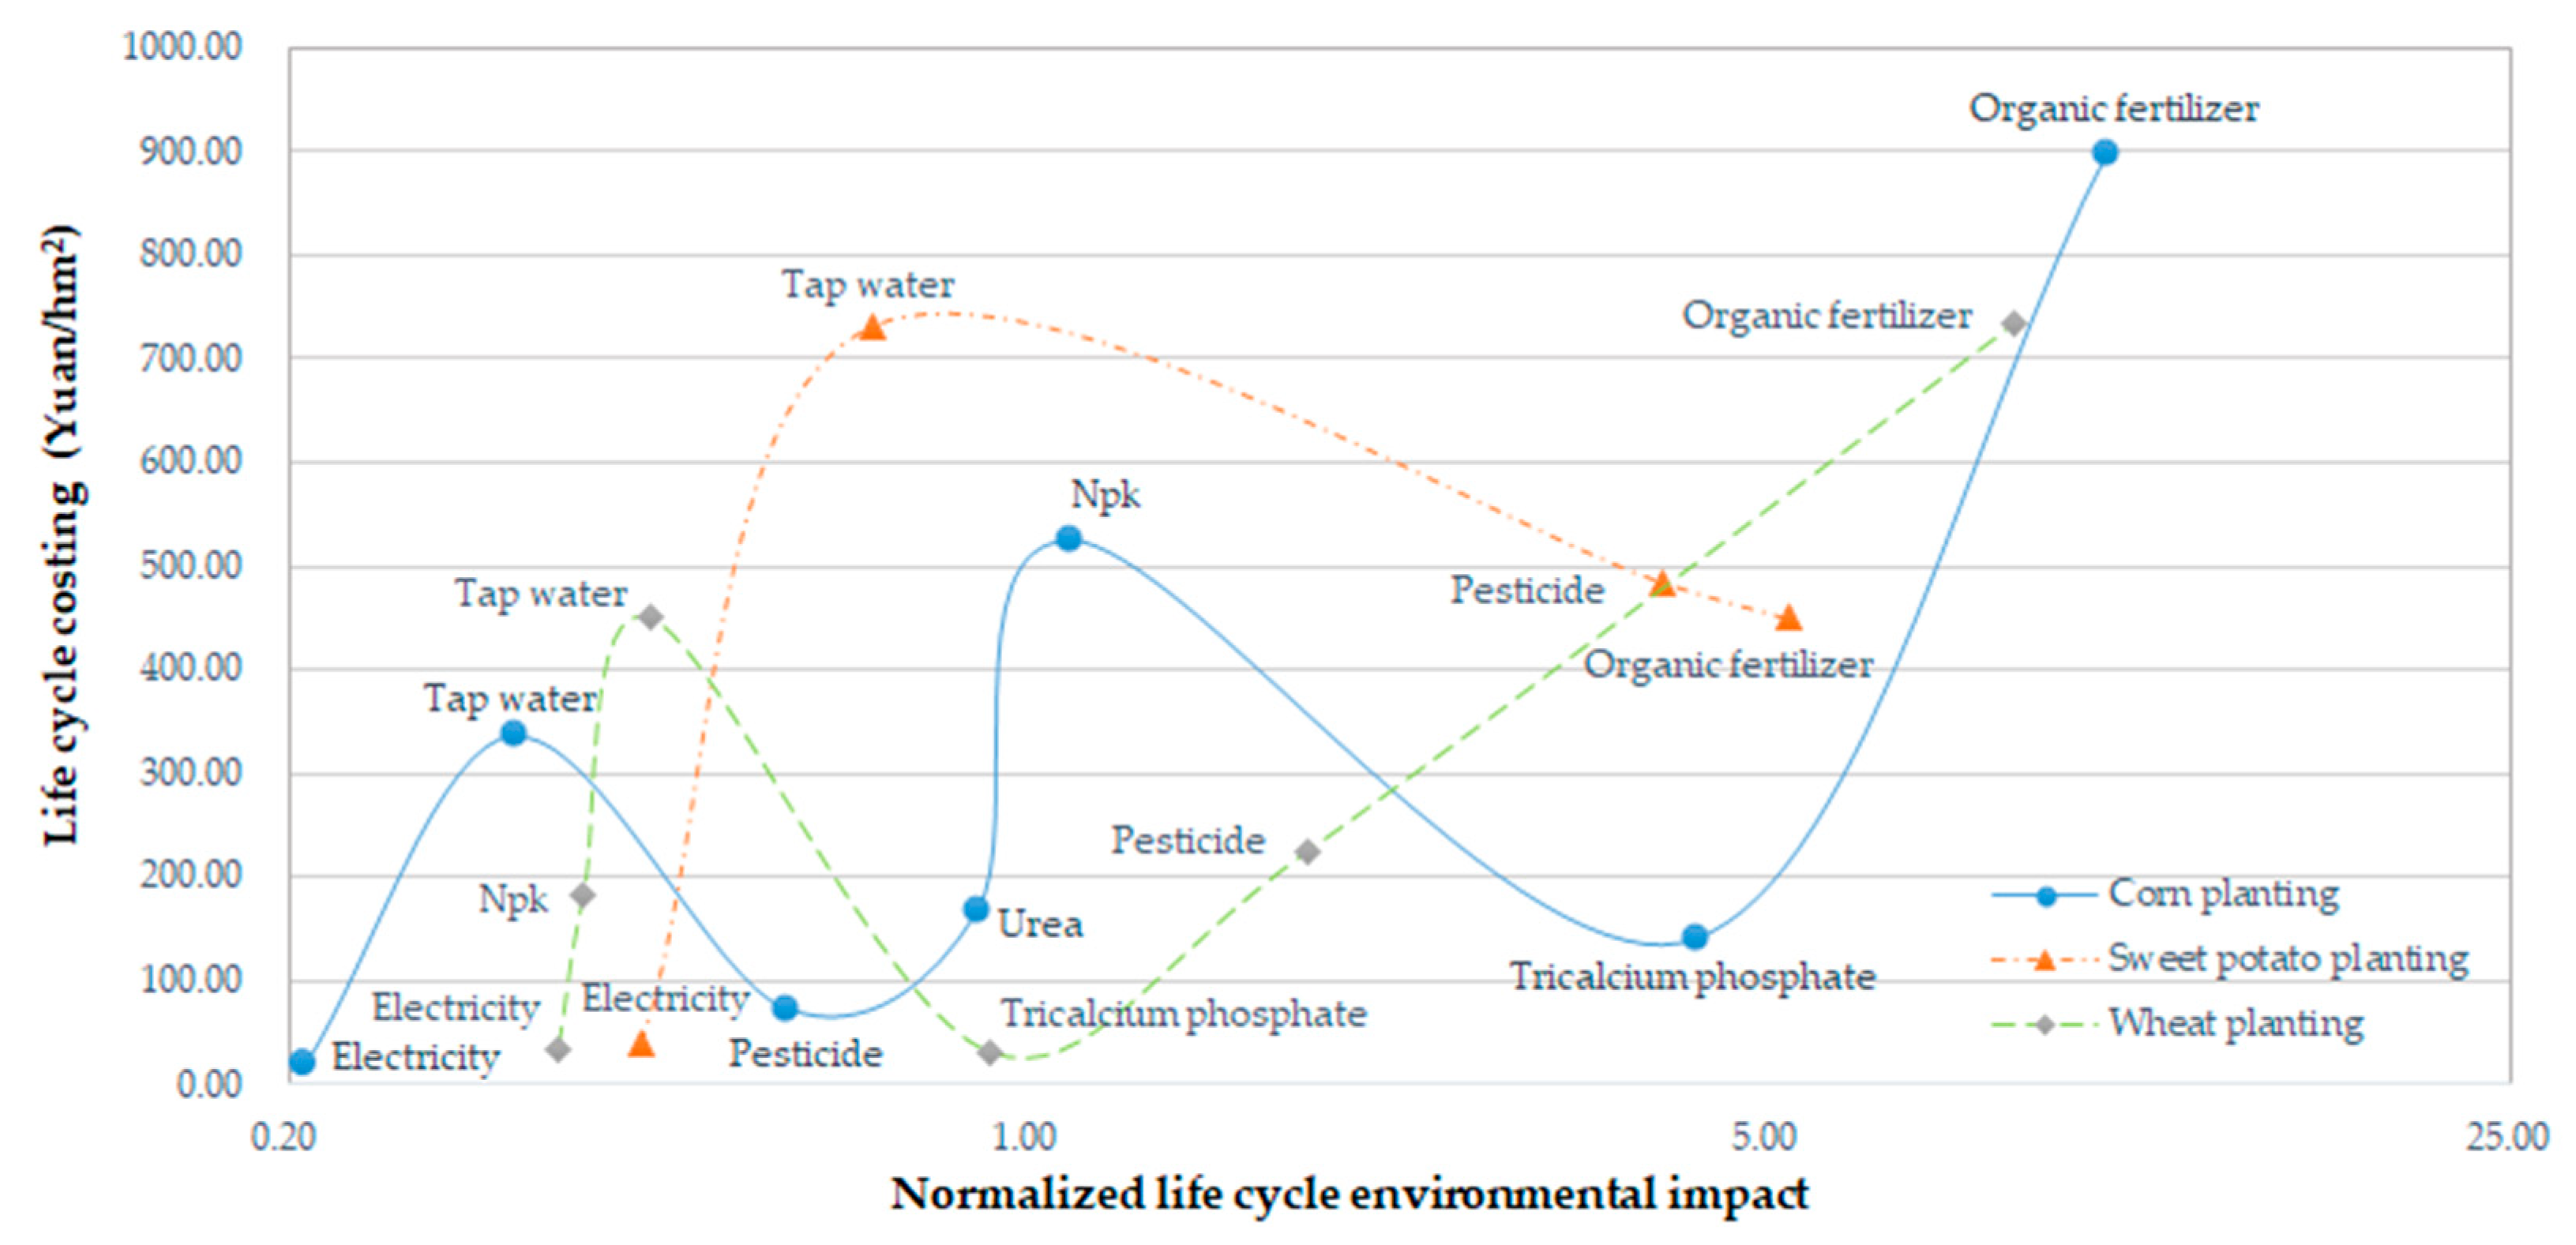
Analyzing the processes of land resource-asset and asset-capitalization shows that there is no significant positive correlation between the environmental impact and economic costs of different raw materials. From the perspective of the net economic output caused by the unit environmental load, the environmental and economic benefits of different crops can be compared comprehensively. In addition, the positive effect of the changes in ecosystem services during the process of land asset-capitalization is dominant and far outweighs the negative impact.
For different environmental protection purposes, it is possible to reduce the potential environmental impact in the whole process of land resource-asset-capitalization according to the sensitivity analysis of different inputs to various environmental indicators.
The price of land tickets does not reflect the actual value of land tickets. In this regard, the government needs to rationally regulate the development of the real estate market. At the same time, they should moderately relax their interventions and restrictions on the price of land tickets to make the value of land tickets more relevant to the market.

Author Contributions

Data curation, W.F.; formal analysis, W.F., X.L., and X.W.; funding acquisition, H.W. and X.W.; investigation, W.F. and H.W.; methodology, W.F. and H.W.; project administration, H.W.; software, W.F.; supervision, N.C.; visualization, N.C.; writing—original draft, W.F. and N.C.; writing—review and editing, W.F. All authors have read and agreed to the published version of the manuscript.

Funding

This research was funded by the Second Tibetan Plateau Scientific Expedition and Research Program (2019QZKK0608), National Natural Science Foundation of China (41901259), the EU project “Sustainable Process Integration Laboratory—SPIL” (No. CZ.02.1.01/0.0/0.0/15_003/0000456) funded by EU “CZ Operational Programme Research, Development and Education” and Humanities and Social Sciences Fund Project of the Ministry of Education (13yja630053).

Conflicts of Interest

The authors declare no conflict of interest.

References

  1. Liu, W.; Chen, W.P.; Feng, Q.; Peng, C.; Kang, P. Cost-benefit analysis of green infrastructures on community stormwater reduction and utilization: A case of Beijing, China. Environ. Manag. 2016, 58, 1015–1026. [Google Scholar] [CrossRef] [PubMed] [Green Version]
  2. Maack, J.; Lingenfelder, M.; Smaltschinski, T.; Jaeger, D.; Koch, B. Exploring the regional potential of lignocellulosic biomass for an emerging bio-based economy: A case study from southwest Germany. Forests 2017, 8, 449. [Google Scholar] [CrossRef] [Green Version]
  3. Bach, V.; Finogenova, N.; Berger, M.; Winter, L.; Finkbeiner, M. Enhancing the assessment of critical resource use at the country level with the SCARCE method—Case study of Germany. Resour. Policy 2017, 53, 283–299. [Google Scholar] [CrossRef] [Green Version]
  4. Akpona, T.J.D.; Akpona, H.A.; Djossa, B.A.; Savi, M.K.; Dainou, K.; Ayihouenou, B.; Kakai, R.G. Impact of land use practices on traits and production of shea butter tree (Vitellaria paradoxa, C.F. Gaertn.) in Pendjari Biosphere Reserve in Benin. Agrofor. Syst. 2015, 90, 607–615. [Google Scholar] [CrossRef]
  5. Meer, E.V.D. Carnivore conservation under land use change: The status of Zimbabwe’s cheetah population after land reform. Biodivers. Conserv. 2017, 27, 647–663. [Google Scholar] [CrossRef]
  6. Jiang, D.M.; Li, X.S.; Qu, F.T.; Li, M.Y.; Zhang, S.L.; Gong, Y.L.; Shi, X.P.; Chen, X. Driving mechanism and boundary control of urban sprawl. Front. Environ. Sci. Eng. 2015, 9, 298–309. [Google Scholar] [CrossRef]
  7. Tian, G.J.; Qiao, Z.; Gao, X.L. Rural settlement land dynamic modes and policy implications in Beijing metropolitan region, China. Habitat Int. 2014, 44, 237–246. [Google Scholar] [CrossRef]
  8. Li, Y.H.; Westland, H.; Zheng, X.Y.; Liu, Y.S. Bottom-up initiatives and revival in the face of rural decline: Case studies from China and Sweden. J. Rural Stud. 2016, 47, 506–513. [Google Scholar] [CrossRef]
  9. Shi, M.; Xie, Y.; Cao, Q. Spatiotemporal changes in rural settlement land and rural population in the middle basin of the Heihe river, China. Sustainability 2016, 8, 614. [Google Scholar] [CrossRef] [Green Version]
  10. Liu, Z.; Liu, S.H.; Jin, H.R.; Qi, W. Rural population change in China: Spatial differences, driving forces and policy implications. J. Rural Stud. 2017, 51, 189–197. [Google Scholar] [CrossRef]
  11. Zhou, W.; Chen, Y. China’s economic development transformation and reform path breakthrough under the new normal. Study Explor. 2017, 258, 103–110. [Google Scholar]
  12. Gao, J.X.; Fan, X.S.; Li, H.M.; Tian, M.R. Research on constituent elements, operation modes and political demands for capitalizing ecological assets. Res. Environ. Sci. 2016, 29, 315–322. [Google Scholar]
  13. Liu, X.R.; Fan, Y.J. Management of resources, assets and capital of urban industrial park: Comment on study on integration management of resources, assets and capital of urban industrial park. Issues Agric. Econ. 2018, 9, 143–144. [Google Scholar]
  14. Li, Q. Public participation in the process of ecological capitalization: A study based on the investigation of Fuzhou, Jiangxi province. J. Poyang Lake 2018, 5, 52–57. [Google Scholar]
  15. Daniels, E.E.; Lenderink, G.; Hutjes, R.W.A.; Holtslag, A.A.M. Observed urban effects on precipitation along the Dutch West coast. Int. J. Climatol. 2016, 36, 2111–2119. [Google Scholar] [CrossRef]
  16. Bagheri, B.; Tousi, S.N. An explanation of urban sprawl phenomenon in Shiraz Metropolitan Area (SMA). Cities 2017, 73, 71–90. [Google Scholar] [CrossRef]
  17. Zambon, I.; Benedetti, A.; Ferrara, C.; Salvati, L. Soil matters? A multivariate analysis of socioeconomic constraints to urban expansion in mediterranean Europe. Ecol. Econ. 2018, 146, 173–183. [Google Scholar] [CrossRef]
  18. Madanian, M.; Soffianian, A.R.; Koupai, S.S.; Pourmanafi, S.; Momeni, M. Analyzing the effects of urban expansion on land surface temperature patterns by landscape metrics: A case study of Isfahan city, Iran. Environ. Monit. Assess. 2018, 190, 189. [Google Scholar] [CrossRef]
  19. Morano, P.; Tajani, F. Saving soil and financial feasibility. A model to support public-private partnerships in the regeneration of abandoned areas. Land Use Policy 2018, 73, 40–48. [Google Scholar] [CrossRef]
  20. Lichtenberg, E.; Ding, C.R. Assessing farmland protection policy in China. Land Use Policy 2008, 25, 59–68. [Google Scholar] [CrossRef]
  21. Hall, C.; Mcvittie, A.; Moran, D. What does the public want from agriculture and the countryside? A review of evidence and methods. J. Rural Stud. 2004, 20, 211–225. [Google Scholar] [CrossRef]
  22. Nickerson, C.J.; Daniel, H. Protecting rural amenities through farmland preservation programs. Agric. Resour. Econ. Rev. 2003, 32, 129–144. [Google Scholar] [CrossRef] [Green Version]
  23. Jin, J.J.; Jiang, C.; Li, L. The economic valuation of cultivated land protection: A contingent valuation study in Wenling City, China. Landsc. Urban Plan. 2013, 119, 158–164. [Google Scholar]
  24. Newman, L.; Powell, L.J.; Wittman, H. Landscapes of food production in agriburbia: Farmland protection and local food movements in British Columbia. J. Rural Stud. 2015, 39, 99–110. [Google Scholar] [CrossRef]
  25. Perrin, C.; Nougaredes, B.; Sini, L.; Branduini, P.; Salvati, L. Governance changes in peri-urban farmland protection following decentralisation: A comparison between Montpellier (France) and Rome (Italy). Land Use Policy 2018, 70, 535–546. [Google Scholar] [CrossRef] [Green Version]
  26. Duke, J.M.; Aull-Hyde, R. Identifying public preferences for land preservation using the analytic hierarchy process. Ecol. Econ. 2002, 42, 131–145. [Google Scholar] [CrossRef]
  27. Xin, Y.; Burton, M.; Cai, Y.Y.; Zhang, A.L. Exploring heterogeneous preference for farmland non-market values in Wuhan, Central China. Sustainability 2016, 8, 12. [Google Scholar]
  28. Torre, C.M.; Morano, P.; Tajani, F. Saving Soil for Sustainable Land Use. Sustainability 2017, 9, 350. [Google Scholar] [CrossRef] [Green Version]
  29. Ren, P.; Wu, T.; Zhou, J.M. Analysis and assessment of the implementation performance of the policy of the increase and decrease linking for construction land. Chin. J. Agric. Resour. Reg. Plan. 2014, 35, 25–31. [Google Scholar]
  30. Gu, H.L.; Fen, S.Y.; Qu, F.T. Comparison of the two modes of the linkage between urban construction land increase and rural residential land decrease in Chongqing. China Land Sci. 2014, 28, 11–16. [Google Scholar]
  31. Chen, C.; Zhang, W.; Fen, C.C. Risk identification and evaluation of the construction land securities in Chongqing based on set-valued statistics and hierarchy. Trop. Geogr. 2017, 37, 356–364. [Google Scholar]
  32. Zhang, P.; Wang, Q. Analysis of intrinsic value and pricing model of land tickets transaction—Taking Chongqing as an example. Rural Econ. 2017, 5, 39–45. [Google Scholar]
  33. Chongqing Country Land Exchange. Land Tickets Exchange. Available online: https://www.ccle.cn/page/dpjy/index (accessed on 4 January 2020).
  34. Fan, W.G.; Dong, X.B.; Wei, H.J.; Weng, B.Q.; Liang, L.; Xu, Z.H.; Wang, X.C.; Wu, F.L.; Chen, Z.D.; Jin, Y.; et al. Is it true that the longer the extended industrial chain, the better the circular agriculture? A case study of circular agriculture industry company in Fuqing, Fujian. J. Clean. Prod. 2018, 189, 718–728. [Google Scholar] [CrossRef]
  35. Levasseur, A.; Bahn, O.; Beloin-Saint-Pierre, D.; Marinova, M.; Vaillancourt, K. Assessing butanol from integrated forest biorefinery: A combined techno-economic and life cycle approach. Appl. Energy 2017, 198, 440–452. [Google Scholar] [CrossRef]
  36. Khatri, P.; Jain, S.; Pandey, S. A cradle-to-gate assessment of environmental impacts for production of mustard oil using life cycle assessment approach. J. Clean. Prod. 2017, 166, 988–997. [Google Scholar] [CrossRef]
  37. Gilpin, G.S.; Andrae, A.S.G. Comparative attributional life cycle assessment of European cellulase enzyme production for use in second-generation lignocellulosic bioethanol production. Int. J. Life Cycle Assess. 2017, 22, 1034–1053. [Google Scholar] [CrossRef]
  38. Xiao, R.F.; Zhang, Y.; Yuan, Z.W. Environmental impacts of reclamation and recycling processes of refrigerators using life cycle assessment (LCA) methods. J. Clean. Prod. 2016, 131, 52–59. [Google Scholar] [CrossRef]
  39. Kim, K.J.; Yun, W.G.; Cho, N.; Ha, J. Life cycle assessment based environmental impact estimation model for pre-stressed concrete beam bridge in the early design phase. Environ. Impact Assess. Rev. 2017, 64, 47–56. [Google Scholar] [CrossRef]
  40. Fan, W.G.; Zhang, P.; Xu, Z.H.; Wei, H.J.; Lu, N.C.; Wang, X.C.; Weng, B.Q.; Chen, Z.D.; Wu, F.L.; Dong, X.B. Life cycle environmental impact assessment of circular agriculture: A case study in Fuqing, China. Sustainability 2018, 10, 1810. [Google Scholar] [CrossRef] [Green Version]
  41. Sengupta, D.; Hawkins, T.R.; Smith, R.L. Using national inventories for estimating environmental impacts of products from industrial sectors: A case study of ethanol and gasoline. Int. J. Life Cycle Assess. 2015, 20, 597–607. [Google Scholar] [CrossRef]
  42. Martinez, E.; Blanco, J.; Jimenez, E.; Saenz-Diez, J.C.; Sanz, F. Comparative evaluation of life cycle impact assessment software tools through a wind turbine case study. Renew. Energy 2015, 74, 237–246. [Google Scholar] [CrossRef]
  43. Antonanzas, J.; Arbeloa-Ibero, M.; Quinn, J.C. Comparative life cycle assessment of fixed and single axis tracking systems for photovoltaics. J. Clean. Prod. 2019, 240, 118016. [Google Scholar] [CrossRef]
  44. National Institute for Public Health and the Environment Ministry of Health, Welfare and Sport. LCIA: The ReCiPe model. Available online: https://www.rivm.nl/en/life-cycle-assessment-lca/recipe (accessed on 6 February 2020).
  45. Ye, L.P.; Hong, J.L.; Ma, X.T.; Qi, C.C.; Yang, D. Life cycle environmental and economic assessment of ceramic tile production: A case study in China. J. Clean. Prod 2018, 189, 432–441. [Google Scholar] [CrossRef]
  46. OECD. Environmental Indicators for Agriculture Methods and Results; Executive Summary: Paris, France, 2000. [Google Scholar]
  47. Wei, H.J.; Fan, W.G.; Wang, X.C.; Lu, N.C.; Dong, X.B.; Zhao, Y.N.; Ya, X.J.; Zhao, Y.F. Integrating supply and social demand in ecosystem services assessment: A review. Ecosyst. Serv. 2017, 25, 15–27. [Google Scholar] [CrossRef]
  48. Xu, Z.H.; Wei, H.J.; Fan, W.G.; Wang, X.C.; Huang, B.L.; Lu, N.H.; Ren, J.H.; Dong, X.B. Energy modeling simulation of changes in ecosystem services before and after the implementation of a Grain-for-Green program on the Loess Plateau—A case study of the Zhifanggou valley in Ansai County, Shaanxi province, China. Ecosyst. Serv. 2018, 31, 32–43. [Google Scholar] [CrossRef]
  49. Hu, X.Y.; Wu, J.; Zhang, X.S. Study of the methodology of evaluating paddy ecosystem’s multifunction. Environ. Prot. Sci. 2017, 43, 75–81. [Google Scholar]
  50. Wen, C.B.; Qian, F.J.; Liu, P. Situation and evaluation of agricultural straw resource utilization. Ecol. Econ. 2018, 34, 147–150. [Google Scholar]
  51. Xu, H.Z. Market failure and loss of ecosystem service value of farmland in the process of farmland conversion—A case study of Jiangsu Province. Chin. J. Eco-Agric. 2010, 18, 1366–1371. [Google Scholar] [CrossRef]
  52. Xie, G.D.; Zhen, L.; Lu, C.X.; Xiao, Y.; Chen, C. Expert knowledge based valuation method of ecosystem services in China. J. Nat. Resour. 2008, 23, 911–919. [Google Scholar]
  53. You, S.C.; Li, W.Q. Estimation of soil erosion supported by Gis—A case study in Guanji township, Taihe, Jiangxi. J. Nat. Resour. 1999, 14, 63–69. [Google Scholar]
  54. Liu, M.C.; Zhang, D.; Li, W.H. Evaluation of comprehensive benefit of rice-fish agriculture and rice monocropping—A case study of Qingtian County, Zhejiang Province. Chin. J. Eco-Agric. 2010, 18, 164–169. [Google Scholar] [CrossRef]
  55. Xiang, P.A.; Huang, H.; Yan, H.M. Environmental cost of rice production in Dongting Lake area of Hunan Province. Chin. J. Appl. Ecol. 2005, 16, 183–189. [Google Scholar]
  56. Yuan, X.Z.; Xiao, H.Y.; Yan, W.T.; Li, B. Dynamic analysis of land use and ecosystem services value in Cheng-Yu Economic Zone, Southwest China. Chin. J. Ecol. 2012, 31, 180–186. [Google Scholar]
  57. Zhou, Z.Z.; Tang, Y.J.; Chi, Y.; Ni, M.J.; Buekens, A. Waste-to-energy: A review of life cycle assessment and its extension methods. Waste Manag. Res. 2018, 36, 3–16. [Google Scholar] [CrossRef]
  58. Geng, L.J. A Study on the Price Forming Mechanism of Land Ticket; Chongqing University: Chongqing, China, 2014. [Google Scholar]
Figure 1. The operation and transformation form of resource-asset-capitalization.
Sustainability 12 01236 g001
Figure 2. The system boundary of the process of land resource-asset-capitalization.
Sustainability 12 01236 g002
Figure 3. Contributions of different environmental indicators after standardization and weighting.
Sustainability 12 01236 g003
Figure 4. The composition of environmental indicators in the process of land resource-asset-capitalization.
Sustainability 12 01236 g004
Figure 5. The contributions of environmental indicators in different links of land resource-asset-capitalization.
Sustainability 12 01236 g005
Figure 6. Life cycle costs versus environmental impacts in the process of land resource-asset-capitalization.
Sustainability 12 01236 g006
Figure 7. Life cycle costs versus environmental impacts in the process of land asset-capitalization.
Sustainability 12 01236 g007
Figure 8. Changes of ecosystem services before and after land asset-capitalization.
Sustainability 12 01236 g008
Table 1. Data inventory of the building demolition and land leveling project (Per functional unit).
Building Demolition ProjectLand Leveling Project
CategoriesAmountCost (Yuan)CategoriesAmountCost (Yuan)
Raw materialsTap water 863.91 kg2.59Tap water 612.32 kg1.84
Stone slab7100 kg530.4
Reused stone slab47,867.22 kg1930.01
EnergyElectricity74.99 kW·h59.44Electricity44.24 kW·h35.06
Gasoline171.48 kg1685.61
Diesel657.31 kg4719.49Diesel46.57 kg334.37
LaborsClass A workers271.6 workdays14,666.25Class A workers11.32 workdays611.28
Class B workers1458.36 workdays59,792.76Class B workers185.35 workdays7599.35
MechanicalCrane (14.3 Km)0.37 Shift173.17Excavator (38.3 km)0.92 Shift574.76
Trailer head (14.3 Km)0.37 Shift172.83
Excavator (38.3 Km)8.51 Shift7122.36
Bulldozer (14.3 Km)0.79 Shift351.79
Ramming machine (14.3 Km)2.39 Shift331.02
Dump Truck (14.3 Km)3.68 Shift1502.74
Measures fee 3849.65 493.73
Indirect fee 5193.65 666.09
Profit 2988.7 383.31
Tax 3304.11 423.76
Table 2. Data inventory of the farmland irrigation and field road project (Per functional unit).
Farmland Irrigation ProjectField Road Project
CategoriesAmountCost (Yuan)CategoriesAmountCost (Yuan)
Raw materialsTap water1702.67 kg5.11Tap water1208.71kg3.63
Cement 32.5570.71 kg199.75Cement 32.52274.88 kg800.19
Fine sand2349.51 kg213.89Fine sand4732 kg430.78
Gravel 40 mm1693.94 kg167.32Gravel 40mm8203 kg810.27
Limestone 2103.01 kg132.49Wood fibers panel111.80 kg64.43
Wood fibers panel52.57 kg30.3Reused stone slab95,032.39 kg3831.71
Steel plate0.10 kg0.47Stone slab5040 kg376.08
Steel section0.31 kg1.33Concrete C2014,773.50 kg1787.41
Cast iron component0.02 kg0.09
Steel billet0.10 kg0.04
Stone slab2575 kg192.15
Reused stone slab6920.38 kg279.01
Concrete C202682.32 kg324.53
Normal mortar1685.91 kg207.59
EnergyDiesel4.32 kg31.02Diesel10.25 kg73.6
Electricity4.18 kW·h3.32Electricity30.20 kW·h23.93
LaborsClass A workers0.51 workdays27.54Class A workers6.92 workdays373.68
Class B workers5.32 workdays218.12Class B workers39.21 workdays1607.61
MechanicalSawing machine (14.3 km)0.05 Shift7.28Ramming machine (14.3 Km)1.23 Shift170.40
Concrete mixer machine (14.3 km)0.04 Shift7.7
Vibrator (14.3 km)0.11 Shift2.48Concrete mixer machine (14.3 km)0.42 Shift89.06
Sand gun (14.3 km)0.04 Shift6.96
Double rubber wheel (14.3 km)0.20 Shift0.55Dump Truck (14.3 Km)0.32185.84
Electric welder (14.3 km)0.05 Shift10.32
Measures fee 87.95 451.72
Indirect fee 118.65 609.42
Profit 68.28 350.69
Tax 75.48 387.7
Table 3. Data inventory of corn, sweet potato, and wheat planting.
CategoriesCorn PlantingSweet Potato PlantingWheat Planting
AmountCost (Yuan)AmountCost (Yuan)AmountCost (Yuan)
Seedlings15.02 kg450.651573.56 kg2360.33209.60 kg943.21
Organic fertilizer1498.66 kg899.2749.33 kg449.331224.43 kg734.66
Npk227.94 kg524.27 78.68 kg180.97
Tricalcium phosphate165.06 kg140.3 35.67 kg30.32
Urea75.95 kg167.08
Pesticide2.25 kg71.9415.13 kg484.047.01 kg224.52
Electricity24.86 kW·h19.751.16 kW·h40.5443.14 kW·h34.19
Tap water111,997.65 kg335.99243,823.71 kg731.47149,865.85 kg449.6
Area0.5 ha 0.5 ha 1 ha
Total income 7897.5 15,000 6240
Net income 5288.38 10,934.01 3642.55
Table 4. Types and calculation methods of ecosystem service values in farmland.
Ecosystem ServicesInstructionsCalculation MethodMethod Statement
Provisioning Services Vy is the value of Food Production; TRV is the total value of food production; TRC is the cost of food production.
Crop production [49]Food productionVy = TRV–TRC
Regulating Services
Climate regulation [50]Carbon fixation and oxygen productionVco2 = Qg × (1 + kg) × 1.63 × 0.27 × fc
Vo2 = Qg× (1 + kg) × 1.07 × Co2
Vco2 is value of carbon fixation; Vo2 is value of O2 production; Qg is crop production; Kg is the grass valley ratio; fc is the carbon tax rate; Co2 is industrial oxygen cost.
Water conservation [51]Dominating the conservation of groundwater Vw = (R − E) × Area × PwVw is the value of water conservation; R is the regional average precipitation; E is the evapotranspiration; Pw is the storage cost of water
Waste treatment [52]Garbage, etc., poured into farmland, can be purifiedVwt = Ewt× AreaVwt is the value of waste treatment; Ewt is the value factor.
Supporting Services Qsm is the amount of soil conservation, R is the rainfall erosivity index; K is the soil erodibility factor; LS is the slope and length gradient factor; C is the vegetation coverage factor; P is the soil conservation factor; Qei is the soil content of N, P, K; Pei is the price of N, P, K fertilizer.
Soil conservation [53]Conserving soil and maintaining soil’s nutrient valuesQsm = R × K × LS × (1 − C × P)
Ves = ∑Qsm× Qei × Pei (i = N, P, K)
Biodiversity [52]Maintaining biodiversityVb = Eb × AreaVb is the value of biodiversity; Eb is the value factor.
Cultural Services Vm is the value of maintain landscape culture; Vi is the actual expenses, such as ticket fees, tolls, etc.
Maintain landscape culture [54]Ornamental farmland has landscape valuesVm = ∑Vi
Negative Services
Fertilizer pollution [55]The soil, air, and water pollution of fertilizer use Cf = Tv× Qf × PvCf is the economic loss caused by cadmium pollution; Tv is the total crop yield; Qf is the over-standard rate of cadmium in crops; Pv is the price of agricultural products.
Pesticide pollution [55]Pesticide has an impact on biodiversity and crop qualityCp = Tv × Qb × Pv + Tv × Qq × PvCp is the economic loss caused by pesticide pollution; Qb is reduced production due to reduced biodiversity; Qq is contaminated proportion due to pesticides.
Table 5. LCA midpoint results of the process of resource-asset-capitalization (Per functional unit).
CategoriesValuesUnitesCategoriesValuesUnites
Climate change1.01 × 104kg CO2-Equiv.Marine eutrophication5.95 × 100kg N-Equiv.
Human toxicity1.33 × 104kg 1,4-DB eq.Metal depletion3.37 × 102kg Fe eq.
Fossil depletion3.29 × 103kg oil eq.Ozone depletion8.65 × 10−11kg CFC-11 eq.
Freshwater ecotoxicity2.34 × 100kg 1,4-DB eq.Particulate matter formation2.81 × 101kg PM10 eq.
Freshwater eutrophication2.30 × 10−1kg P eq.Photochemical oxidant formation6.80 × 101kg NMVOC
Agricultural land occupation1.27 × 10−7m2aTerrestrial acidification8.12 × 101kg SO2 eq.
Ionizing radiation3.96 × 102kg U235 eq.Terrestrial ecotoxicity2.58 × 100kg 1,4-DB eq.
Marine ecotoxicity6.02 × 103kg 1,4-DB eq.
Table 6. Economic costs and environmental impacts of the inputs in different production links in the stage of land resource-asset.
CategoriesBuilding Demolition Land LevelingFarmland IrrigationField Road
Environment ImpactCost (Yuan)Environment Impact Cost (Yuan)Environment ImpactCost (Yuan)Environment ImpactCost (Yuan)
Tap water2.53 × 10−32.59 × 1001.79 × 10−31.84 × 1002.35 × 10−35.11 × 1003.54 × 10−33.63 × 100
Electricity6.25 × 10−15.94 × 1013.68 × 10−13.51 × 1011.64 × 10−23.32 × 1002.52 × 10−12.39 × 101
Equipment and Transportation8.25 × 10−29.65 × 1033.99 × 10−25.75 × 1023.99 × 10−23.53 × 1017.43 × 10−34.45 × 10²
Diesel2.66 × 1014.72 × 1031.88 × 1003.34 × 1028.24 × 10−23.10 × 1014.15 × 10−17.36 × 101
Gasoline7.33 × 1001.69 × 103
Stone slabs 5.14 × 1015.30 × 1028.80 × 1001.92 × 1023.65 × 1013.76 × 102
Fine sand 1.04 × 10−12.14 × 1024.44 × 10−14.31 × 10²
Gravel 7.50 × 10−21.67 × 1027.70 × 10−18.10 × 10²
Concrete 1.21 × 1003.25 × 1021.42 × 1011.79 × 103
Cement 1.52 × 1002.00 × 1021.28 × 1018.00 × 102
Wood fibers panels 1.21 × 10−13.03 × 1015.45 × 10−16.44 × 101
Limestone 2.60 × 10−11.32 × 102
Normal mortar 4.44 × 10−12.08 × 102
Cast iron component 2.45 × 10−49.00 × 10−2
Steel plates 2.08 × 10−34.70 × 10−1
Steel billets 3.05 × 10−34.00 × 10−2
Steel sections 3.71 × 10−31.33 × 100
Table 7. The net income of per unit environmental load of different crops in the process of land asset-capitalization.
CategoriesSweet Potato PlantingWheat PlantingCorn Planting
Area(ha)0.501.000.50
Environmental impact10.3013.7618.03
Total income (Yuan)15,000.006240.007897.50
Cost (Yuan)4065.992597.452609.12
Net income (Yuan)10,934.013642.555288.38
Net income per unit environmental load1061.55264.72293.31
Table 8. Parameter sensitivity analysis of the main inputs in a building demolition and land leveling project.
CategoriesBuilding Demolition ProjectLand Leveling Project
ParameterDieselGasolineElectricityMechanical Transportation and UseDieselStone SlabsElectricityMechanical Transportation and Use
Variation10%10%10%10%10%10%10%10%
Ht1.91 × 10−25.06 × 10−33.28 × 10−45.79 × 10−51.12 × 10−32.46 × 10−21.94 × 10−42.80 × 10⁻⁵
Me1.18 × 10−23.21 × 10−32.02 × 10−43.35 × 10−56.95 × 10−42.52 × 10−21.19 × 10−41.62 × 10⁻⁵
Fd2.30 × 10−26.16 × 10−35.26 × 10−44.74 × 10−51.35 × 10−31.88 × 10−23.10 × 10−42.29 × 10⁻⁵
Cc2.69 × 10−31.19 × 10−37.23 × 10−44.70 × 10−51.58 × 10−42.15 × 10−24.27 × 10−42.27 × 10⁻⁵
Pmf1.33 × 10−34.53 × 10−41.05 × 10−44.65 × 10−67.81 × 10−53.50 × 10−26.19 × 10−52.20 × 10⁻⁶
Ta1.89 × 10−35.83 × 10−41.31 × 10−45.10 × 10−61.11 × 10−44.12 × 10−27.72 × 10−52.44 × 10⁻⁶
Table 9. Parameter sensitivity analysis of main inputs in farmland irrigation project.
CategoriesFarmland Irrigation Project
ParameterDieselCement Fine SandLimestoneWood Fibers PanelsSteel PlatesStone SlabsConcrete C20Normal Mortar
Variation10%10%10%10%10%10%10%10%10%
Ht7.31 × 10−46.62 × 10−46.21 × 10−59.11 × 10−52.63 × 10−51.64 × 10−74.20 × 10−35.83 × 10−41.78 × 10−4
Me4.53 × 10−45.84 × 10−47.11 × 10−56.60 × 10−51.76 × 10−52.04 × 10−74.32 × 10−37.07 × 10−41.60 × 10−4
Fd8.82 × 10−45.42 × 10−42.97 × 10−52.09 × 10−47.97 × 10−58.22 × 10−73.21 × 10−34.89 × 10−41.80 × 10−4
Cc1.03 × 10−42.27 × 10−33.47 × 10−52.39 × 10−41.46 × 10−41.14 × 10−63.69 × 10−31.34 × 10−36.82 × 10−4
Pmf5.09 × 10−55.84 × 10−49.34 × 10−53.24 × 10−42.73 × 10−53.65 × 10−76.00 × 10−35.55 × 10−41.94 × 10−4
Ta7.25 × 10−54.55 × 10−41.51 × 10−56.97 × 10−52.24 × 10−53.17 × 10−77.05 × 10−33.45 × 10−49.29 × 10−5
Table 10. Parameter sensitivity analysis of the main inputs in the farmland irrigation and planting projects.
CategoriesField Road ProjectPlanting Project
ParameterCement 32.5Fine SandGravelStone SlabConcrete C20Organic FertilizerPesticidesNpkUrea
Variation10%10%10%10%10%10%10%10%10%
Ht5.60 × 10−32.86 × 10−39.49 × 10−41.74 × 10−23.54 × 10−35.06 × 10−31.34 × 10−32.17 × 10−42.07 × 10−4
Me4.93 × 10−33.28 × 10−31.09 × 10−31.79 × 10−24.30 × 10−31.47 × 10−28.69 × 10−41.62 × 10−41.62 × 10−4
Fd4.58 × 10−31.37 × 10−34.55 × 10−41.33 × 10−22.97 × 10−36.68 × 10−32.83 × 10−32.12 × 10−31.78 × 10−3
Cc1.92 × 10−21.60 × 10−35.31 × 10−41.53 × 10−28.14 × 10−37.50 × 10−32.03 × 10−32.00 × 10−31.08 × 10−3
Pmf4.93 × 10−34.30 × 10−31.43 × 10−32.49 × 10−23.37 × 10−31.13 × 10−24.70 × 10−47.29 × 10−41.74 × 10−4
Ta3.84 × 10−36.94 × 10−42.31 × 10−42.92 × 10−22.10 × 10−37.15 × 10−36.28 × 10−46.77 × 10−42.87 × 10−4
Table 11. Value composition of land resource-asset-capitalization.
CategoriesCost and Benefit DetailsCost (104 yuan)
Reclamation costEngineering cost13.43
Other cost4.50
Contingency cost0.60
Compensation costCompensation for buildings and above-ground structures144.00
Compensation for land use rights27.00
Housing subsidies34.20
Compensation for rural collective organizations25.50
Changes in values of ecosystem servicesProvisioning services1.99
Regulating services2.71
Supporting services1.18
Negative services−0.42
Land development rights162.84
Total value of land tickets417.53
The actual price of land tickets285.00

