Sensitivity Analysis of Passive Design Strategies for Residential Buildings in Cold Semi-Arid Climates


Abstract
1. Introduction
- How to model a typical residential building, considering the realistic operating conditions assumed for the initial calibration, and perform a sensitivity study in the cold semi-arid climate of Pakistan?
- How to achieve maximum comfort in a residential building with personalised heating and cooling systems based on an adaptive comfort model?
- What are the most effective passive design strategies for low-rise housing in the cold semi-arid climate of Quetta?
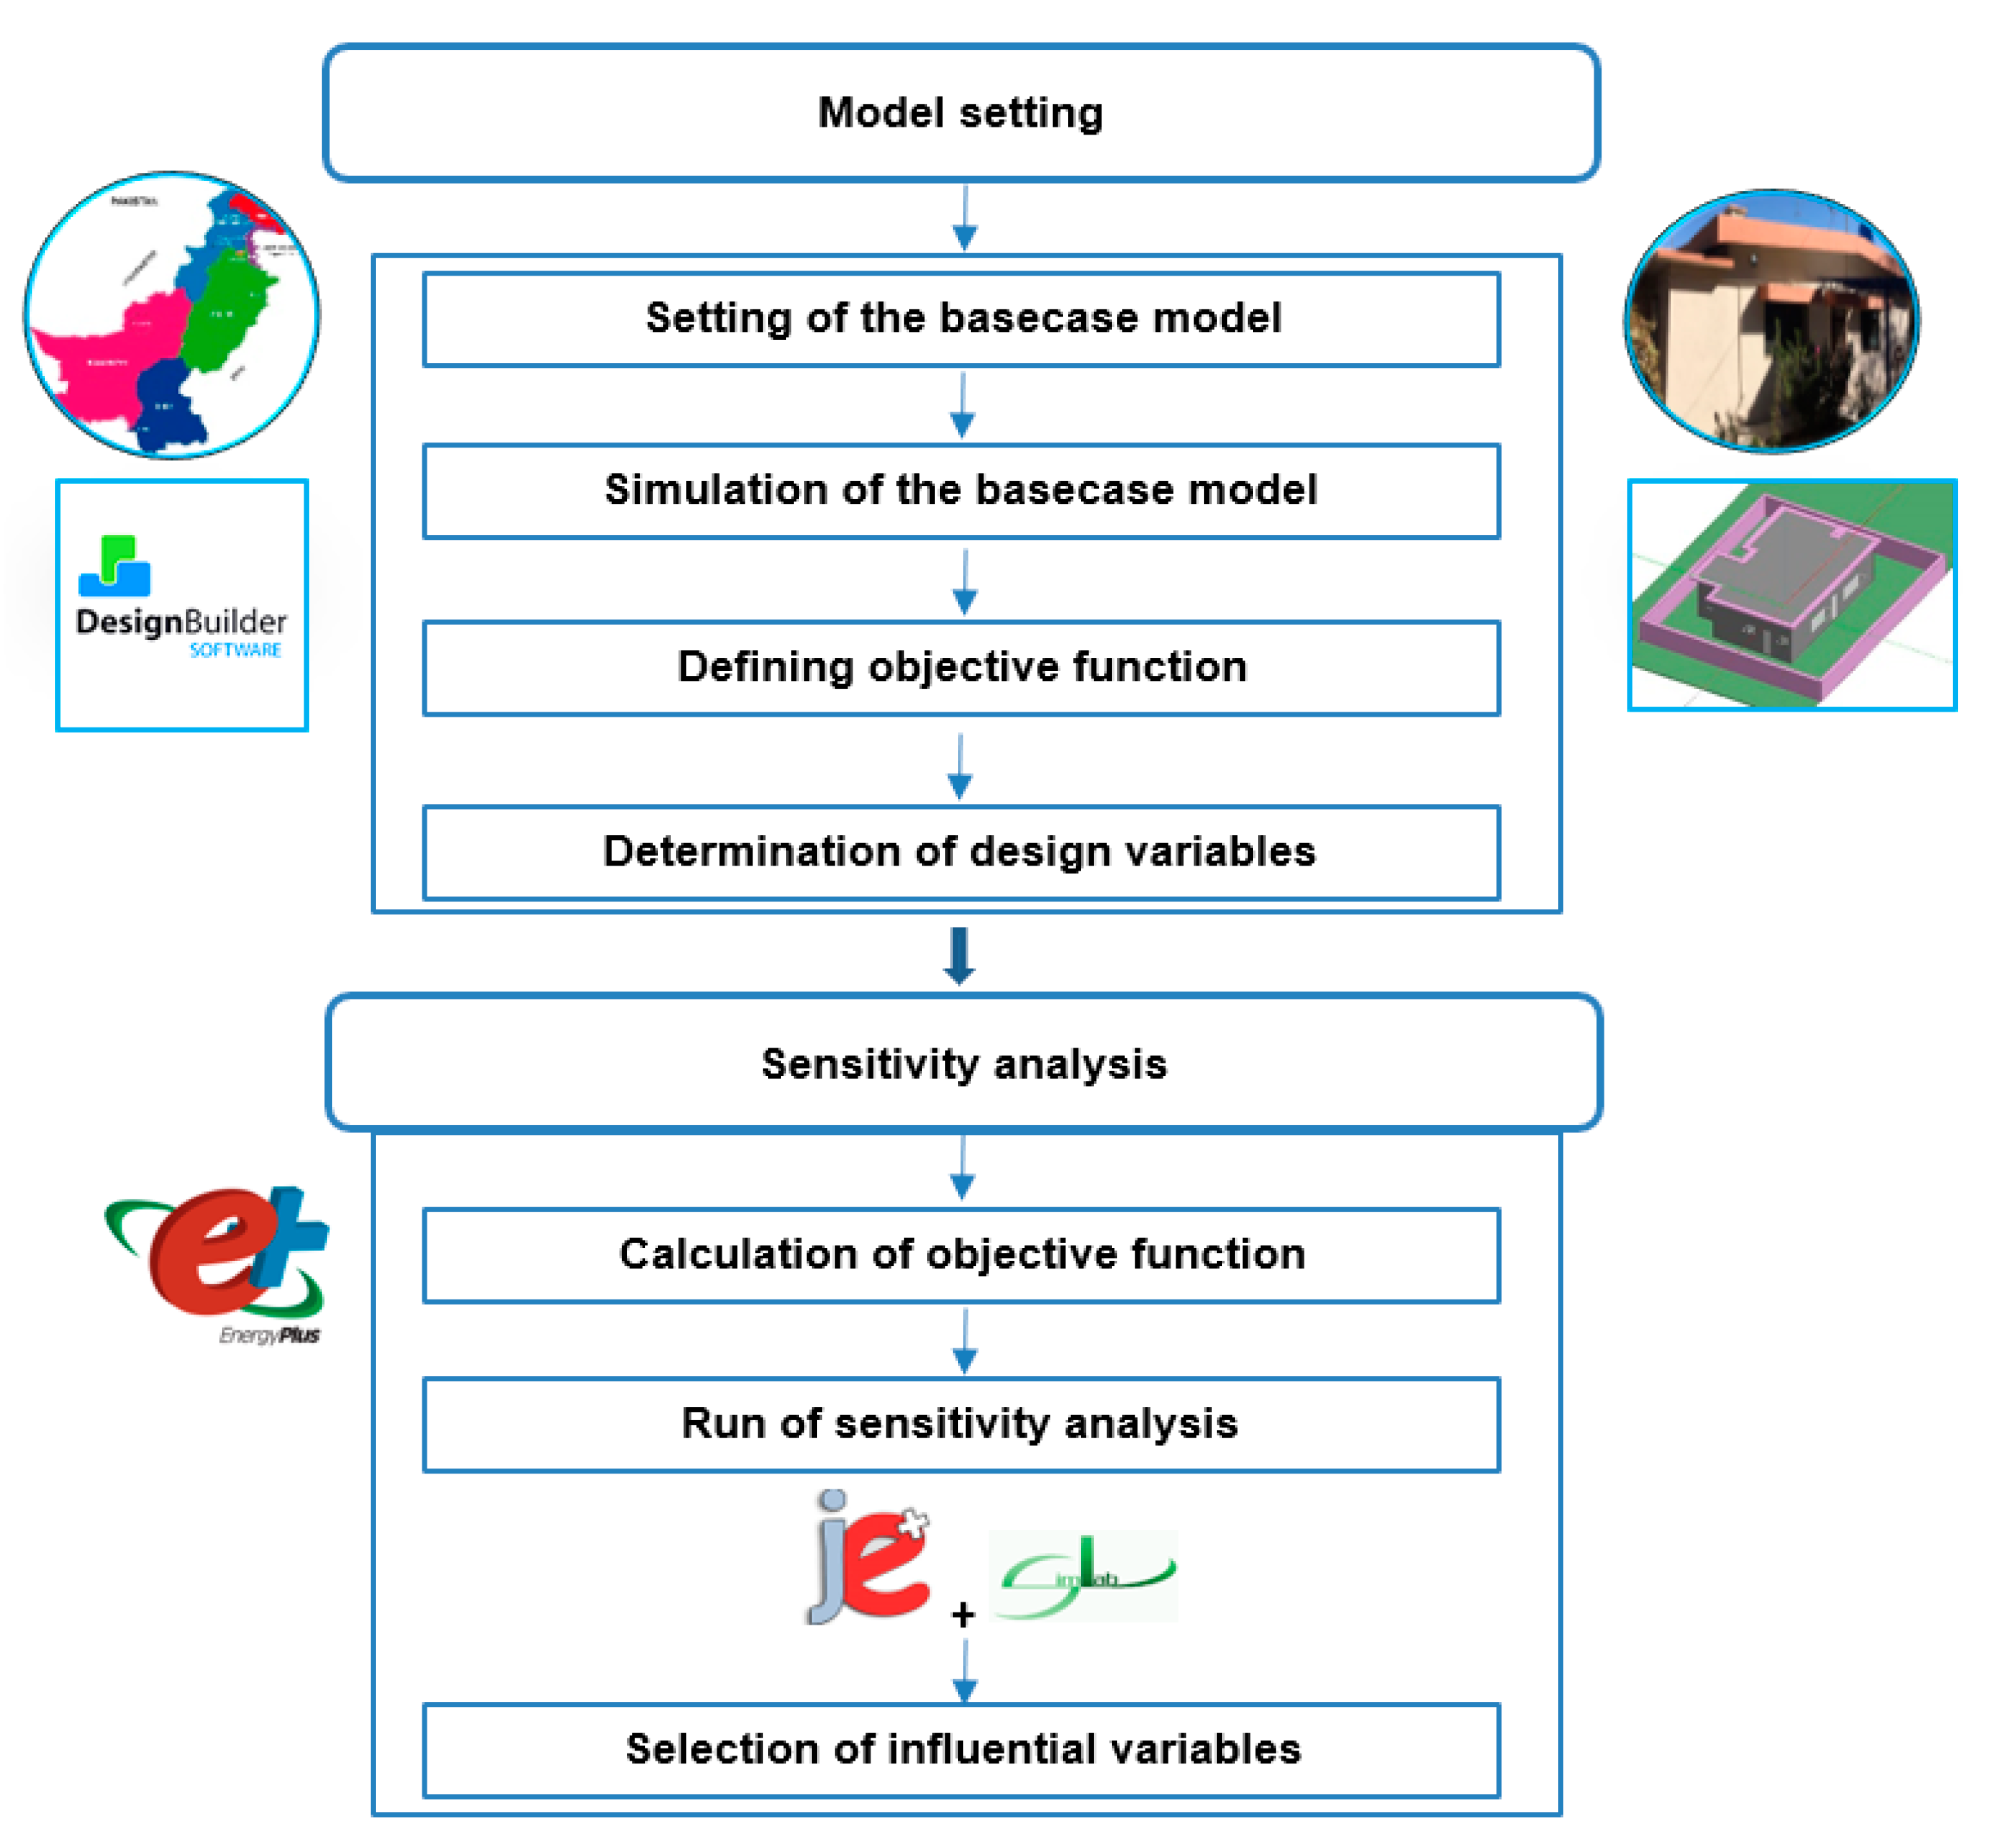
2. Methodology
2.1. Model Setting
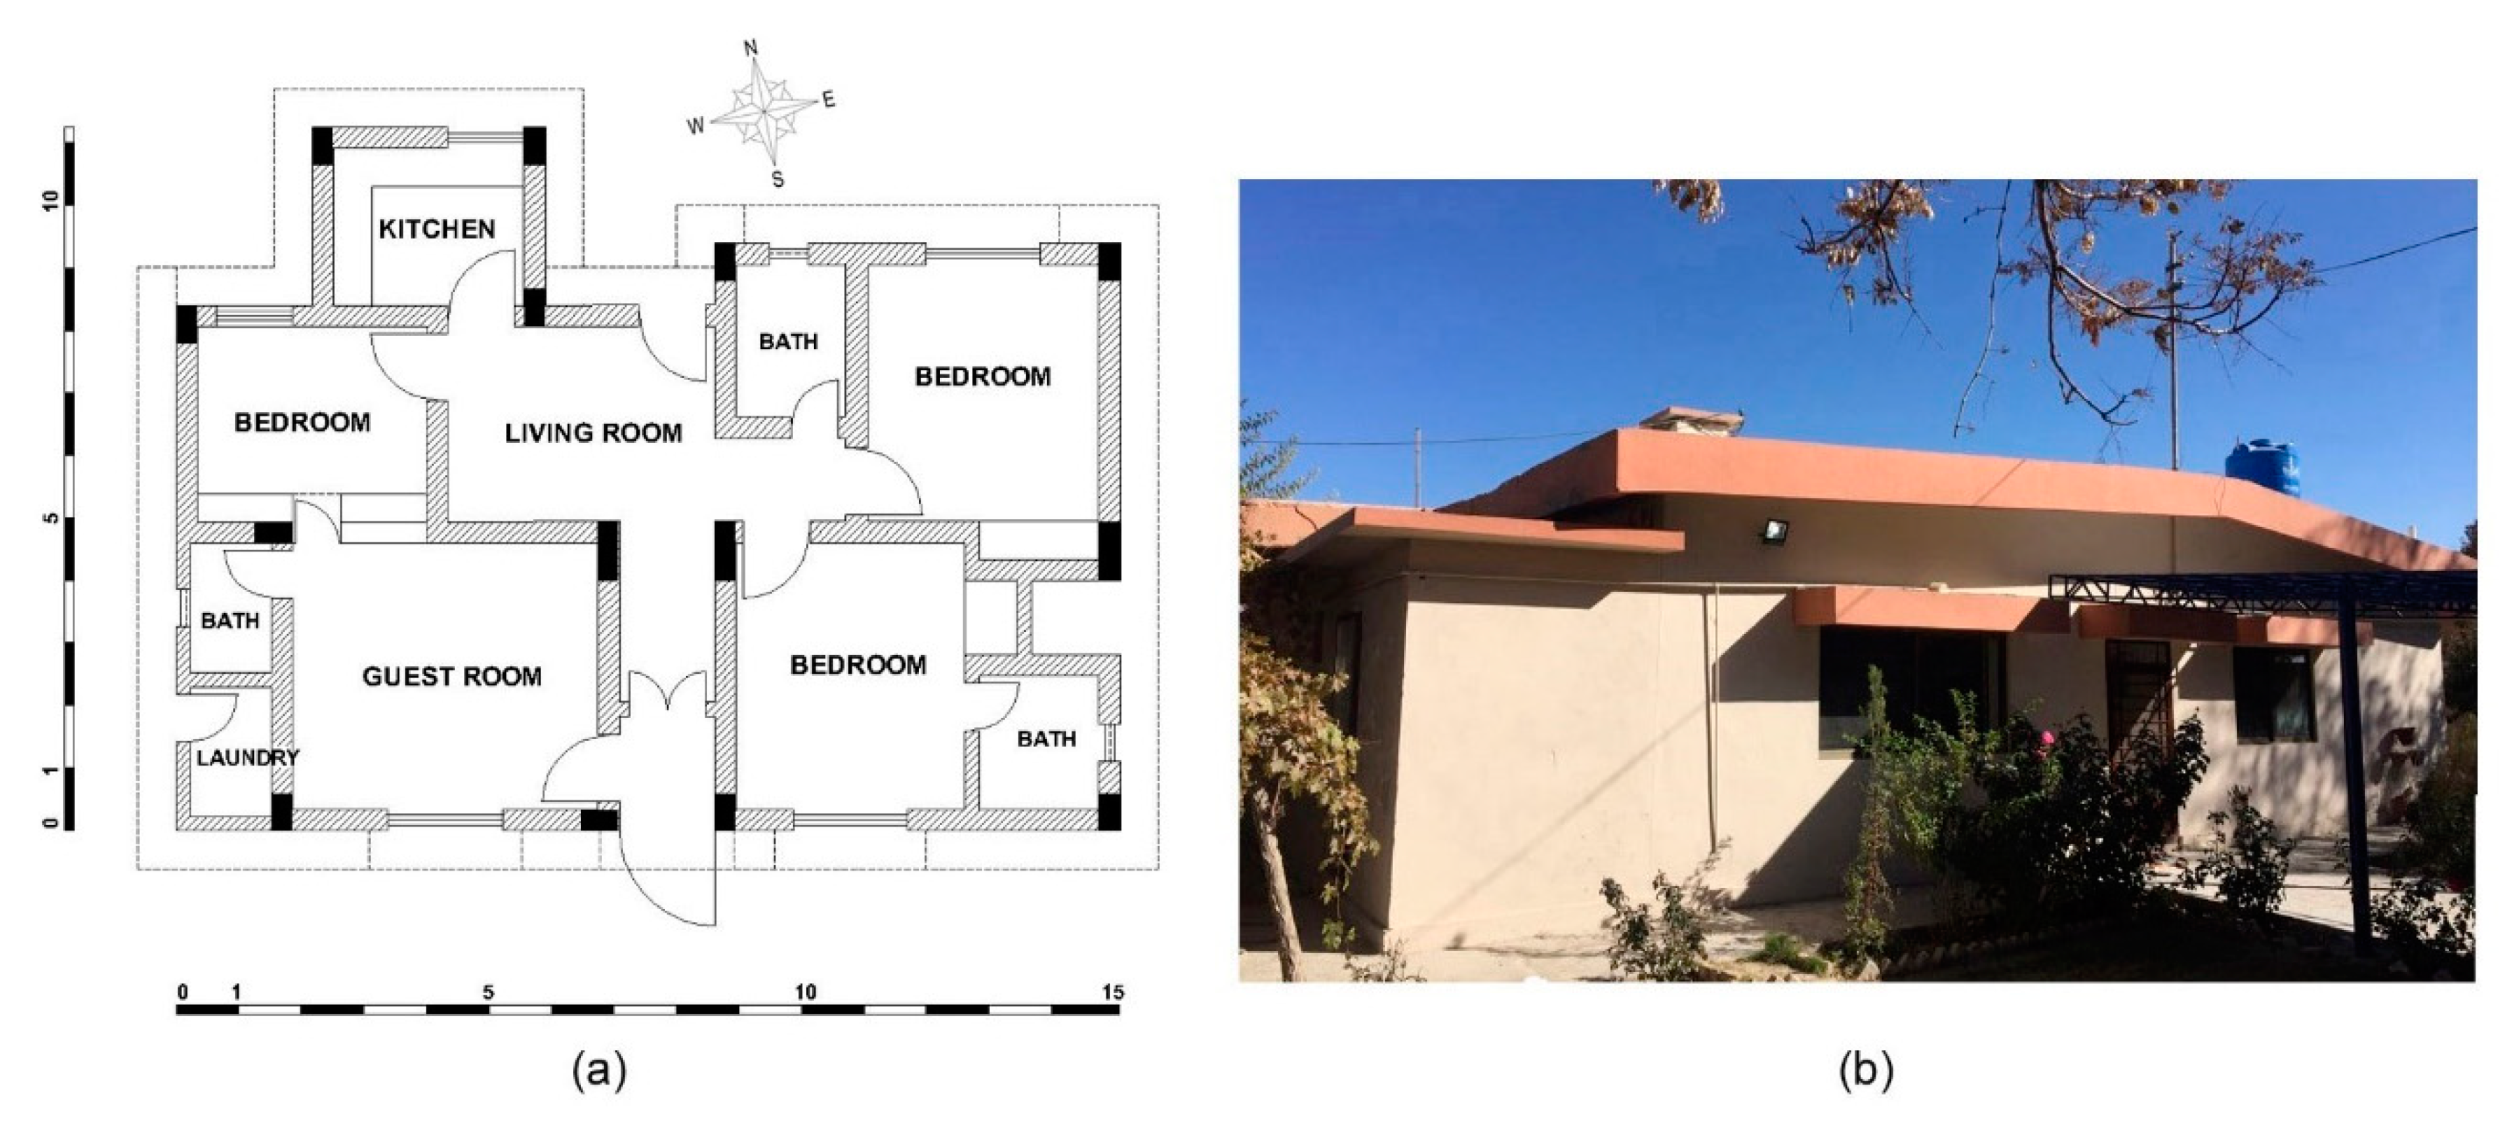
2.1.1. Setting of the Basecase Model
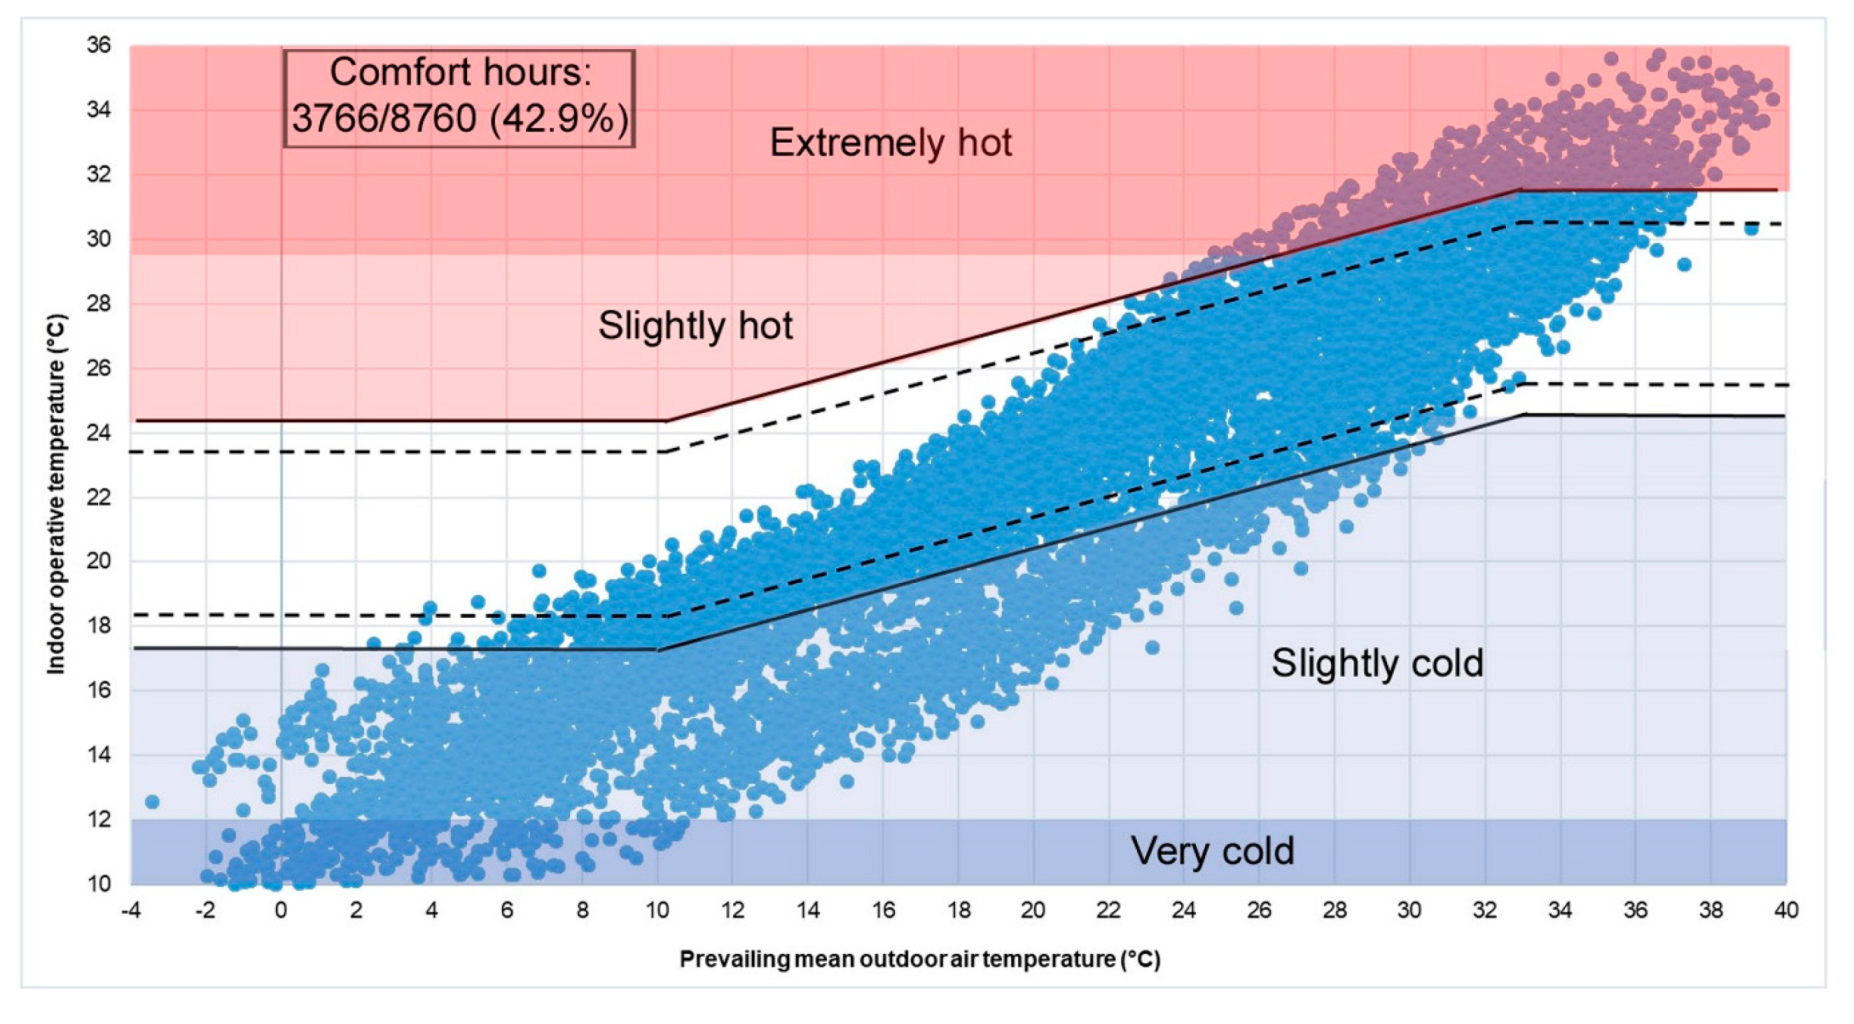
2.1.2. Simulation of the Basecase Model
2.1.3. Defining Objective Function
2.1.4. Determination of Design Variables
2.2. Sensitivity Analysis
2.2.1. Calculation of Objective Function
2.2.2. Run of Sensitivity Analysis
2.2.3. Selection of Influential Design Variables
3. Results
3.1. Sensitivity Analysis
3.1.1. Calculation of Objective Function
3.1.2. Run of Sensitivity Analysis
3.1.3. Selection of Influential Design Variables
4. Discussion
4.1. Main Findings and Recommendations
- Thermal control using insulation of walls, roof, and floor, and high thermal mass of walls are recommended. The average insulation thickness of 60 mm for walls, roof, and floor is essential to provide thermal control. It will reduce the U-values of walls (1.43 W/m2 K to 0.45 W/m2 K), roof (2.9 W/m2 K to 0.54 W/m2 K), and floor (1.5 W/m2 K to 0.46 W/m2 K), respectively. The thickness of 0.6 m is recommended for walls. It will decrease the U-value of the existing external walls from 1.43 W/m2 K to 0.9 W/m2 K.
- Use of single-glazed windows is very common in Quetta. In recent years, double-glazed windows were introduced in the local market. The U-value of existing single-glazed clear glass windows is 5.7 W/m2 K, with light transmission (LT) 0.88, and solar heat gain coefficient (SHGC) of 0.81. It can be reduced to the U-Value = 1.7 W/m2 K, with LT 0.76, and SHGC 0.59 by using low emissivity double-glazed windows.
- In practice, overhang is used on the doors and windows of houses in Quetta for solar control. These overhangs can also limit the solar heat gain and light in winter. It is recommended to design adjustable, flexible shading devices which can be beneficial in both summer and winter.
- In a cold climate, passive solar heating is recommended to achieve more comfort in winter. The long axes of buildings in Quetta should be placed to the southern direction (at 180°, assuming north is located at 0°) to get the maximum benefit of solar light and heat gain. For natural ventilation, the placement of windows and their size are important. Natural ventilation can improve indoor thermal comfort at night in summer. On average, five to six air changes per hour (ac/h) are recommended for bedrooms and living room.
4.2. Strengths and Limitations of the Study
4.3. Study Implications and Future Research
5. Conclusions
- (1)
- The passive design principles such as thermal control, passive solar heating, solar control, and passive cooling are important in the climate of Quetta. The thermal insulation of walls, roof, and floor is essential to improve comfort. High thermal mass, passive solar heating, shading devices, natural ventilation, and use of low emissivity double-glazed windows is recommended for the construction of houses in Quetta.
- (2)
- There is a need for education and awareness of comfort, energy efficiency, passive design solutions, and construction techniques that can be adopted in Quetta. The training of labour and the workforce is recommended to build future houses that provide more comfort using less energy.
- (3)
- It is recommended to explore the existing building materials and to identify the suitable materials to achieve indoor thermal comfort.
- (4)
- There is a need for research at the national and local level to manufacture advanced, energy efficient building construction materials at low cost.
Author Contributions
Funding
Acknowledgments
Conflicts of Interest
Nomenclature
| ANSI | American national standard institute |
| Arg | Argon |
| ASHRAE | American society of heating, refrigeration, and air conditioning engineers |
| BRI | Belt and Road Initiative |
| CDD | Cooling degree days |
| CH | Comfort hours |
| CV(RMSE) | Coefficient of variation of root square mean error |
| DHW | Domestic hot water |
| EPS | Expanded polystyrene |
| EW | Exterior wall |
| F | Floor |
| HDD | Heating degree days |
| LHS | Latin hypercube sampling |
| LoE | Low emissivity |
| LT | Light transmission |
| MCA | Monte carlo analysis |
| MW | Mineral wool |
| NMBE | Normalised mean bias error |
| NNW | North north-west |
| PCC | Partial correlation coefficient |
| PMV | Predicted mean vote |
| PVC | Polyvinyl chloride |
| R | Roof |
| RCC | Reinforced concrete cement |
| RCF | Reinforced concrete frame |
| SHGC | Solar heat gain coefficient |
| SRC | Standard regression coefficient |
| SSE | South south-east |
| TMY | Typical meteorological year |
| UPVC | Unplasticized polyvinyl chloride |
| W | Window |
| WF | Window frame |
| WS | Window shading |
| WWR | Window-to-wall ratio |
References
- Growth of Asia and Africa Urban Population European Commission 2020. Available online: https://ec.europa.eu/knowledge4policy/foresight/topic/continuing-urbanisation/growth-asia-africa-urban-population_en (accessed on 7 January 2020).
- Kugelman, M. Urbanisation in Pakistan: Causes and Consequences; Norwegian Peacebuilding Resource Centre: Oslo, Norway, 2013. [Google Scholar]
- United Nations. Department of Economic and Social Affairs, and Population Division. In World Urbanization Prospects: The 2018 Revision; United Nations: New York, NY, USA, 2019. [Google Scholar]
- Mengal, S. Problems of urbanization in Quetta city: An urban geography perspective. Pak. Geogr. Rev. 2018, 73, 25–34. [Google Scholar]
- Bolay, J.-C.; Eléonore, L.; Loan, N.T.; Lan, N.H.M. Local Sustainable Development Indicators and Urbanization in Vietnam, What Are the Good Questions? The Case of the City of Chau Doc in the Mekong Delta. Curr. Urban Stud. 2019, 7, 598–636. [Google Scholar] [CrossRef][Green Version]
- Population & Housing Census; Pakistan Bureau of Statistics (PBS), Government of Pakistan: Islamabad, Pakistan, 2017.
- Amber, K.P.; Aslam, M.W.; Ikram, F.; Kousar, A.; Ali, H.M.; Akram, N.; Afzal, K.; Mushtaq, H. Heating and Cooling Degree-Days Maps of Pakistan. Energies 2018, 11, 94. [Google Scholar] [CrossRef]
- Quetta Historical Temperature Data Pakistan Meteorological Department. 2019. Available online: http://www.pmd.gov.pk/cdpc/extrems/QUETTA.htm (accessed on 27 May 2019).
- Quetta District Development Profile; Planning & Development Department, Government of Balochistan: Quetta, Pakistan, 2011.
- Cheng, L.K. Three questions on China’s “Belt and Road Initiative”. China Econ. Rev. 2016, 40, 309–313. [Google Scholar] [CrossRef]
- Pakistan’s Urbanization: A Challenge of Great Proportions. Available online: https://en.haberler.com/pakistan-s-urbanization-a-challenge-of-great-618870/?utm_source=facebook&utm_campaign=tavsiye_et (accessed on 7 January 2020).
- Tabb, P. Solar Energy Planning: A Guide to Residential Settlement, 1st ed.; McGraw-Hill: New York, NY, USA, 1984. [Google Scholar]
- Molinar-Ruiz, A. Cold-Arid Deserts: Global Vernacular Framework for Passive Architectural Design. Ph.D. Thesis, University of Hawaii at Manoa, Honolulu, HI, USA, 2017. [Google Scholar]
- Huang, L.; Hamza, N.; Lan, B.; Zahi, D. Climate-responsive design of traditional dwellings in the cold-arid regions of Tibet and a field investigation of indoor environments in winter. Energy Build. 2016, 128, 697–712. [Google Scholar] [CrossRef]
- Upadhyay, A.K.; Yoshida, H.; Rijal, H.B. Climate Responsive Building Design in the Kathmandu Valley. J. Asian Archit. Build. Eng. 2006, 5, 169–176. [Google Scholar] [CrossRef]
- Pourvahidi, P.; Ozdeniz, M.B. Bioclimatic analysis of Iranian climate for energy conservation in architecture. SRE 2013, 8, 6–16. [Google Scholar] [CrossRef]
- Roshan, G.R.; Farrokhzad, M.; Attia, S. Defining thermal comfort boundaries for heating and cooling demand estimation in Iran’s urban settlements. Build. Environ. 2017, 121, 168–189. [Google Scholar] [CrossRef]
- Roshan, G.; Oji, R.; Attia, S. Projecting the impact of climate change on design recommendations for residential buildings in Iran. Build. Environ. 2019, 155, 283–297. [Google Scholar] [CrossRef]
- Bahria, S.; Amirat, M.; Hamidat, A.; El Ganaoui, M. Parametric study of solar heating and cooling systems in different climates of Algeria—A comparison between conventional and high-energy-performance buildings. Energy 2016, 113, 521–535. [Google Scholar] [CrossRef]
- Monge-Barrio, A.; Sánchez-Ostiz, A. Energy efficiency and thermal behaviour of attached sunspaces, in the residential architecture in Spain. Summer Conditions. Energy Build. 2015, 108, 244–256. [Google Scholar] [CrossRef]
- Ameur, M.; Kharbouch, Y.; Mimet, A. Optimization of passive design features for a naturally ventilated residential building according to the bioclimatic architecture concept and considering the northern Morocco climate. Build. Simul. 2020. [Google Scholar] [CrossRef]
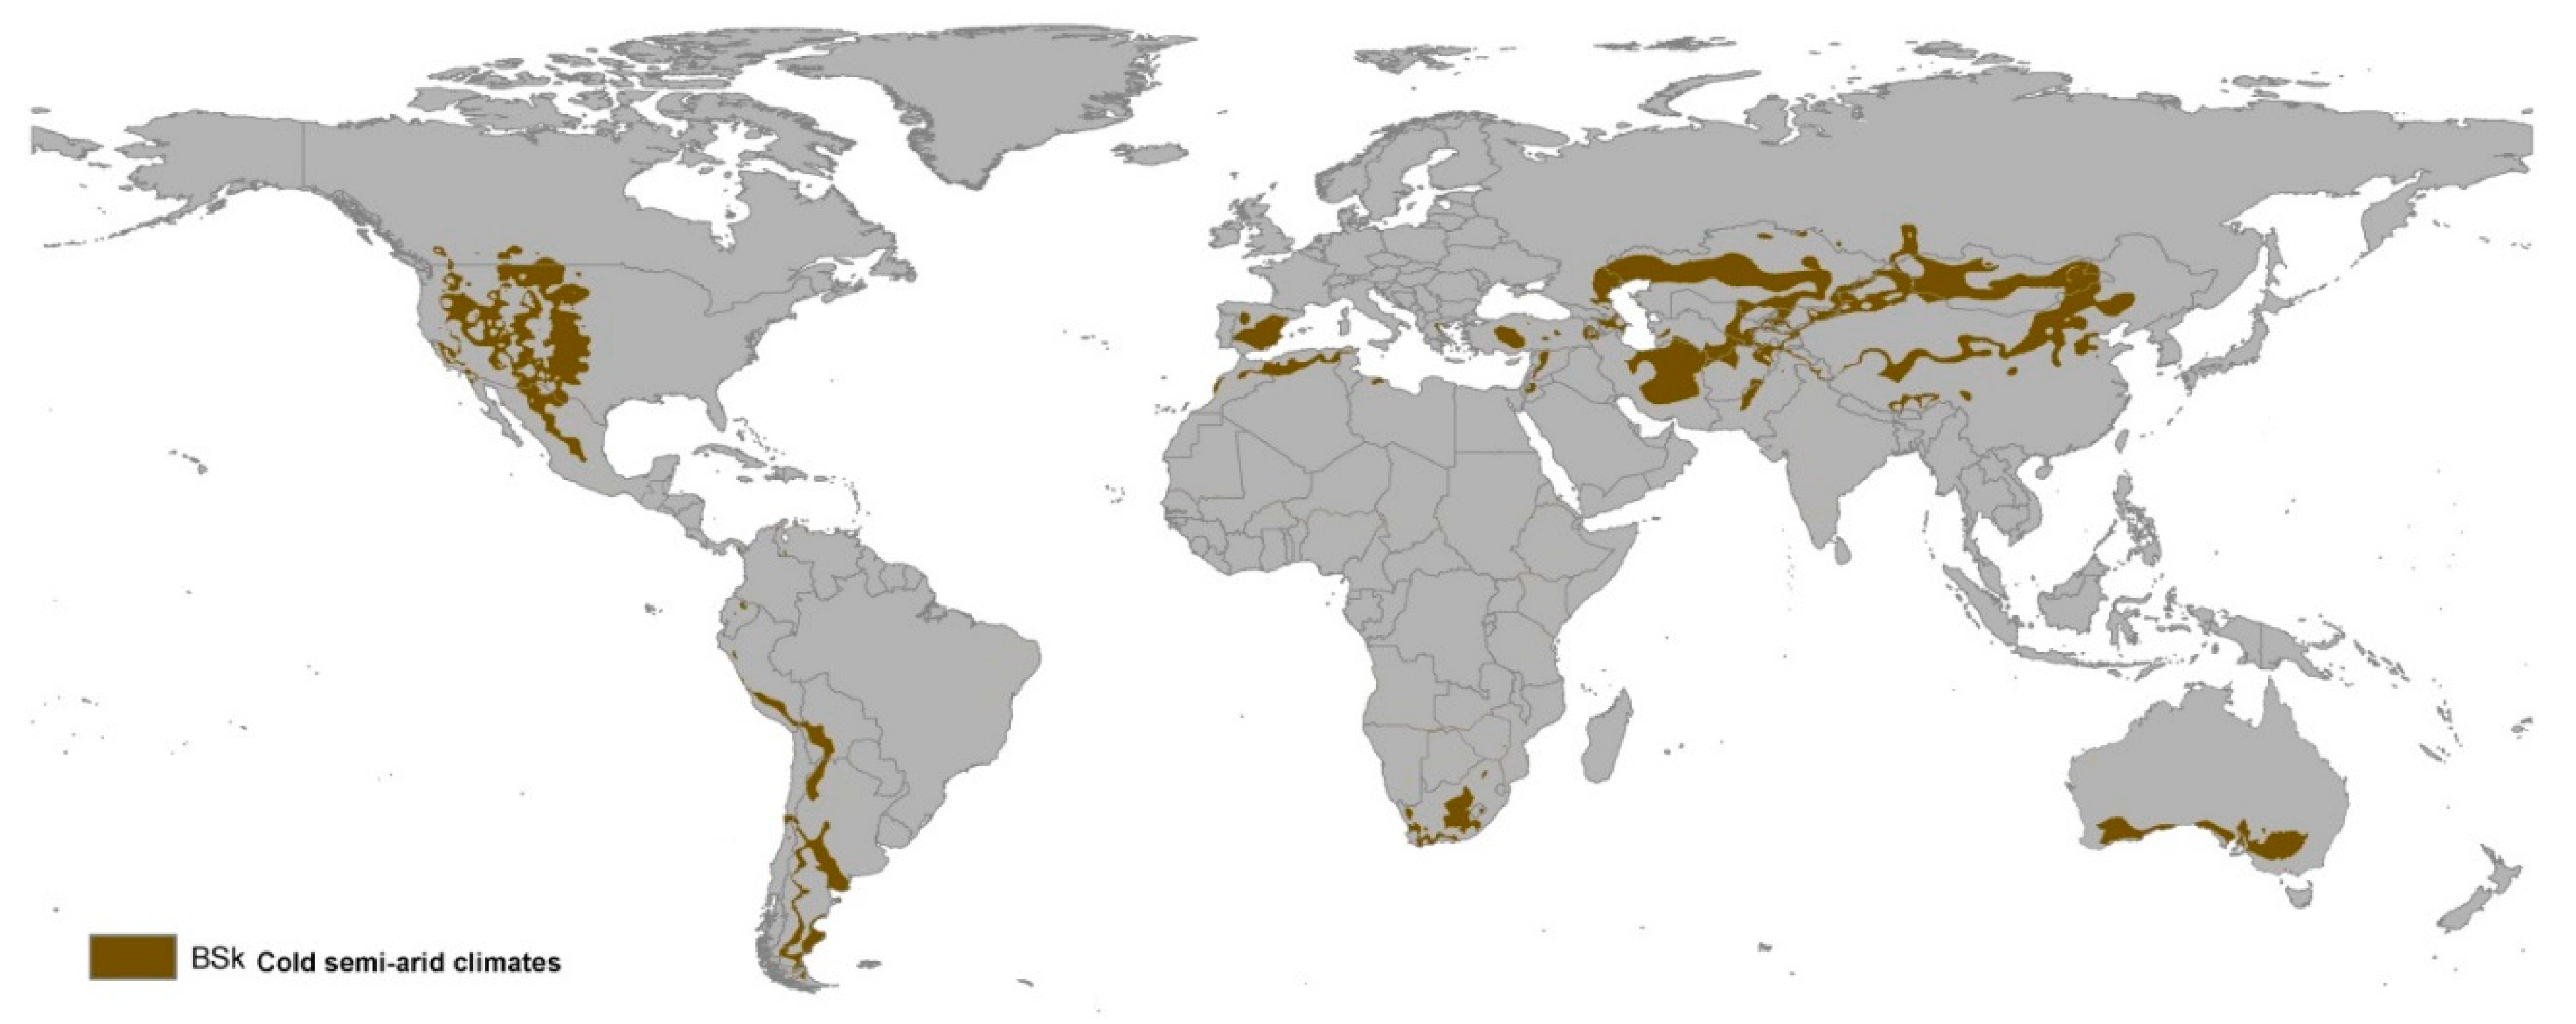
- Köppen, W. Koppen World Map of BSh and BSk Climates. Wikimedia. 2019. Available online: https://upload.wikimedia.org/wikipedia/commons/1/1a/Koppen_World_Map_BSh_BSk.png (accessed on 7 January 2020).
- Mahar, W.A.; Verbeeck, G.; Singh, M.K.; Attia, S. An Investigation of Thermal Comfort of Houses in Dry and Semi-Arid Climates of Quetta, Pakistan. Sustainability 2019, 11, 5203. [Google Scholar] [CrossRef]
- Lomas, K.J.; Eppel, H. Sensitivity analysis techniques for building thermal simulation programs. Energy Build. 1992, 19, 21–44. [Google Scholar] [CrossRef]
- Saltelli, A. Global Sensitivity Analysis: An Introduction. In Sensitivity Analysis of Model Output; Las Alamos National Laboratory Research Library: Santa Fe, NM, USA, 2004; pp. 27–43. [Google Scholar]
- Nguyen, A.T.; Reiter, S. A performance comparison of sensitivity analysis methods for building energy models. Building Simul. 2015, 8, 651–664. [Google Scholar] [CrossRef]
- Gustafsson, S.-I. Sensitivity analysis of building energy retrofits. Appl. Energy 1998, 61, 13–23. [Google Scholar] [CrossRef]
- Lam, J.C.; Wan, K.K.W.; Yang, L. Sensitivity analysis and energy conservation measures implications. Energy Convers. Manag. 2008, 49, 3170–3177. [Google Scholar] [CrossRef]
- Heiselberg, P.; Brohus, H.; Hesselholt, A.; Rasmussen, H.; Seinre, E.; Thomas, S. Application of sensitivity analysis in design of sustainable buildings. Renew. Energy 2009, 34, 2030–2036. [Google Scholar] [CrossRef]
- Breesch, H.; Janssens, A. Performance evaluation of passive cooling in office buildings based on uncertainty and sensitivity analysis. Solar Energy 2010, 84, 1453–1467. [Google Scholar] [CrossRef]
- Tian, W.; de Wilde, P. Uncertainty and sensitivity analysis of building performance using probabilistic climate projections: A UK case study. Autom. Constr. 2011, 20, 1096–1109. [Google Scholar] [CrossRef]
- Yildiz, Y.; Korkmaz, K.; Özbalta, T.G.; Arsan, Z.D. An approach for developing sensitive design parameter guidelines to reduce the energy requirements of low-rise apartment buildings. Appl. Energy 2012, 93, 337–347. [Google Scholar] [CrossRef]
- Attia, S.; Gratia, E.; de Herde, A.; Hensen, J.L.M. Simulation-based decision support tool for early stages of zero-energy building design. Energy Build. 2012, 49, 2–15. [Google Scholar] [CrossRef]
- Huang, K.-T.; Hwang, R.-L. Future trends of residential building cooling energy and passive adaptation measures to counteract climate change: The case of Taiwan. Appl. Energy 2016, 184, 1230–1240. [Google Scholar] [CrossRef]
- Bre, F.; Silva, A.S.; Ghisi, E.; Fachinotti, V.D. Residential building design optimisation using sensitivity analysis and genetic algorithm. Energy Build. 2016, 133, 853–866. [Google Scholar] [CrossRef]
- Ascione, F.; Bianco, N.; Stasio, C.D.; Mauro, G.M.; Vanoli, G.P. Addressing Large-Scale Energy Retrofit of a Building Stock via Representative Building Samples: Public and Private Perspectives. Sustainability 2017, 9, 940. [Google Scholar] [CrossRef]
- Chen, X.; Yang, H.; Wang, Y. Parametric study of passive design strategies for high-rise residential buildings in hot and humid climates: Miscellaneous impact factors. Renew. Sustain. Energy Rev. 2017, 69, 442–460. [Google Scholar] [CrossRef]
- Attia, S.; de Herde, A.; Gratia, E.; Hensen, J.L.M. Achieving informed decision-making for net zero energy buildings design using building performance simulation tools. Build. Simul. 2013, 6, 3–21. [Google Scholar] [CrossRef]
- Østergård, T.; Jensen, R.L.; Maagaard, S.E. Early Building Design: Informed decision-making by exploring multidimensional design space using sensitivity analysis. Energy Build. 2017, 142, 8–22. [Google Scholar] [CrossRef]
- Hygh, J.S.; DeCarolis, J.F.; Hill, D.B.; Ranjithan, S.R. Multivariate regression as an energy assessment tool in early building design. Build. Environ. 2012, 57, 165–175. [Google Scholar] [CrossRef]
- Samuelson, H.; Claussnitzer, S.; Goyal, A.; Chen, Y.; Romo-Castillo, A. Parametric energy simulation in early design: High-rise residential buildings in urban contexts. Build. Environ. 2016, 101, 19–31. [Google Scholar] [CrossRef]
- Østergård, T.; Jensen, R.L.; Maagaard, S.E. Building simulations supporting decision making in early design—A review. Renew. Sustain. Energy Rev. 2016, 61, 187–201. [Google Scholar] [CrossRef]
- DeKay, M.; Brown, G.Z. Sun, Wind, and Light: Architectural Design Strategies, 3rd ed.; John Wiley & Sons: Hoboken, NJ, USA, 2014. [Google Scholar]
- Mahar, W.A.; Knapen, E.; Verbeeck, G. Methodology to determine housing characteristics in less developed areas in developing countries: A case study of Quetta, Pakistan. In Proceedings of the European Network for Housing Research (ENHR) Annual Conference 2017, Tirana, Albania, 4–6 September 2017. [Google Scholar]
- Mahar, W.A.; Attia, S. An Overview of Housing Conditions, Characteristics and Existing Infrastructure of Energy, Water & Waste Systems in Quetta, Pakistan; Sustainable Building Design (SBD) Lab, University of Liège: Liège, Belgium, 2018. [Google Scholar]
- Nguyen, A.T.; Reiter, S. An investigation on thermal performance of a low-cost apartment in hot humid climate of Danang. Energy Build. 2012, 47, 237–246. [Google Scholar] [CrossRef]
- Fabrizio, E.; Monetti, V. Methodologies and Advancements in the Calibration of Building Energy Models. Energies 2015, 8, 2548–2574. [Google Scholar] [CrossRef]
- Semahi, S.; Zemmouri, N.; Singh, M.K.; Attia, S. Comparative bioclimatic approach for comfort and passive heating and cooling strategies in Algeria. Build. Environ. 2019, 161, 106271. [Google Scholar] [CrossRef]
- Fanger, P.O. Thermal Comfort: Analysis and Applications in Environmental Engineering; Danish Technical Press: Copenhagen, Denmark, 1970. [Google Scholar]
- Energy Performance of Buildings—Ventilation for Buildings; EN 16798-1: 2019; European Commission for Standardization: Brussels, Belgium, 2019.
- Givoni, B. Man, Climate and Architecture; Elsevier: Amsterdam, The Netherlands, 1969. [Google Scholar]
- Thermal Environmental Conditions for Human Occupancy; ANSI/ASHRAE Standard 55-2017; ASHRAE: Atlanta, GA, USA, 2017.
- Mahar, W.A.; Anwar, N.U.R.; Attia, S. Building energy efficiency policies and practices in Pakistan: A literature review. In AIP Conference Series; American Institute of Physics: New York, NY, USA, 2019; Volume 2119, p. 020005. [Google Scholar] [CrossRef]
- Mahar, W.A.; Attia, S. Indoor Thermal Comfort in Residential Building Stock: A Study of RCC Houses in Quetta, Pakistan; Sustainable Building Design (SBD) Lab, University of Liège: Liège, Belgium, 2018. [Google Scholar]
- Mahar, W.A.; Amer, M.; Attia, S. Indoor thermal comfort assessment of residential building stock in Quetta, Pakistan. In Proceedings of the European Network for Housing Research (ENHR) Annual Conference 2018, Uppsala, Sweden, 27–28 June 2018. [Google Scholar]
- Simulation Environment for Uncertainity and Sensitivity Analysis; SimLab Version 2.2; Joint Reseacrh Centre of the European Commission: Ispra, Italy, 2004.
- Carlucci, S.; Bai, L.; de Dear, R.; Yang, L. Review of adaptive thermal comfort models in built environmental regulatory documents. Build. Environ. 2018, 137, 73–89. [Google Scholar] [CrossRef]
- Tian, W. A review of sensitivity analysis methods in building energy analysis. Renew. Sustain. Energy Rev. 2013, 20, 411–419. [Google Scholar] [CrossRef]
- Mara, T.A.; Tarantola, S. Application of global sensitivity analysis of model output to building thermal simulations. Build. Simul. 2008, 1, 290–302. [Google Scholar] [CrossRef]
- Christian, J.T. Geotechnical Engineering Reliability: How Well Do We Know What We Are Doing? J. Geotech. Geoenviron. Eng. 2004, 130, 985–1003. [Google Scholar] [CrossRef]
- Yıldız, Y.; Arsan, Z.D. Identification of the building parameters that influence heating and cooling energy loads for apartment buildings in hot-humid climates. Energy 2011, 36, 4287–4296. [Google Scholar] [CrossRef]
- Ioannou, A.; Itard, L.C.M. Energy performance and comfort in residential buildings: Sensitivity for building parameters and occupancy. Energy Build. 2015, 92, 216–233. [Google Scholar] [CrossRef]
- Belleri, A.; Lollini, R.; Dutton, S.M. Natural ventilation design: An analysis of predicted and measured performance. Build. Environ. 2014, 81, 123–138. [Google Scholar] [CrossRef]
- Rodríguez, G.C.; Andrés, A.C.; Muñoz, F.D.; López, J.M.C.; Zhang, Y. Uncertainties and sensitivity analysis in building energy simulation using macroparameters. Energy Build. 2013, 67, 79–87. [Google Scholar] [CrossRef]
- Domínguez-Muñoz, F.; Cejudo-López, J.M.; Carrillo-Andrés, A. Uncertainty in peak cooling load calculations. Energy Build. 2010, 42, 1010–1018. [Google Scholar] [CrossRef]
- Building Code of Pakistan (Energy Provisions-2011); Pakistan Engineering Council (PEC) & National Energy Conservation Centre (ENERCON), Ministry of Housing & Works: Islamabad, Pakistan, 2011.
- Pakistan Economic Survey 2018–2019; Ministry of Finance, Government of Pakistan: Islamabad, Pakistan, 2019.
- Tian, Z.; Zhang, X.; Jin, X.; Zhou, X.; Si, B.; Shi, X. Towards adoption of building energy simulation and optimization for passive building design: A survey and a review. Energy Build. 2018, 158, 1306–1316. [Google Scholar] [CrossRef]


| S. No | Building Element | Outermost to Innermost | Building Element Composition | Thickness (cm) | Conductivity (W/m K) | Density (kg/m3) | Specific Heat Capacity (J/kg K) |
|---|---|---|---|---|---|---|---|
| Ep | λ | D | Cp | ||||
| 1 | Walls | Layer 1 | Plaster | 0.95 | 0.431 | 1250 | 1088 |
| Layer 2 | Brick | 22.86 | 0.711 | 2000 | 836 | ||
| Layer 3 | Plaster | 0.95 | 0.431 | 1250 | 1088 | ||
| 2 | Roof | Layer 1 | Plaster | 0.95 | 0.38 | 1150 | 840 |
| Layer 2 | Bitumen | 0.95 | 0.5 | 1700 | 1000 | ||
| Layer 3 | RCC slab | 10.16 | 0.753 | 2300 | 665.9 | ||
| Layer 4 | Plaster | 0.95 | 0.38 | 1150 | 840 | ||
| 3 | Floor | Layer 1 | Cement | 0.95 | 0.72 | 1650 | 920 |
| Layer 2 | Mortar | 5.08 | 0.753 | 2000 | 656 | ||
| Layer 3 | Concrete | 7.62 | 1.8 | 2240 | 840 | ||
| Layer 4 | Aggregate | 10.16 | 1.74 | 2240 | 840 | ||
| Layer 5 | Sand | 22.86 | 0.837 | 1300 | 1046 | ||
| Earth/Soil | |||||||
| 4 | Windows | Layer 1 | Single-glazed with clear glass | 0.63 | 1.046 | 2300 | 836.8 |
| Aspects | Description | |
|---|---|---|
| Location | Quetta, Pakistan | |
| Orientation | The long axis of the building is oriented to South | |
| Building storeys | 1 | |
| Height | 3 m | |
| Dimension | 15 m × 11.2 m | |
| Floor area | 112.6 m2 | |
| Opaque envelope | Exterior walls | U-value = 1.4 (W/m2 K) |
| Roof | U-value = 2.9 (W/m2 K) | |
| Floor | U-value = 1.8 (W/m2 K) | |
| Windows | Single-glazed | U-value = 5.7 (W/m2 K) |
| WWR (%) | 8.08S, 10.1N, 0.9EW | |
| SHGC | 0.81 | |
| Heating and ventilation | Heating system | Radiant gas heaters (individual units) |
| Airflow | 0.3 m/s | |
| Air tightness | 2.5 | |
| DHW | Period 1 (October-March) | 3.5 (L/m2/day) |
| Period 2 (April-September) | 1.2 (L/m2/day) | |
| Occupancy | Household size | 8 persons |
| Density | 0.07 (person/m2) | |
| Consumption | Average annual energy use | 49 kWh/m2 |
| Clothing/activity | Summer | 0.4 clo |
| Winter | 0.7 clo | |
| Metabolism level | 0.9 | |
| Category | Design Variables | Unit | Variable Names | Variable Types | Min. and Max. Values | Variation Step | Basecase Values |
|---|---|---|---|---|---|---|---|
| Building orientation | Long axis azimuth | (°) | X1 | Continuous uniform | (0, 315) | 45 | 180° |
| Building envelope | External walls construction | - | X2 | Discrete | [EW1, EW5] | Table 4 | Table 1 |
| Roof construction | - | X3 | Discrete | [R1, R6] | Table 5 | Table 1 | |
| Floor construction | - | X4 | Discrete | [F1, F5] | Table 6 | Table 1 | |
| Thermal insulation | Insulation type of external walls | - | X5 | Discrete | [I1, I4] | Table 7 | - |
| Insulation type of roof | - | X6 | Discrete | [I1, I4] | Table 7 | - | |
| Insulation type of floor | - | X7 | Discrete | [I1, I4] | Table 7 | - | |
| Insulation thickness of walls | (m) | X8 | Continuous uniform | [0, 0.06] | 0.02 | - | |
| Insulation thickness of roof | (m) | X9 | Continuous uniform | [0, 0.06] | 0.02 | - | |
| Insulation thickness of floor | (m) | X10 | Continuous uniform | [0, 0.06] | 0.02 | - | |
| Thermal mass | Thickness of walls | (m) | X11 | Continuous uniform | [0.15, 0.45] | 0.05 | 0.22 |
| Thickness of roof | (m) | X12 | Continuous uniform | [0.1, 0.25] | 0.05 | 0.15 | |
| Thickness of floor | (m) | X13 | Continuous uniform | [0.1, 0.25] | 0.05 | 0.15 | |
| Windows | WWR | (%) | X14 | Continuous uniform | [10, 70] | - | 15 |
| Window frame | - | X15 | Discrete | [WF1, WF4] | Table 8 | Aluminium | |
| Window shading (overhang) | (m) | X16 | Discrete | [0, 0.15] | 0.5 | 0.5 | |
| Window opening | (%) | X17 | Continuous uniform | [0, 100] | - | 50% | |
| Glazing type | - | X18 | Discrete | [W1, W10] | Table 9 | Single glazed | |
| Heating and ventilation | Cooling setpoint | (°C) | X19 | Continuous uniform | [25, 28] | - | - |
| Heating setpoint | (°C) | X20 | Continuous uniform | [19, 22] | - | - | |
| Natural ventilation | (ac/h) | X21 | Continuous uniform | [1, 6] | 1 | 4 |
| S. No. | External Wall Material | Conductivity (W/m K) | Density (kg/m3) | Specific Heat Capacity (J/kg K) |
|---|---|---|---|---|
| λ | D | Cp | ||
| EW1 | Aerated concrete blocks | 0.24 | 750 | 1000 |
| EW2 | Concrete hollow block | 0.48 | 880 | 840 |
| EW3 | Sand-lime brick | 0.75 | 1730 | 880 |
| EW4 | Burnt brick | 0.85 | 1500 | 840 |
| EW5 | RCC walls | 2.5 | 2400 | 1000 |
| S. No. | Roof Material | Conductivity (W/m K) | Density (kg/m3) | Specific Heat Capacity (J/kg K) |
|---|---|---|---|---|
| λ | D | Cp | ||
| R1 | Fibreboard | 0.06 | 300 | 1000 |
| R2 | Roof clay tiles | 1.0 | 2000 | 800 |
| R3 | Gypsum plasterboard | 0.65 | 1100 | 840 |
| R4 | Asphalt | 0.7 | 2100 | 1000 |
| R5 | Concrete blocks | 1.1 | 2100 | 840 |
| R6 | Reinforced cement concrete slab | 2.5 | 2400 | 1000 |
| S. No. | Floor Material | Conductivity (W/m K) | Density (kg/m3) | Specific Heat Capacity (J/kg K) |
|---|---|---|---|---|
| λ | D | Cp | ||
| F1 | Cork tiles | 0.08 | 530 | 1800 |
| F2 | Timber flooring | 0.14 | 650 | 1200 |
| F3 | Concrete blocks | 0.51 | 1400 | 1000 |
| F4 | Plain cement concrete | 0.75 | 2000 | 656 |
| F5 | Ceramic tiles | 0.8 | 1700 | 850 |
| S. No. | Building Element Composition | Conductivity (W/m K) | Density (kg/m3) | Specific Heat Capacity (J/kg K) |
|---|---|---|---|---|
| λ | D | Cp | ||
| I1 | Polyurethane foam | 0.028 | 30 | 1470 |
| I2 | Expanded polystyrene (EPS) | 0.04 | 15 | 1400 |
| I3 | Stone wool | 0.038 | 40 | 840 |
| I4 | Glass–fibre batt insulation | 0.043 | 12 | 840 |
| S. No. | Window Frame Type | Frame Composition | Thickness (m) | Uf-Value (U frame) W/m2 K |
|---|---|---|---|---|
| WF1 WF2 WF3 WF4 | Aluminium window frame (no break) Aluminium window frame (with thermal break) Wooden window frame UPVC window frame | Aluminium Aluminium PVC Oak (radial) PVC | 0.005 0.002 0.005 0.02 0.02 | 5.8 5 3.4 3.6 |
| S. No. | Window Glazing Type | SHGC | LT | Ug-Value (U glass) (W/m2 K) |
|---|---|---|---|---|
| W1 | Single clear (3 mm) | 0.86 | 0.89 | 5.7 |
| W2 | Single LoE (e2 = 0.2) clear (3 mm) | 0.76 | 0.82 | 3.8 |
| W3 | Double clear (3 mm/13 mm Air) | 0.76 | 0.81 | 2.7 |
| W4 | Double clear (3 mm/13 mm Arg) | 0.76 | 0.81 | 2.5 |
| W5 | Double Reflective-D (6 mm/13 mm Air) | 0.42 | 0.3 | 2.6 |
| W6 | Double Reflective-D (6 mm/13 mm Arg) | 0.42 | 0.3 | 2.4 |
| W7 | Double LoE (e2 = 0.1) clear (3 mm/13 mm Air) | 0.59 | 0.76 | 1.7 |
| W8 | Double LoE (e2 = 0.1) clear (3 mm/13 mm Arg) | 0.59 | 0.76 | 1.5 |
| W9 | Triple LoE (e2 = e5 = 0.1) clear (3 mm/13 mm Air) | 0.47 | 0.66 | 0.9 |
| W10 | Triple LoE (e2 = e5 = 0.1) clear (3 mm/13 mm Arg) | 0.47 | 0.66 | 0.78 |
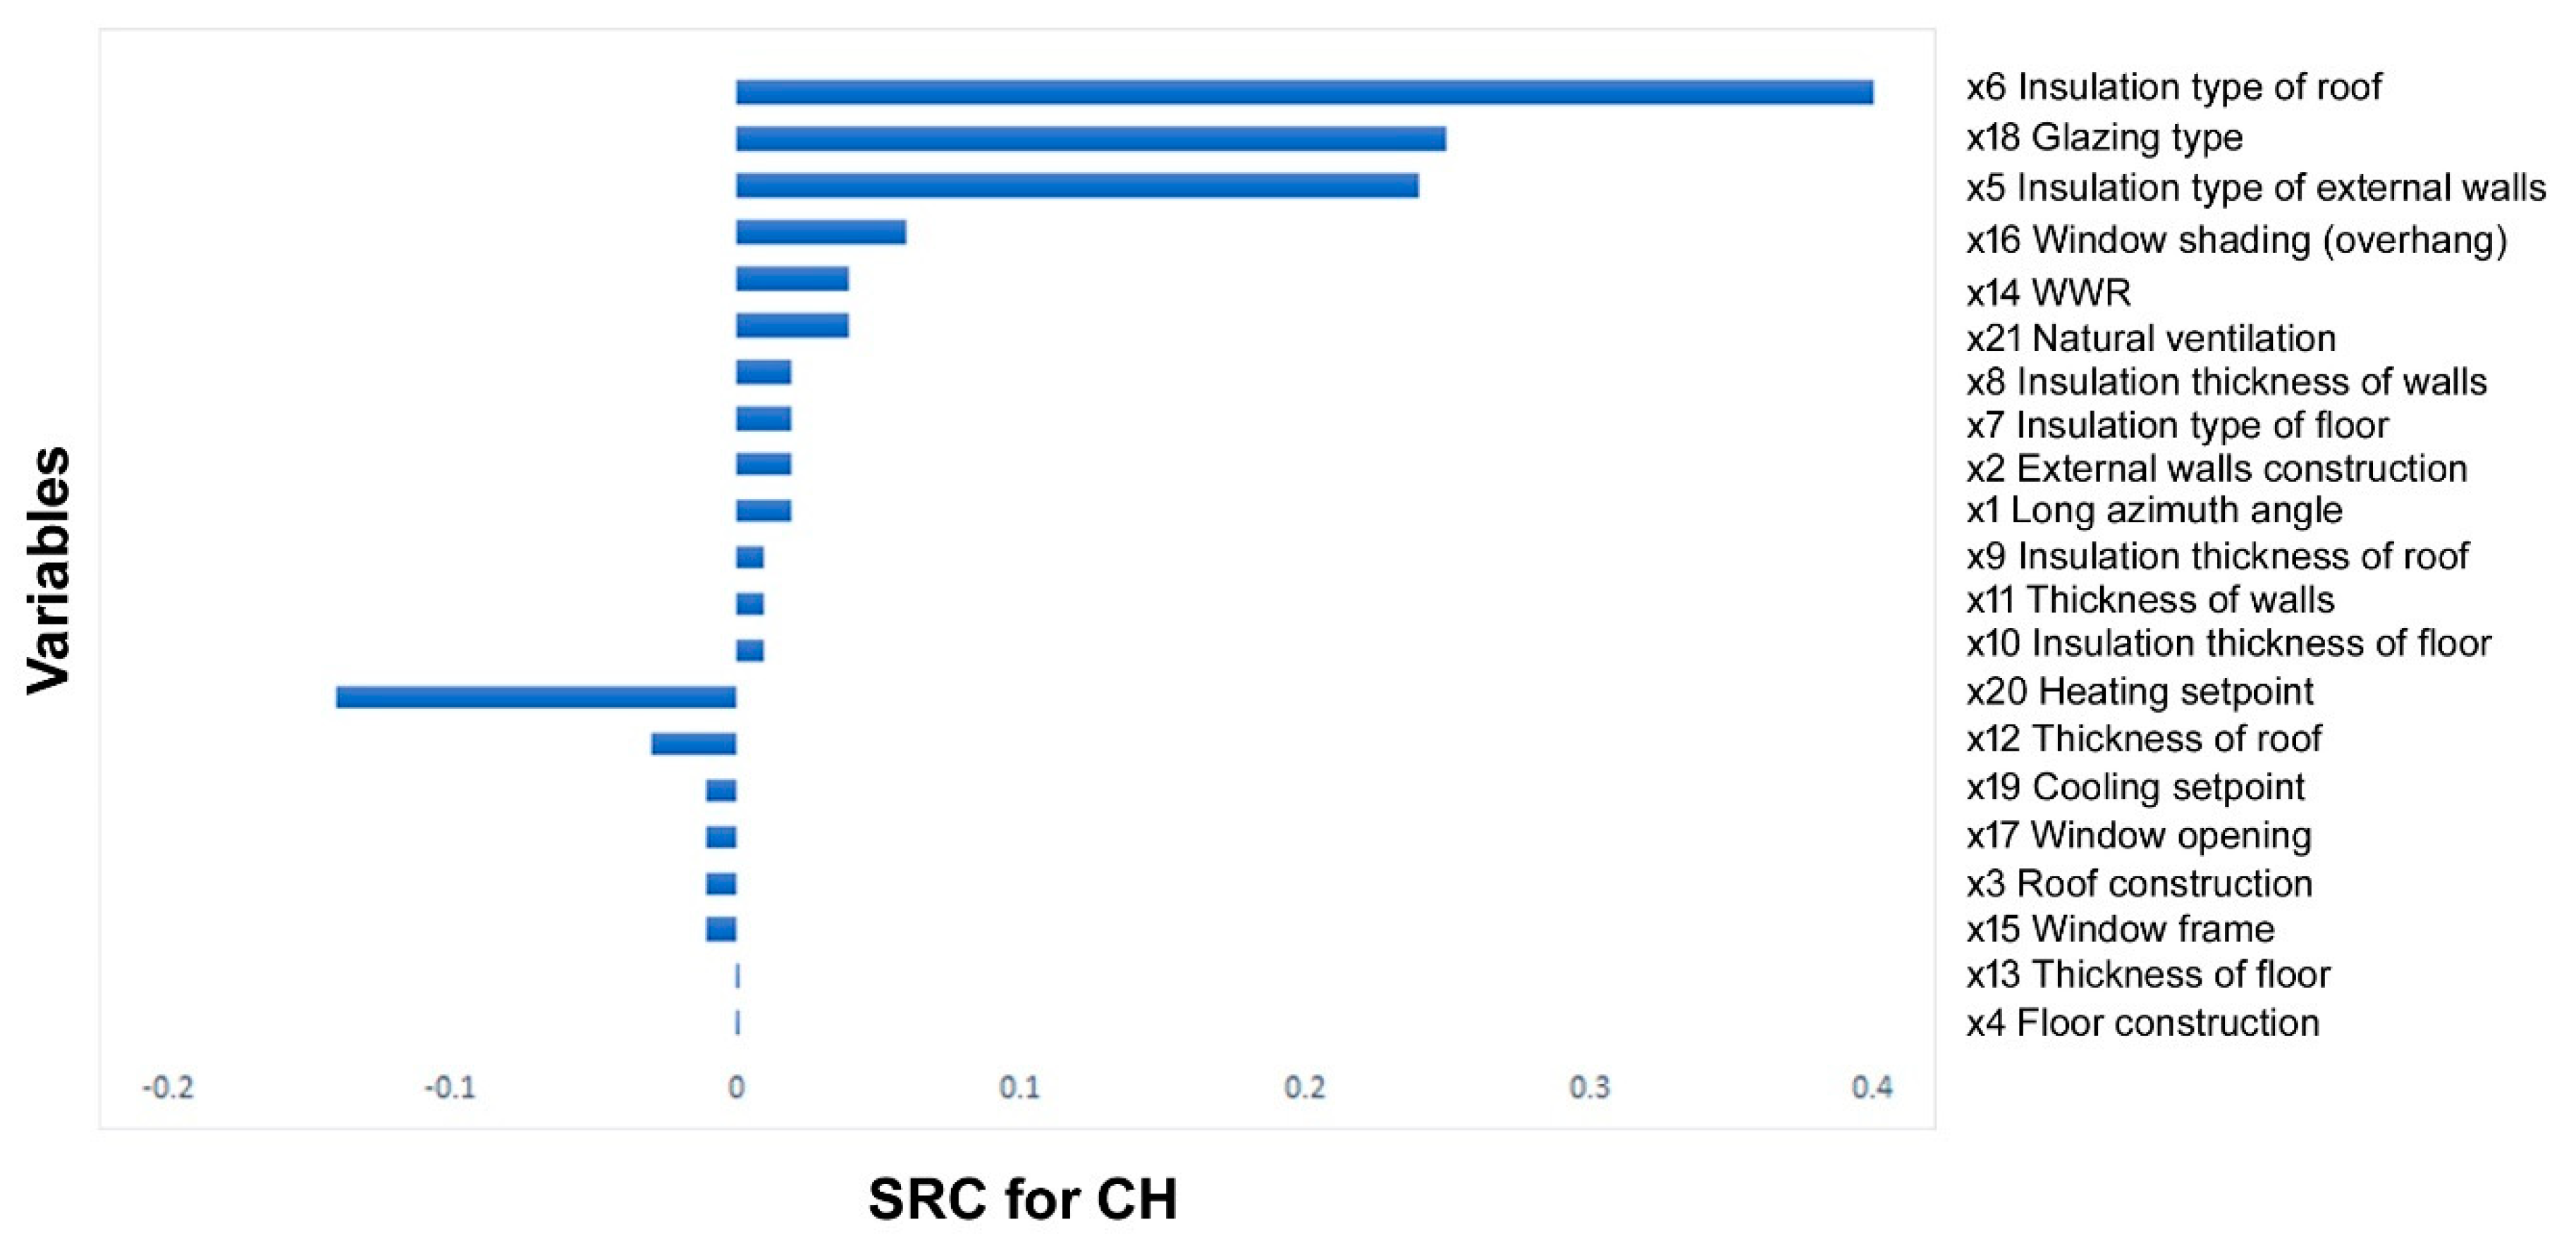
| Design Variables | Variable Names | SRCs for CH (Ranking) |
|---|---|---|
| Long axis azimuth | X1 | 0.02 |
| External walls construction | X2 | 0.02 |
| Roof construction | X3 | −0.01 |
| Floor construction | X4 | 0 |
| Insulation type of external walls | X5 | 0.24 |
| Insulation type of roof | X6 | 0.4 |
| Insulation type of floor | X7 | 0.02 |
| Insulation thickness of walls | X8 | 0.02 |
| Insulation thickness of roof | X9 | 0.01 |
| Insulation thickness of floor | X10 | 0.01 |
| Thickness of walls | X11 | 0.01 |
| Thickness of roof | X12 | −0.03 |
| Thickness of floor | X13 | 0 |
| WWR | X14 | 0.04 |
| Window frame | X15 | −0.01 |
| Window shading (overhang) | X16 | 0.06 |
| Window opening | X17 | −0.01 |
| Glazing type | X18 | 0.25 |
| Cooling setpoint | X19 | −0.01 |
| Heating setpoint | X20 | −0.14 |
| Natural ventilation | X21 | 0.04 |
© 2020 by the authors. Licensee MDPI, Basel, Switzerland. This article is an open access article distributed under the terms and conditions of the Creative Commons Attribution (CC BY) license (http://creativecommons.org/licenses/by/4.0/).
Share and Cite
Mahar, W.A.; Verbeeck, G.; Reiter, S.; Attia, S. Sensitivity Analysis of Passive Design Strategies for Residential Buildings in Cold Semi-Arid Climates. Sustainability 2020, 12, 1091. https://doi.org/10.3390/su12031091
Mahar WA, Verbeeck G, Reiter S, Attia S. Sensitivity Analysis of Passive Design Strategies for Residential Buildings in Cold Semi-Arid Climates. Sustainability. 2020; 12(3):1091. https://doi.org/10.3390/su12031091
Chicago/Turabian StyleMahar, Waqas Ahmed, Griet Verbeeck, Sigrid Reiter, and Shady Attia. 2020. "Sensitivity Analysis of Passive Design Strategies for Residential Buildings in Cold Semi-Arid Climates" Sustainability 12, no. 3: 1091. https://doi.org/10.3390/su12031091
APA StyleMahar, W. A., Verbeeck, G., Reiter, S., & Attia, S. (2020). Sensitivity Analysis of Passive Design Strategies for Residential Buildings in Cold Semi-Arid Climates. Sustainability, 12(3), 1091. https://doi.org/10.3390/su12031091