Silicon Nanomembrane Filtration and Imaging for the Evaluation of Microplastic Entrainment along a Municipal Water Delivery Route

 ,
, 
Abstract
1. Introduction
2. Materials and Methods
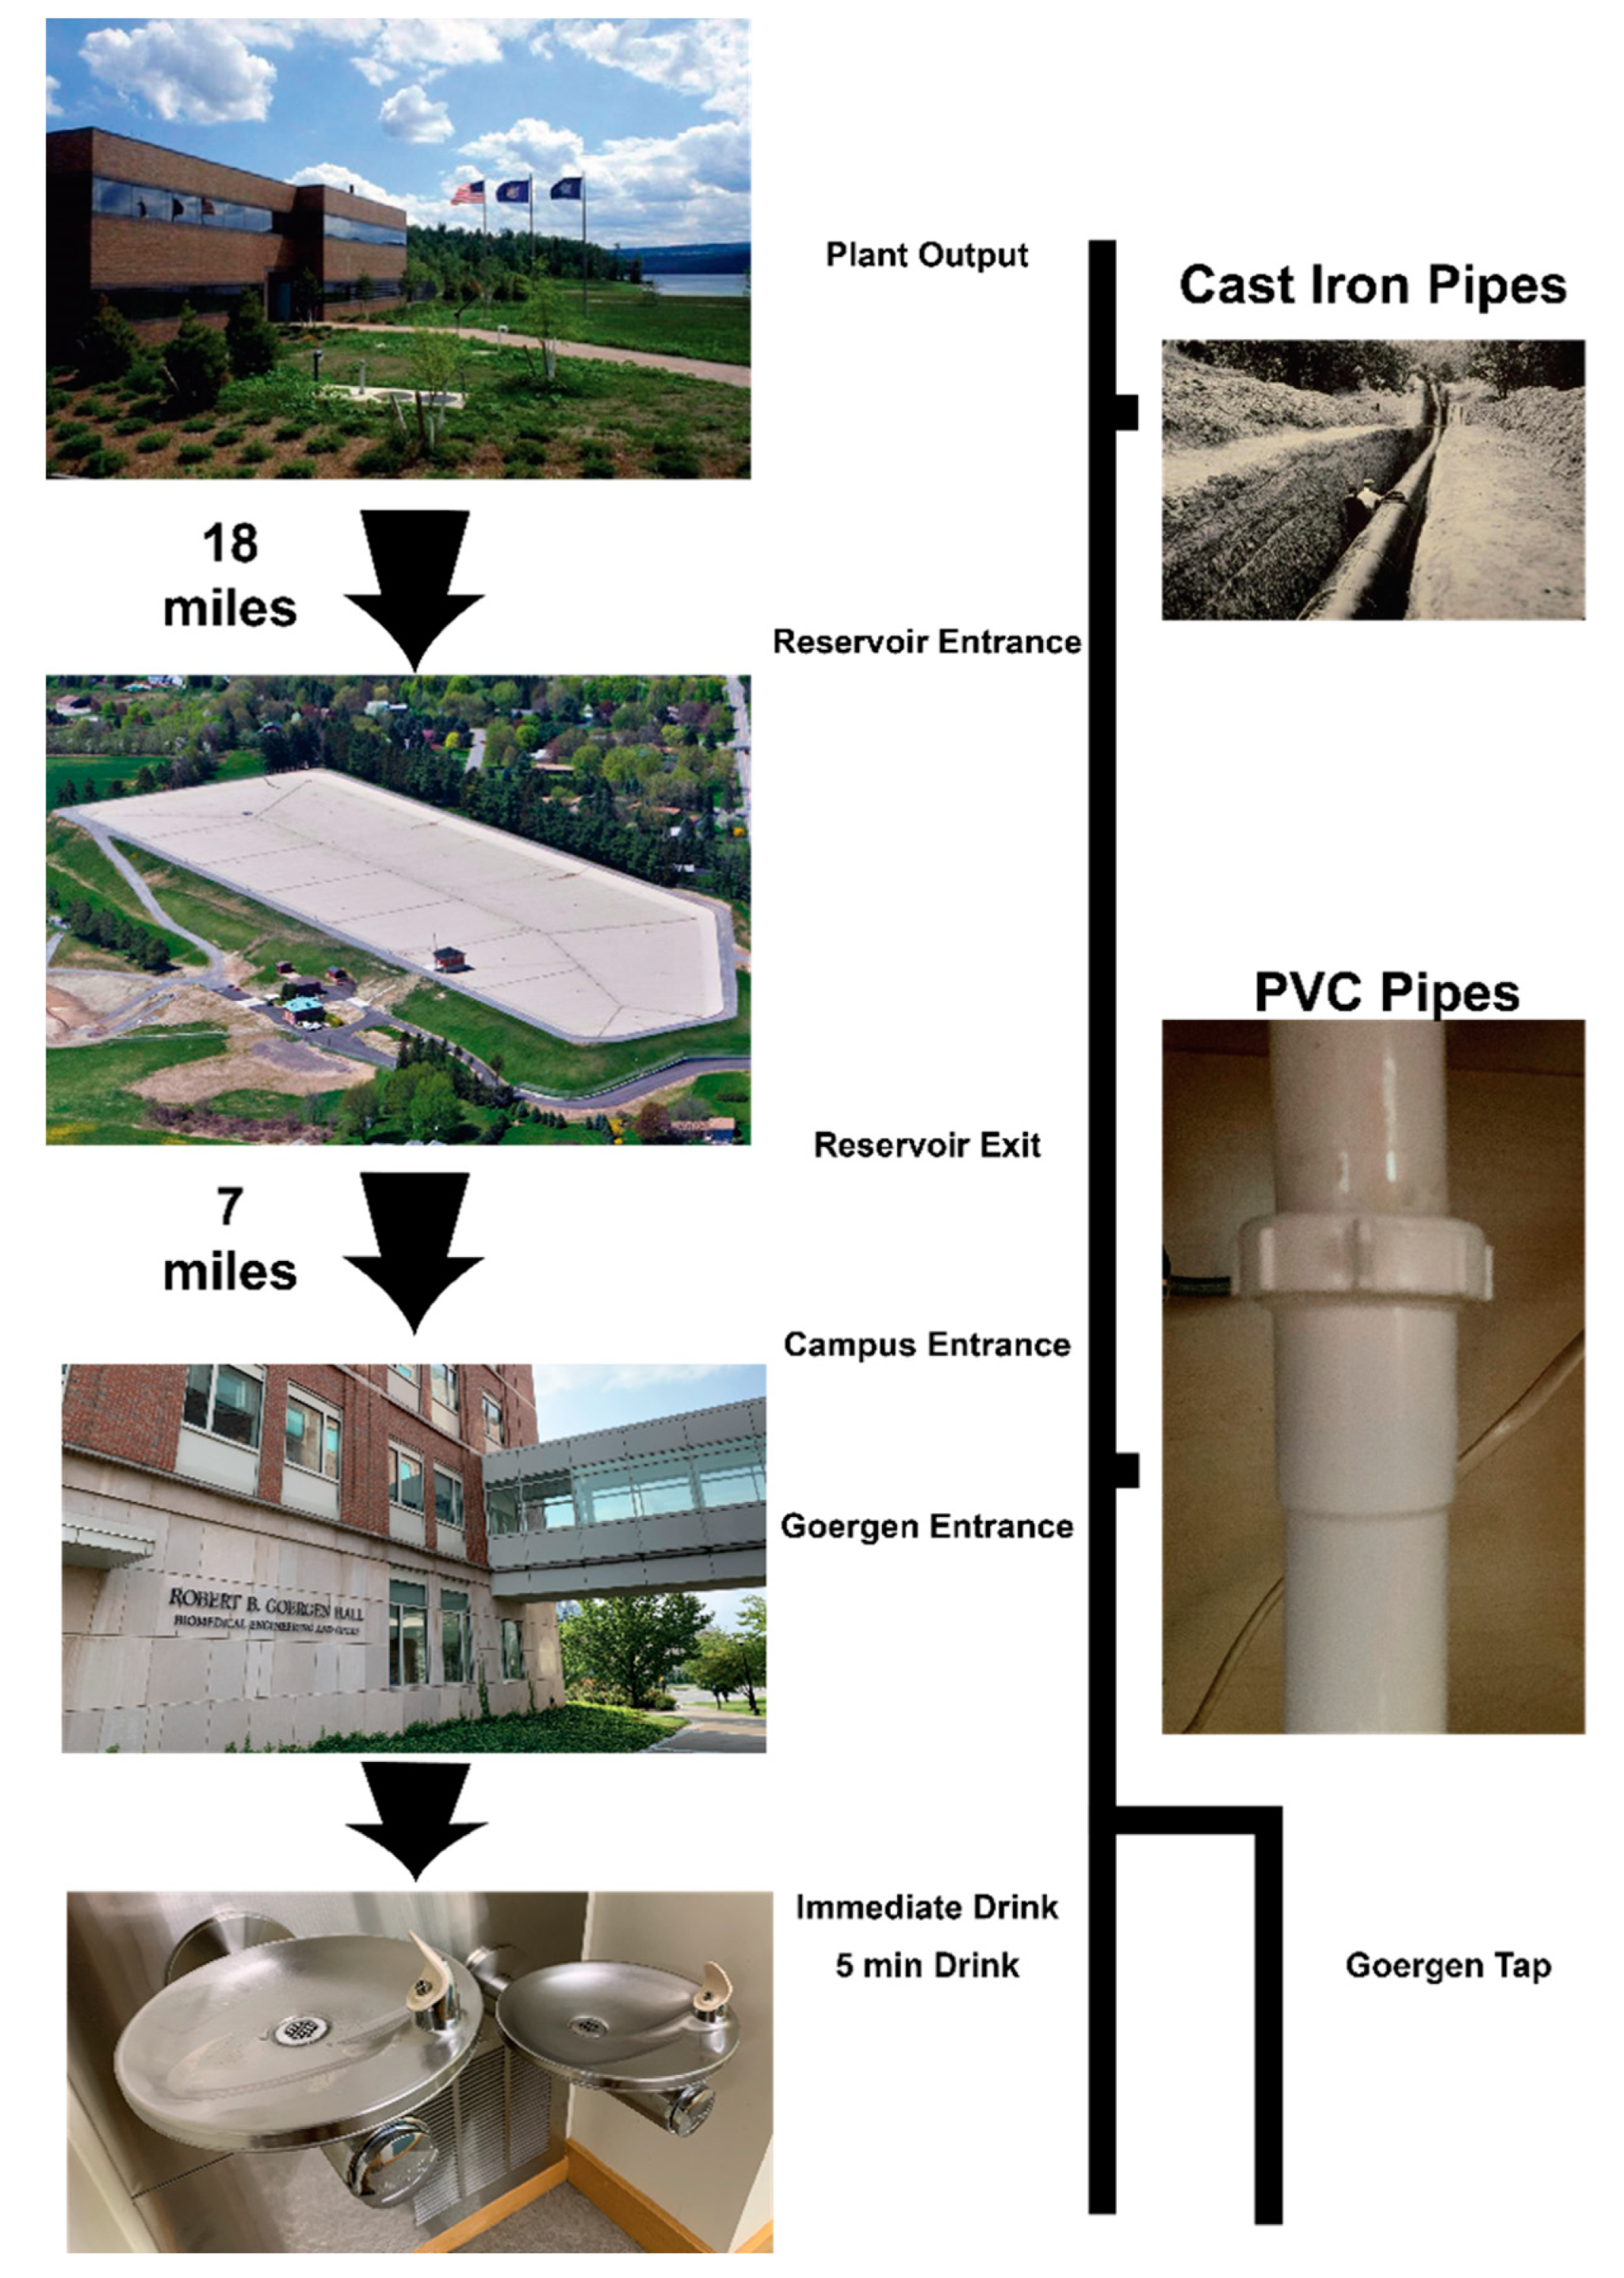
2.1. Water Processing and Sample Collection
2.2. Sonication and Cleaning Protocol
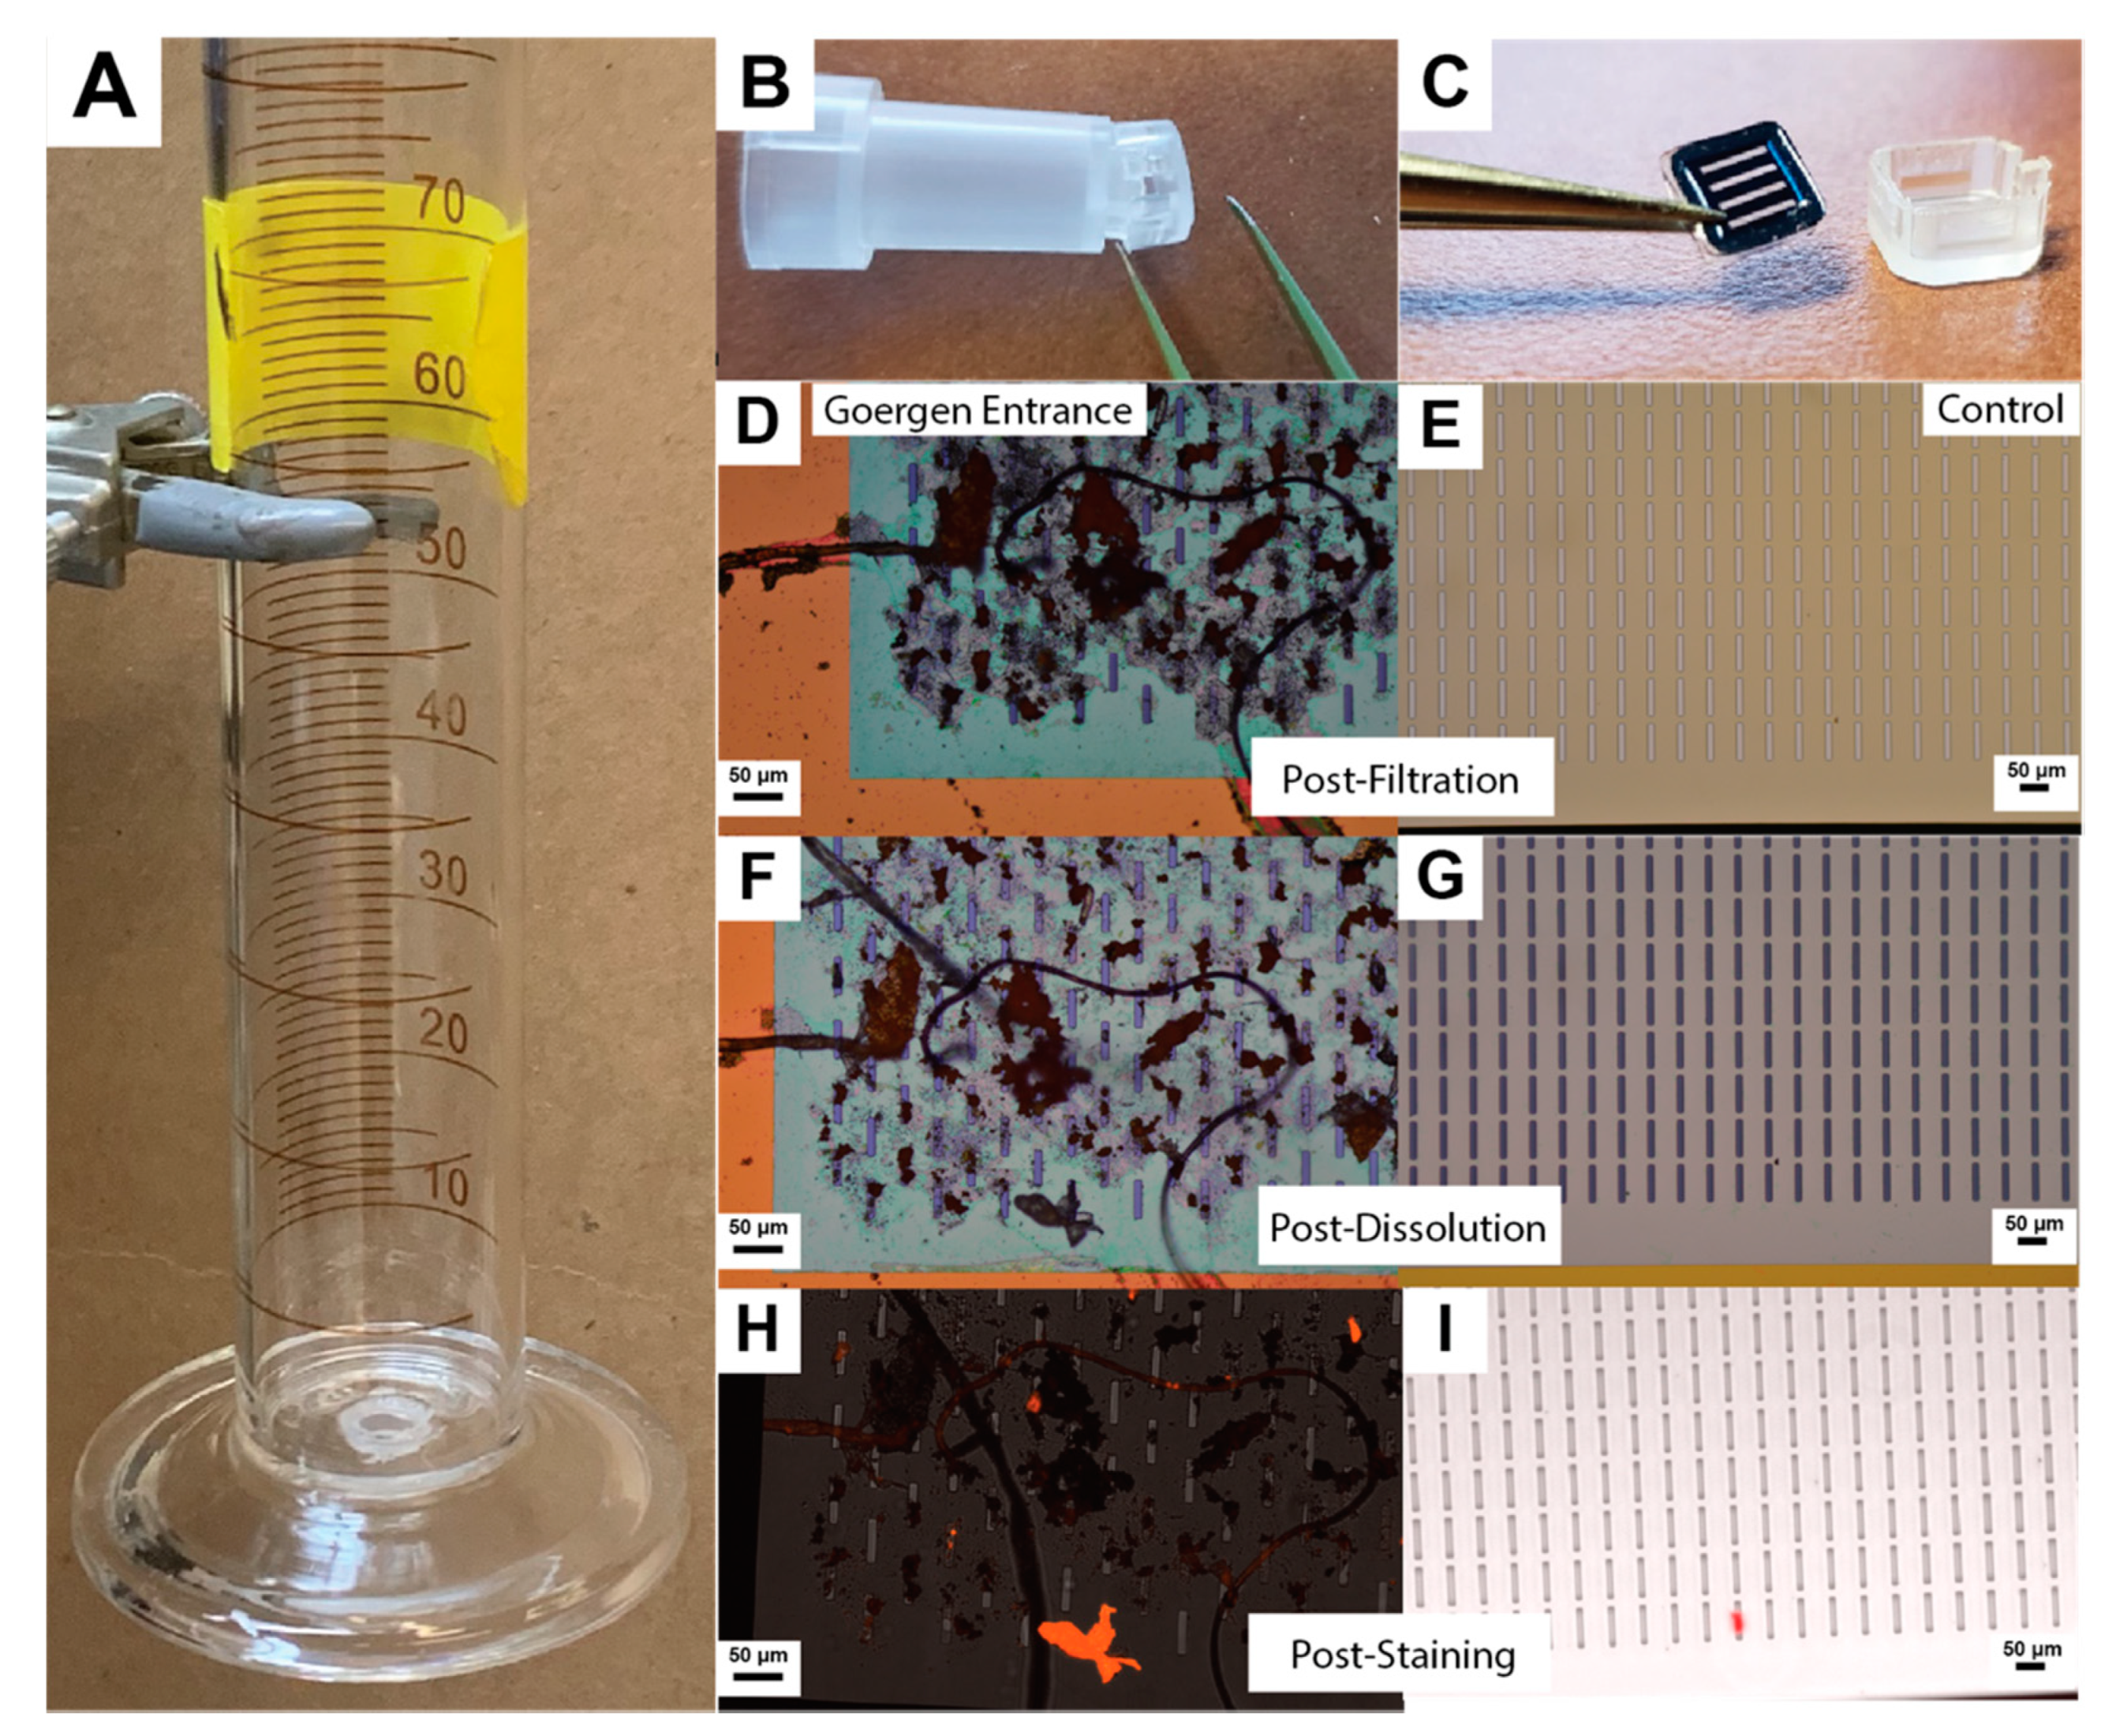
2.3. Graduated Cylinder Gravity Filtration
2.4. Dissolution and Washing Protocol
2.5. Nile Red Staining
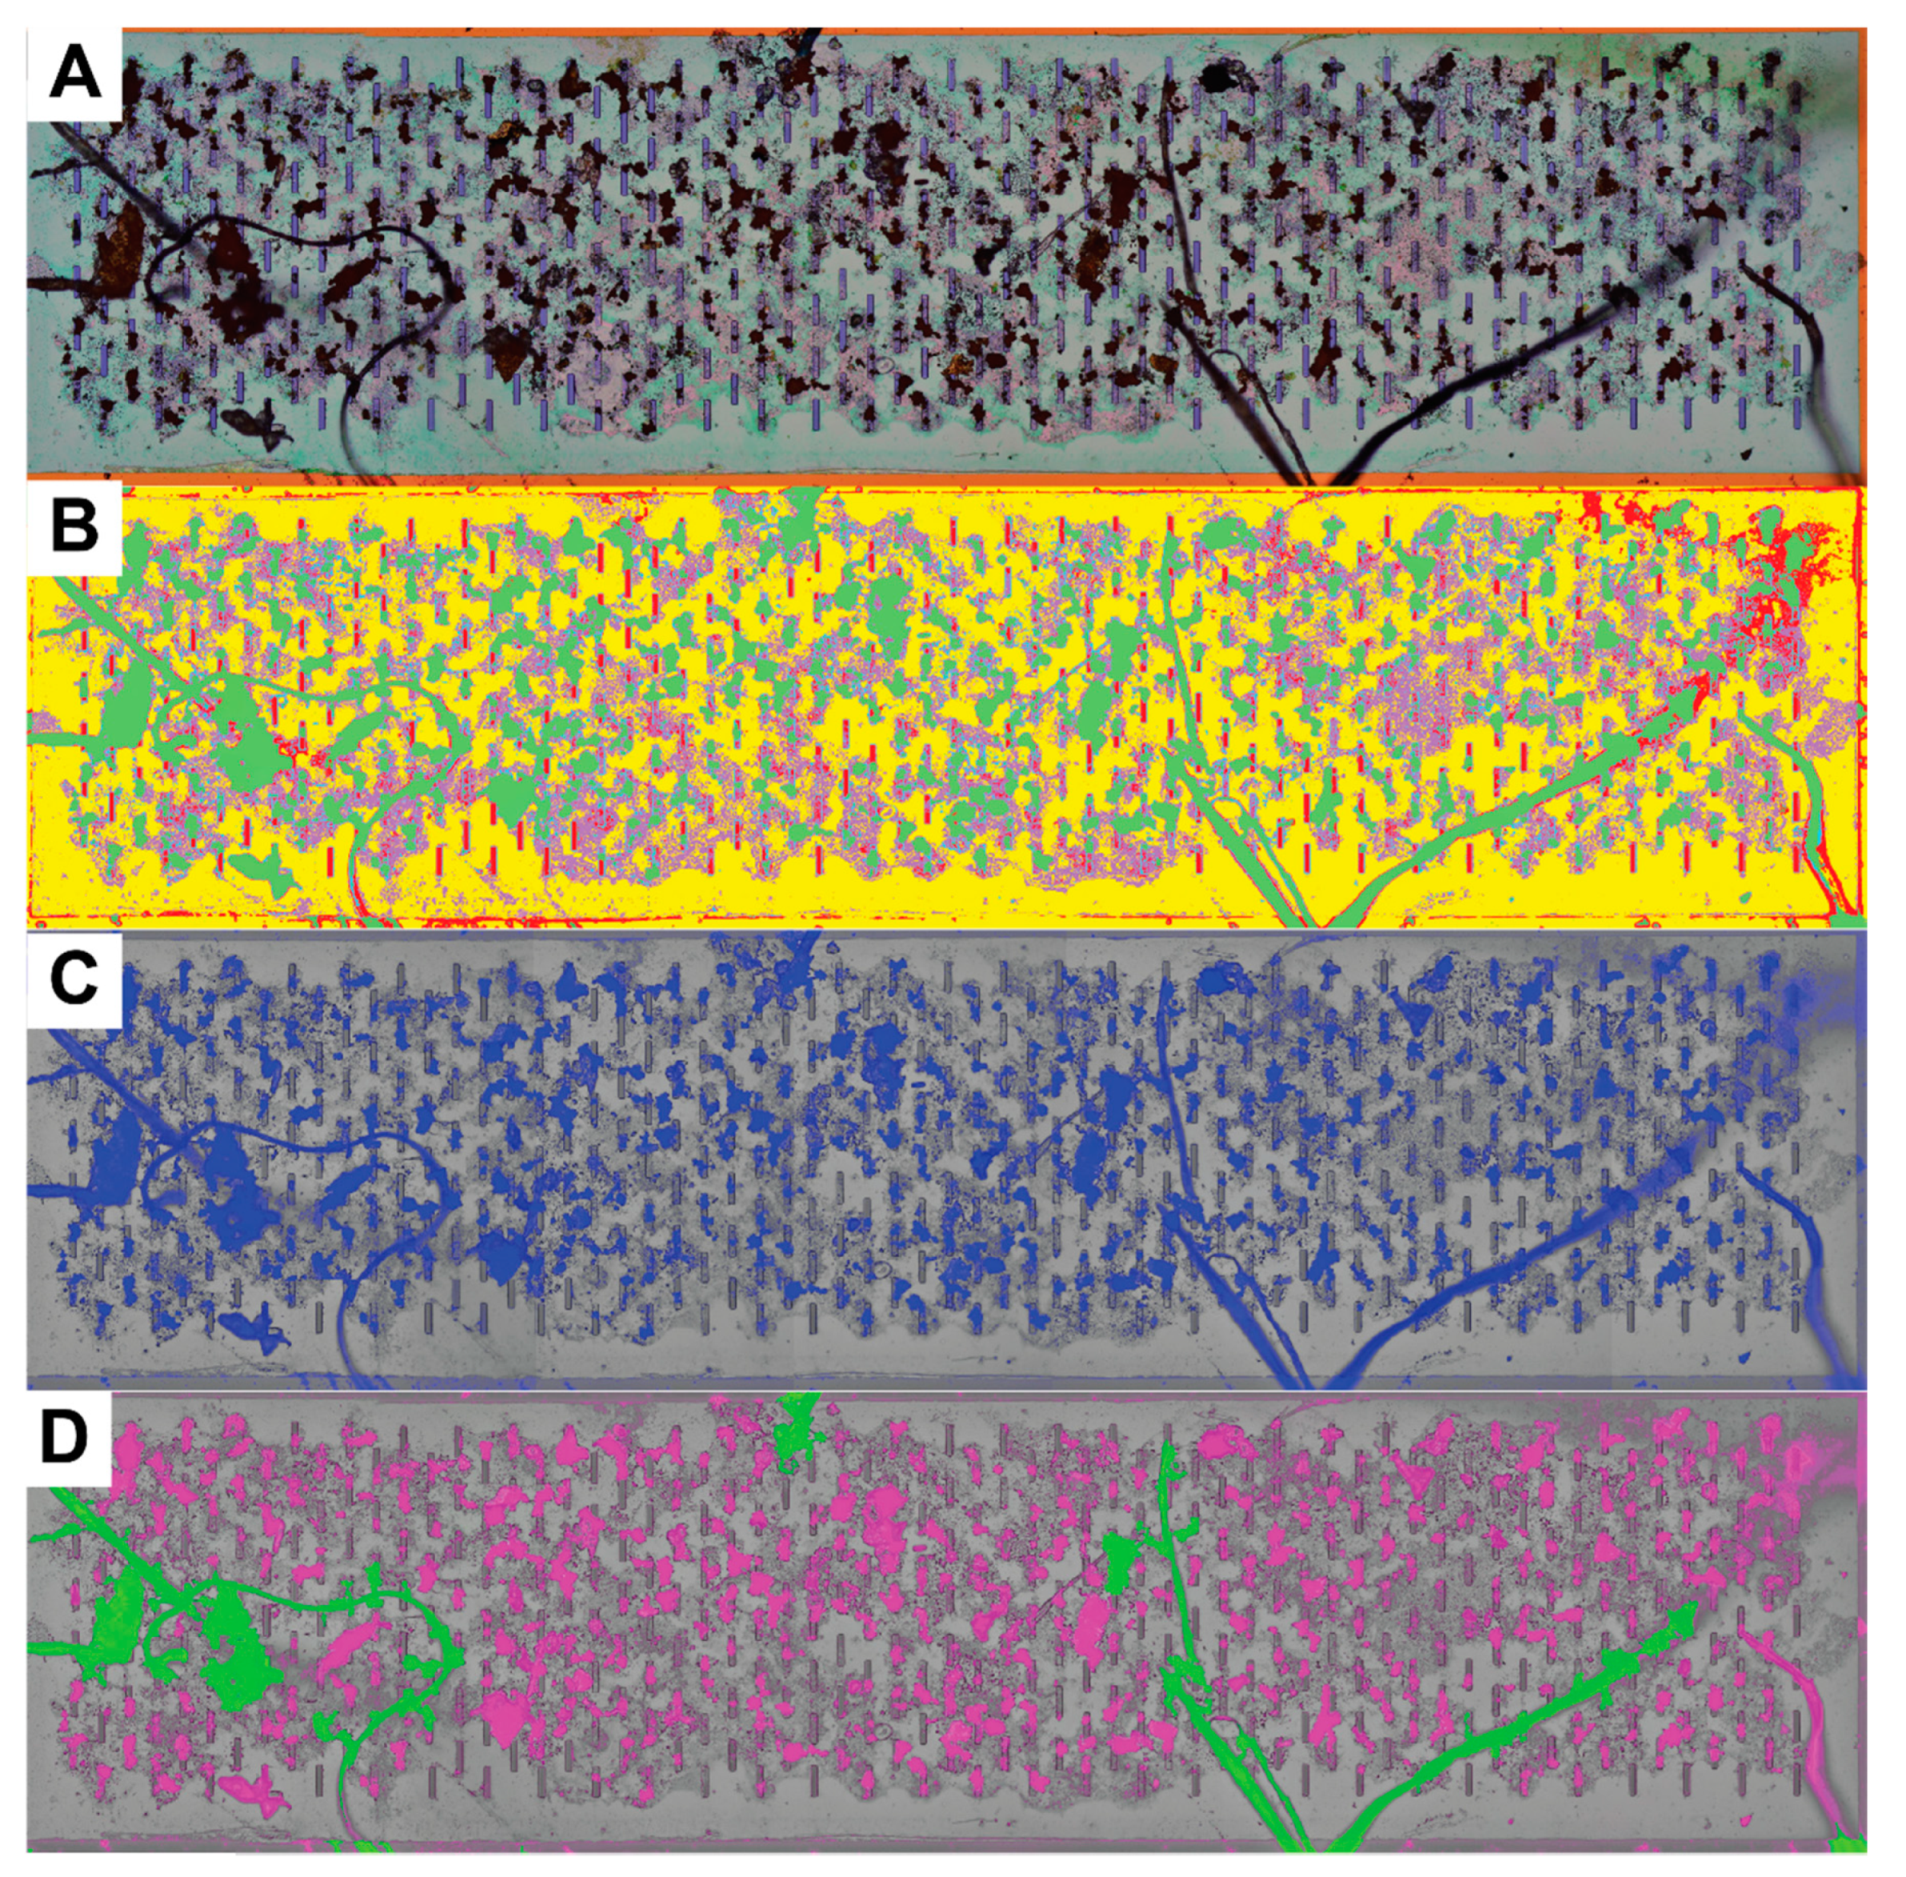
2.6. Image Processing, Segmentation, and Quantification
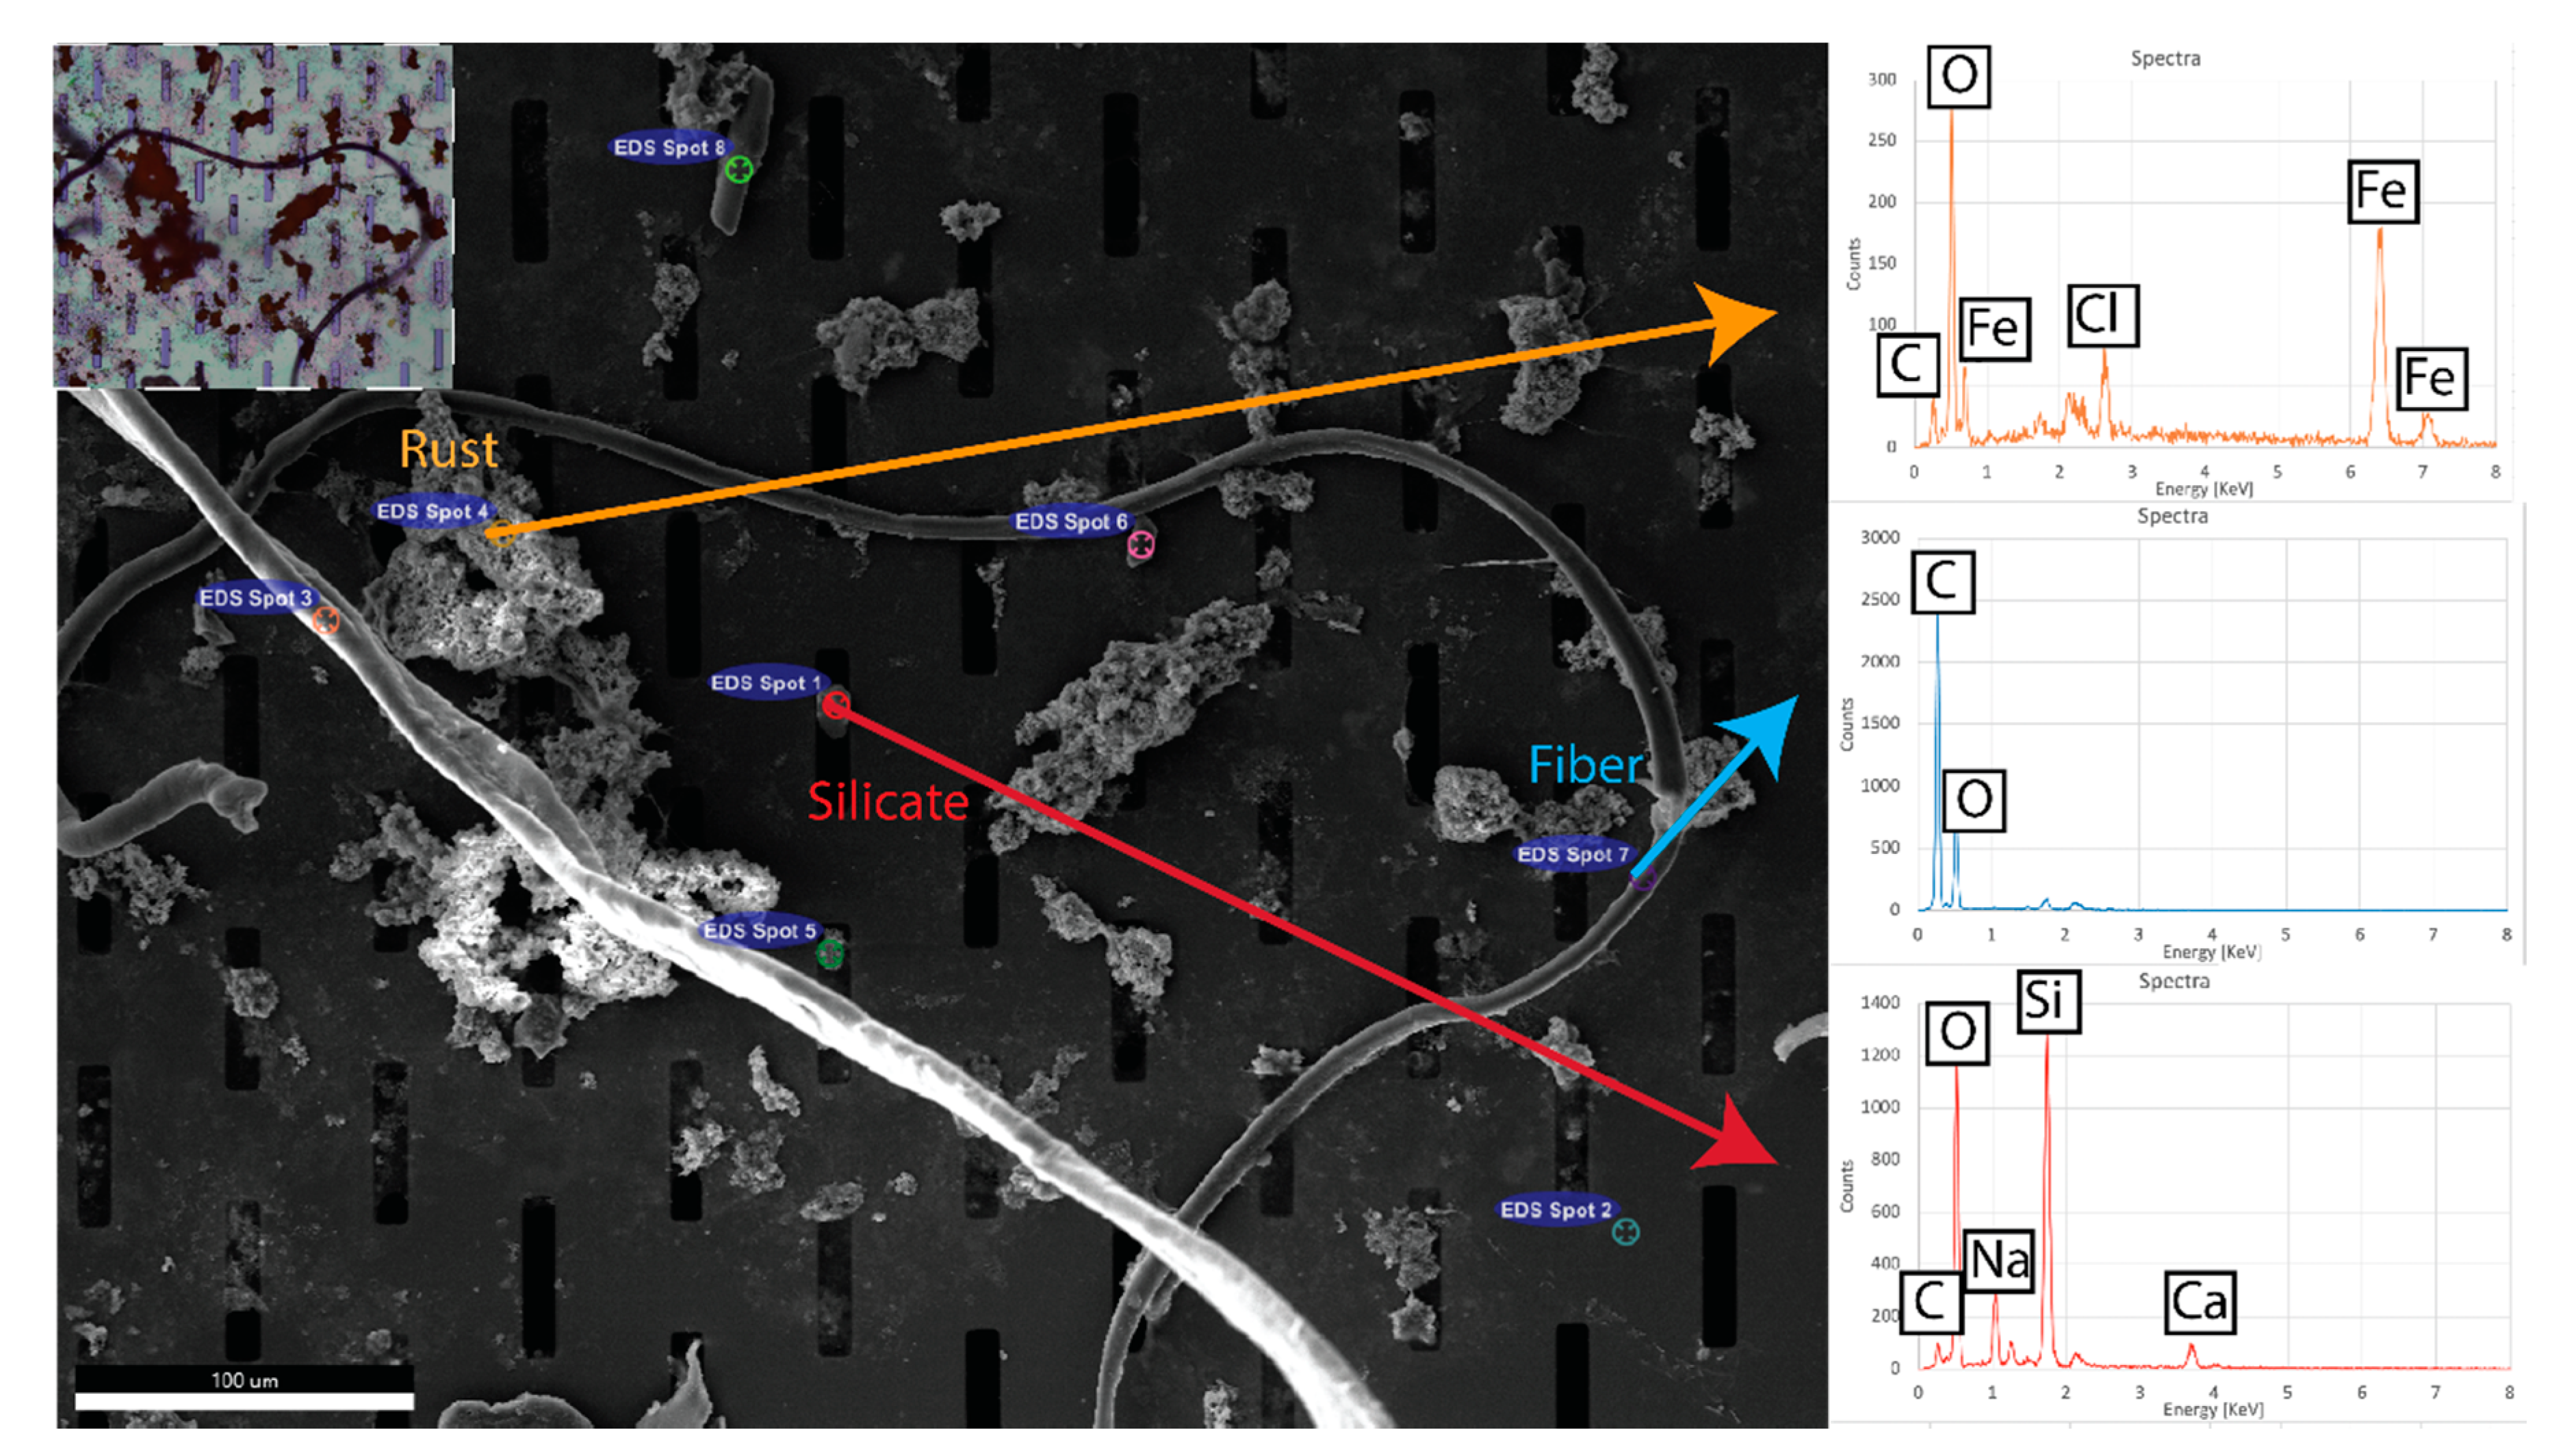
2.7. Elemental Analysis
3. Results and Discussion
3.1. Water Transport Route and Filtration Apparatus
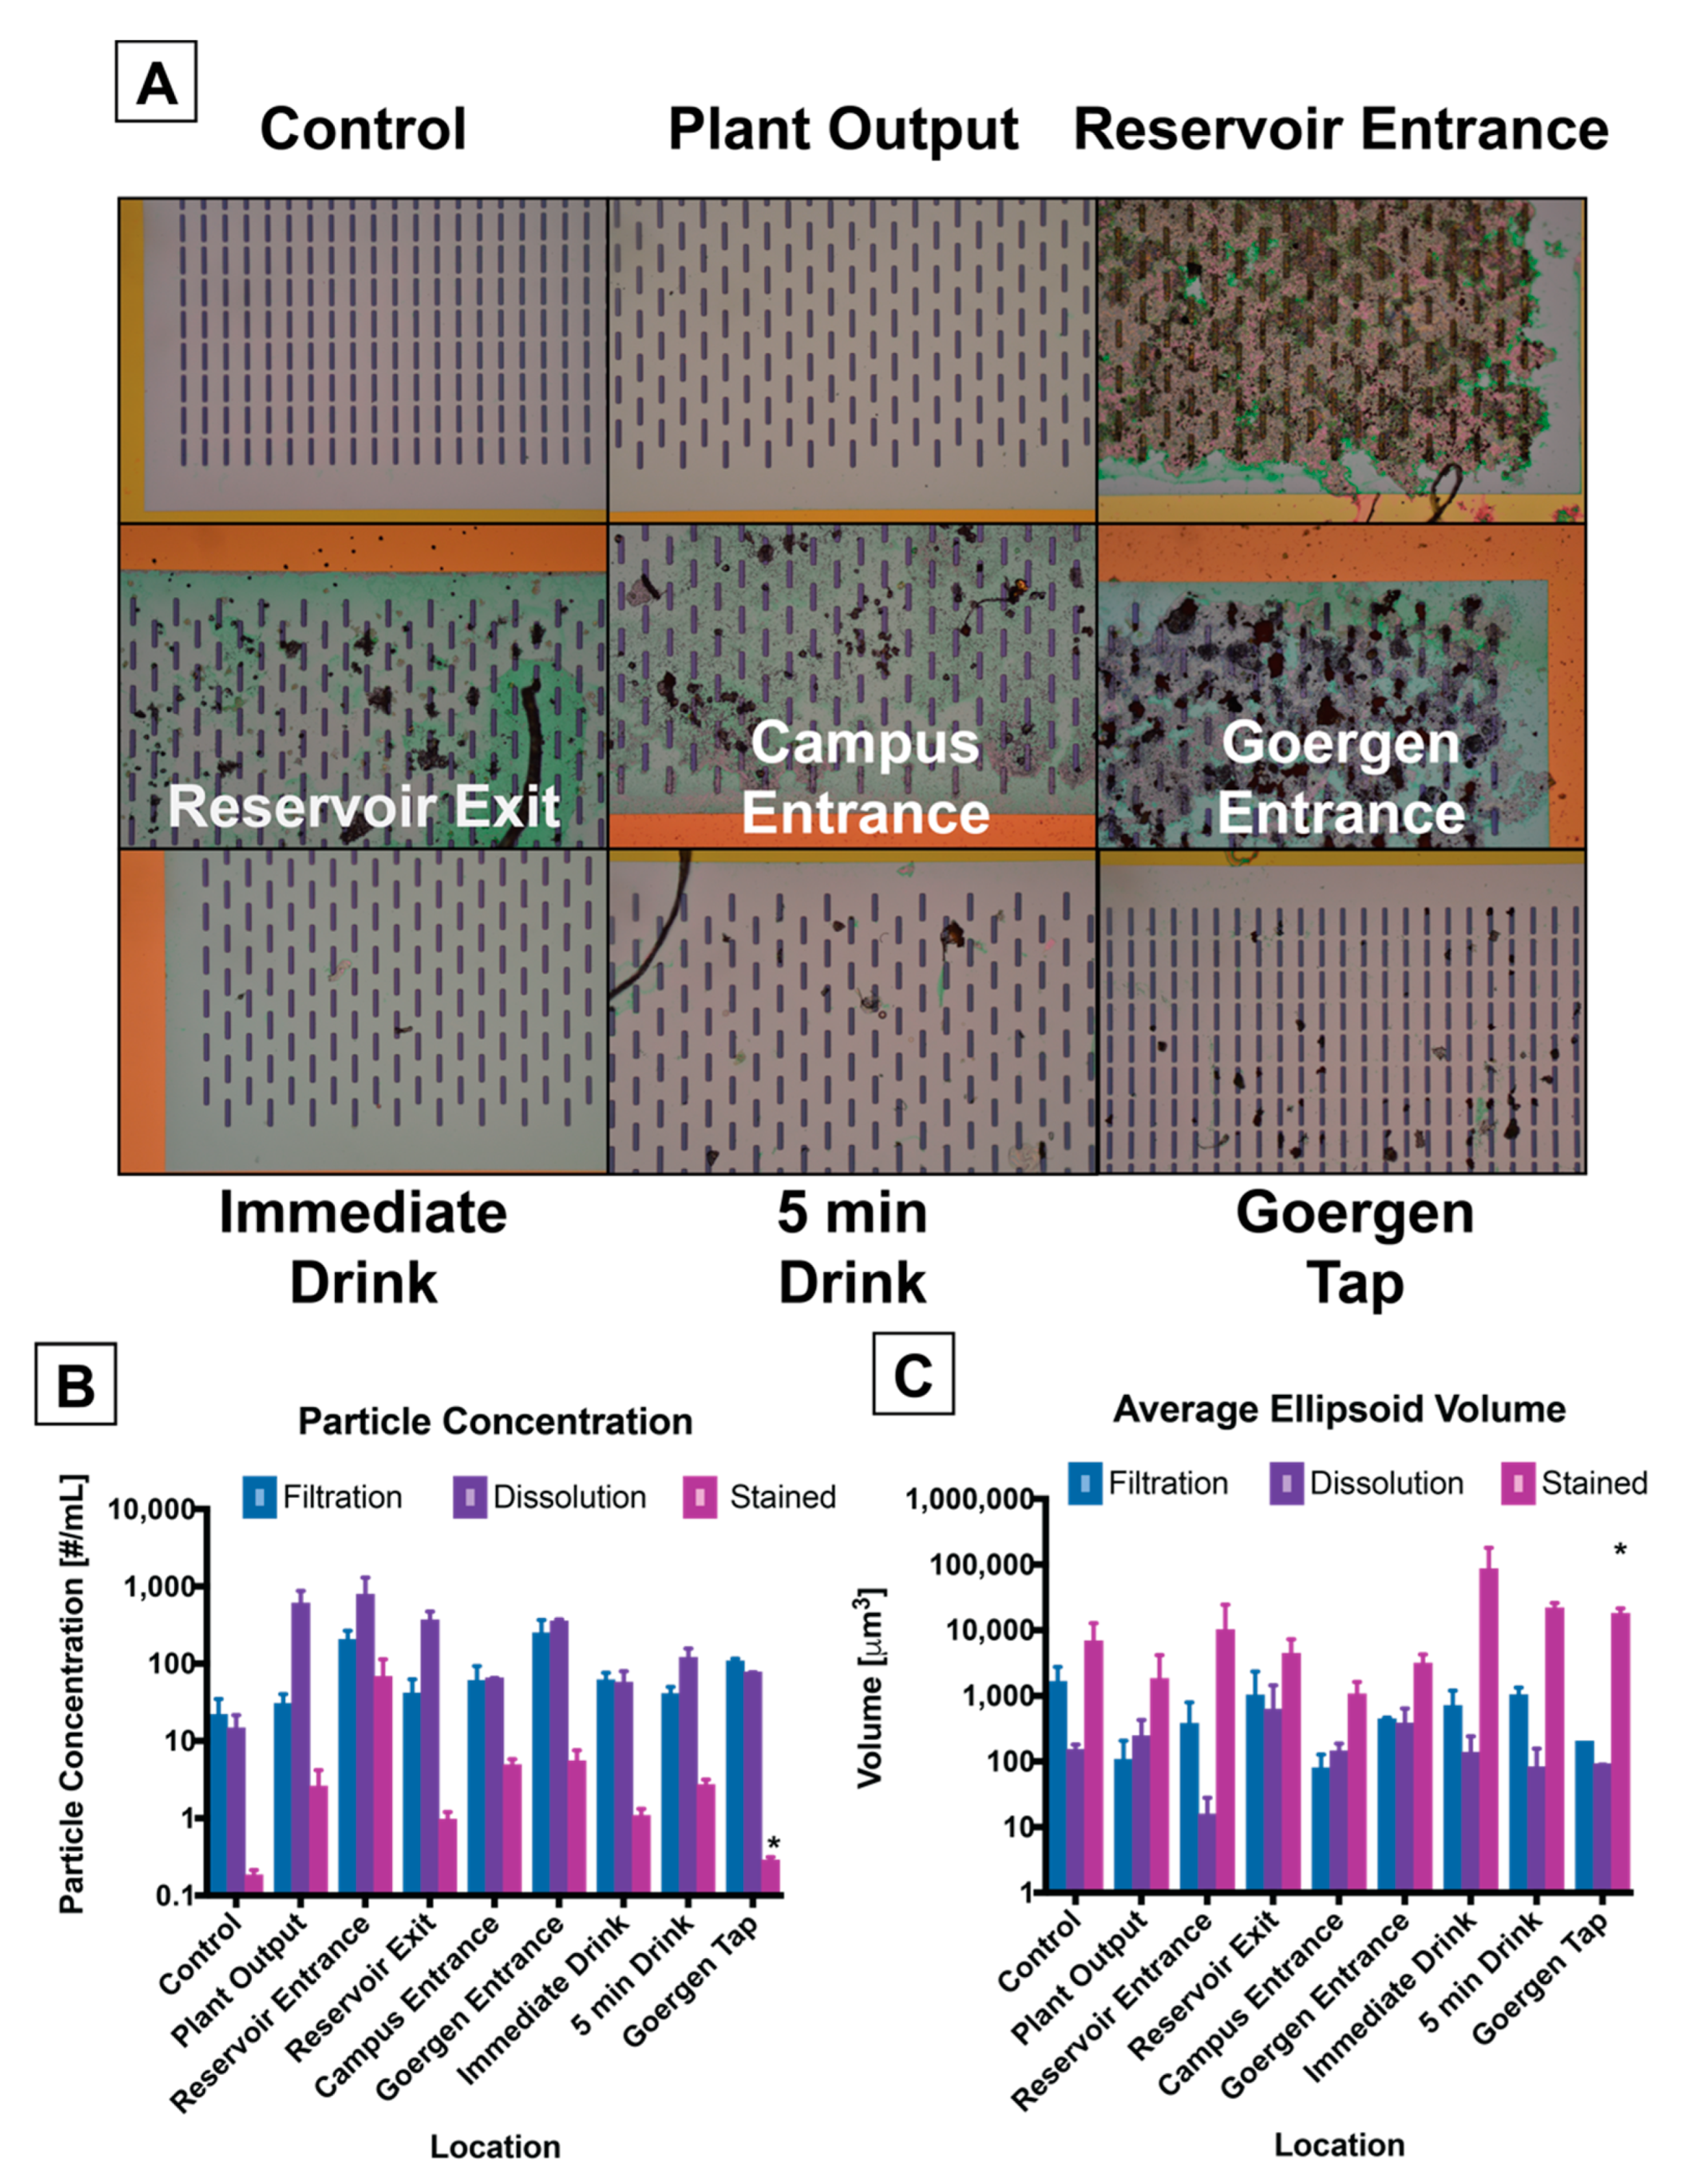
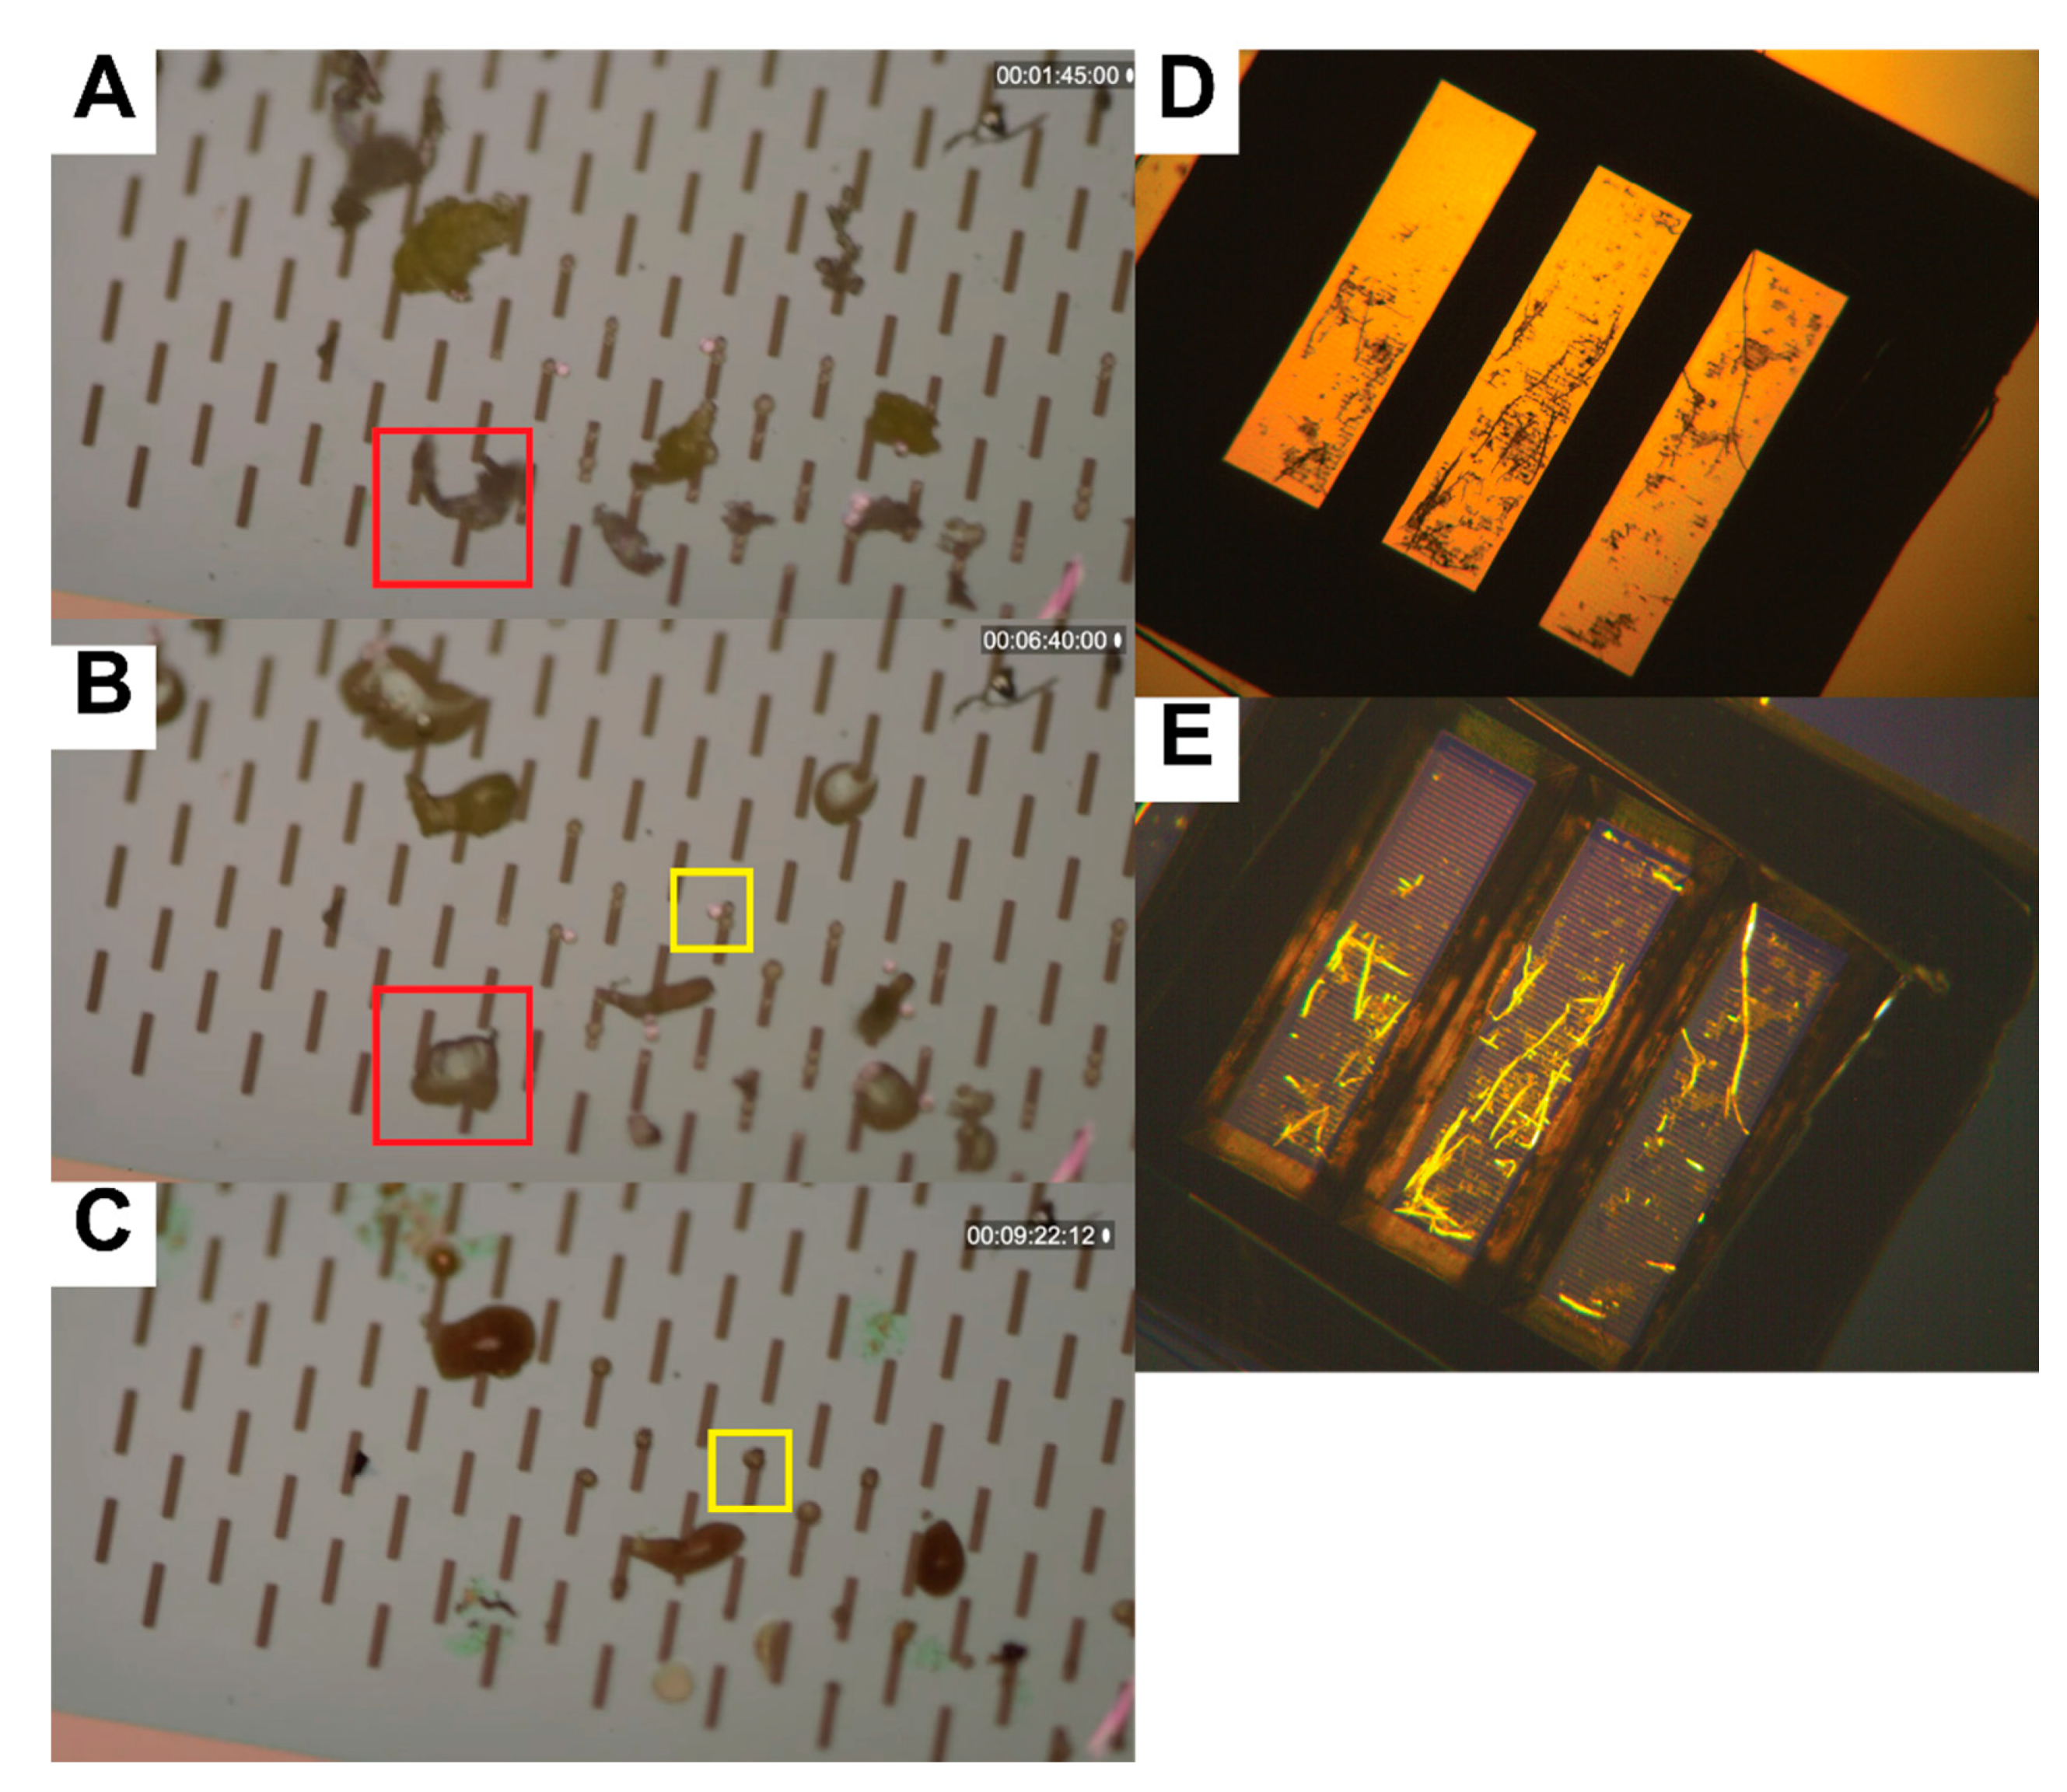
3.2. Image Processing and Particle Enumeration
3.3. Material Analysis
4. Conclusions
Supplementary Materials
Author Contributions
Funding
Acknowledgments
Conflicts of Interest
Abbreviations
| NPN | nanoporous silicon nitride |
| SiN | silicon-rich silicon nitride |
| pnc-Si | porous nanocrystalline silicon |
| EDS | energy dispersive X-ray spectroscopy |
| FTIR | fourier-transform infrared spectroscopy |
| SEPCON | separation container |
| DIC | differential interference contrast |
| WEKA | Waikato Environment for Knowledge Analysis |
References
- Zalasiewicz, J.; Waters, C.N.; Ivar do Sul, J.A.; Corcoran, P.L.; Barnosky, A.D.; Cearreta, A.; Edgeworth, M.; Gałuszka, A.; Jeandel, C.; Leinfelder, R.; et al. The geological cycle of plastics and their use as a stratigraphic indicator of the Anthropocene. Anthropocene 2016, 13, 4–17. [Google Scholar] [CrossRef]
- Mani, T.; Hauk, A.; Walter, U.; Burkhardt-Holm, P. Microplastics Profile along the Rhine River. Sci. Rep. 2015, 5, 17988. [Google Scholar] [CrossRef] [PubMed]
- Blettler, M.C.M.; Ulla, M.A.; Rabuffetti, A.P.; Garello, N. Plastic pollution in freshwater ecosystems: Macro-, meso-, and microplastic debris in a floodplain lake. Environ. Monit. Assess. 2017, 189, 581. [Google Scholar] [CrossRef] [PubMed]
- Wang, W.; Ndungu, A.W.; Li, Z.; Wang, J. Microplastics pollution in inland freshwaters of China: A case study in urban surface waters of Wuhan, China. Sci. Total Environ. 2017, 575, 1369–1374. [Google Scholar] [CrossRef] [PubMed]
- Allen, S.; Allen, D.; Phoenix, V.R.; Le Roux, G.; Durántez Jiménez, P.; Simonneau, A.; Binet, S.; Galop, D. Atmospheric transport and deposition of microplastics in a remote mountain catchment. Nat. Geosci. 2019, 12, 339–344. [Google Scholar] [CrossRef]
- Jovanović, B. Ingestion of microplastics by fish and its potential consequences from a physical perspective. Integr. Environ. Assess. Manag. 2017, 13, 510–515. [Google Scholar] [CrossRef]
- Kosuth, M.; Mason, S.A.; Wattenberg, E.V. Anthropogenic contamination of tap water, beer, and sea salt. PLoS ONE 2018, 13, e0194970. [Google Scholar] [CrossRef]
- Schirinzi, G.F.; Pérez-Pomeda, I.; Sanchís, J.; Rossini, C.; Farré, M.; Barceló, D. Cytotoxic effects of commonly used nanomaterials and microplastics on cerebral and epithelial human cells. Environ. Res. 2017, 159, 579–587. [Google Scholar] [CrossRef]
- Zimmermann, L.; Dierkes, G.; Ternes, T.A.; Völker, C.; Wagner, M. Benchmarking the in Vitro Toxicity and Chemical Composition of Plastic Consumer Products. Environ. Sci. Technol. 2019, 53, 11467–11477. [Google Scholar] [CrossRef]
- Mattsson, K.; Johnson, E.V.; Malmendal, A.; Linse, S.; Hansson, L.-A.; Cedervall, T. Brain damage and behavioural disorders in fish induced by plastic nanoparticles delivered through the food chain. Sci. Rep. 2017, 7, 11452. [Google Scholar] [CrossRef]
- Deng, Y.; Zhang, Y.; Lemos, B.; Ren, H. Tissue accumulation of microplastics in mice and biomarker responses suggest widespread health risks of exposure. Sci. Rep. 2017, 7, 46687. [Google Scholar] [CrossRef] [PubMed]
- Cox, K.D.; Covernton, G.A.; Davies, H.L.; Dower, J.F.; Juanes, F.; Dudas, S.E. Human Consumption of Microplastics. Environ. Sci. Technol. 2019, 53, 7068–7074. [Google Scholar] [CrossRef] [PubMed]
- Koelmans, A.A.; Mohamed Nor, N.H.; Hermsen, E.; Kooi, M.; Mintenig, S.M.; De France, J. Microplastics in freshwaters and drinking water: Critical review and assessment of data quality. Water Res. 2019, 155, 410–422. [Google Scholar] [CrossRef] [PubMed]
- Suran, M. A planet too rich in fibre: Microfibre pollution may have major consequences on the environment and human health. EMBO Rep. 2018, 19. [Google Scholar] [CrossRef]
- Bianco, V.; Memmolo, P.; Carcagnì, P.; Merola, F.; Paturzo, M.; Distante, C.; Ferraro, P. Microplastic Identification via Holographic Imaging and Machine Learning. Adv. Intell. Syst. 2020, 2, 1900153. [Google Scholar] [CrossRef]
- Striemer, C.C.; Gaborski, T.R.; McGrath, J.L.; Fauchet, P.M. Charge- and size-based separation of macromolecules using ultrathin silicon membranes. Nature 2007, 445, 749–753. [Google Scholar] [CrossRef]
- DesOrmeaux, J.P.S.; Winans, J.D.; Wayson, S.E.; Gaborski, T.R.; Khire, T.S.; Striemer, C.C.; McGrath, J.L. Nanoporous silicon nitride membranes fabricated from porous nanocrystalline silicon templates. Nanoscale 2014, 6, 10798–10805. [Google Scholar] [CrossRef]
- Johnson, D.G.; Khire, T.S.; Lyubarskaya, Y.L.; Smith, K.J.P.; DesOrmeaux, J.-P.S.; Taylor, J.G.; Gaborski, T.R.; Shestopalov, A.A.; Striemer, C.C.; McGrath, J.L. Ultrathin Silicon Membranes for Wearable Dialysis. Adv. Chronic Kidney Dis. 2013, 20, 508–515. [Google Scholar] [CrossRef]
- Gaborski, T.; Miller, J.; Striemer, C.; McGrath, J. Highly permeable, transparent and degradable membranes for tissue scaffolding. Microsc. Microanal. 2013, 19, 8–9. [Google Scholar] [CrossRef][Green Version]
- Gaborski, T.R.; Snyder, J.L.; Striemer, C.C.; Fang, D.Z.; Hoffman, M.; Fauchet, P.M.; McGrath, J.L. High-Performance Separation of Nanoparticles with Ultrathin Porous Nanocrystalline Silicon Membranes. ACS Nano 2010, 4, 6973–6981. [Google Scholar] [CrossRef]
- Salminen, A.T.; Zhang, J.; Madejski, G.R.; Khire, T.S.; Waugh, R.E.; McGrath, J.L.; Gaborski, T.R. Ultrathin Dual-Scale Nano- and Microporous Membranes for Vascular Transmigration Models. Small 2019, 15, 1804111. [Google Scholar] [CrossRef] [PubMed]
- Winans, J.D.; Smith, K.J.P.; Gaborski, T.R.; Roussie, J.A.; McGrath, J.L. Membrane capacity and fouling mechanisms for ultrathin nanomembranes in dead-end filtration. J. Membr. Sci. 2016, 499, 282–289. [Google Scholar] [CrossRef]
- Robert, N.C.; Stephanie, M.C.; Andrea, R.M.; Jon-Paul, S.D.; James, A.R.; Thomas, R.G. Ultrathin transparent membranes for cellular barrier and co-culture models. Biofabrication 2017, 9, 015019. [Google Scholar]
- Casillo, S.M.; Peredo, A.P.; Perry, S.J.; Chung, H.H.; Gaborski, T.R. Membrane Pore Spacing Can Modulate Endothelial Cell–Substrate and Cell–Cell Interactions. ACS Biomater. Sci. Eng. 2017, 3, 243–248. [Google Scholar] [CrossRef]
- Wright, E.; Miller, J.J.; Csordas, M.; Gosselin, A.R.; Carter, J.A.; McGrath, J.L.; Latulippe, D.R.; Roussie, J.A. Development of isoporous microslit silicon nitride membranes for sterile filtration applications. Biotechnol. Bioeng. 2020, 117, 879–885. [Google Scholar] [CrossRef]
- Hengstmann, E.; Fischer, E.K. Nile red staining in microplastic analysis—Proposal for a reliable and fast identification approach for large microplastics. Environ. Monit. Assess. 2019, 191, 612. [Google Scholar] [CrossRef]
- Arganda-Carreras, I.; Kaynig, V.; Rueden, C.; Eliceiri, K.W.; Schindelin, J.; Cardona, A.; Sebastian Seung, H. Trainable Weka Segmentation: A machine learning tool for microscopy pixel classification. Bioinformatics 2017, 33, 2424–2426. [Google Scholar] [CrossRef]
- Schindelin, J.; Arganda-Carreras, I.; Frise, E.; Kaynig, V.; Longair, M.; Pietzsch, T.; Preibisch, S.; Rueden, C.; Saalfeld, S.; Schmid, B.; et al. Fiji: An open-source platform for biological-image analysis. Nat. Methods 2012, 9, 676. [Google Scholar] [CrossRef]
- Schneider, C.A.; Rasband, W.S.; Eliceiri, K.W. NIH Image to ImageJ: 25 years of image analysis. Nat. Methods 2012, 9, 671–675. [Google Scholar] [CrossRef]
- Hotaling, N.A.; Bharti, K.; Kriel, H.; Simon, C.G., Jr.; Diameter, J. A validated open source nanofiber diameter measurement tool. Biomaterials 2015, 61, 327–338. [Google Scholar] [CrossRef]
- Snyder, J.L.; Clark, A., Jr.; Fang, D.Z.; Gaborski, T.R.; Striemer, C.C.; Fauchet, P.M.; McGrath, J.L. An experimental and theoretical analysis of molecular separations by diffusion through ultrathin nanoporous membranes. J. Membr. Sci. 2011, 369, 119–129. [Google Scholar] [CrossRef] [PubMed]
- Snyder, J.L.; Getpreecharsawas, J.; Fang, D.Z.; Gaborski, T.R.; Striemer, C.C.; Fauchet, P.M.; Borkholder, D.A.; McGrath, J.L. High-performance, low-voltage electroosmotic pumps with molecularly thin silicon nanomembranes. Proc. Natl. Acad. Sci. USA 2013, 110, 18425–18430. [Google Scholar] [CrossRef] [PubMed]
- Prewitt, J.M.; Mendelsohn, M.L. The analysis of cell images. Ann. N. Y. Acad. Sci. 1966, 128, 1035–1053. [Google Scholar] [CrossRef] [PubMed]
- Stein, R.S. Measurement of birefringence of biaxially oriented films. J. Polym. Sci. 1957, 24, 383–386. [Google Scholar] [CrossRef]
- Carazo-Alvarez, J.; Haake, S.J.; Patterson, E.A. Completely automated photoelastic fringe analysis. Opt. Lasers Eng. 1994, 21, 133–149. [Google Scholar] [CrossRef]


Publisher’s Note: MDPI stays neutral with regard to jurisdictional claims in published maps and institutional affiliations. |
© 2020 by the authors. Licensee MDPI, Basel, Switzerland. This article is an open access article distributed under the terms and conditions of the Creative Commons Attribution (CC BY) license (http://creativecommons.org/licenses/by/4.0/).
Share and Cite
Madejski, G.R.; Ahmad, S.D.; Musgrave, J.; Flax, J.; Madejski, J.G.; Rowley, D.A.; DeLouise, L.A.; Berger, A.J.; Knox, W.H.; McGrath, J.L. Silicon Nanomembrane Filtration and Imaging for the Evaluation of Microplastic Entrainment along a Municipal Water Delivery Route. Sustainability 2020, 12, 10655. https://doi.org/10.3390/su122410655
Madejski GR, Ahmad SD, Musgrave J, Flax J, Madejski JG, Rowley DA, DeLouise LA, Berger AJ, Knox WH, McGrath JL. Silicon Nanomembrane Filtration and Imaging for the Evaluation of Microplastic Entrainment along a Municipal Water Delivery Route. Sustainability. 2020; 12(24):10655. https://doi.org/10.3390/su122410655
Chicago/Turabian StyleMadejski, Gregory R., S. Danial Ahmad, Jonathan Musgrave, Jonathan Flax, Joseph G. Madejski, David A. Rowley, Lisa A. DeLouise, Andrew J. Berger, Wayne H. Knox, and James L. McGrath. 2020. "Silicon Nanomembrane Filtration and Imaging for the Evaluation of Microplastic Entrainment along a Municipal Water Delivery Route" Sustainability 12, no. 24: 10655. https://doi.org/10.3390/su122410655
APA StyleMadejski, G. R., Ahmad, S. D., Musgrave, J., Flax, J., Madejski, J. G., Rowley, D. A., DeLouise, L. A., Berger, A. J., Knox, W. H., & McGrath, J. L. (2020). Silicon Nanomembrane Filtration and Imaging for the Evaluation of Microplastic Entrainment along a Municipal Water Delivery Route. Sustainability, 12(24), 10655. https://doi.org/10.3390/su122410655