Article

PV Monitoring System for a Water Pumping Scheme with a Lithium-Ion Battery Using Free Open-Source Software and IoT Technologies

by
Francisco José Gimeno-Sales
1,
Salvador Orts-Grau
1,*,
Alejandro Escribá-Aparisi
1,
Pablo González-Altozano
2,
Ibán Balbastre-Peralta
2,
Camilo Itzame Martínez-Márquez
1,
María Gasque
3 and
Salvador Seguí-Chilet
1
1
Instituto Interuniversitario de Investigación de Reconocimiento Molecular y Desarrollo Tecnológico (IDM), Universitat Politècnica de València, 46022 Valencia, Spain
2
Departamento de Ingeniería Rural y Agroalimentaria (DIRA), Universitat Politècnica de València, 46022 Valencia, Spain
3
Departamento de Física Aplicada, Universitat Politècnica de València, 46022 Valencia, Spain
*
Author to whom correspondence should be addressed.
Sustainability 2020, 12(24), 10651; https://doi.org/10.3390/su122410651
Submission received: 31 October 2020 / Revised: 16 December 2020 / Accepted: 17 December 2020 / Published: 20 December 2020

Abstract

:
The development of photovoltaic (PV) technology is now a reality. The inclusion of lithium-ion batteries in grid-connected PV systems is growing, and the sharp drop in prices for these batteries will enable their use in applications such as PV water pumping schemes (PVWPS). A technical solution for the monitoring and tracking of PV systems is shown in this work, and a novel quasi-real-time monitoring system for a PVWPS with a Li-ion battery is proposed in which open-source Internet of Things (IoT) tools are used. The purpose of the monitoring system is to provide a useful tool for the operation, management, and development of these facilities. The experimental facility used to test the monitoring system includes a 2.4 kWpk photovoltaic field, a 3.6 kVA hybrid inverter, a 3.3 kWh/3 kW lithium-ion battery, a 2.2 kVA variable speed driver, and a 1.5 kW submersible pump. To address this study, data acquisition is performed using commercial hardware solutions that communicate using a Modbus-RTU protocol over an RS485 bus and open software. A Raspberry Pi is used in the data gateway stage, including a PM2 free open-source process manager to increase the robustness and reliability of the monitoring system. Data storage is performed in a server using InfluxDB for open-source database storage and Grafana as open-source data visualization software. Data processing is complemented with a configurable data exporter program that enables users to select and copy the data stored in InfluxDB. Excel or .csv files can be created that include the desired variables with a defined time interval and with the desired data granularity. Finally, the initial results of the monitoring system are presented, and the possible uses of the acquired data and potential users of the system are identified and described.

1. Introduction

Concern about climate change is growing, and a transformation in the current energy model is needed to achieve a sustainable and efficient energy mix [1]. Renewable energies (REs) and energy storage systems (ESSs) can reduce greenhouse gas emissions as well as dependence on fossil and nuclear energy [2,3]. Wind and photovoltaic (PV) technologies are experiencing worldwide growth due to the low cost of the energy they generate, and they are currently leading the fight against climate change [4,5]. ESSs are expected to develop considerably in the coming years since both wind and PV are intermittent sources [6], and battery storage [7] and pumped hydro energy are emerging as the most implemented solutions for adjusting the profiles of energy generation and energy demand [8]. New trends in grid-connected PV systems include the use of ESSs, such as lithium-ion batteries (LIBs) [9], to increase the share of self-consumed energy in domestic and industrial sectors [10] and to solve problems related to the integration of distributed generation (DG) systems based on REs with conventional electricity grids (these problems include frequency control, active power control, reactive power control, dynamic grid support [11]).
Water needs for human consumption in some regions of developing countries are often covered by auxiliary generators that require a continuous supply of fossil fuel, and this approach encounters various problems—including high fuel prices, difficulty of supply, high maintenance costs, short life expectancy, fuel leakage, noise, and environmental pollution [12].
Photovoltaic water pumping systems (PVWPSs) are an alternative to fossil fuel pumping facilities because, among other reasons, their costs have decreased to levels where PV solutions are cheaper than buying energy from the local power network distributors [13]. Although battery-coupled PVWPS solutions are described in [14], to the authors’ knowledge there are few studies in the literature on this topic. Some references can be found in [13] (2 cases in 108 references), in [15] (1 case in 49 references), and in [16] (3 cases in 97 references). A significant advantage of using batteries in a PVWPS is that they ensure the availability of water at certain times, such as at night, during periods of low solar radiation, and on cloudy days in places where water storage tanks are unavailable [14]. LIB prices are expected to fall sharply due to high demand in emerging applications and economies of scale [10]. This means that PVWPSs and LIBs will soon become an economic solution for meeting water demand. As an example, a comparative cost analysis between a stand-alone direct pumping PV system for irrigation networks and the corresponding system including battery storage was performed in [17]. Additional benefits can be achieved if the excess energy stored in the LIB is used to meet the energy demand of other electrical loads, such as small appliance battery charging or lighting [16,18]. The challenge of combining new energy technologies opens opportunities for the long-term sustainability of humanitarian actions while improving conditions in immigrant, refugee, and displaced people camps, as well as remote populations in developing countries.
The monitoring of PV systems is crucial for supervising, evaluating, maintaining, and improving PV plants. Sizing approaches and models of PVWPSs are refined using the data acquired with the monitoring systems included in these facilities. The monitoring of PV systems has been an important topic in the last decade, as demonstrated by the many works published in the field [19,20,21,22,23,24,25]. These works show that PV monitoring is mainly intended for the following activities:
  • Monitoring, evaluating, and guaranteeing the performance of PV plants [19,20,21];
  • Facilitating the communication, control, and automation of PV plants [20];
  • Enhancing system performance through effective operation and maintenance of systems and early failure detection for greater reliability [22,24];
  • Establishing references for expected performances in a given region [22];
  • Using energy efficiently, taking into account the seasonal, meteorological, and environmental variations to determine whether there is a failure in the facility, or whether it is working correctly [23,25];
  • Establishing PV behavior and obtaining derating ratios across the plant [23];
  • Facilitating other important features such as R&D projects, reporting, system configuration updates, data analysis, and training activities [23].
On this basis, the key research articles on which monitoring systems have been developed are outlined below with their main characteristics and features. PV monitoring systems have evolved with advances in electronic systems, the digitization of the energy systems, and the growth of installed photovoltaic power worldwide. IEC Standard 61724:1998 [26] established guidelines for the measurement, data exchange, and analysis of photovoltaic system performance monitoring. Its revised version, Standard 61724:2017 [27], includes new trends in DG systems in which storage units and other RE sources can be combined with PV modules. Recent works dealing with PV monitoring systems are presented in [19,24,28]. Figure 1 shows a block diagram of a generic PVWPS representing the point at which the following magnitudes can be acquired:
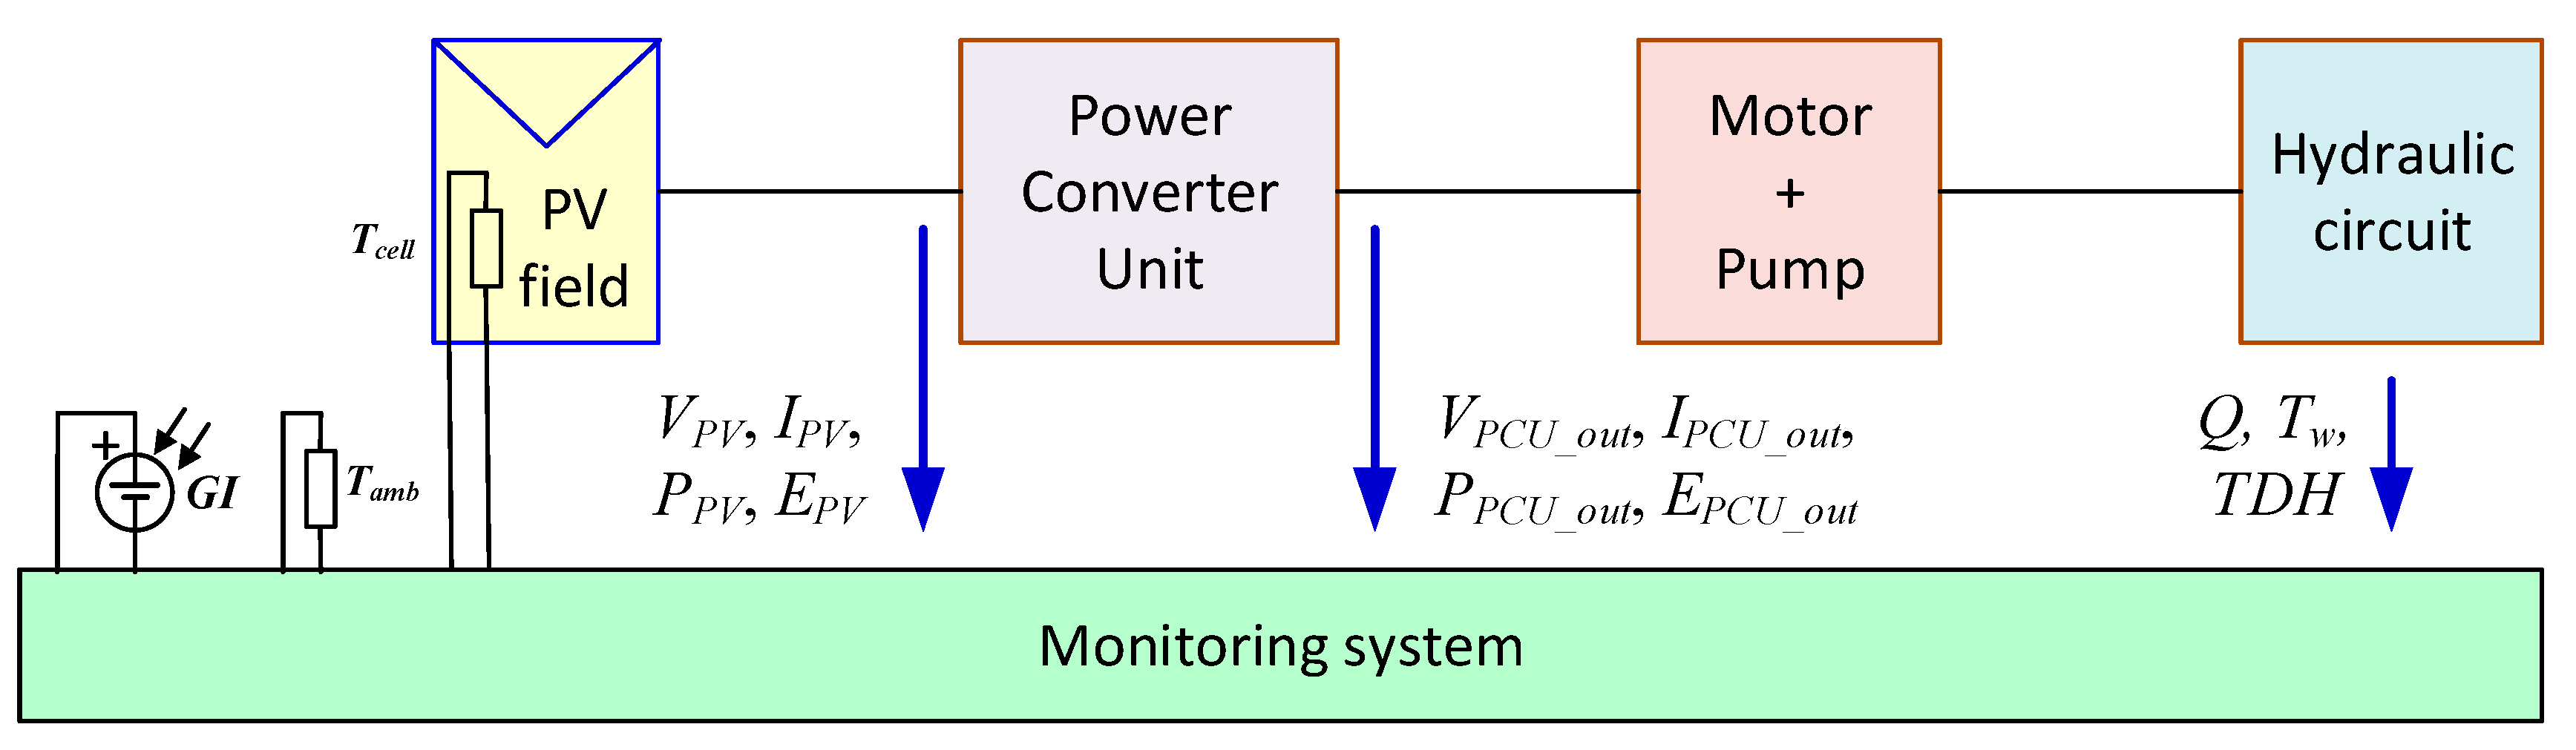
  • Environment: irradiance on the PV plane (GI) and ambient temperature (Tamb)
  • PV field: cell temperature (Tcell), voltage (VPV), current (IPV), power (PPV), and energy (EPV)
  • Power converter unit: output voltage (VPCU_out), output current (IPCU_out), output power (PPCU_out), and output energy (EPCU_out), with the input variables corresponding to the values defined in the PV field
  • Hydraulic circuit: flow rate (Q); water temperature (Tw); and pressure, measured as meter of water column (mwc) and denoted as TDH or total dynamic head
A block diagram of the parts included in a monitoring system is presented in Figure 2. An extended version and some explanations about the devices used in each block can be found in [20]. A description of the most common sensors used in PV monitoring systems—including information about other parts needed in such a system (data acquisition, data transmission, data storage, and data processing)—is presented in [19].
The monitoring system that was described in [29] for a PVWPS used a microprocessor and an analog-to-digital converter (ADC). This monitoring system, developed in 1997, was applied in a PVWPS in Algeria with a PV power equal to 7.5 kWpk. The signals from the sensors (Tamb, VPV, IPV, horizontal and inclined surface GI, sunshine duration, Q, TDH, and tank level) are sequentially sent to the analog-to-digital converter (ADC) via an analog multiplexer. The data are transferred to a personal computer (PC) by means of an RS232 interface. The data are then treated and converted in a PC (data processing stage in Figure 2) that can receive information from several microsystems installed in various PVWPS facilities.
The analog interface circuits that were used to adapt signals from sensors to the data acquisition card were presented in a computer-based monitoring system proposed in 2001 [30]. The PC ran a LabVIEW program to process, display, and store the acquired data. The system was used to monitor a grid-connected system (with 300 Wpk in the PV array and a grid inverter) and a stand-alone hybrid system (with 450 Wpk in the PV array, a 2 kW wind generator, and a 24 V/225 Ah battery, with an inverter to generate the AC voltage demanded by the loads). Measurements were acquired and stored every minute. In addition to the main electrical magnitudes (PV voltages and currents, battery voltage, and current, as well as wind generator voltage and current at the DC output of the three-phase rectifier), the system also included five atmospheric sensors and three soil sensors.
An Internet-based monitoring system for a PVWPS was designed in 2008 using Java programming language [31]. The Internet connection was made through a PC operating as a web server. The serial port of the PC was used to run or stop the inverter used in the PVWPS. A microcontroller was used to manage the signal provided by the analog circuits in the system. Only DC current and voltage were presented in the work; the study did not provide a list or ratings of the devices used in its experimental part.
A low-cost monitoring system with several analog conditioning circuits that adapt signals from the PVWPS sensors (VPV, IPV, GI, Q, and Tamb) to the ADC of a microcontroller was presented in [32]. An external EEPROM memory was used before sending the data to a computer by means of a GSM module, using the short text message service (SMS). The monitoring system was applied in 2010 in two PVWPSs in Tunisia with PV power approximately equal to 3 kWpk and 11.9 kWpk. A graphical user interface (GUI) was implemented for the visualization of the data in a PC.
Another low-cost PV monitoring system based on free hardware and software was presented in [33]. It enabled other parties to develop systems of their own design and use. The portable data logger used an Arduino open-source electronic platform, and it was designed in 2014 to be used in grid-connected and stand-alone PV systems. The microcontroller included in the Arduino board used several data protocols to manage other boards needed to meet all the IEC61724 requirements: These included temperature sensors, current sensors, 18-bit ADC, memory expansion, a real-time clock, and PC communication. The data logger did not need a PC for data acquisition, although the visualization of the data must be made in a PC as no display was included in the system. Data readings were made by the PC using the USB port.
Built in 2016, the monitoring system presented in [34] was oriented to fault detection (short-circuit currents, open-circuit voltage, and partial-shading) during PV plant operation. The experimental test was performed in a 1 kWpk grid-connected PV system that included two strings. A commercial acquisition card connected to a PC through a GPIB bus was used for the data acquisition of VPV and IPV. The fault algorithm also used the data provided by the inverter and a reference solar cell to measure irradiance. Another monitoring system that was also developed in 2016 used Lab-VIEW software for displaying, storing, and processing several parameters in a small stand-alone PV system [35]. The system used a National Instruments data acquisition card and electronic circuits to acquire the following signals: VPV, IPV, and PV power (PPV). The value of GI was calculated from the short circuit current of the PV module used in the installation. The GUI developed in LabVIEW can also present the I–V curve and P–V curve of the PV system under test, which only included a PV module with 26.7 Wpk.
The monitoring system presented in [36] used a Raspberry Pi as microcontroller to collect data for three parameters (VPV, IPV, and Tamb) from a small stand-alone PV system. The system, developed in 2017, used a monocrystalline Si module with 175 Wpk, a pulse width modulated (PWM) charge regulator, a battery, and DC loads, all assembled in a lab in which the sun was simulated by controlled lamps. As in previous monitoring systems, proprietary analog conditioning circuits were used before the ADC sent the data to the Raspberry Pi via an SPI bus protocol. The collected data were displayed graphically on a PC using a GUI-created in Node.js software. Node.js is an open-source cross-platform software that is useful for data-intensive real-time applications that run across distributed devices, permitting access by the monitoring system to any device with an Internet connection if localhost data is known.
Internet of things (IoT) technology was applied in 2017 to the monitoring of a PV plant in [37]. Data acquisition was performed by a TMS320F28335 digital signal processor (DSP) that processed the following signals: VPV, IPV, GI, and Tcell. A ZigBee module was connected to the SCI port of the DSP to transmit the PV data to the data gateway. The data gateway was implemented using a Raspberry Pi 3, where several devices were connected, namely a GPS module (for the geographical location of the PV plant), a ZigBee module, and a USB camera. The Raspberry Pi 3 used the WiFi network to upload the information from the PV monitoring center (PVMC) website. The PVMC was designed using Laravel, a free open-source web framework written in PHP language. The PV data are stored using the open-source MySQL database management platform. An updated version of the monitoring system [21] includes a fault diagnosis algorithm to detect open-circuit, short-circuit, or partially-shaded conditions of the PV array.
A low-cost flexible monitoring system based on open-source cards was applied in 2018 to two grid-connected systems [38]. Flexibility was given by a distributed architecture in which the data acquisition nodes were implemented using an Arduino UNO, including wireless communication. Variables acquired by the Arduino UNO assembled in the PV field node include VPV, IPV, GI, Tcell, Tamb, humidity, and wind speed. Another Arduino UNO was assembled in the grid node to acquire voltage and current in the AC grid (VPCU_out and IPCU_out). Electrical and environmental data were acquired every 30 s. The data gateway used a Raspberry Pi as a server for the wireless communication between the Arduino-based nodes, a PC, and to the Internet. The web-server interface, based on an open-source web app (Emoncms), processed and visualized the data collected from the nodes and enabled the connection of external clients. Experimental results obtained with the proposed low-cost flexible monitoring system presented errors lower than 2% when compared with a different monitoring system developed in LabVIEW. The data obtained with the proposed monitoring system installed in remote PV plants were communicated in [39] to the network server using long range technology.
The 2018 updated version of a commercial monitoring system that communicates with all the devices installed in several grid-connected PV plants was described in [40]. A data logger installed in the PV arrays transmitted the data by means of an RS485 protocol, although Modbus and SCADA protocols were also available. The monitoring system also collected variables from the low-voltage and high-voltage sides of the transformers used in large utility-scale PV plants, as well as from the sensors used in the security system and grid analyzers. Data were stored every three seconds, and various options for displaying the information were offered. Detailed data were provided to service technicians for operations and maintenance (O&M) activities, while users such as owners, investors, and bankers can access more compact information. The monitoring system was implemented using dynamic link libraries (DLL), and thus different hardware and operating systems can be used.
Several monitoring systems with different technical solutions were published in 2019 [5,23,41,42,43]. The monitoring systems for a small-scale microgrid that combined four RE installations (including PV systems and wind generators) were presented in [5]. All the devices mounted in the installation (inverters, energy meters, etc.) communicated through Modbus-TCP/IP protocol to an OPC server. The software was developed in the LabVIEW environment, and the connection with the databases was established using the ODBC driver for Windows. Data storage was made possible in the MySQL platform using an ODBC driver for Windows for the connection with LabVIEW.
The monitoring system in [23] used artificial neural networks, and it was oriented to the real-time control of the PV module performance. The systems identified whether one PV module in the PV plant exhibits a loss of performance due to a fault condition by comparing its output power with a PV reference model implemented with an artificial neural network that considers the set of environmental conditions in each instant and the main characteristics of the PV module used in the installation. The data logger stage acquired the values of VPV and IPV for all the PV modules under test by means of a current sensor and a voltage probe mounted in each PV module. A pyranometer and a temperature sensor were used to acquire the environmental variables (GI and Tcell). The monitoring system was implemented using an ATmega2560 microcontroller kit. The signals of VPV and IPV of each of the PV modules were connected to several analog multiplexers before being acquired by the ATmega2560. A wireless communication was used to transmit the data acquired by the ATmega2560 to the central database stored in a PC. A faulty module alarm was sent if the estimated PV output power and the real PV module output power differ by more than 10%. One microcontroller can monitor up to 96 PV modules, although several microcontroller units can be connected to the system.
A prototype of a monitoring system for stand-alone PV systems using IoT techniques was proposed in [41]. The system was tested in an installation that included a PV field with 363 Wpk, a 12 V battery, a maximum power point tracking (MPPT) charge regulator, and several DC loads. An Arduino Mega2560 board was used to acquire the following variables: VPV, IPV, GI, Tamb, and load voltage and current (VPCU_out and IPCU_out). Although an LCD display showed the monitored data in real time and the system status, a WiFi module was used to transmit the data to the Internet, where a website developed in JavaScript stores and displays the acquired data and the state of the system.
Two grid-connected PV plants were monitored using the data recorded by PV inverters, i.e., 32 microinverters from Enphase and 6 string inverters from SMA [42]. Data from the microinverters were obtained from the webpage of the manufacturer by means of a Python language script. Another script in Python was executed in the Selenium open-source tool to access the web server that was included in each SMA inverter. For the two installations, a custom communication interface made in Node.js established communication between the PostgreSQL database stored in a local server and Amazon Web Services, where all the data were finally stored and displayed through open-source software.
To conclude this report, a 5 kWpk grid-connected PV system was used to verify the operation of an industrial-based electronic monitoring system based on a National Instruments CompactRIO real-time embedded industrial controller [43]. VPV, IPV, VPCU_out, and IPCU_out were stored every second and were used to calculate other variables, i.e., instantaneous, active, reactive, apparent power, and inverter efficiency. A weather station acquired GI, Tamb, Tcell, air humidity, as well as wind speed and direction. The power inverter communicated its internal acquired variables with the CompactRIO through an RS485 bus: VPV and IPV for both stings, and AC output power, current, and power. Data can be displayed in a supervisory screen (with information about the system) and a history screen (past data of the PV plant). The LabVIEW Web Publishing Tool was used to publish both screens on the web. More recently, in 2020, a CompactRIO controller was used in the monitoring system developed to estimate operating parameters and detect faults in a 5 kWpk grid-connected PV system [25].
A low-cost monitoring system that uses IoT devices and cloud computing was used for the supervision of a 555 Wpk domestic grid-connected PV system [44]. The recorded parameters, with sampling and recording intervals of 1 and 60 min, were used to estimate the performance of the PV plant, providing information about the PV plant behavior to the final users. An Arduino Mega 2560 data acquisition card was used to acquire the following variables: VPV, IPV, GI, Tamb, and the AC output variables (VPCU_out and IPCU_out). The data storage was done using ThingSpeak, an open-access IoT platform that permits the analysis and visualization of the data through MATLAB.
In this paper, a quasi-real-time monitoring system for a PVWPS with Li-ion battery energy storage (PVWPS+LIB) is presented. The work shows a technical solution for the monitoring and tracking of PV systems. The project concept started with a request from the Global Solar and Water Initiative at the IOM (International Organization for Migration) and is aligned with the Sustainable Development Goals set out by the United Nations 2030 Agenda. Data acquisition and transmission parts are implemented using commercial devices. The data storage and processing parts of the proposed system are based on the use of free open-source software and IoT technologies. A free open-source process manager launches the execution of the PV monitoring application and automatically restarts the application in case of program malfunction, thereby increasing the robustness and reliability of the monitoring system. An important feature of the proposed system is the variable acquisition frequency, which enables recording a large number of variable signals in intervals in the range of seconds. This high-speed acquisition enables using the proposed monitoring system in the development and improvement of power converters in RE systems. The developed system can communicate with other commercial monitoring systems that use a Modbus-RTU protocol on an RS485 bus. Results obtained in the first months of operation demonstrate how the monitoring system is useful to R&D engineers, service technicians for O&M activities, and economic decision makers (such as owners, investors, and bankers).
The article is organized as follows. Section 2 details the main features of the PVWPS+LIB facility. Section 3 details the monitoring system assembled in the PVWPS+LIB facility. Section 4 presents the results obtained with the proposed monitoring system. Finally, the findings on the main contributions of this work are presented.

2. Description of the PVWPS+LIB Facility

To monitor and carry out data acquisition that enables LIBs to be used as support in PVWPS, a small PVWPS+LIB prototype was built and monitored at the Universitat Politècnica de València (latitude 39.483, longitude −0.345).

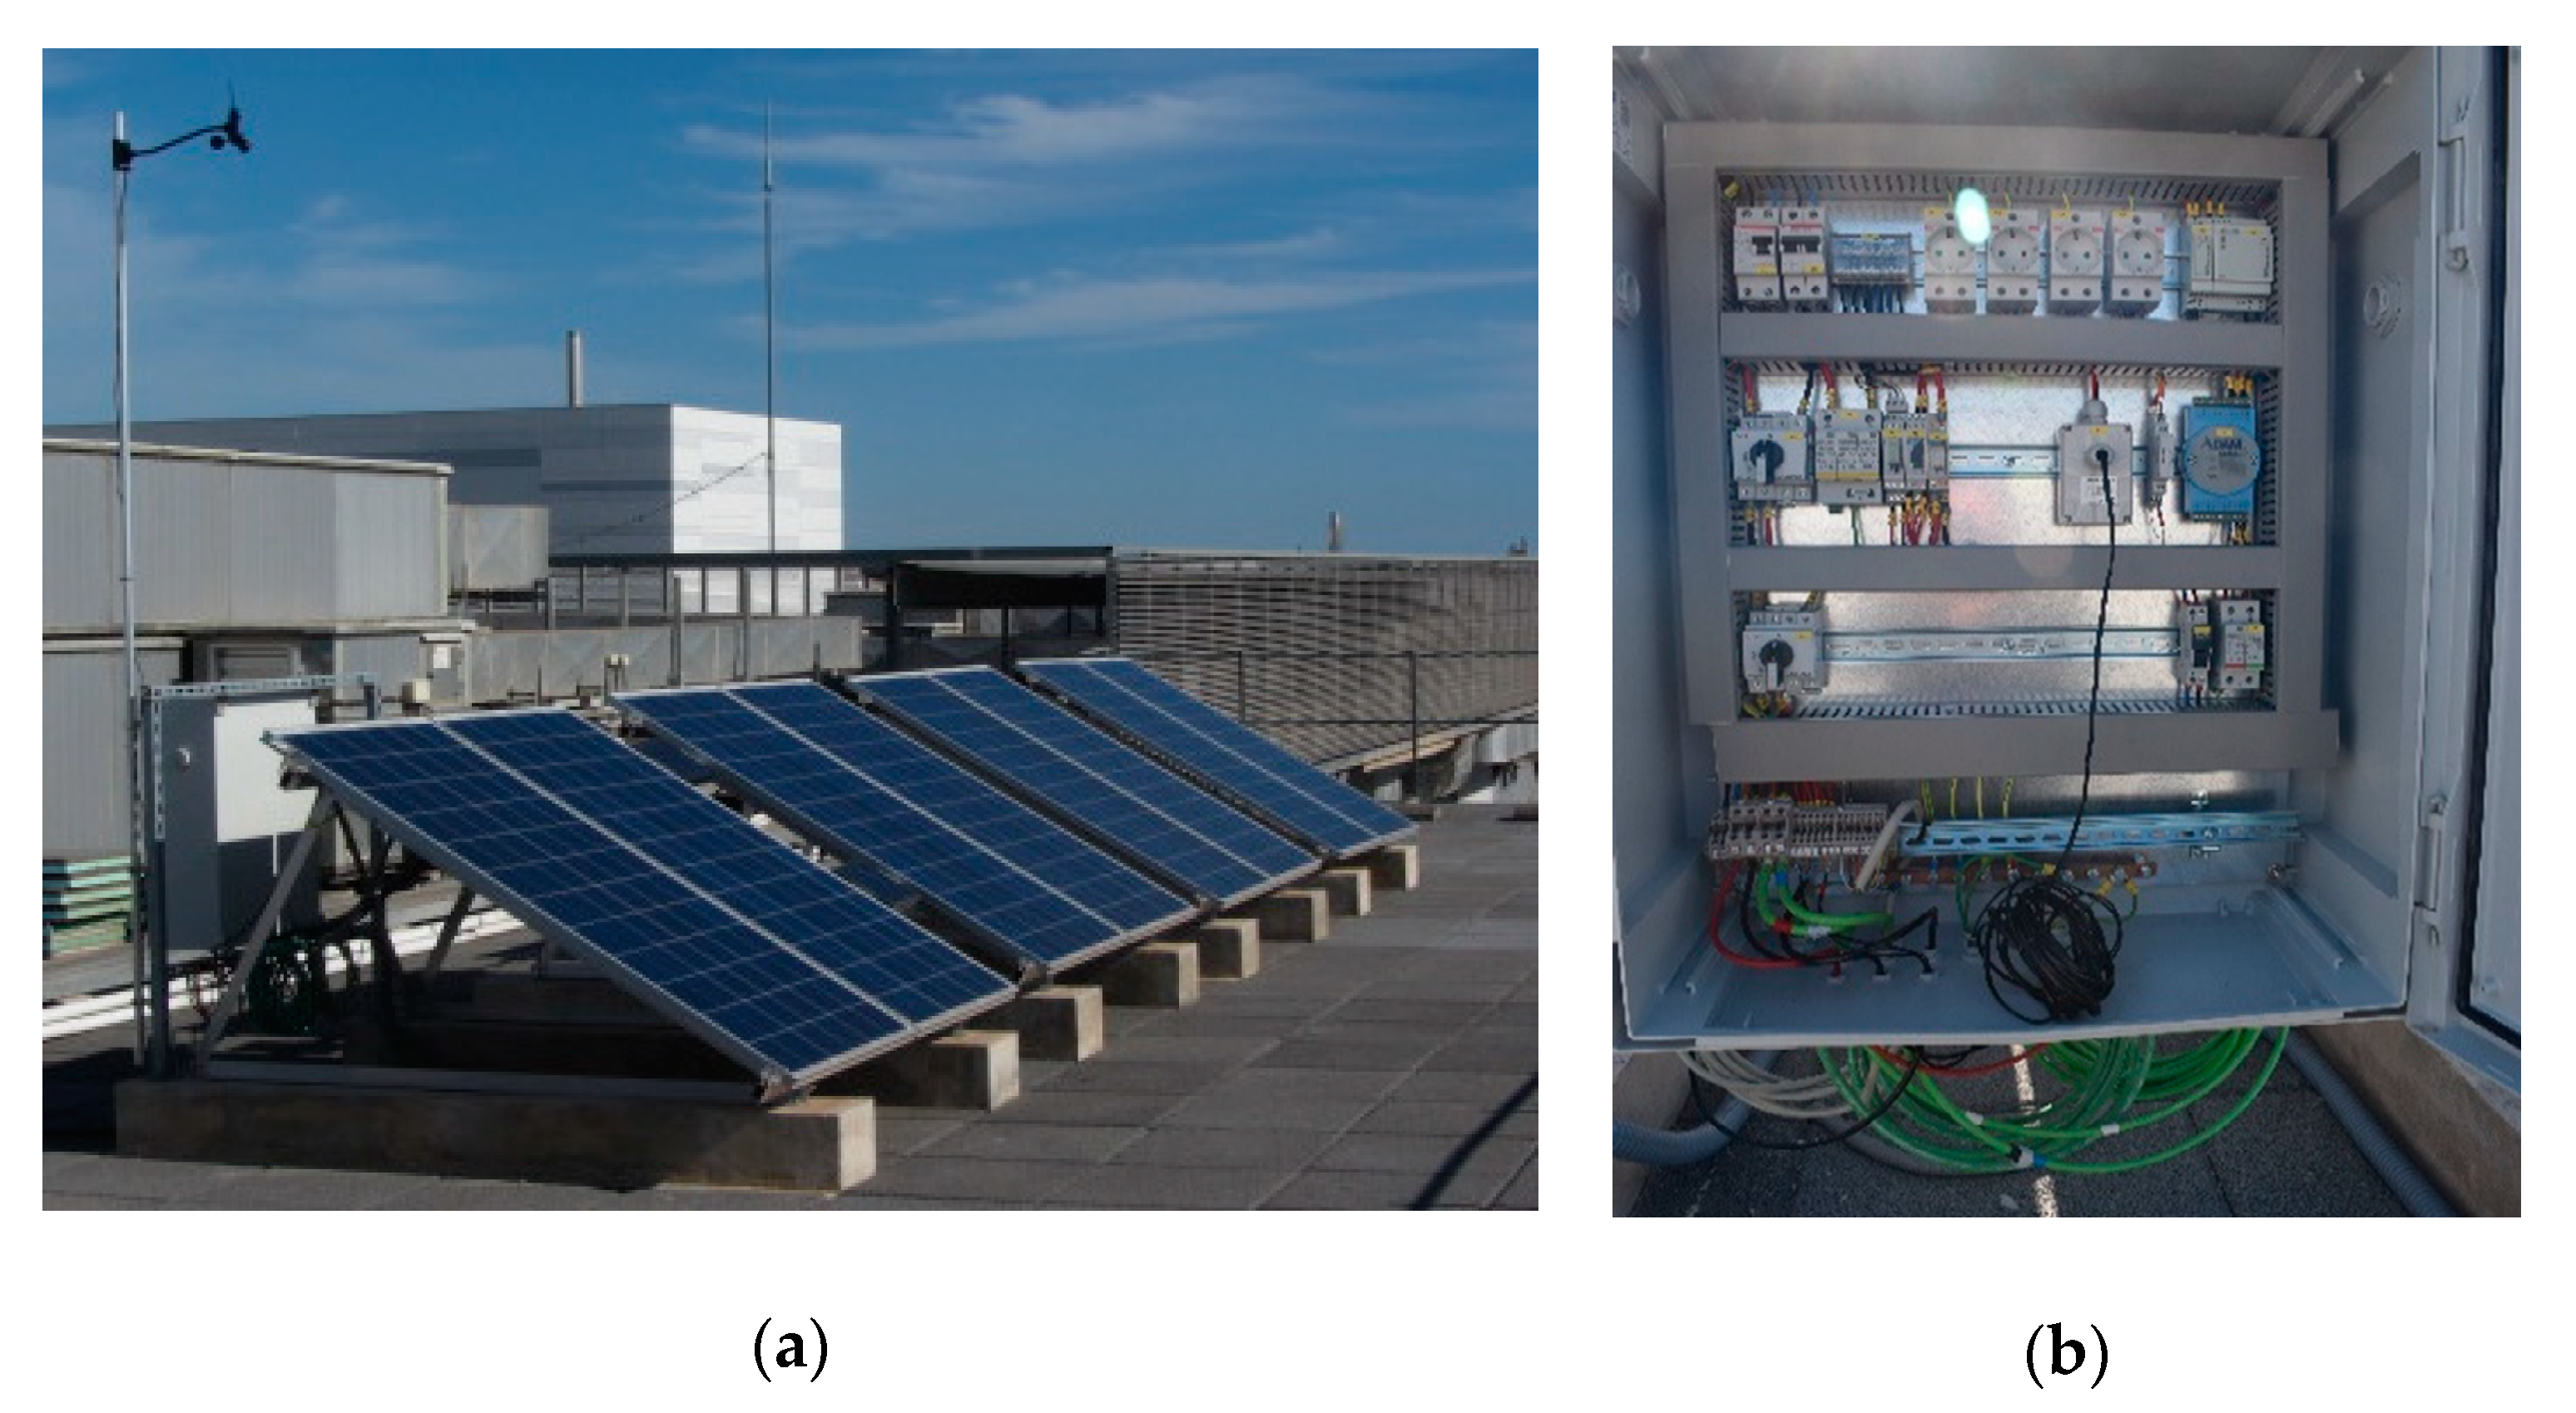
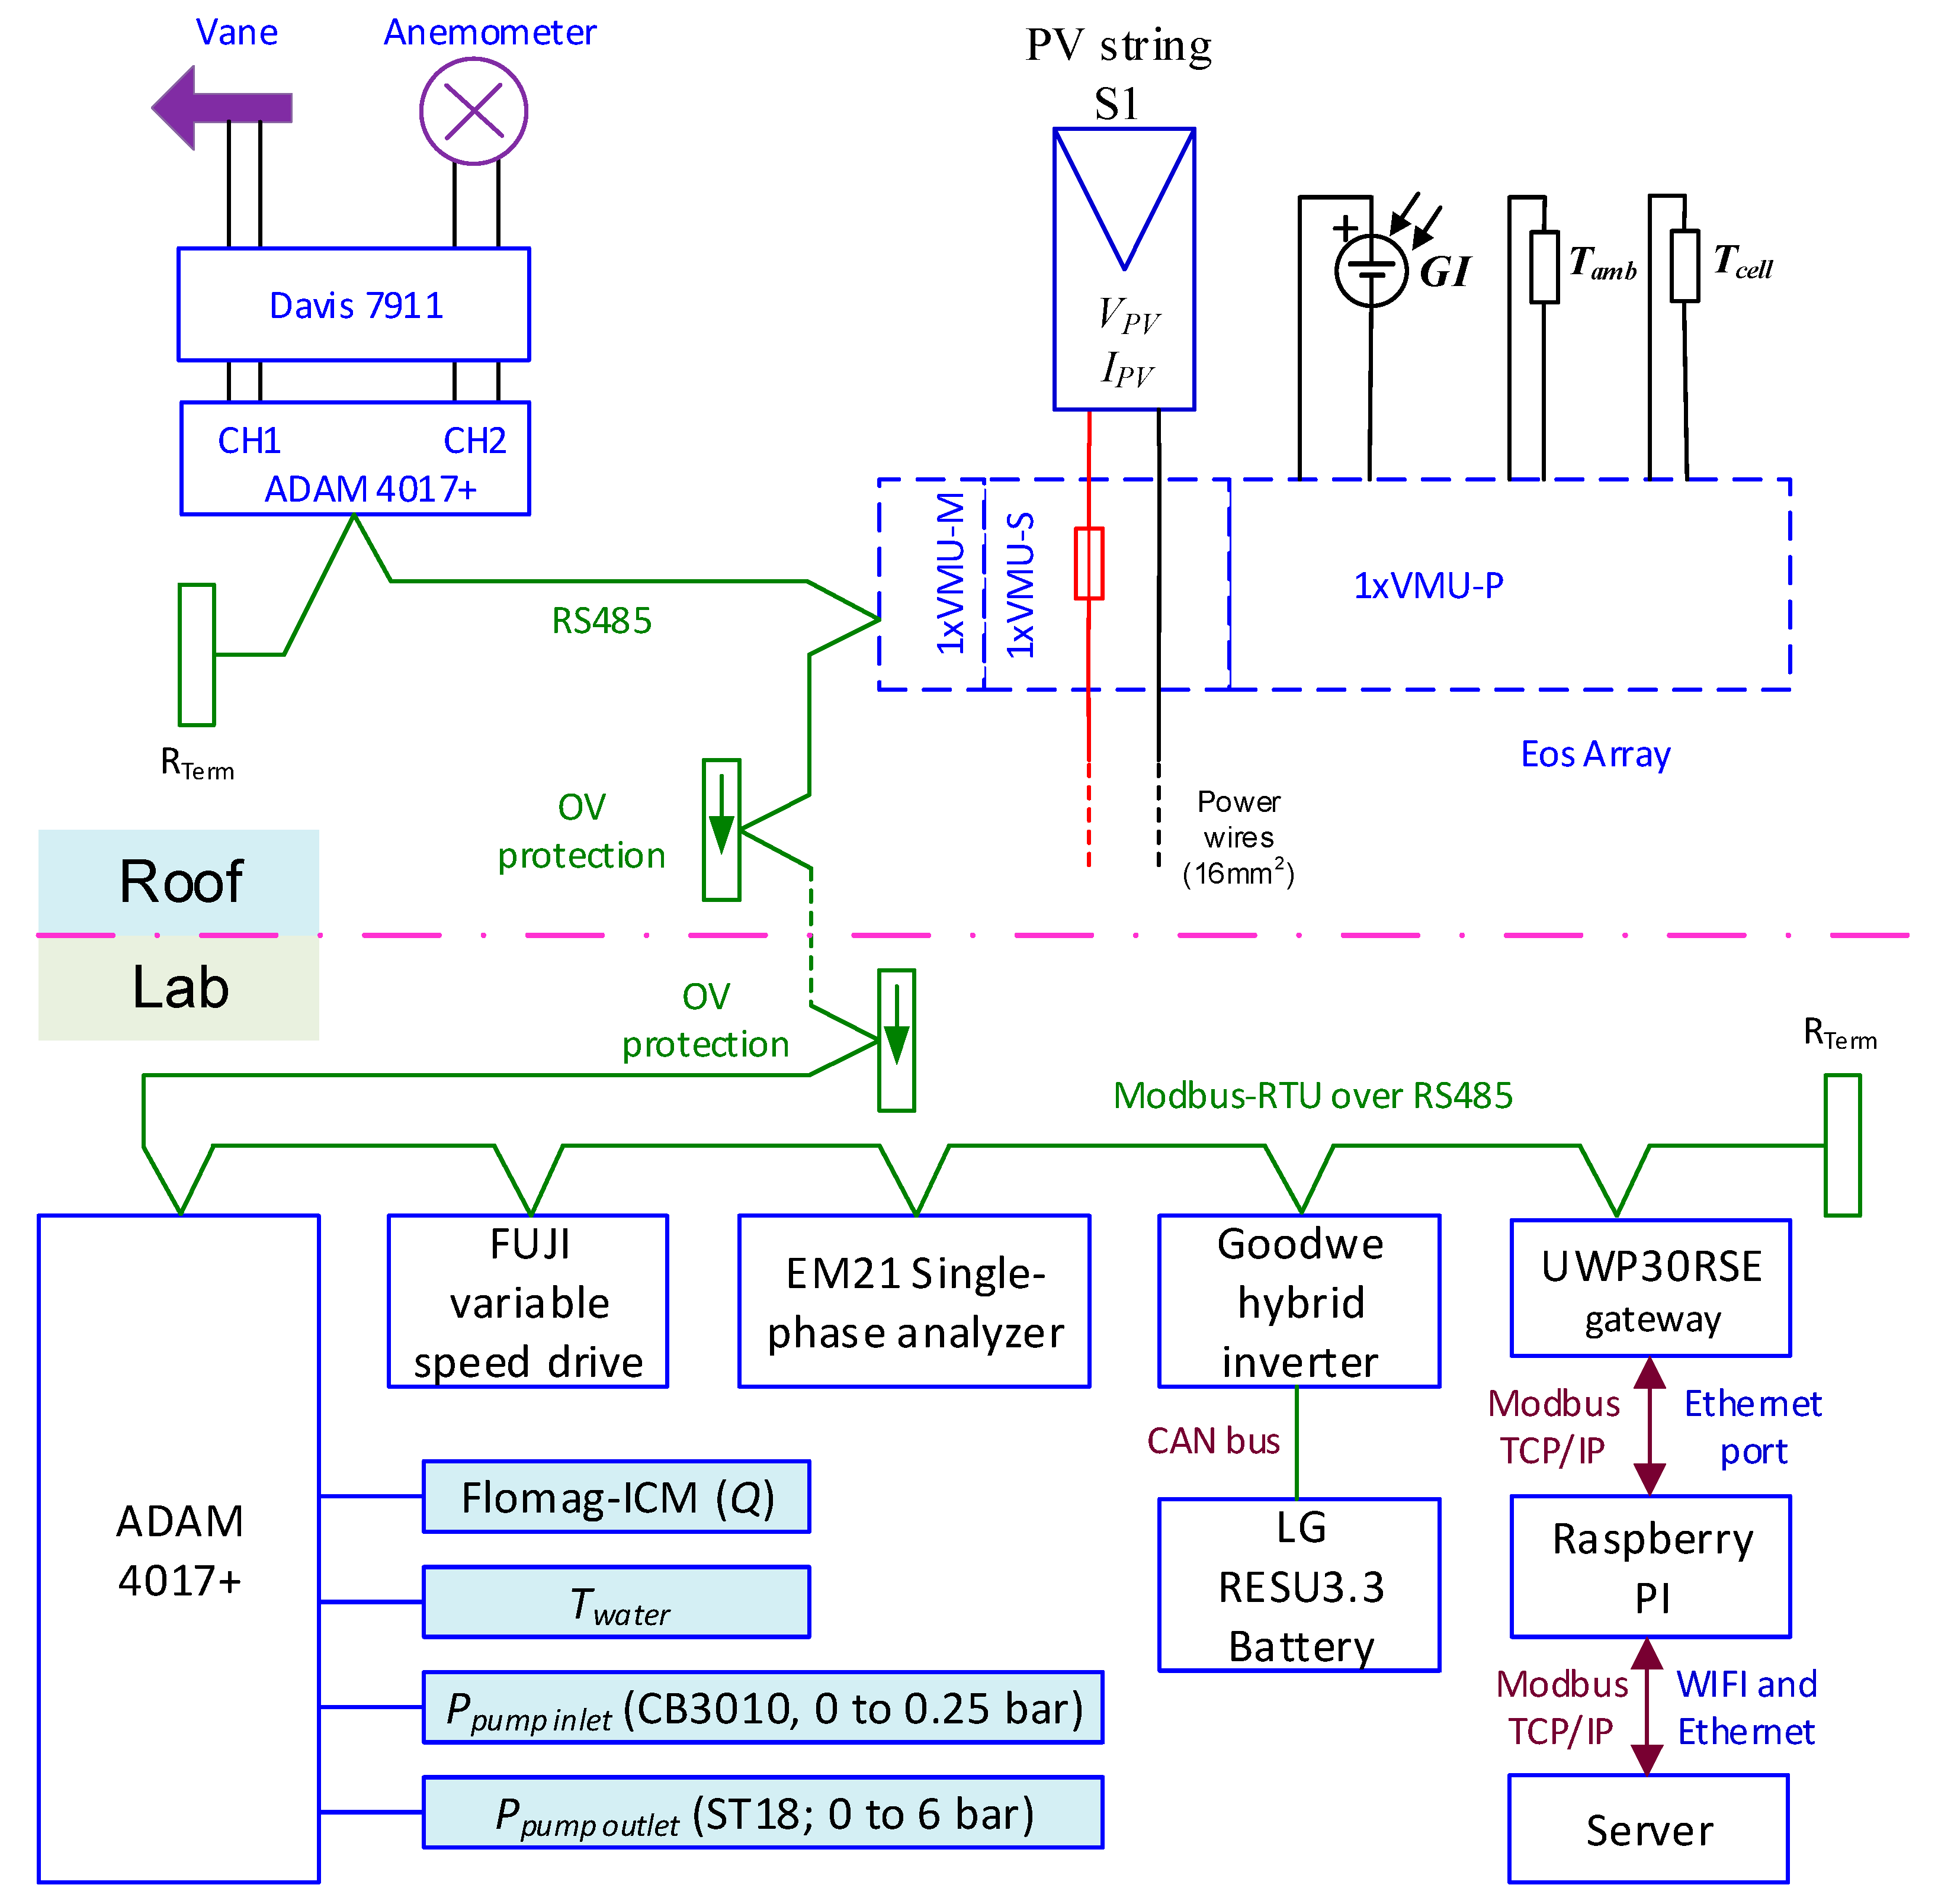
2.1. System Installed on the Building Rooftop

The PVWPS+LIB facility has eight polycrystalline PV modules of 305 Wpk and is located on the west roof of the building, tilted 30º and facing south, in conditions that optimize annual energy production (Figure 3a). The eight modules are connected in series and provide the values shown in Table 1 under standard test conditions (STC).
Just behind the modules, an IP65 electrical enclosure was arranged with several devices necessary for monitoring the system (Figure 3b). The balance of system (BOS) components are the following:
  • DC protections: disconnector, fuses, and surge discharger
  • AC power connection at 230 V and 50 Hz for the electronic circuits
  • An anemometer (wind speed or ws, measured in km/h) and vane (wind direction, measured in degrees), placed 2 m above the PV array and integrated into the Davis 7911 model. The 4−20 mA outputs are connected to an ADAM 4017+ for transmission through a wired RS485 communication protocol. Minimum accuracy in the current measurements is equal to ± 0.2% [45].
  • An Eos Array PV monitoring system from Carlo Gavazzi [46] is used; the solution includes the following:
    Measurement of voltage and current of the PV string (VPV and IPV) with a VMU-S unit. Current range reaches up to 16 A (for 40 °C), with a maximum DC voltage of 1000 V. For both variables, the accuracy is ± (0.5% RDG + 2 DGT). The PV power and energy are calculated by the VMU-S unit with an accuracy equal to ± (1% RDG + 2 DGT) for the power and ± (1% RDG) for the energy.
    Cell temperature (model TEMPSOL1000) and ambient temperature (model IKE20001K) by means of a Pt1000 RTD connected to a VMU-P unit (1000 Ω @ 0 °C). The tolerance ranges from ±0.3 °C at 0 °C to ±0.8 °C at 100 °C according to EN60751.
    Irradiance sensor on the plane of the PV field, measured with a CELLSOL 200 connected to the VMU-P unit. The sensor range is from 0 to 1500 W/m2, with an accuracy of ±5% as an annual average. The sensor presents a linear variation in this range, with a scaling factor of 79.6 mV for 1000 W/m2 provided by the manufacturer after the calibration of the sensor.
    A VMU-M unit that performs the local bus management of the measuring units (VMU-S and VMU-P) operates as a data logger and communicates data in response to server polls via a Modbus-RTU protocol over an RS485 bus.
An irradiance sensor is mounted in the top side of the hole after the first group of two PV modules in Figure 3a, and it is attached over the aluminum bars that support the modules, with the same orientation and tilt as the PV modules. The cell temperature is measured on the second module shown in Figure 3a, which is fixed to the back sheet of the PV module, in the center of a PV cell in the center of the module (approx.). Ambient temperature is measured in the space between the first group of PV modules and the electrical enclosure located behind them. All these sensors are located in this part, near the electrical enclosure, due to the limited length of the wires included with these sensors.

2.2. System Installed in the Hydraulics Laboratory

The remaining components of the PVWPS+LIB system are arranged in the lab on the ground floor of the building and were 186 m from the PV modules. Positive and negative cables of the PV field and an RS485 communication cable cover this distance. The electrical panel in the lab (Figure 4(a2)) includes the components needed for the correct and safe operation of the power converters and monitoring system (as detailed in the following paragraphs). DC protections (disconnector, fuses, and surge discharger) and AC protections (automatic circuit breaker and residual current device) are included in the lab electrical panel together with other electrical devices (disconnectors, power terminals, and AC/DC power supplies) as well as some parts of the monitoring system (energy meter, current sensors, data logger, monitor gateway and controller, etc.). The electrical and electronic components assembled in the lab include the following:
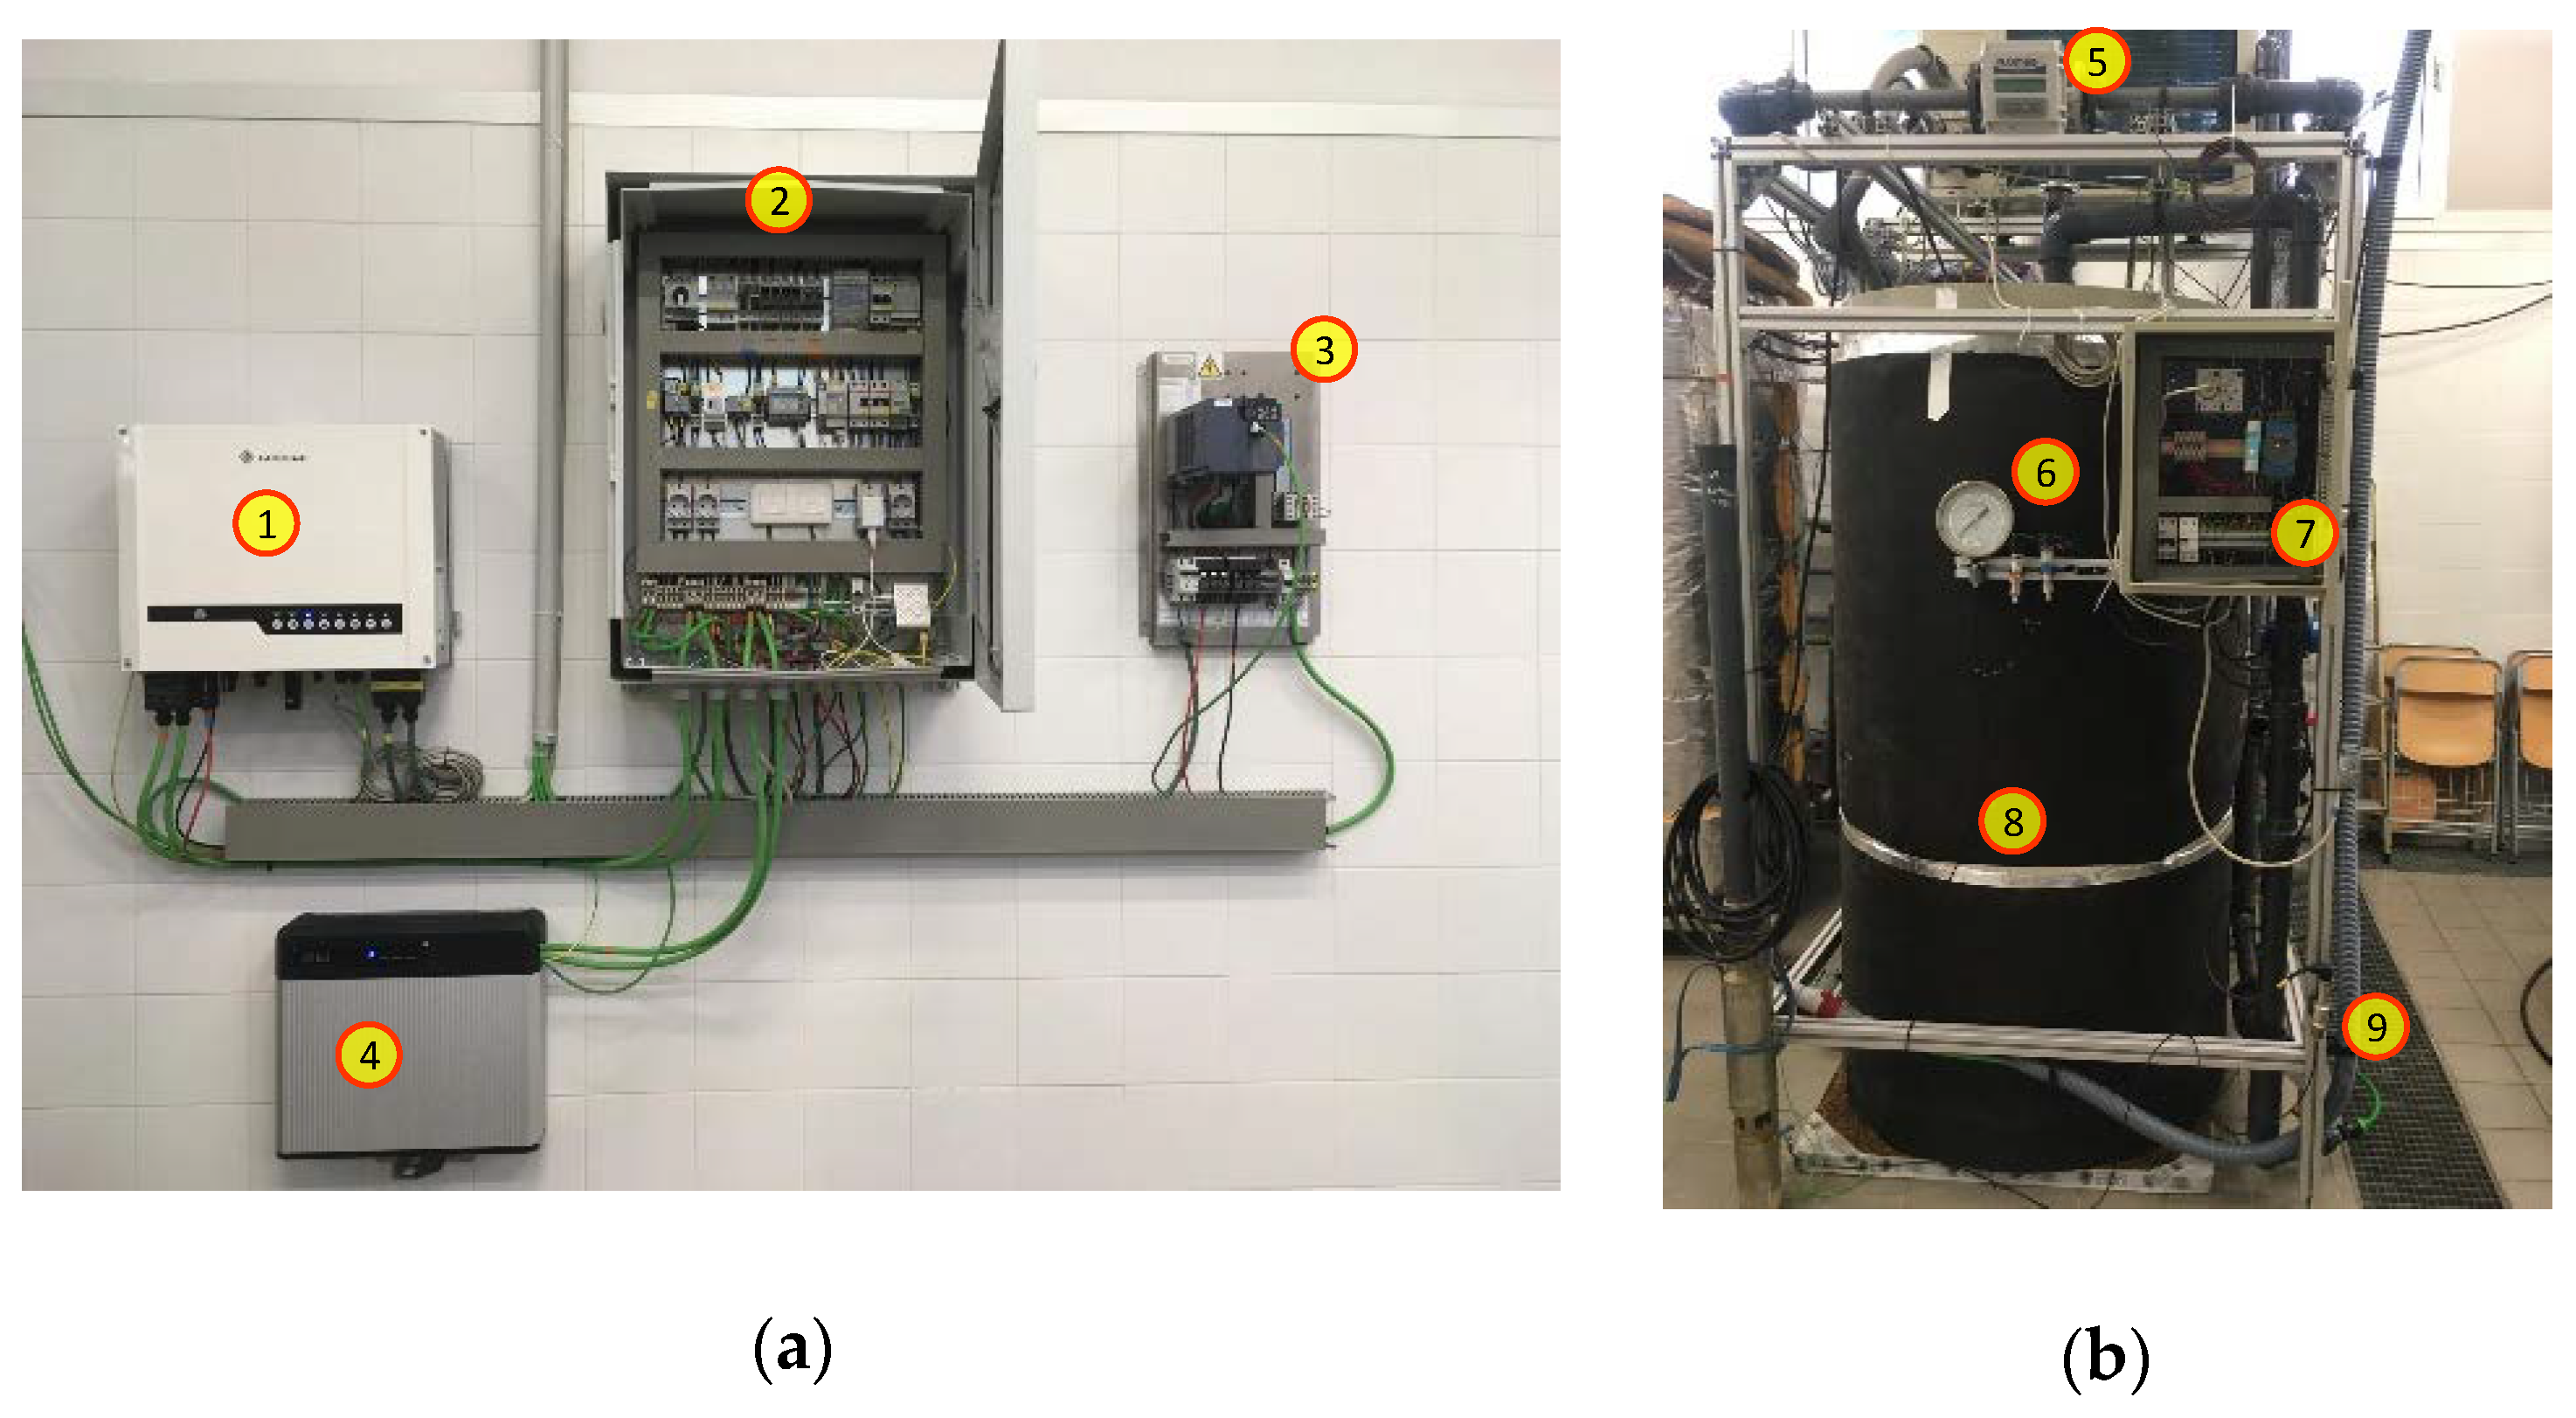
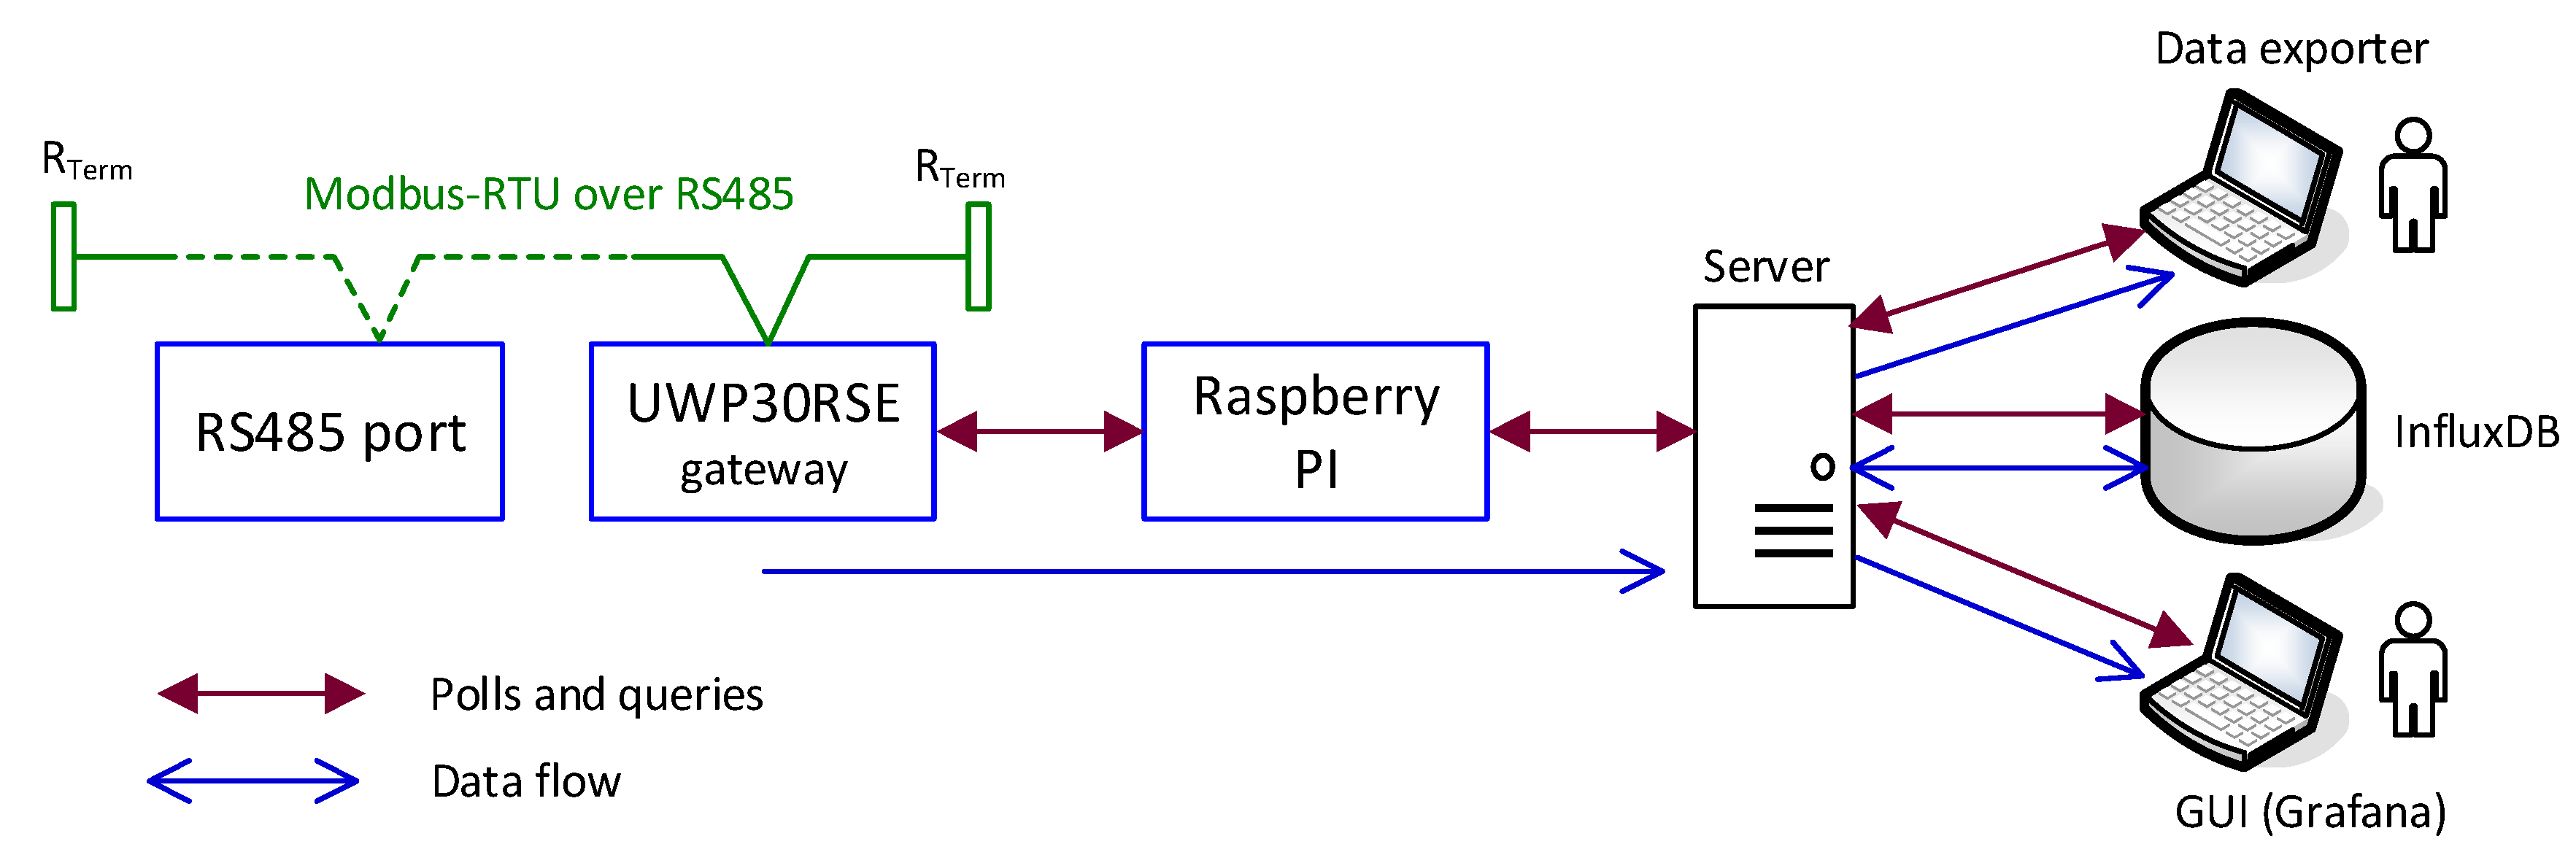
  • An electrical panel that establishes the connection between the PV system arranged on the roof of the building and the other system components, including a connection to the electrical power network (Figure 4(a2)). The electrical panel also includes a UWP 3.0 unit that monitors the devices connected to the RS485 local bus via a Modbus-RTU protocol [47].
  • A GW3648D-ES hybrid grid-connected inverter from Goodwe, with a rated apparent power of 3680 VA in the two AC outputs (on-grid output and backup output) and up to 5520 VA for 10 s in the backup AC output (Figure 4(a1)) [48]. Data provided by the inverter through the Modbus have the following resolutions: 0.1 V, 0.1 A, 1 W, 0.1 kWh, 0.01 Hz, 0.1 °C, 1% for all percentual values (SOC, PF, etc.).
  • A lithium-ion battery from LG, model RESU3.3 with 3.3 kWh of total stored energy, 3.3 kW of peak power delivered for 3 s, and a rated voltage of 51.8 V (Figure 4(a4)) [49].
  • A PVWPS controller, model ESP-2.2/230-IP20-F200, supplied by Atersa and which includes a Fuji Electric variable speed driver (Frenic-ACE model FRN0008E2E-7GA), as well as the control and protection circuits necessary to implement a PVWPS (Figure 4(a3)) [50]. This system supports two different power sources: a DC input from a PV field, or a 230 V and 50 Hz single-phase AC input from a conventional electrical grid or auxiliary group. Data provided by the variable speed drive (VSD) through the Modbus have the following resolutions: 1 V, 0.01 A, 0.01 Hz, 1 °C, 0.01% for all percentual values (load factor, input power respect to nominal motor output, etc.).
  • A 1.5 kW SMI 8 submersible pump, supplied by Bombas Ideal [51]. The submersible pump is in the water tank (Figure 4(b8)) behind the hydraulic sensors and the electrical panel (Figure 4(b6) and Figure 4(b7), respectively).
  • An electrical panel (Figure 4(b7)) with the elements for the acquisition of the signals provided by the sensors of the hydraulic system: flow rate (Figure 4(b5)), pressure (Figure 4(b6,b9)), and temperature (in the water tank). All the sensors provide a 4–20 mA analog output signal connected to the second ADAM 4017+, which is connected to the RS485 bus.

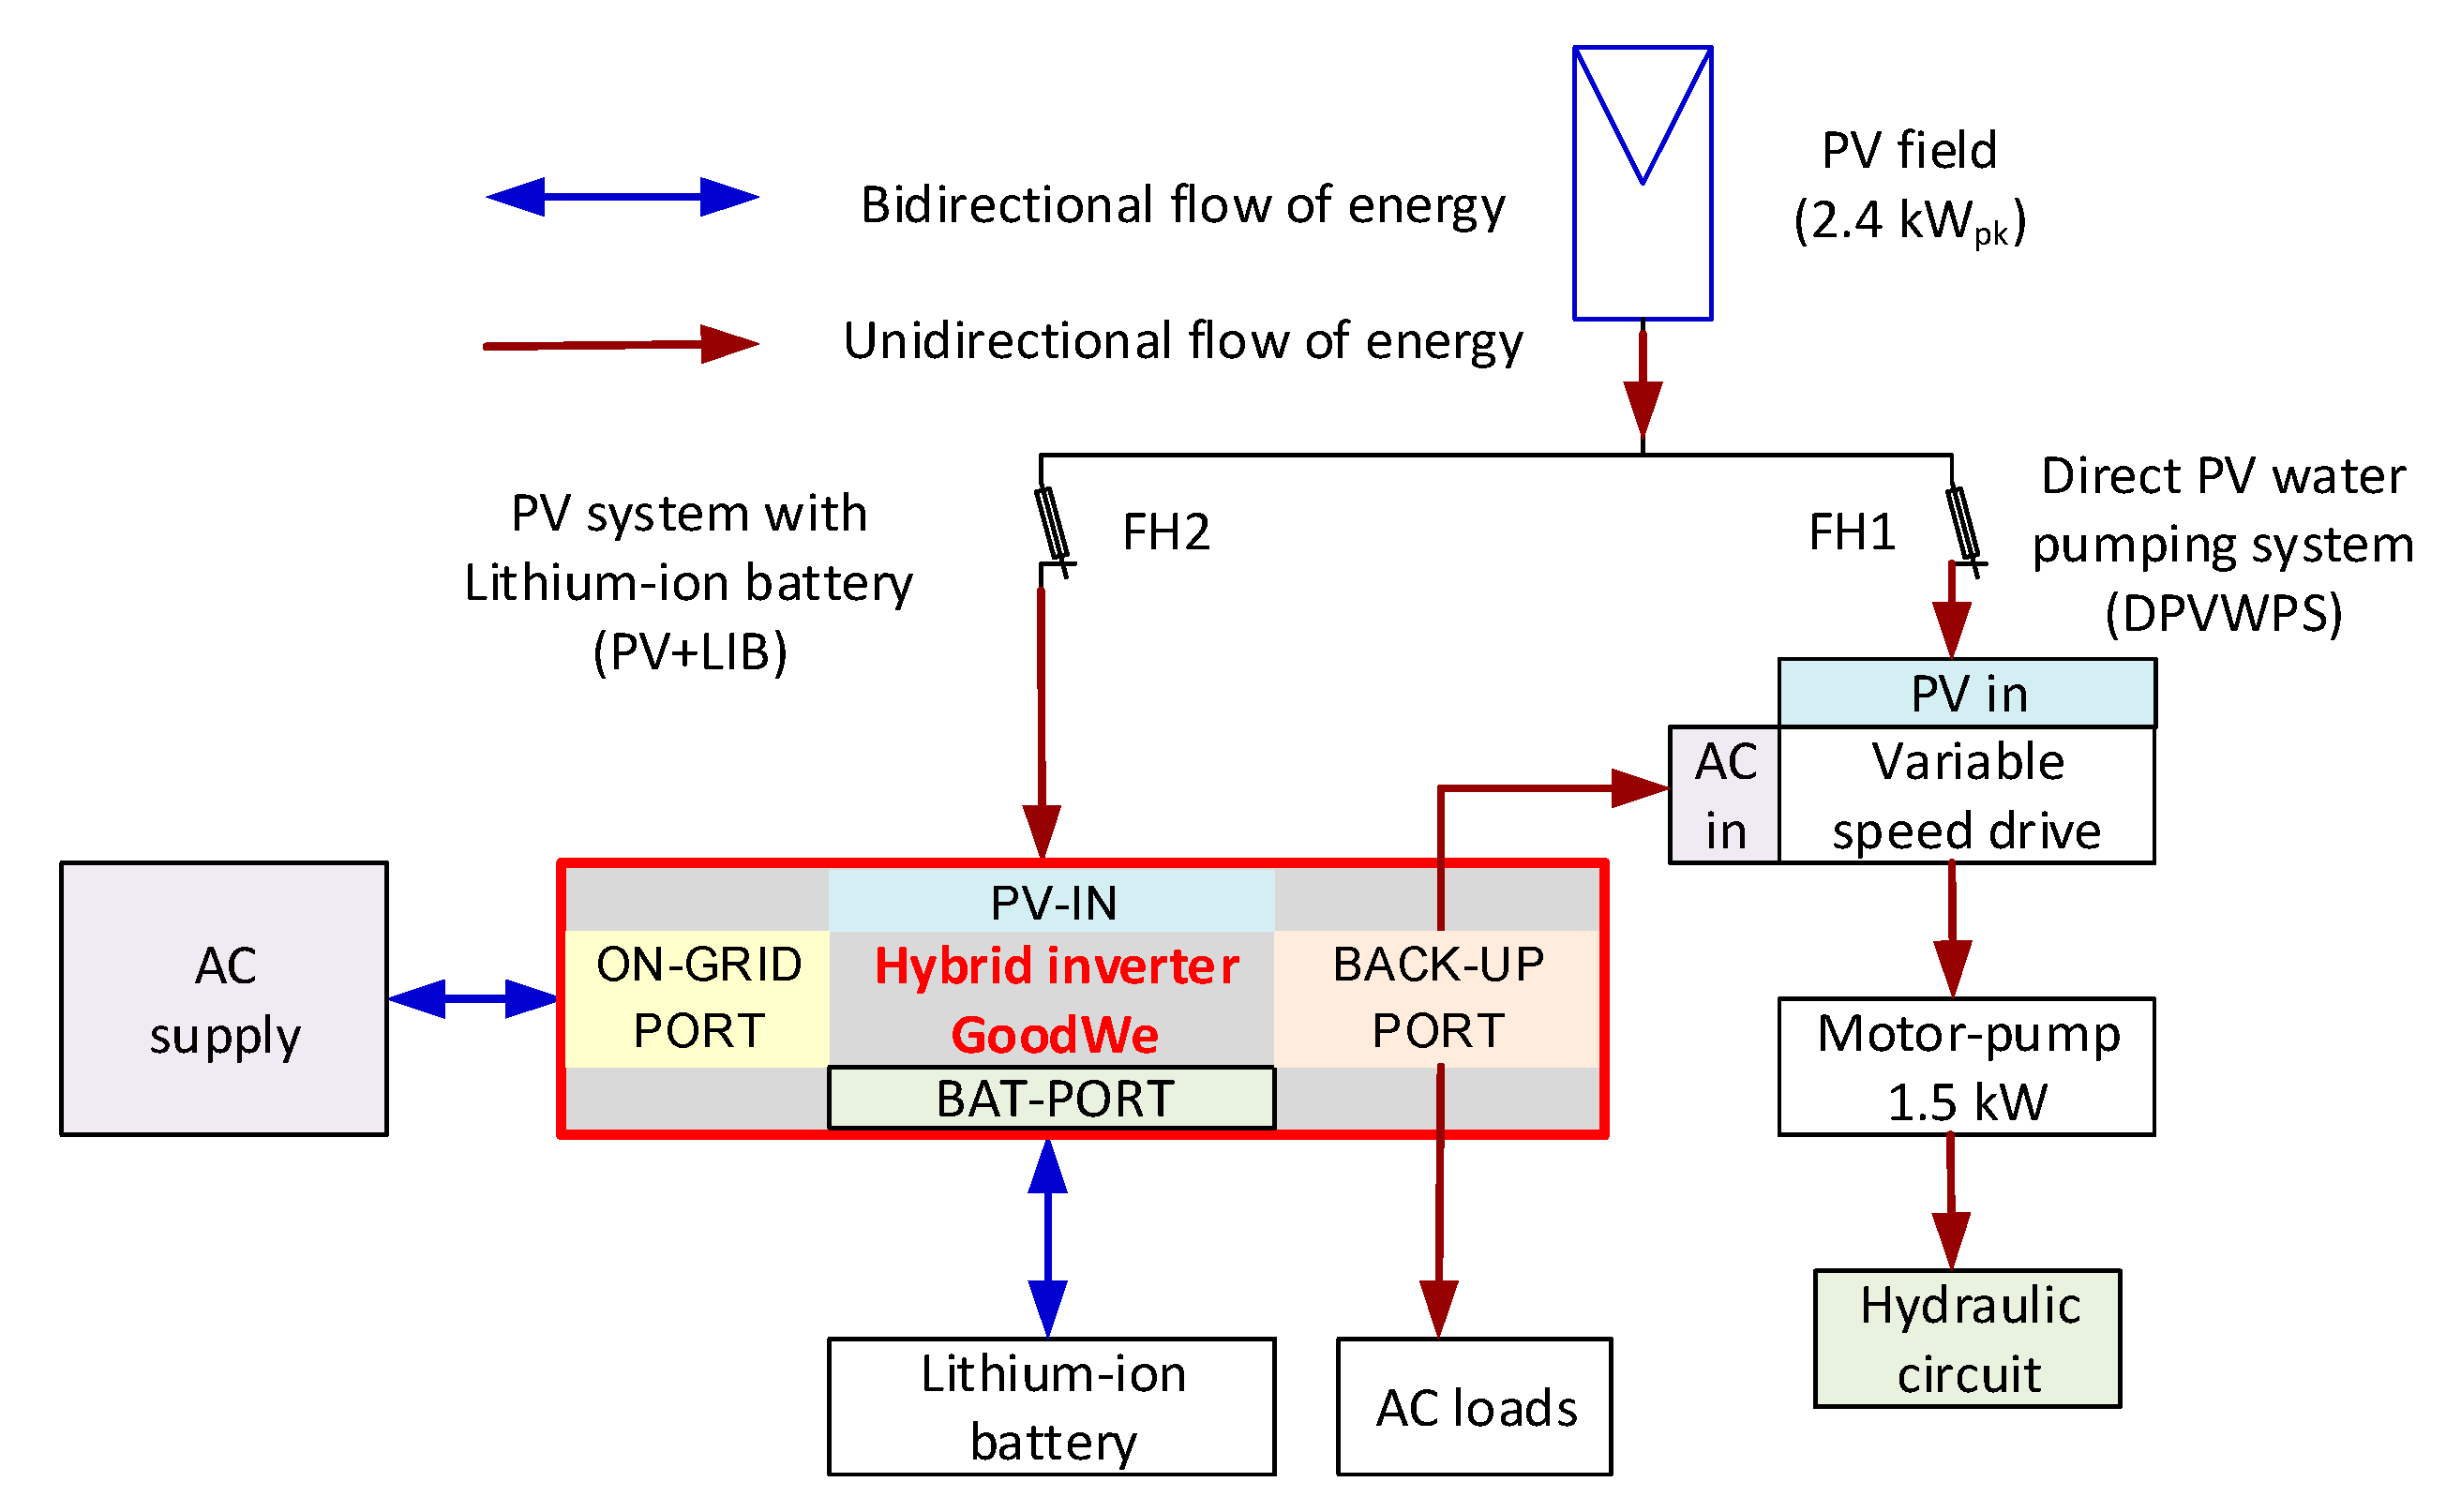
2.3. Operating Modes of the PV Facility

Figure 5 shows the block diagram of the PV facility, including information about the flows of energy between the different components of the installation. By means of the fused disconnect switches included in the lab electrical panel, the following modes of operation of the PV facility can be manually selected:
  • Direct PVWPS (DPVWPS): The PV field is connected to the DC input of the variable speed drive (VSD). The battery and the hybrid inverter are not used in this configuration.
  • Stand-alone PV system with lithium battery storage: The PV field is connected to the PV input of the GW3648D-ES hybrid inverter. The inverter is configured to work in off-grid mode (isolated network installation), and the power of the PV field is used to power the AC loads connected to the backup output and to recharge the battery. The inverter manages the operating point of the PV field to balance energy consumption and generation. It may be the case that the PV field does not generate energy if there are no loads connected and the battery is charged. A PVWPS+LIB system is implemented when the AC input of the VSD is connected to the backup output of the hybrid inverter.
  • Grid-connected system for self-consumption with lithium battery storage: This system is very similar to the previous one, but the AC-grid output of the hybrid inverter is connected to the AC power network of the lab, and therefore the PV field will always work at the maximum power point (MPP). The excess energy not used by the loads, or by the battery, is injected into the grid. In this case, the VSD that controls the submersible pump is connected to the backup output of the GW3648D-ES hybrid inverter, as well as other critical loads that may exist in the installation.
To analyze the behavior of each system and compare the results obtained with the different working configurations, several measuring devices are included in the lab:
  • An EM21072 network analyzer [52]. The meter uses a Hall effect current sensor in the AC current transformer (model CTD1X605A [53]) and is connected to measure the electrical parameters in the AC supply (point of connection of the PV system with the grid): RMS voltage, active power, reactive power, etc.
  • An electromagnetic flowmeter FLOMAG-ICM DN32 (error < 0.5% for flow rate between 0.0804 and 8.042 L/s) [54], mounted in the output of the submersible pump (Figure 4(b5)).
  • A temperature sensor Thermophant T TTR35 for measuring water temperature in pipes (total error ≤ 0.5 K) [55].
  • A class 1 T-type thermocouple for measuring water temperature in the tank that contains the submersible pump [56]. The thermocouple is connected to a temperature transmitter that generates a 4–20 mA signal proportional to the temperature (accuracy ± 0.1 °C of temperature measurement after calibrating) [57].
  • Pressure transmitters: Several devices with different ranges are used. A CB3010 unit (Figure 4(b9)), with a 0–250 mbar range, is used to measure the reference water level in the tank where the submersible pump is located [58]. A ST18 unit (Figure 4(b7)), with a 0–6 bar range, is used to measure the TDH at the pump outlet [59]. All pressure sensors have an accuracy ≤ 0.5% of the measurement range.
The lab where the PVWPS+LIB system was mounted also offers the possibility of modifying the hydraulic circuit to carry out different types of tests: pumps, TDH, pumping conditions, etc. The pump propels the water from the water tank placed in the lab through a pipe to a fiberglass water tank (2000 L capacity) located on the roof terrace 15.1 m above the lab floor with an overflow that guarantees a constant level of water of 1.5 m in the tank. The overflow water returns to the tank with the pump located in the lab.

3. Monitoring System of the PVWPS+LIB Facility

The monitoring system presented in this article proposes the use of free open-source software tools for the monitoring control part. The hardware part of the monitoring system was built using the commercial devices described in the previous section plus an embedded system (Raspberry Pi) and a database (DB) server, as depicted in Figure 6. Communication between data acquisition nodes is carried out through a wired RS485 communication protocol. Several communication protocols are used in the proposed monitoring system: Modbus-RTU, TCP/IP, and WiFi [28]. From the point of view of data users, the monitoring system includes general information about the PVWPS+LIB system in an open web portal with access only available for registered users who can download the acquired data, or customize the GUI that produces plots and charts of the acquired signals.

3.1. Hardware of the Monitoring System

A commercial universal web platform, the UWP 3.0, operates as a communications gateway between all the devices connected through a Modbus-RTU over the RS485 and the data acquisition system (that uses a Modbus TCP/IP), as shown in Figure 6 with green lines. All the devices without RS485 output are connected to an ADAM 4017+ unit, a 16-bit universal analog input module with Modbus output [45]. The ADAM 4017+ has 8 input channels that can be configured in accordance with the sensor characteristics: 4–20 mA, ±150 mV, etc.
Although the UWP3 can be used as a web server, including a GUI, it was decided to connect its Ethernet port to an embedded system (Raspberry Pi), which connects to the university network via a WiFi connection. The Raspberry PI operates over the Modbus TCP/IP protocol as a client of the UWP3 and sends the data to a DB server with a sampling rate that can be adjusted depending on the type of experiment to be performed, with the option of choosing sampling times from five seconds. Data gathered by the Raspberry PI and transmitted via its WiFi port are received in the server via the university Ethernet network. The block diagram of the monitoring system is shown in Figure 7.

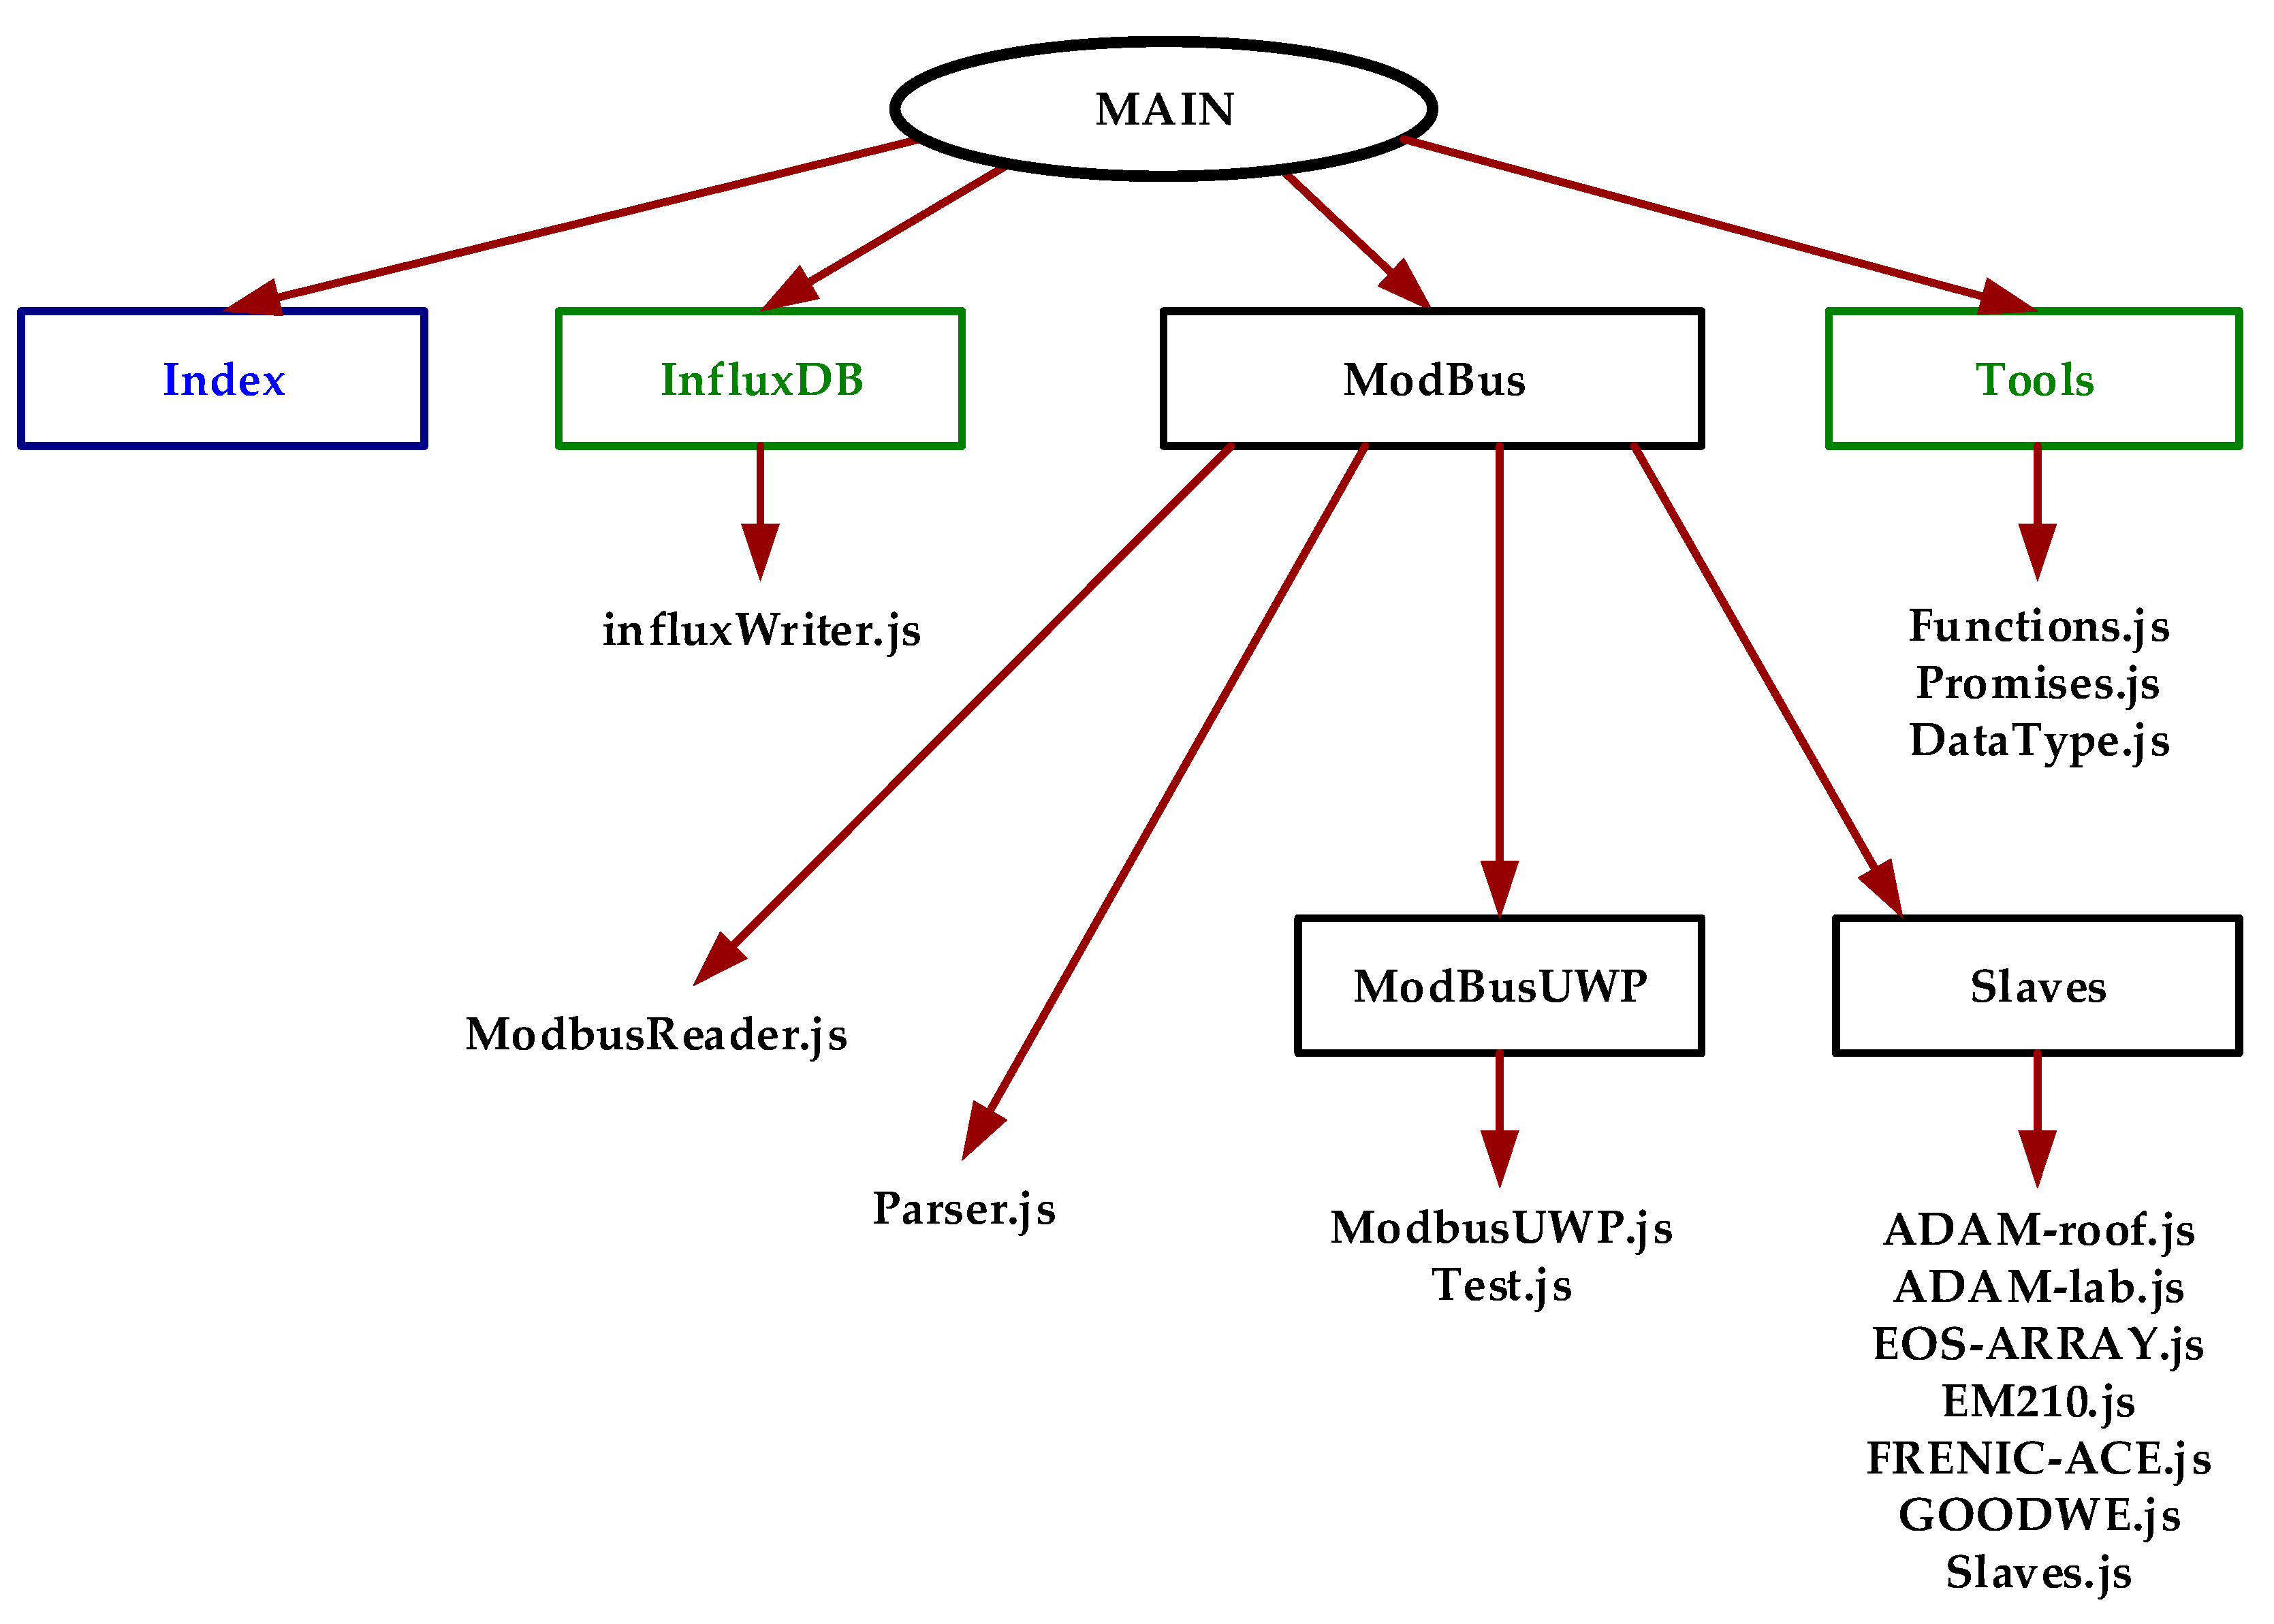
3.2. Monitoring System Programs

The main programs running in the server are the following:
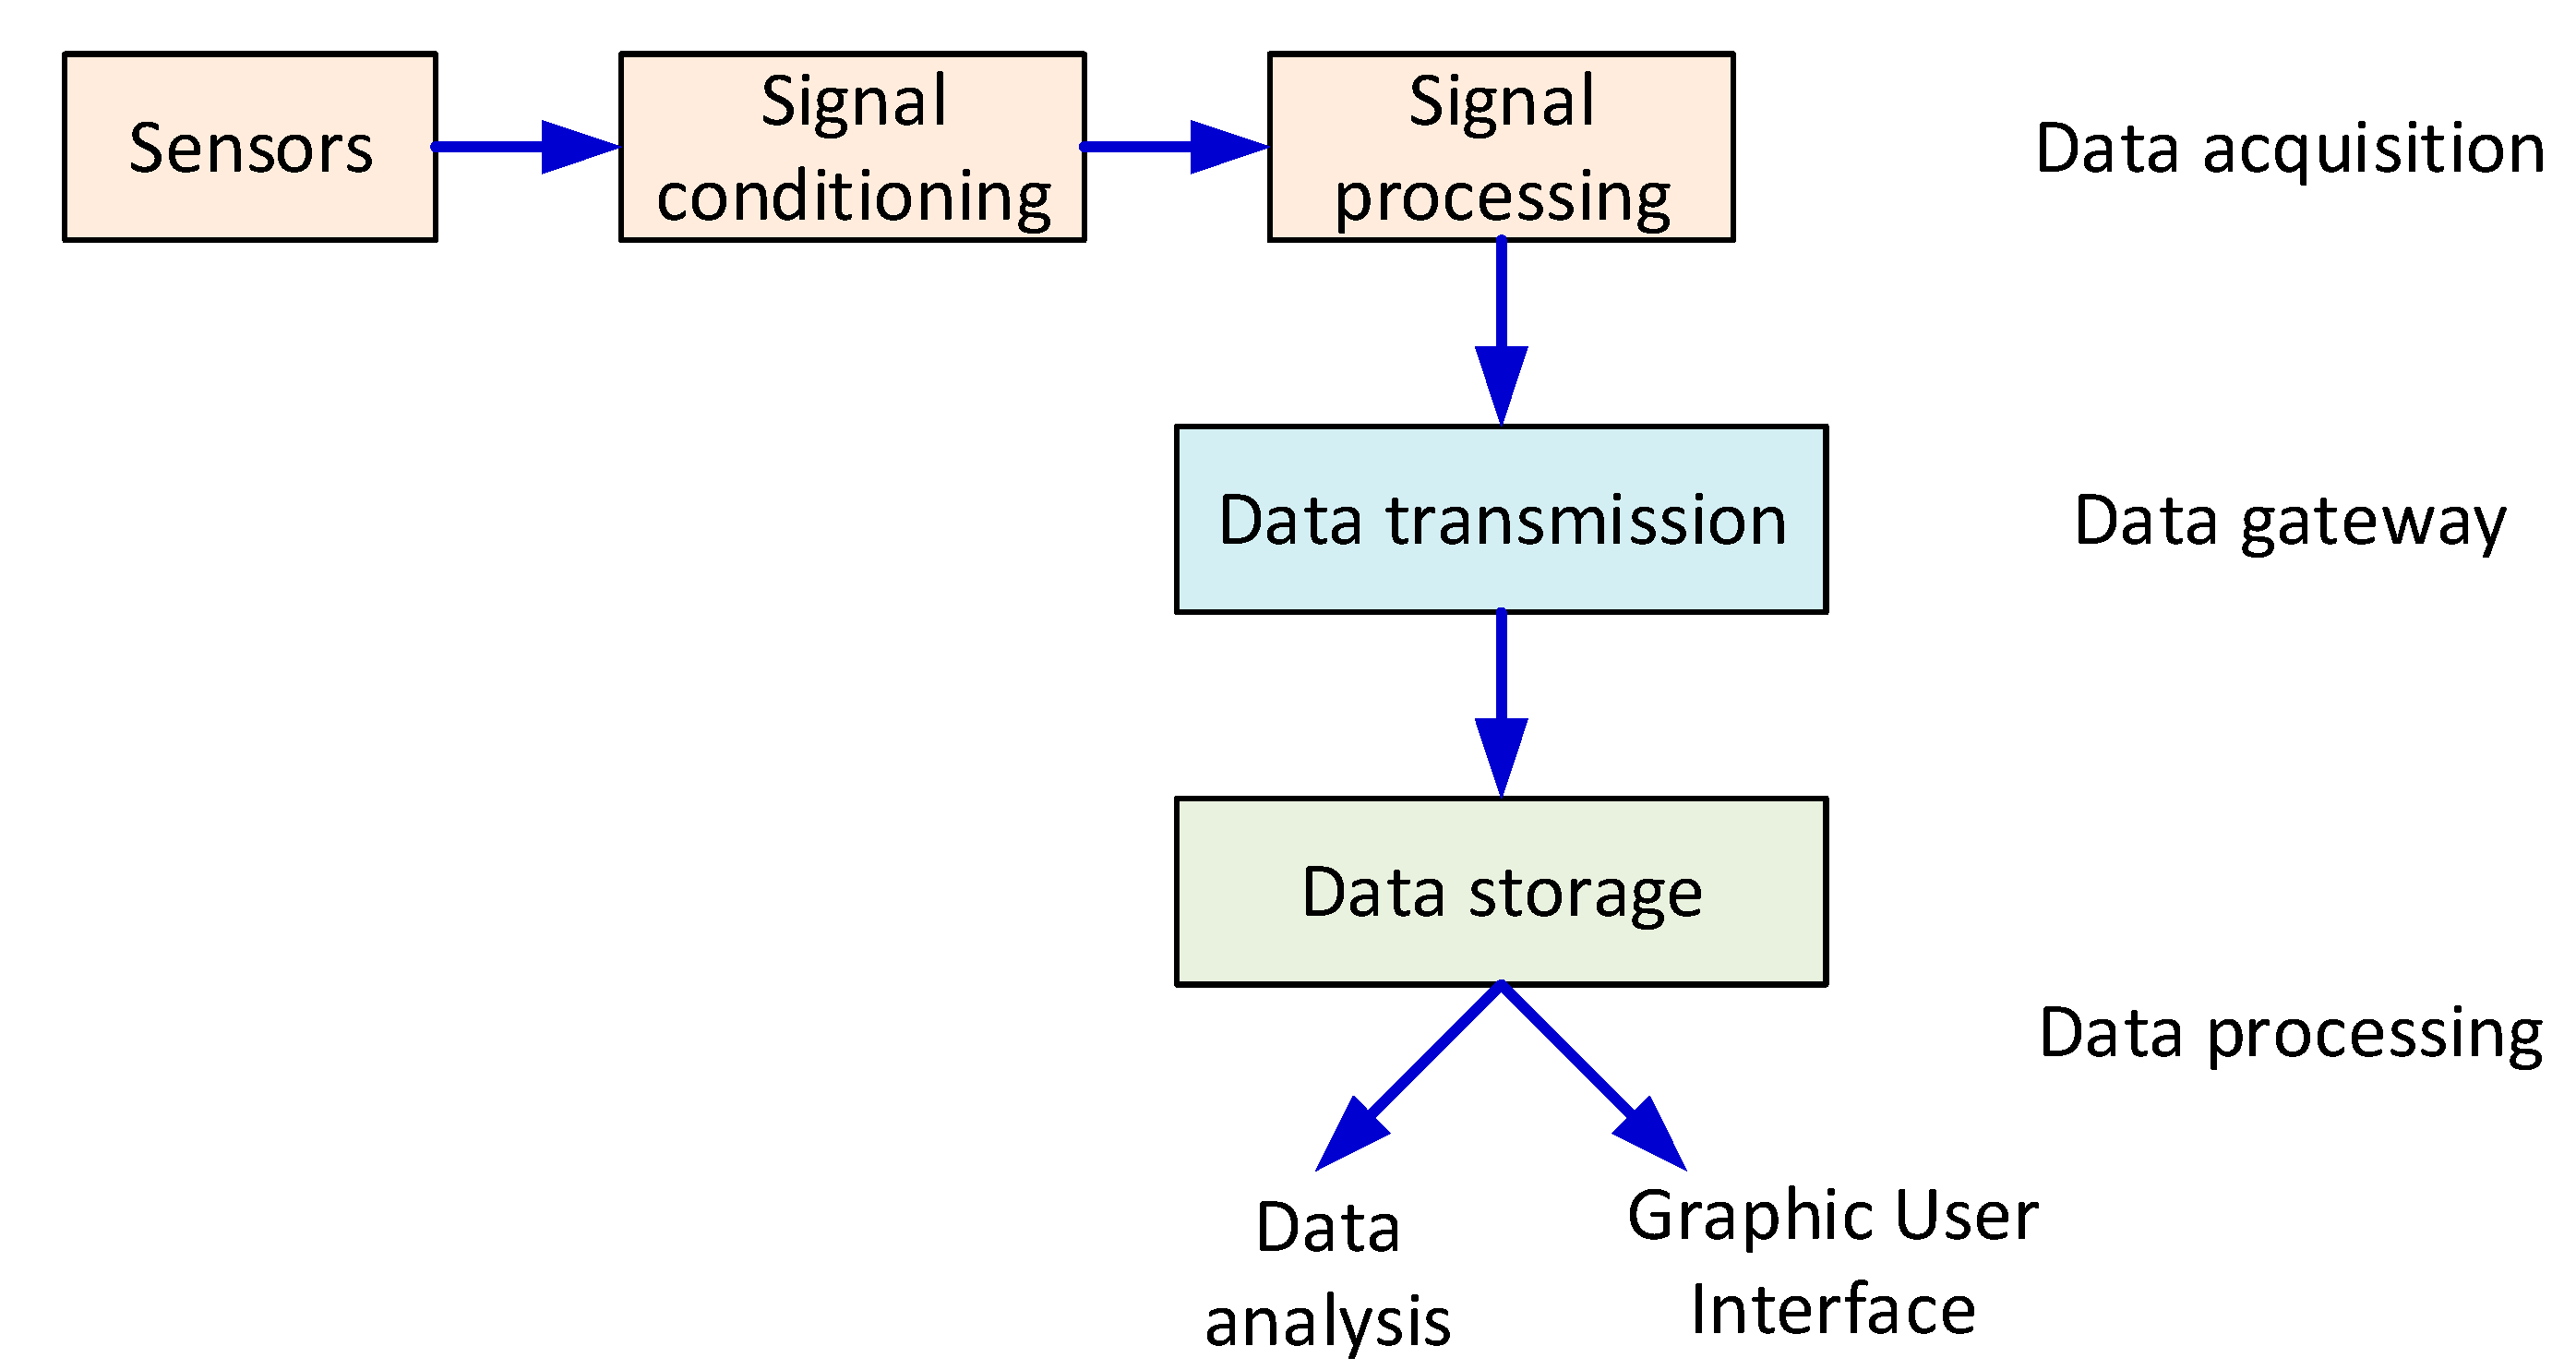
  • Data acquisition and storage in the DB.
  • GUI management.
  • Data exporter.
The following subsections describes these programs.

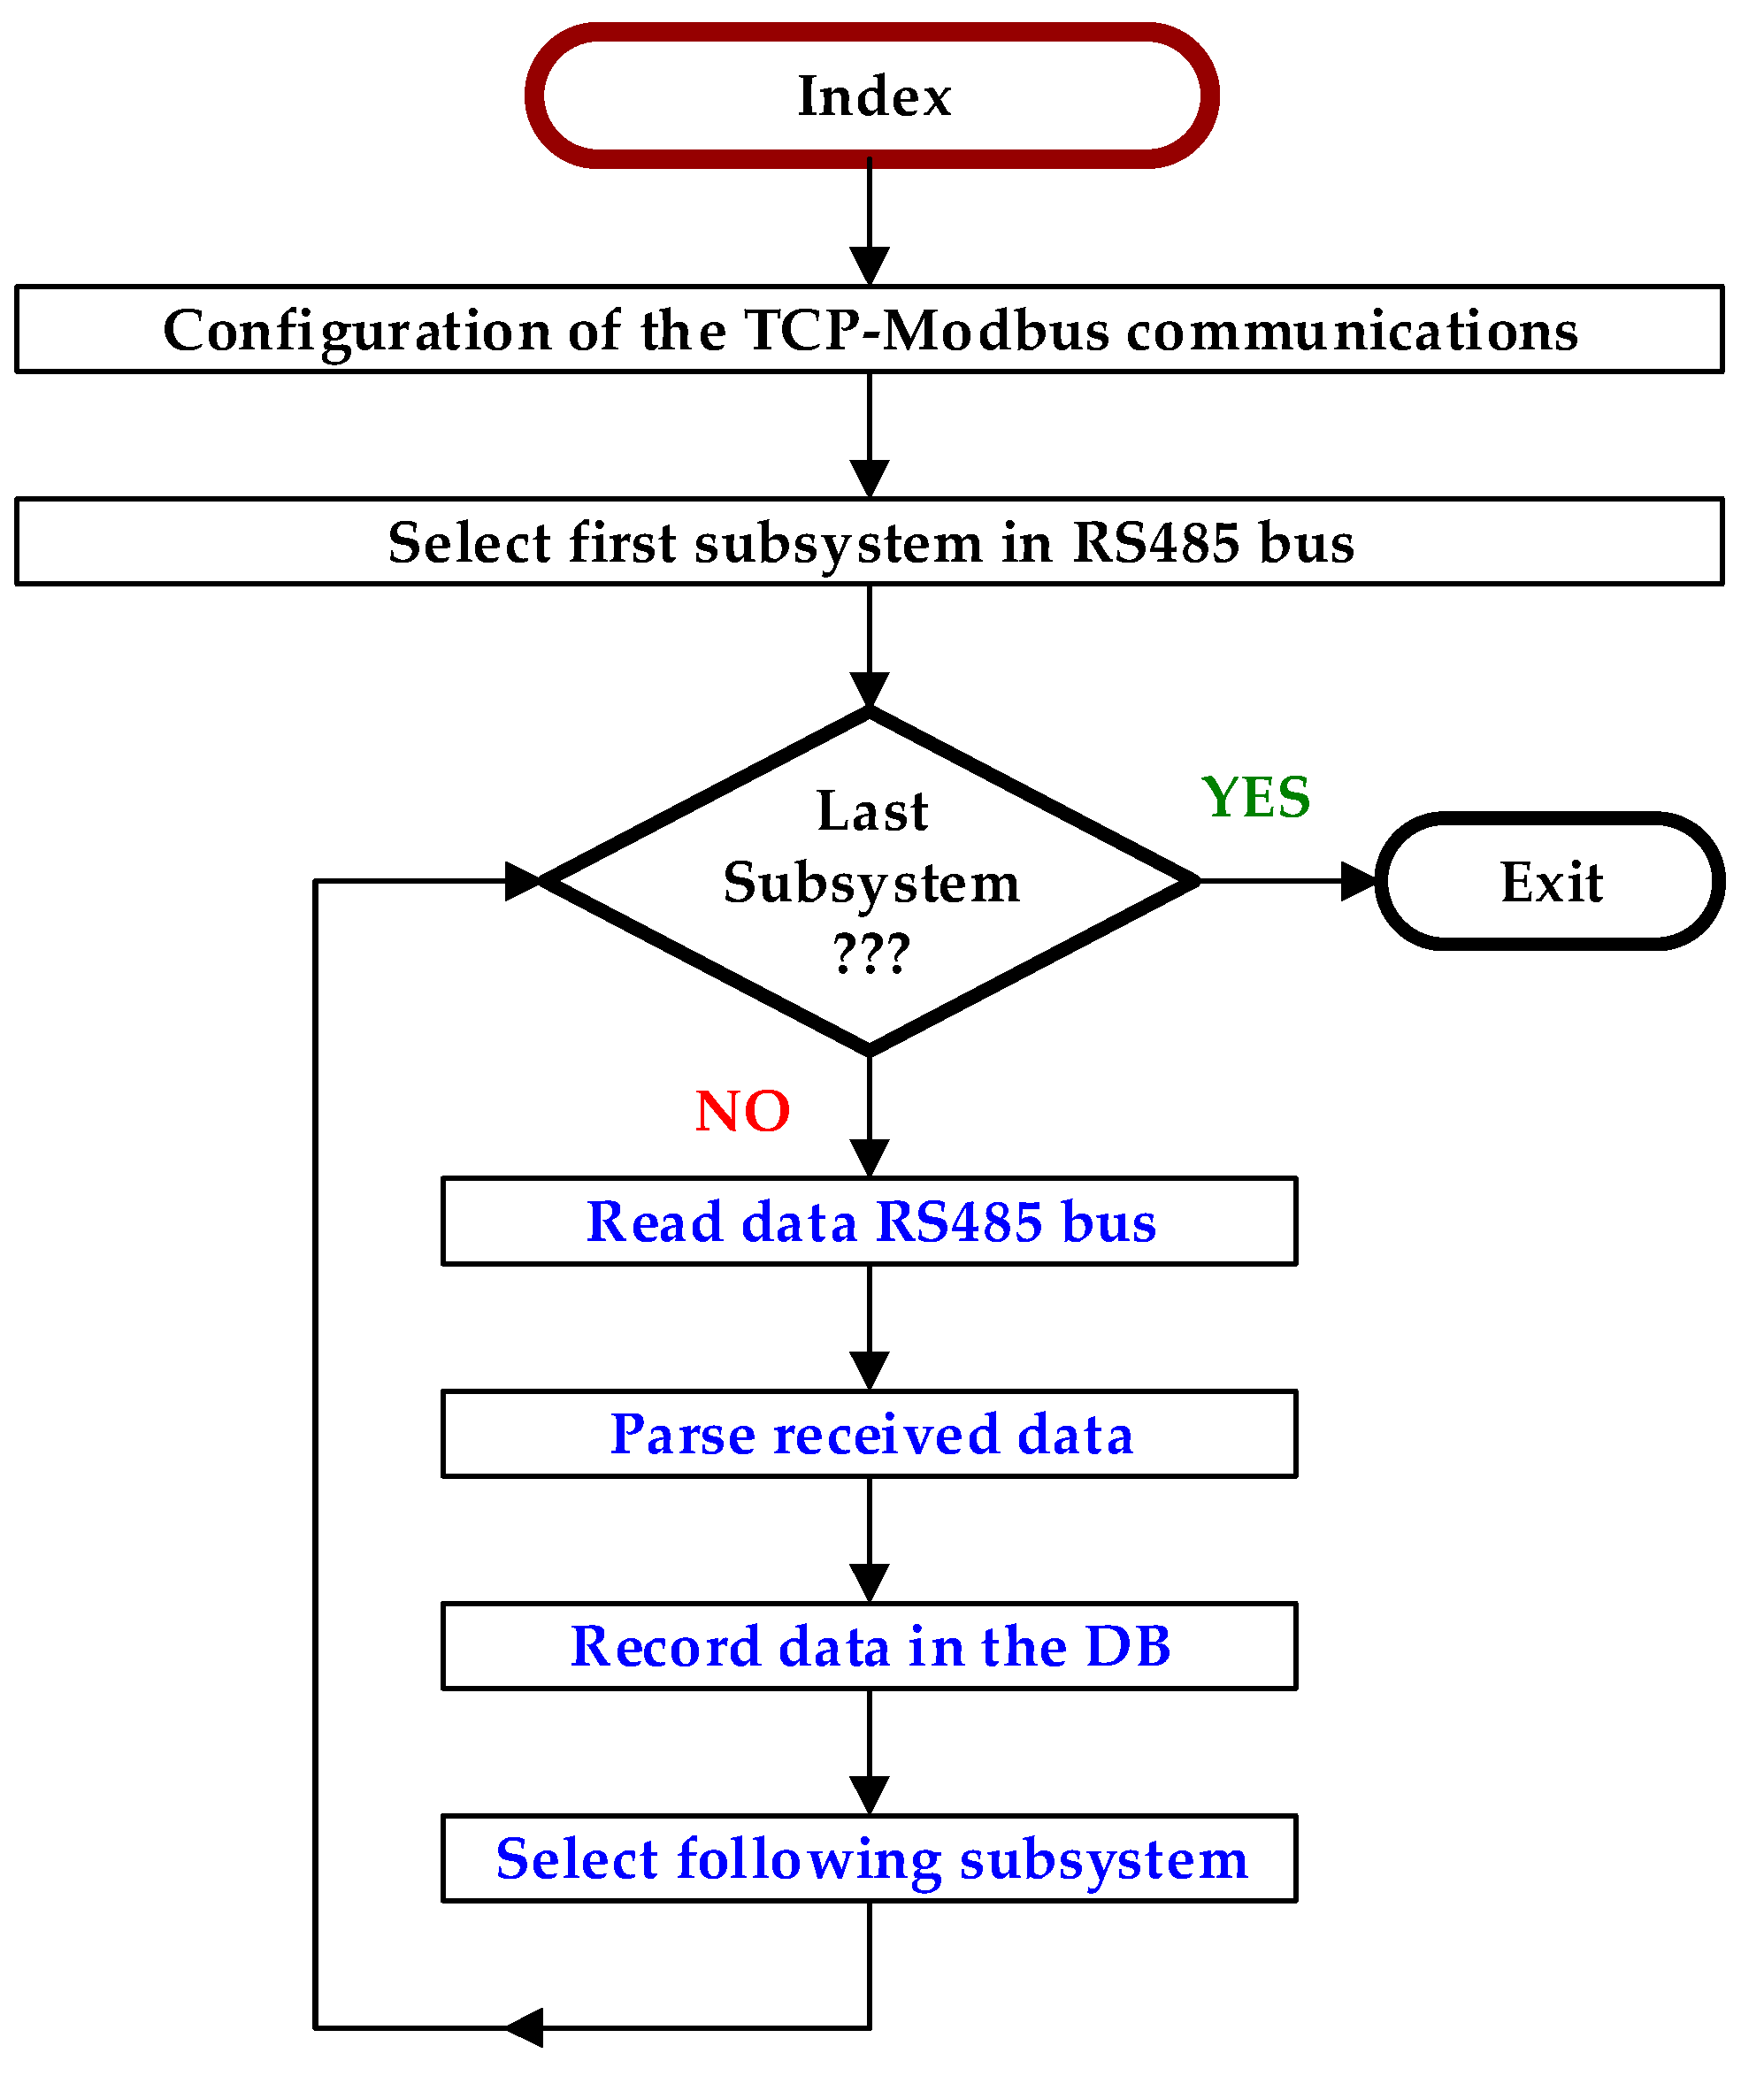
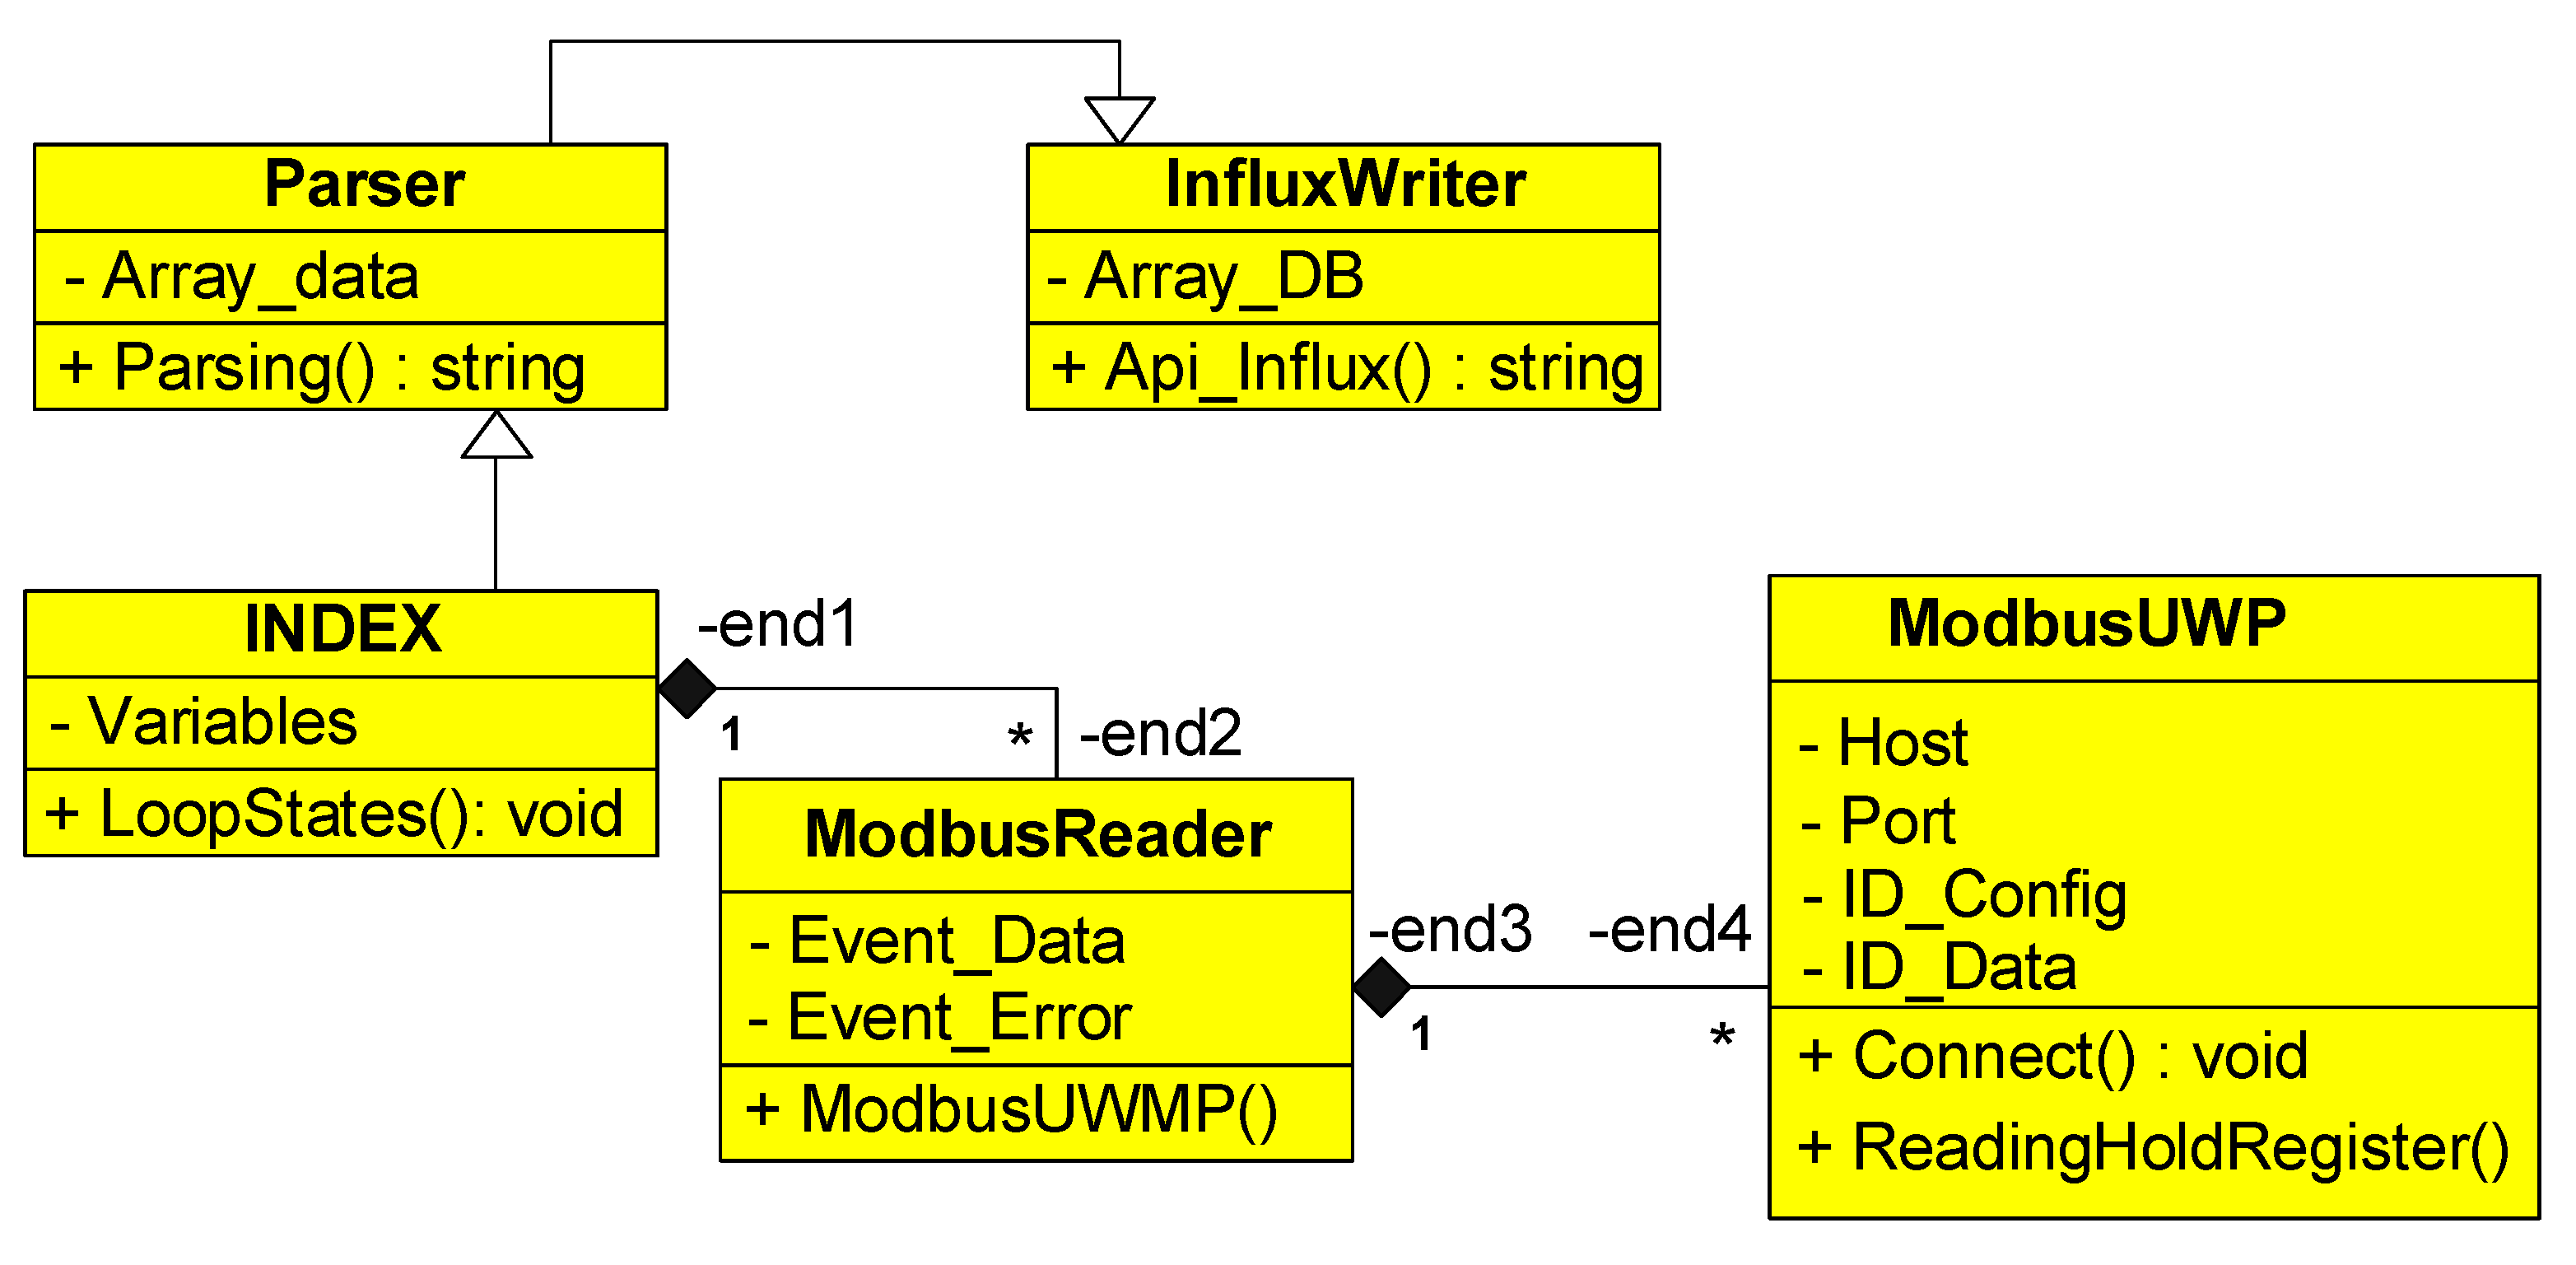
3.2.1. Data Acquisition and Storage Modelling

The data acquisition and storage program in the DB polls the subsystems connected to the RS485 bus. Each subsystem has its own parameters, which include a Modbus ID address and data registers. Figure 8 shows the flowchart of the program for the data acquisition and storage in DB. The data acquisition program is executed in one second in the PV facility described in the previous section, enabling the implementation of a quasi-real-time monitoring system.
A centralized nonrelational database is used to store the data acquired from each of the subsystems because its processing efficiency is extremely high compared to relational databases. The data are stored using InfluxDB as free open-source database storage. InfluxDB is designed to handle large amounts of data while allowing for interaction with the data in real time [60]. Table 2 shows part of the data model (variables to acquire) used in this program, and it details the subsystem to which they belong. The ADAM 4017+ located in the lab provides data for the following variables: water temperature and level in the lab tank, flow rate, and pump outlet pressure. Access to the LIB data is made through communication with the hybrid inverter, and this enables it to read several variables: IBat, VBat, state of charge (SOC), state of health (SOH), battery management system (BMS) parameters, etc.
Unified modelling language (UML) methodology was used for modelling the software. The flow of the control and data among some modules (Index, Modbusreader, Parser, ModbusUWP, and InfluxWriter) is shown in Figure 9.
All the programs were developed in the Node.js platform, using Visual Studio Code (VSC) as the integrated development environment (IDE). A monitoring system intended for its application in real PV plants must be robust and reliable. PM2, a free open-source process manager for Node.js working in Linux on the Raspberry PI, launches the execution of the application at the start of the operating system and monitors all processes launched in the monitoring program. PM2 restarts the application automatically if the code is modified, or if there is a shutdown in the execution of the program. PM2 keeps the application online 24/7, without making any changes to the program code (cluster mode), and it enables recording execution errors in a file.

3.2.2. Programs for the Data Acquisition and Storage in DB

The data acquisition and storage program is composed of several files, each performing a different task before being interconnected through an event connection. The configuration file ecosystem.config.js manages the workflow of the application. The main files of the application are the following: Index.js, ModbusReader.js, Parser.js, ModbusUWP.js, Slave.js, EM210.js, and InfluxWriter.js. The program has the hierarchy of modules presented in Figure 10.
The file Index.js includes all the libraries and files for reading and storing the data read from the peripherals (slaves) by means of an endless loop called the loopState() method. Once the data is read, it is parsed and stored in the Influx DB. The file ModbusReader.js includes the class to make the reading cycles of the different slaves. Its structure consists of the Modbus server IP host, the Modbus server port, and the time interval of data acquisition in milliseconds. The loopState() method reads all the registers configured from all the slaves periodically. This method goes through each memory map to read the different groups of registers in each slave connected to the RS485 bus. The interconnection between the Index.js and ModbusReader.js modules is established through calls with the events method. Three types of events are used in the program:
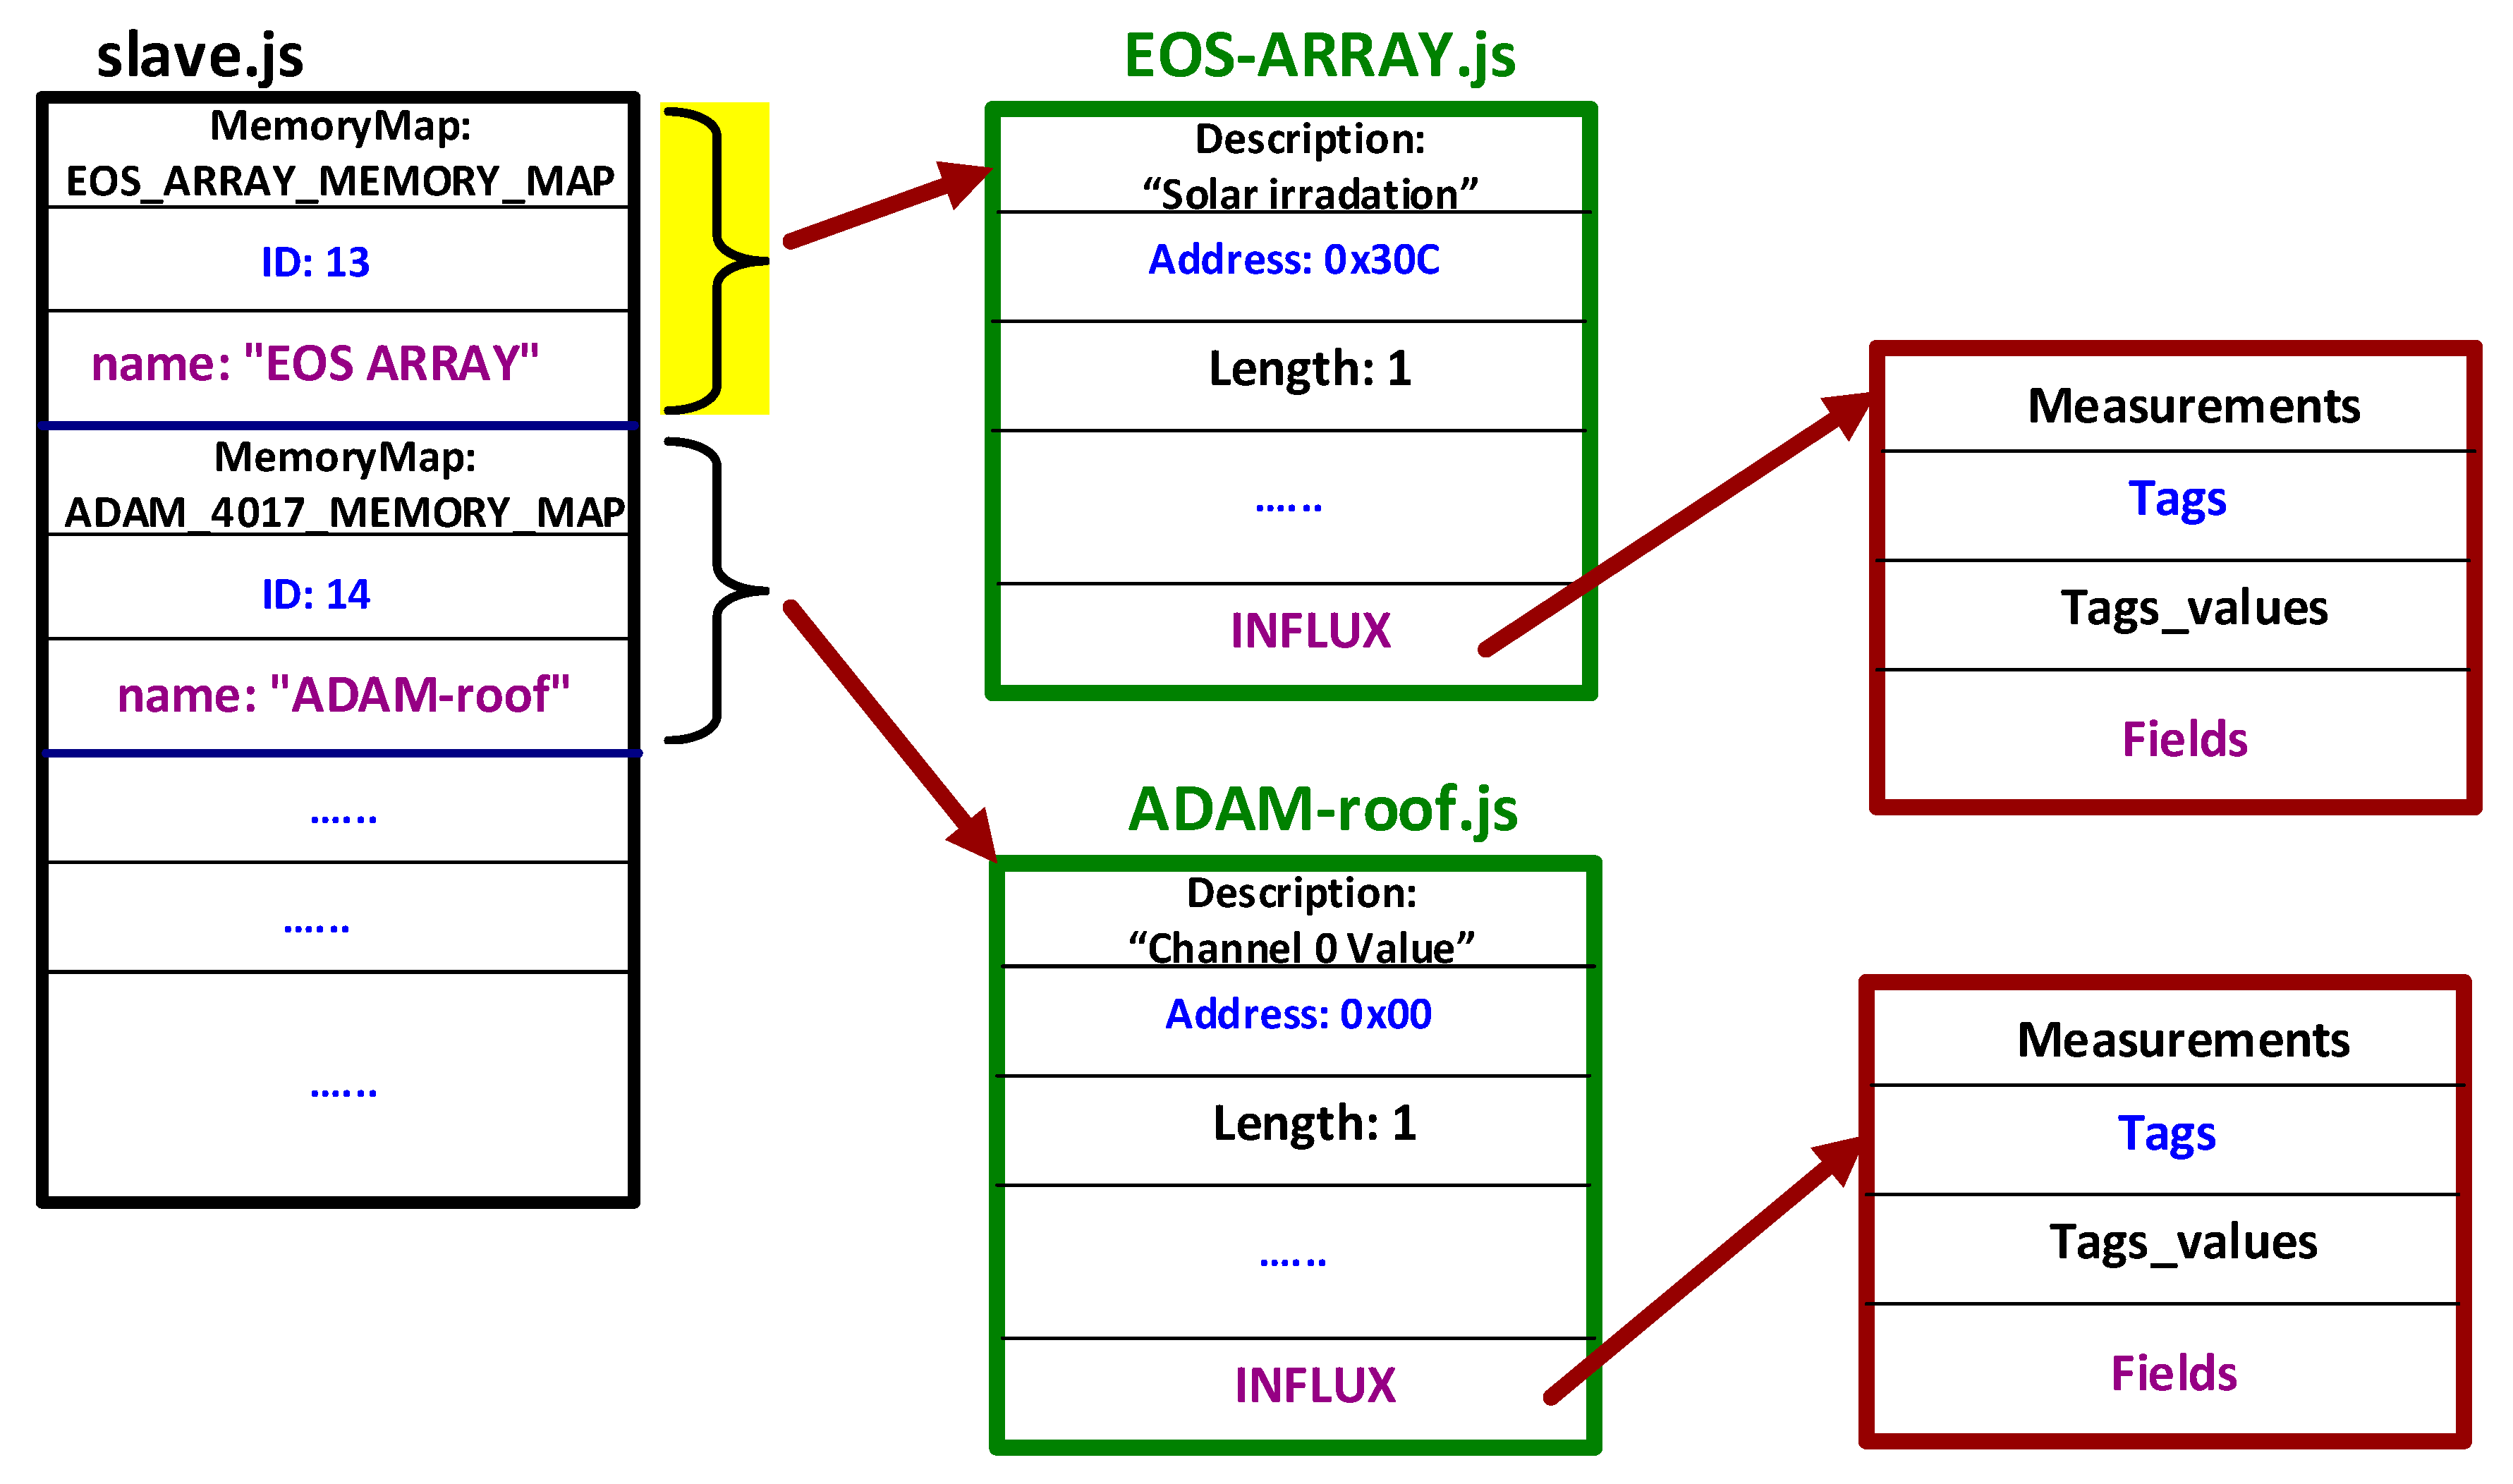
  • data: for parsing the data received from each of the subsystems
  • error: for any kind of error in the system, e.g., connection, format, etc.
  • loopstop: for finishing the loopState() method
The file Parser.js performs the formatting of the information received from each of the slaves in the RS485 bus from the memory map of each slave. The files ModbusUWP.js manages the UWP server in a transparent way. The Modbus class has the following parameters: UWP Server IP host, TCP-port UWP Server listening port, Modbus ID config ID for configuring the subsystem to be read, and Modbus IDdata ID for reading subsystem data.
The file Slave.js reads the memory map of each device connected to the RS485 bus. The slaves of the RS485 bus are the following: ADAM-roof (acquires the environmental variables on the rooftop), Eos Array, EM210, Frenic-ACE VSD, a Goodwe hybrid inverter, and ADAM-lab (which acquires the hydraulic variables on the lab). A diagram of the relationship of the data structure of the subsystems is shown in Figure 11.
As an example, the file EOS-ARRAY.js uses a configuration for the device that consists of two parts:
  • Frame format: description + address + length + type + gain + parsing + Influx
  • Influx database: measurement + tags + tags_values + fields
The file influxWriter.js records the parsed data in an array with the following frame format: “Description: value.Description, value: read, timestamp: localTimestamp, influx: value.influx || null”.

3.2.3. Graphical User Interface and Data Exporter

The data stored on the central computer can be viewed from any Internet browser if the IP is known, as it includes a graphical user interface (GUI) developed in Grafana. Grafana is an open-source data visualization software that enables the production of plots, tables, and other graphics in a large variety of monitoring systems [60,61].
In addition to the programs that store the acquired data in the database and enable their visualization through a GUI, the proposed monitoring system includes a data exporter. The data exporter program enables authorized users to select and copy the data stored in InfluxDB, and it also creates Excel or .csv files of the selected variables in a defined time interval and with the desired data granularity. The following parameters are available to configure data export:
  • Start and end date for export, divided in two fields: day/month/year; hour:minute
  • Name of the database chosen for data export from the different monitoring systems that store data in InfluxDB
  • Method of filling when data are unavailable: linear filling, fill with nulls, fill with zeros, none, and previous
  • Selection of the fields to include in the file
  • Type of file to export: Excel or .csv
A list of all the variables recorded in the DB is provided, and they are selected by the user in the order that they will appear in the Excel or .csv files. The variables are grouped according to the device that provides the data, and which corresponds to the slaves of the RS485 bus. The following groups appear in the proposed monitoring system: ADAM-roof, Eos Array, EM210, Frenic-ACE, a Goodwe hybrid inverter, and ADAM-lab. After selecting the group, the variable to export can be chosen from the list of all the variables recorded from that slave.

4. Discussion on the Experimental Results of the Monitoring System

The monitoring system developed in this work is being used for R&D projects and training activities in different fields as mentioned above. The first results obtained for the various operating modes are presented and discussed below. Furthermore, some weak points of the PV system are described, and we also detail the solutions that are going to be implemented to solve these drawbacks.
As mentioned, the photovoltaic system described can work in three different modes:
  • Direct PVWPS (DPVWPS)
  • Stand-alone PV system with lithium battery storage
  • Grid-connected system for self-consumption with lithium battery storage
The PVWPS+LIB operation mode can be considered as a combination of the DPVWPS and the stand-alone PV system. In the PVWPS+LIB mode, the VSD AC input is connected to the backup AC output of the hybrid inverter. The control of the hybrid inverter decides the flow of energy between the PV modules, LIB, and the VSD that controls the operation of the pump.

4.1. Results for the Grid-Connected Mode

The plots shown in Figure 12 represent the operation of the system working as a grid-connected system without battery storage. The format of the dates in the Grafana legend is “mm/dd hh:mm” (month/day; hour:minute). In this operating mode, the MPPT control of the inverter operates the system to generate the maximum amount of power at any instant. The performance ratio (PR) obtained with this scheme, excluding the effect of the ambient temperature that is a seasonal variation, represents the maximum PR that can be obtained by the system and includes the minimum number of components. The load (the power network) accepts all the energy fed into it. As can be seen, PV power generation and grid active power profiles follow the GI profile, as is expected when the MPPT of the inverter operates correctly and there are no problems in the grid. PV cell temperature also varies according to GI variations, reducing the cell efficiency during midday due to the increase in the losses caused by high cell temperatures.
From the information provided in the legends at the bottom of Figure 12 and the PV module technical information, the correct operation of the system can be verified by calculating the value of the expected power generated for the PV field. The expression of the PMPP for a value of GI and Tcell is calculated as appears in Equation (1), where g is the temperature coefficient of PMPP.
P M P P _ G I x _ T c e l l = P M P P _ 25   ° C [ 1 + g % ° C 100 · ( T c e l l 25 ) ] · G I x 1000   W m 2
Substituting in Equation (1) the maximum values of GI and Tcell from Figure 12 (GI = 997 W/m2 and Tcell = 53.87 °C), the theoretical maximum value of PV power is obtained in Equation (2). This value only differs by 69 W with respect to the measured maximum value of 2186 W detailed in the bottom legend of the PV power plot in Figure 12. This value of 69 W is between the range of uncertainty (105 W) determined at these conditions for Equation (2).
P M P P _ max _ 13 _ J u l y = 2440   W p k [ 1 + 0.45   % ° C 100 · ( 53.87 25 ) ] · 997   W m 2 1000   W m 2 = 2117   W p k
An inverter efficiency (ηinv) of 94.8% is obtained at maximum working power if the grid active power is divided by the PV power:
η i n v = P g r i d P P V = 2073   W 2186   W = 0.948
Other merit factors representing the behavior of the PV system can be obtained from the data recorded by the proposed monitoring system, e.g., peak sun hours, performance ratio of the installation, energy generation, etc. This information is important for both O&M operators and facility owners. It is important for owners because they want to obtain the best possible return on their investment and use these factors to verify that energy production is optimized. O&M operators can verify that the system is working properly, and plan tasks that will improve the values obtained when the measured values deviate from the expected values, as can happen due to module defects, accumulated dirt, etc.

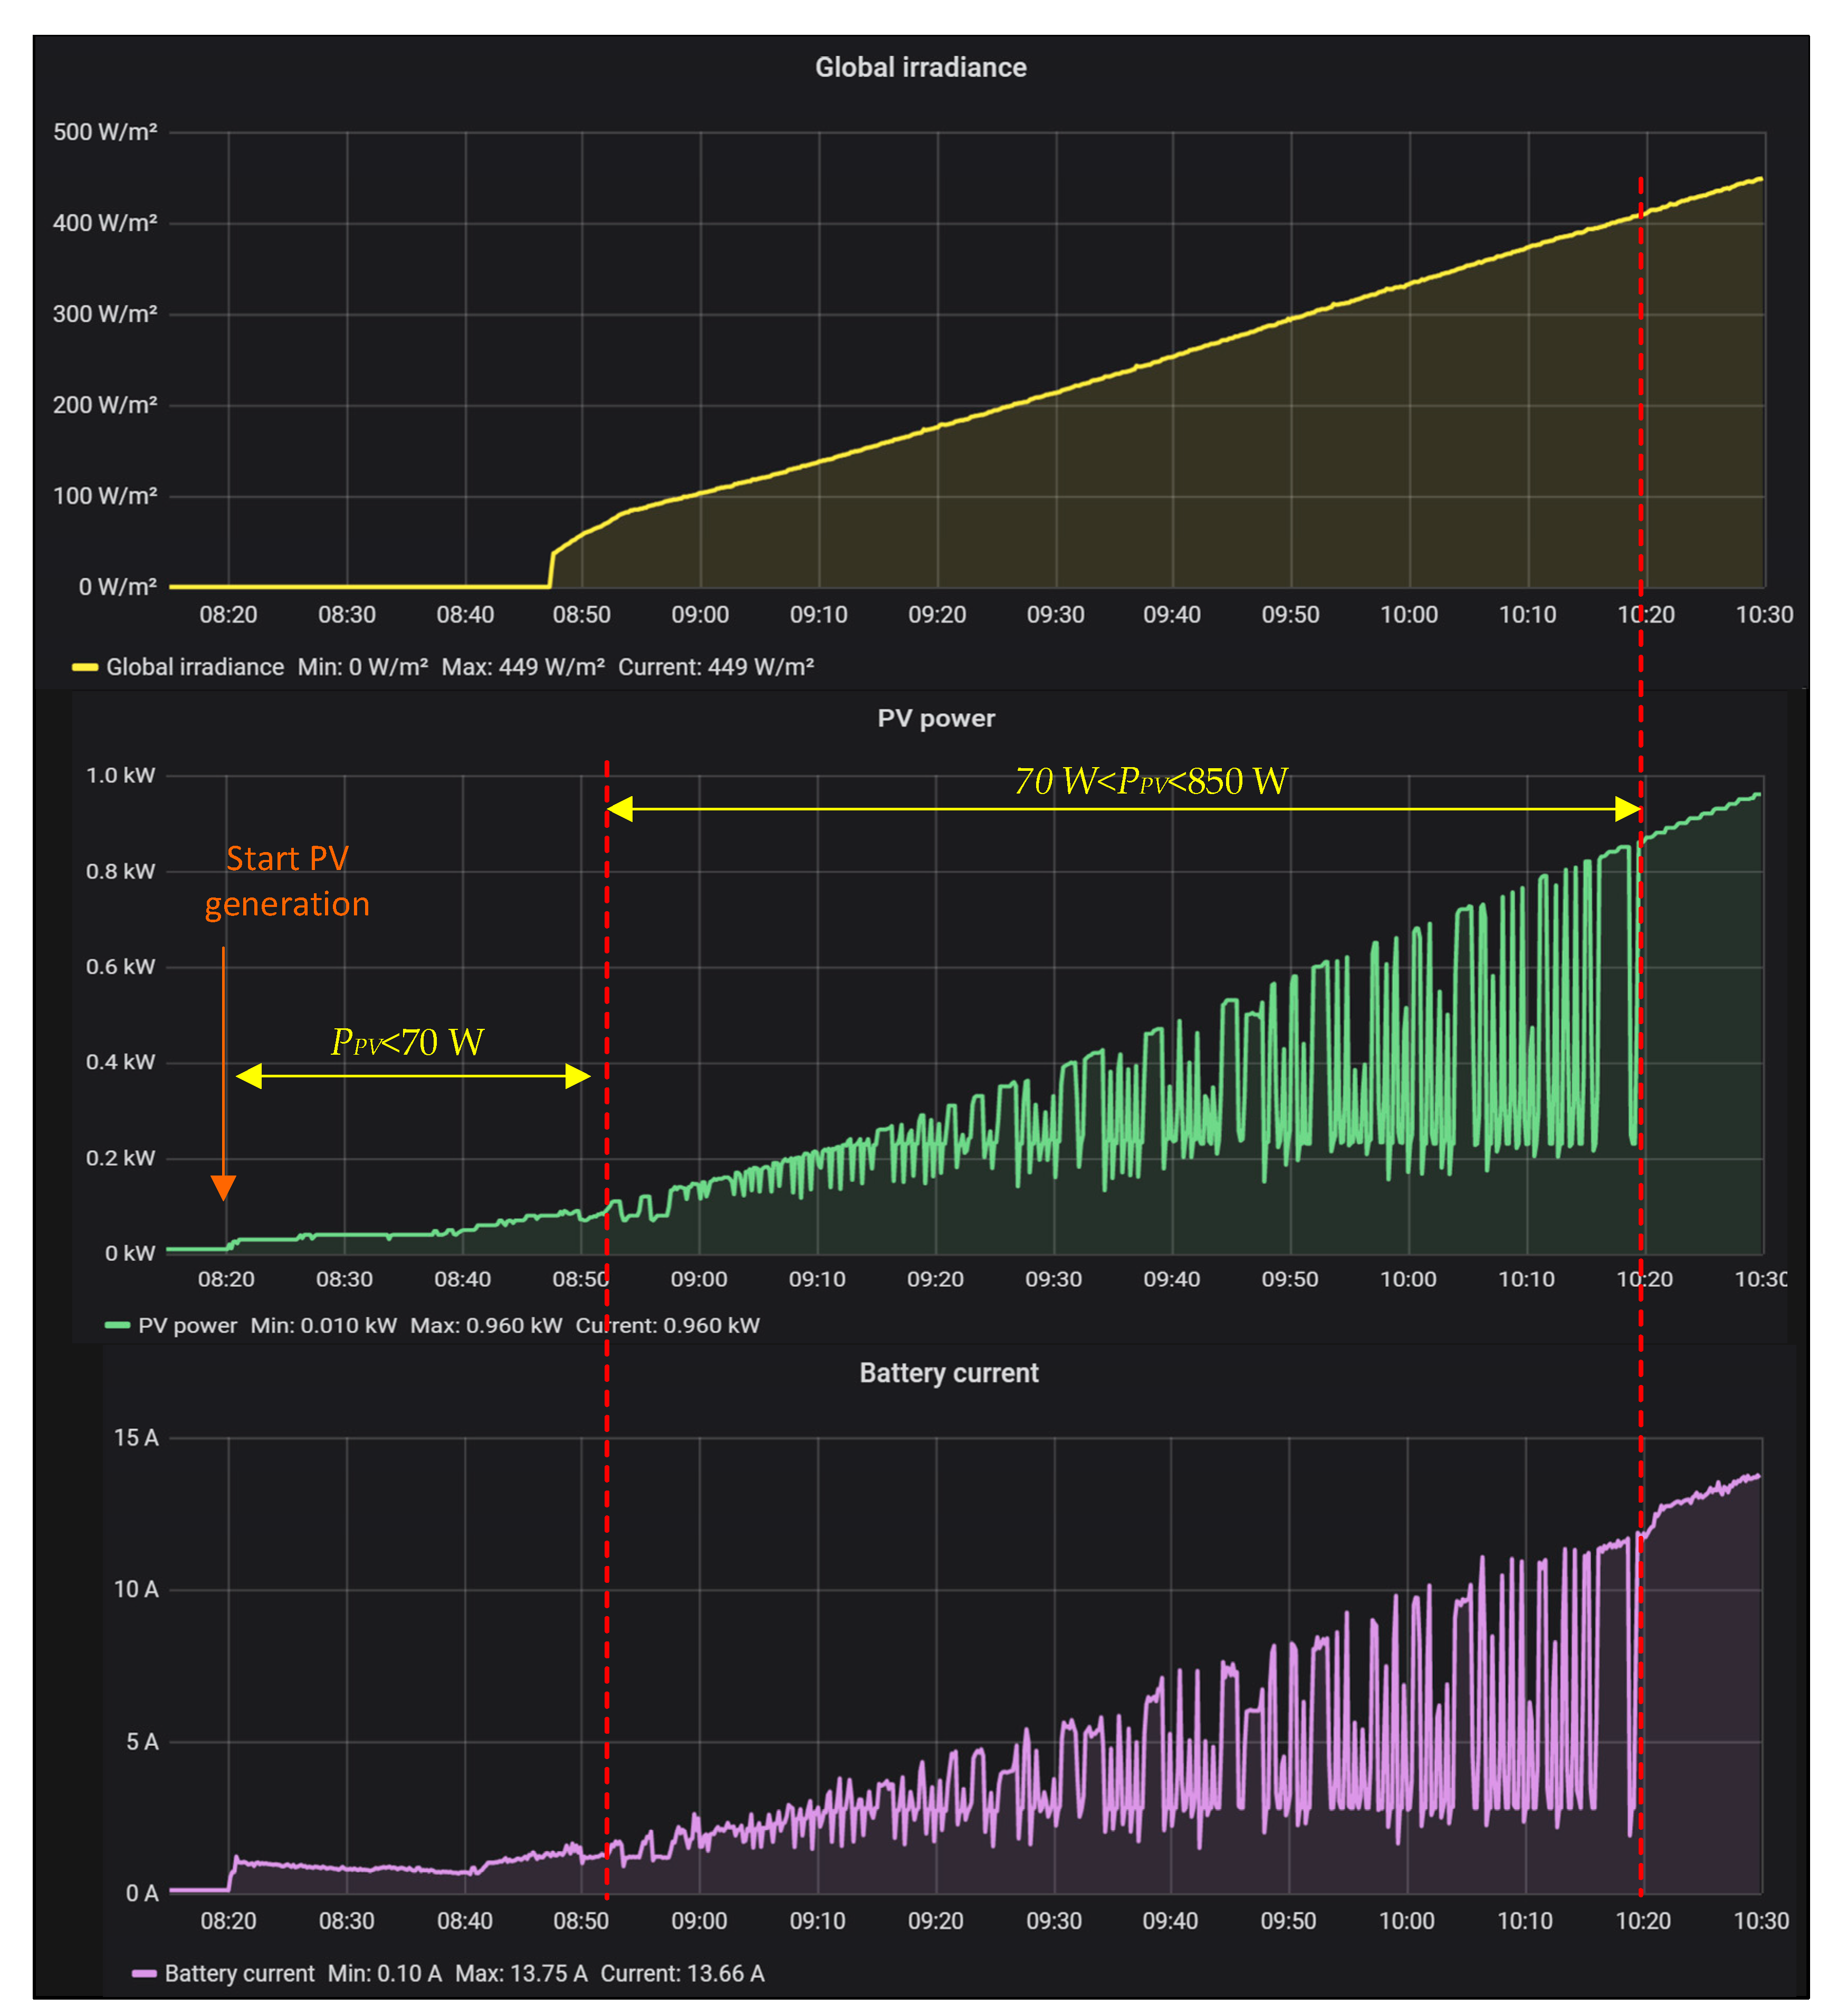
4.2. Direct PV Water Pumping System Mode

The data recorded on 2 and 3 October (i.e., 10/2 and 10/3) show the operation of the system in the DPVWPS mode for two different day profiles, as seen in Figure 13. The 10/2 graphic corresponds to the beginning and end of a cloudy day (low irradiance condition), with a significant amount of cloudiness during the middle of the day, as can be seen by the profusion of irradiance peaks exceeding 700 W/m2. A vertical red line was added to the plots obtained in Grafana to show how there is a 30-min delay (approx.) between the irradiance exceeding the threshold level and the start of pumping. This delay is caused by the VSD control. The irradiance threshold level is around 330 W/m2, as can be seen in the results obtained during 10/3 (corresponding to a sunny day profile). It can be seen that the PV power at solar noon on 10/3 is flat at 2150 W, while the irradiance curve is bell-shaped, with a well-defined maximum value (around 930 W/m2). The flattening of the PV power occurred because the nominal power value of the VSD has already been reached, and therefore the VSD controller adjusts the working point of the PV field to achieve a balance between generated and consumed power. During this interval, the PV field is no longer in the MPP, although it remains extremely close to that point as the design of the PV field was made for this operating mode. If the PV field could have more power installed, there would be excess energy that could be used for other purposes or stored in a battery in a PVWPS+LIB scheme for later use, thereby avoiding energy losses.

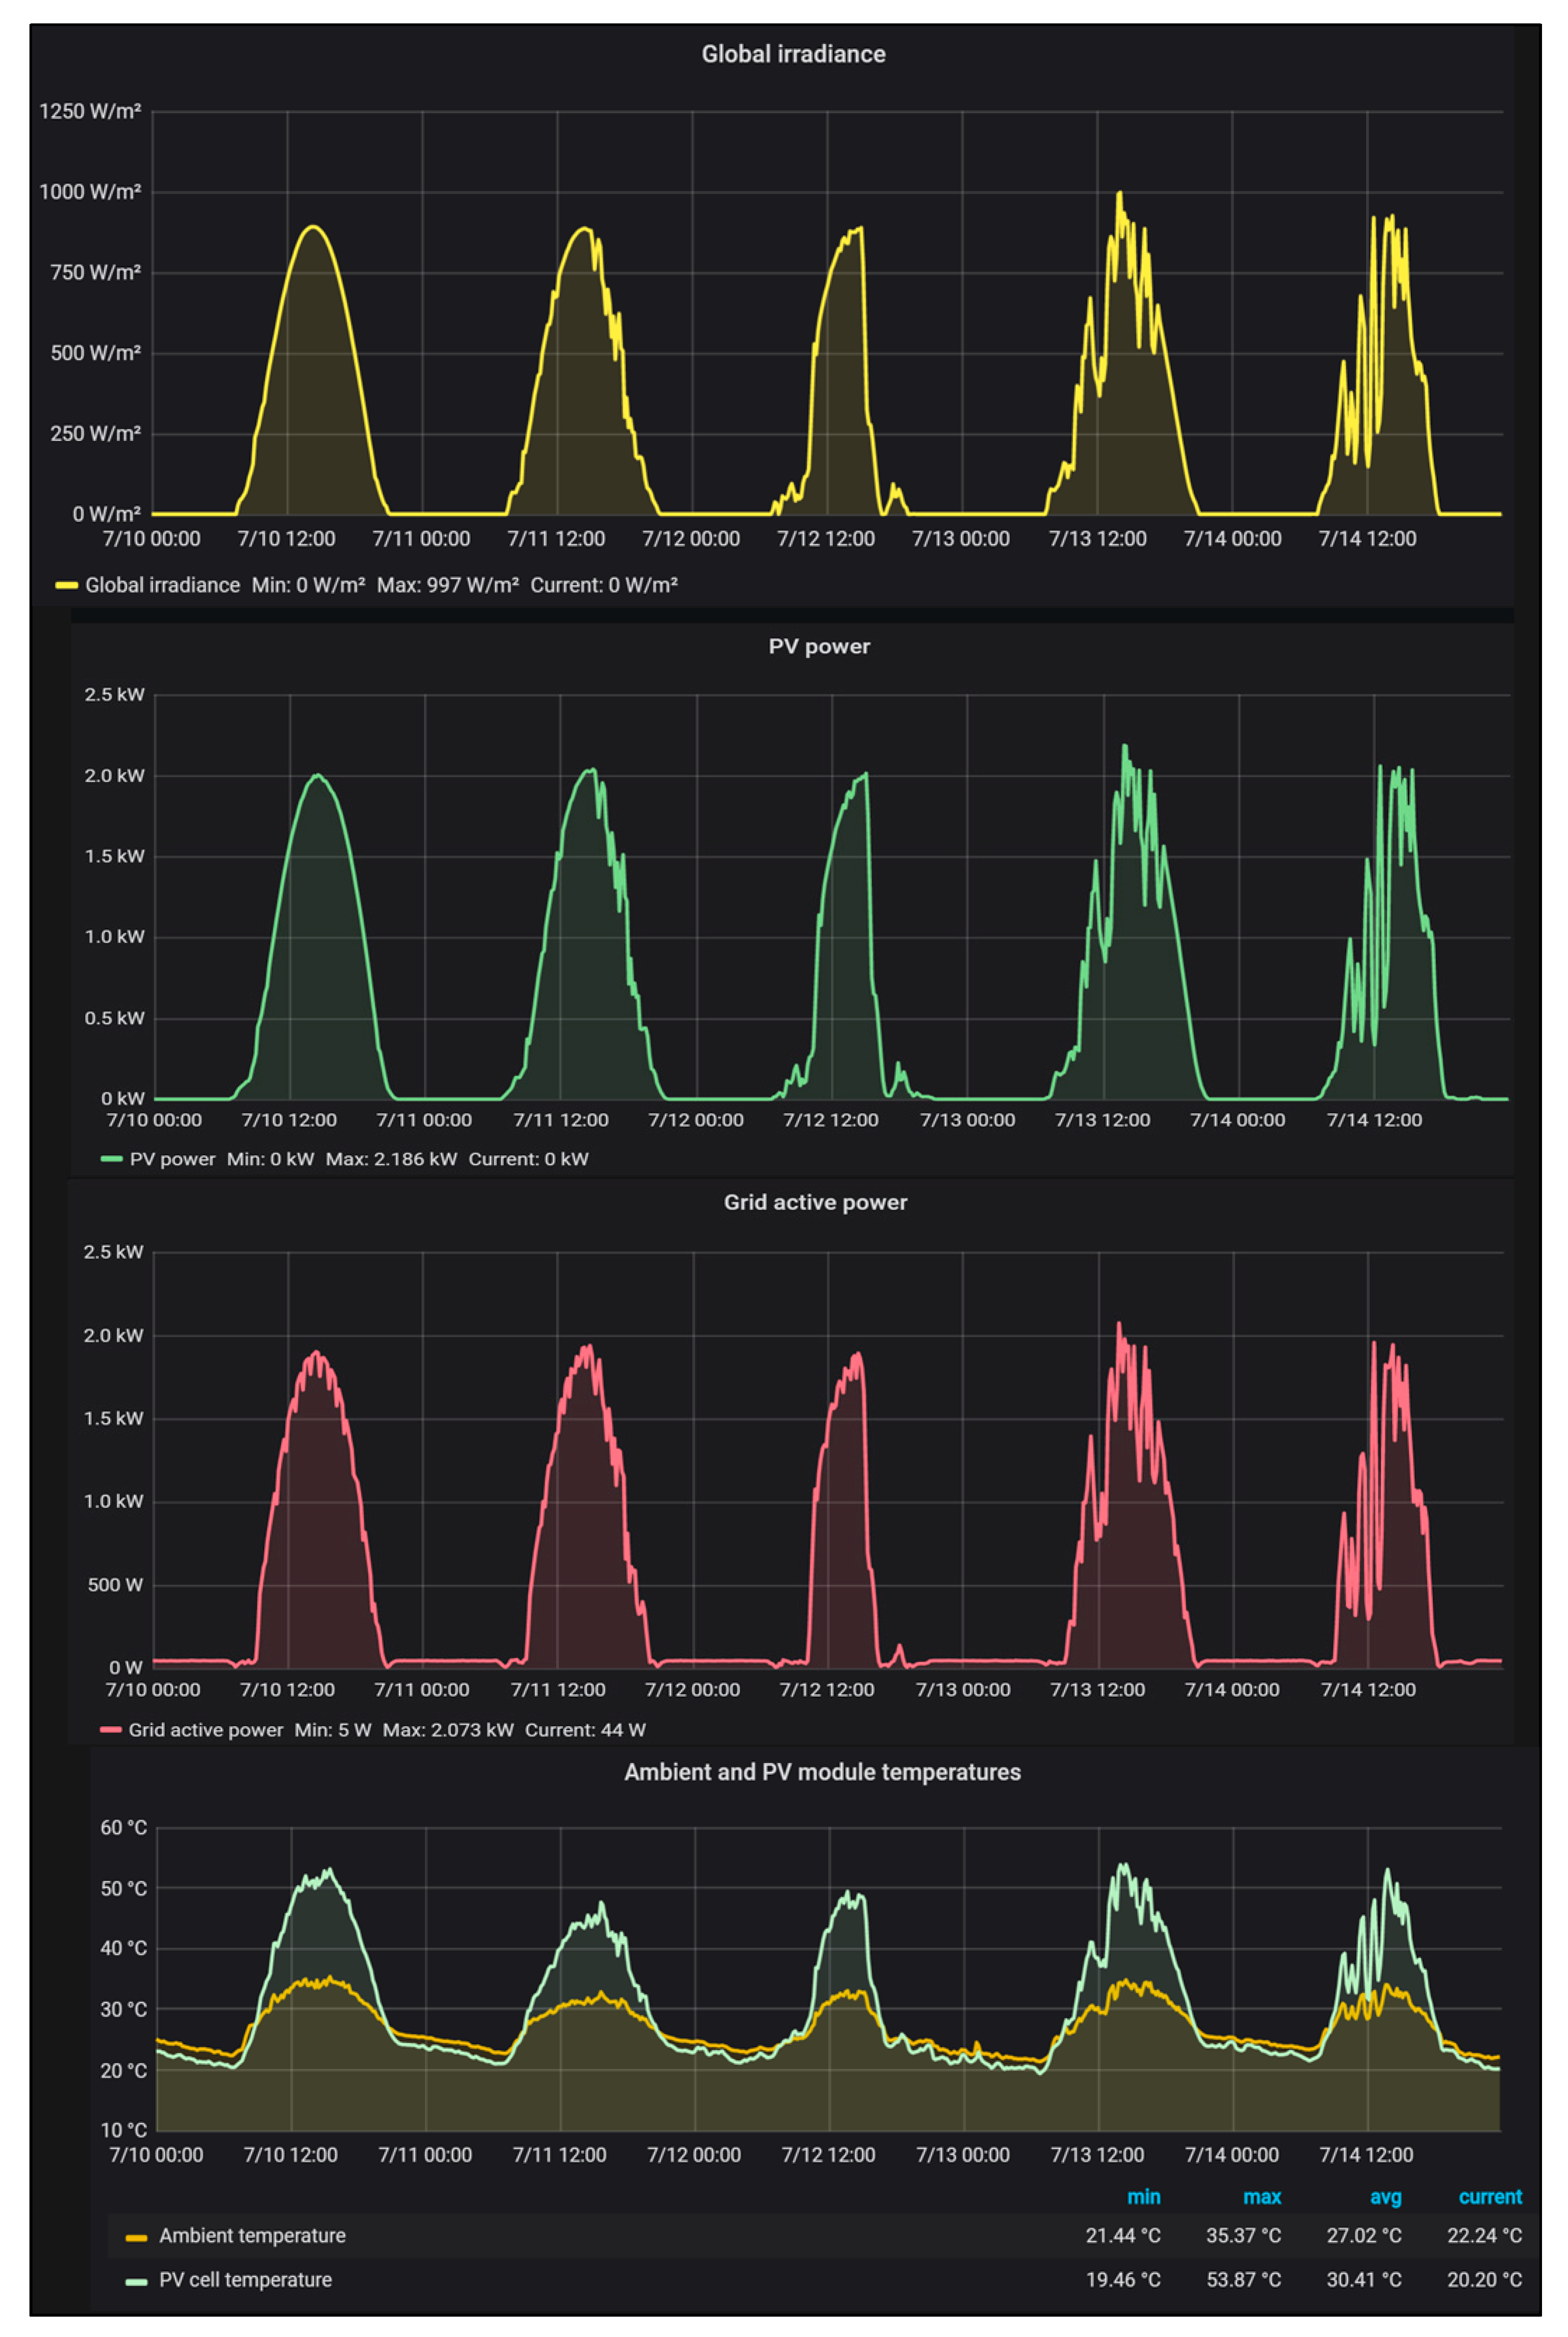
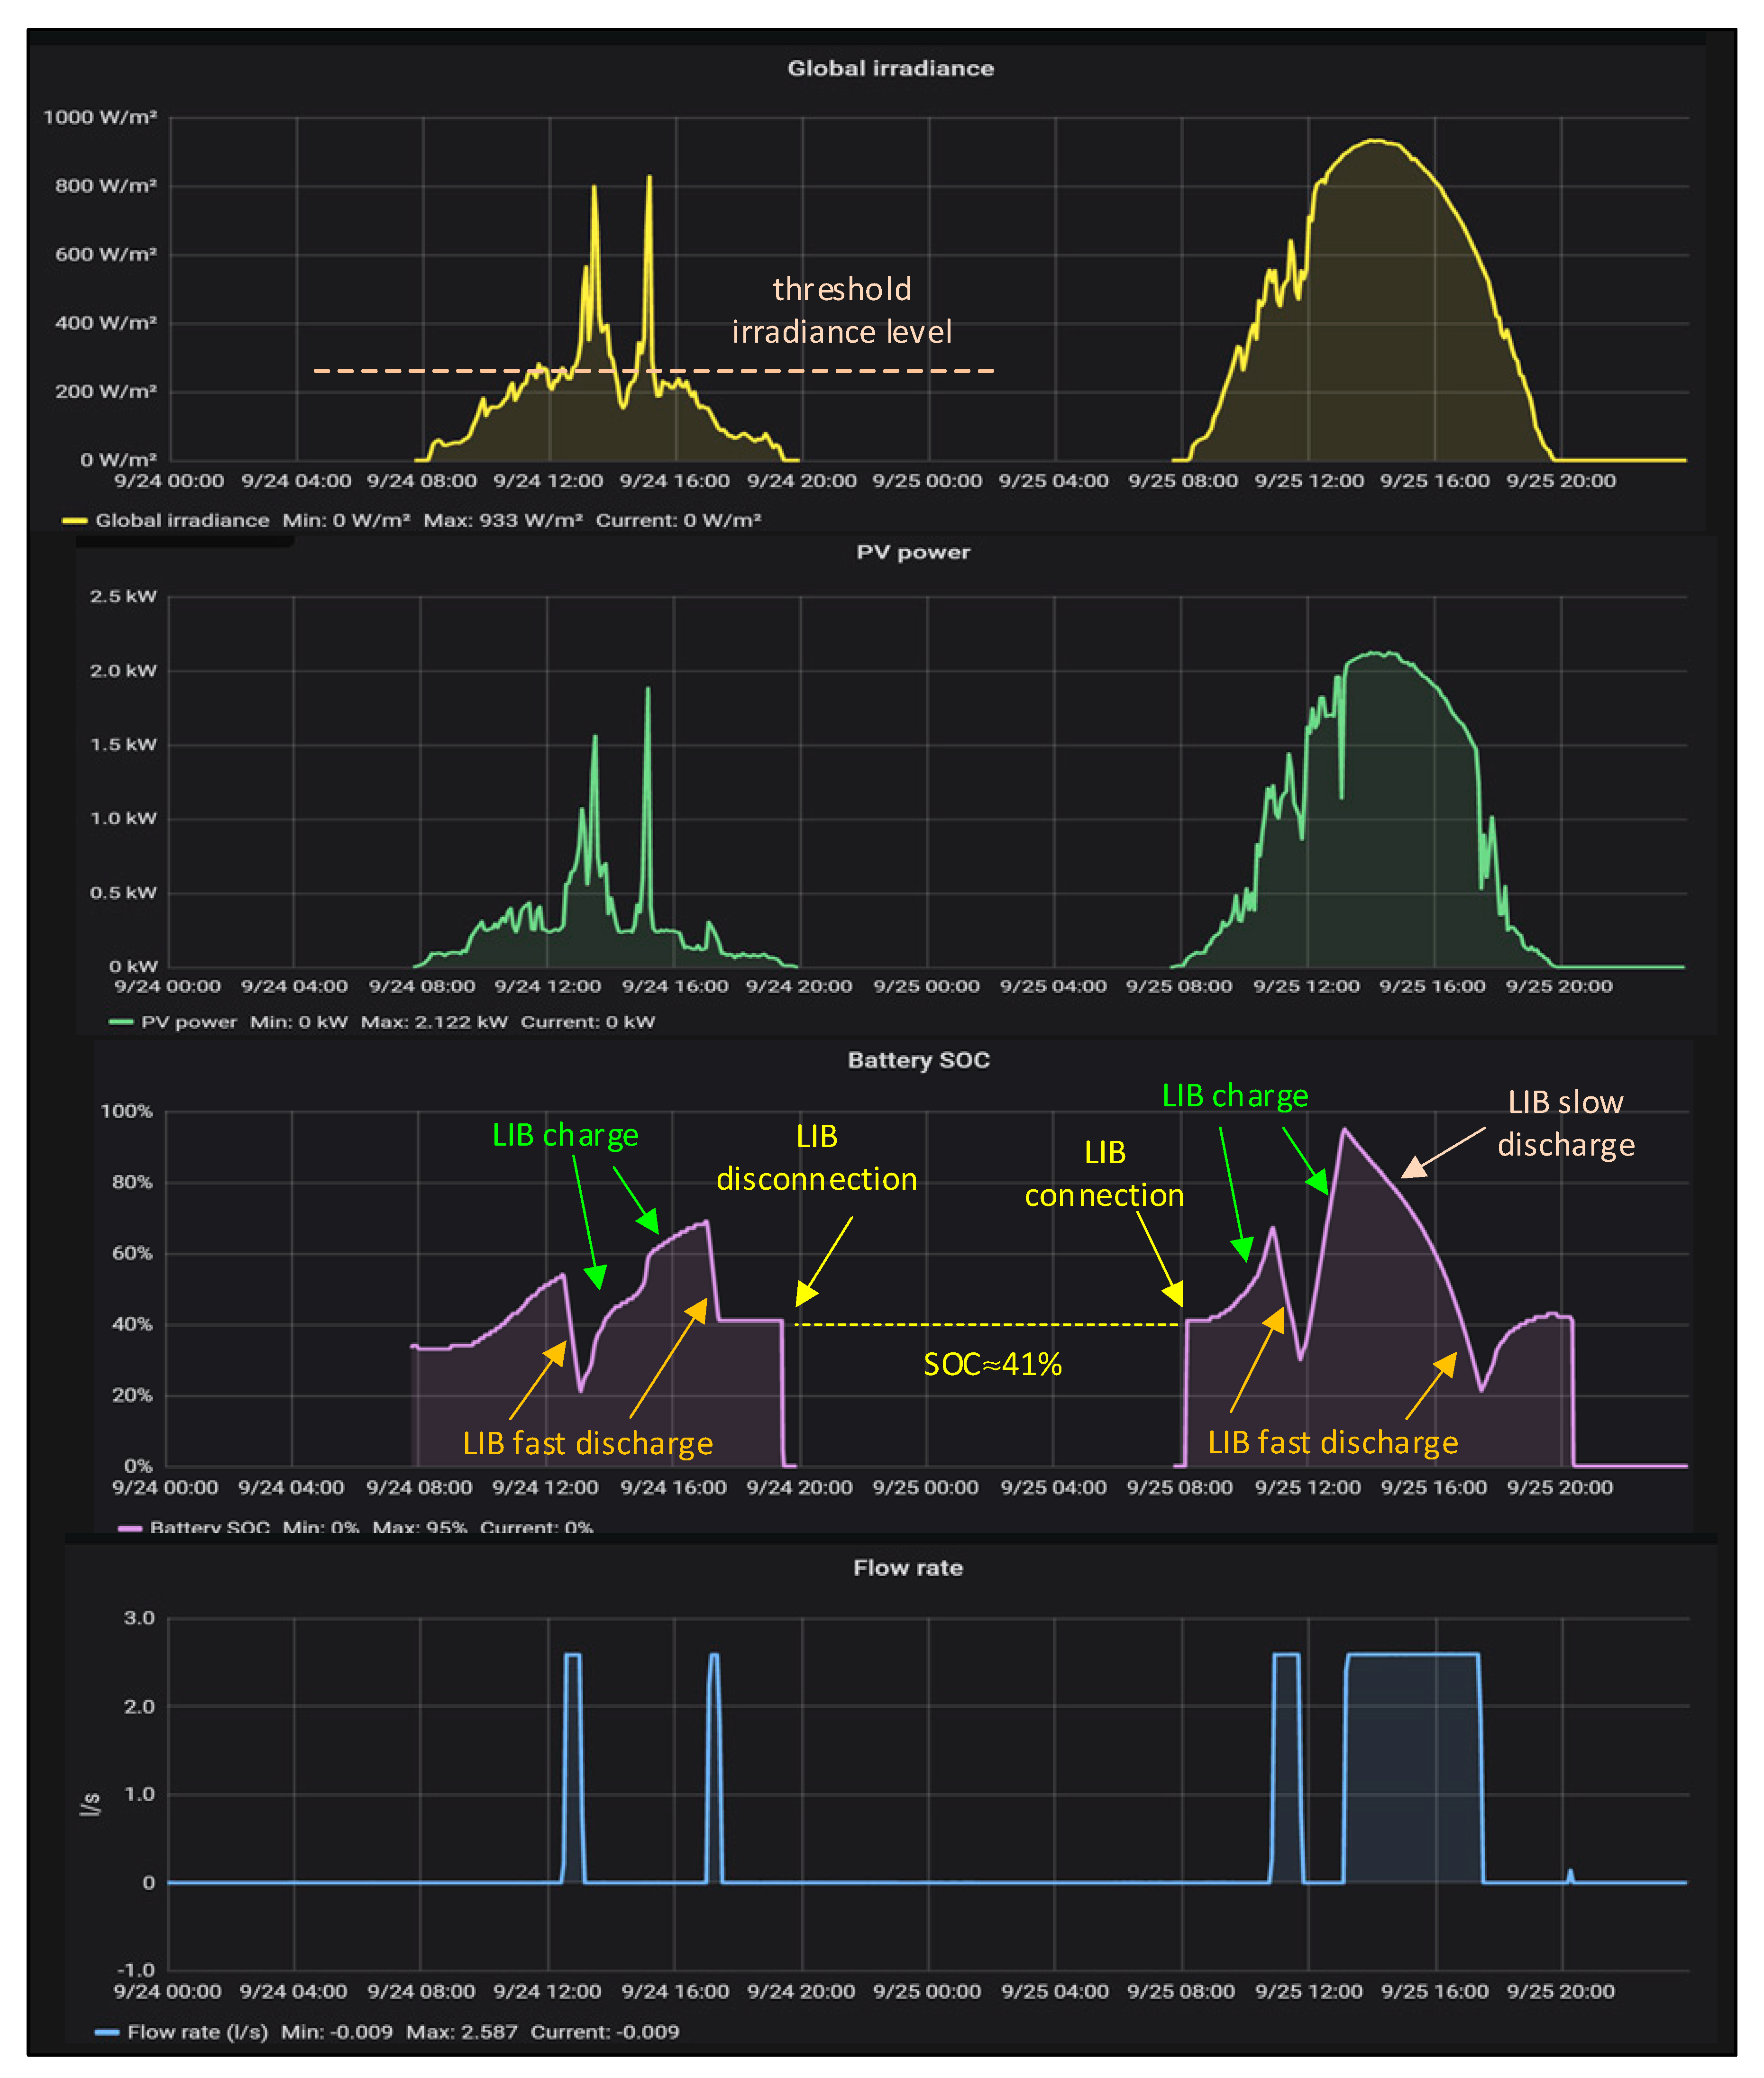
4.3. PV Water Pumping System with Lithium-Ion Battery Mode

The energy not generated in the DPVWPS mode when GI is lower than the irradiance pumping threshold, or when the PV power exceeds the VSD rating, could be stored in the LIB for use when the accumulated energy enables water to be pumped for a certain time, or until the SOC drops to a value that can be pre-set. The plots in Figure 14 show the results in the PVWPS+LIB operating mode.
The comparison with the results presented for the DPVWPS mode in Figure 13 enables us to identify the following benefits that the PVWPS+LIB mode can provide:
  • There is no irradiance threshold, so all the energy produced by the PV field can be stored in the battery or used for pumping water activating the VSD.
  • The VSD operates at its rated conditions, where the electromechanical efficiency is the maximum. The flow rate is constant during all the pumping intervals.
  • The PV field can operate continuously in the MPP, generating the maximum available energy and optimizing the use of the PV modules.
The plot of the SOC in the battery in Figure 14 provides information about the charging and discharging process in the LIB. For low irradiance levels, such as during cloudy days or at sunrise or sunset, the variation of the SOC is positive (charging the battery) with a low slope (low energy available from the PV field). It can be observed that when pumping in PVWPS+LIB mode, the SOC decreases rapidly when irradiance is low (e.g., 9/24), while for values of irradiance greater than 700 W/m2, the power generated by the PV field is quite near the power demanded by the VSD, and so the SOC decreases slowly due to the low level of power extracted from the battery (e.g., 9/25 from 13:00 to 16:00).
From the results obtained in the first month of operation, the following problems were identified:
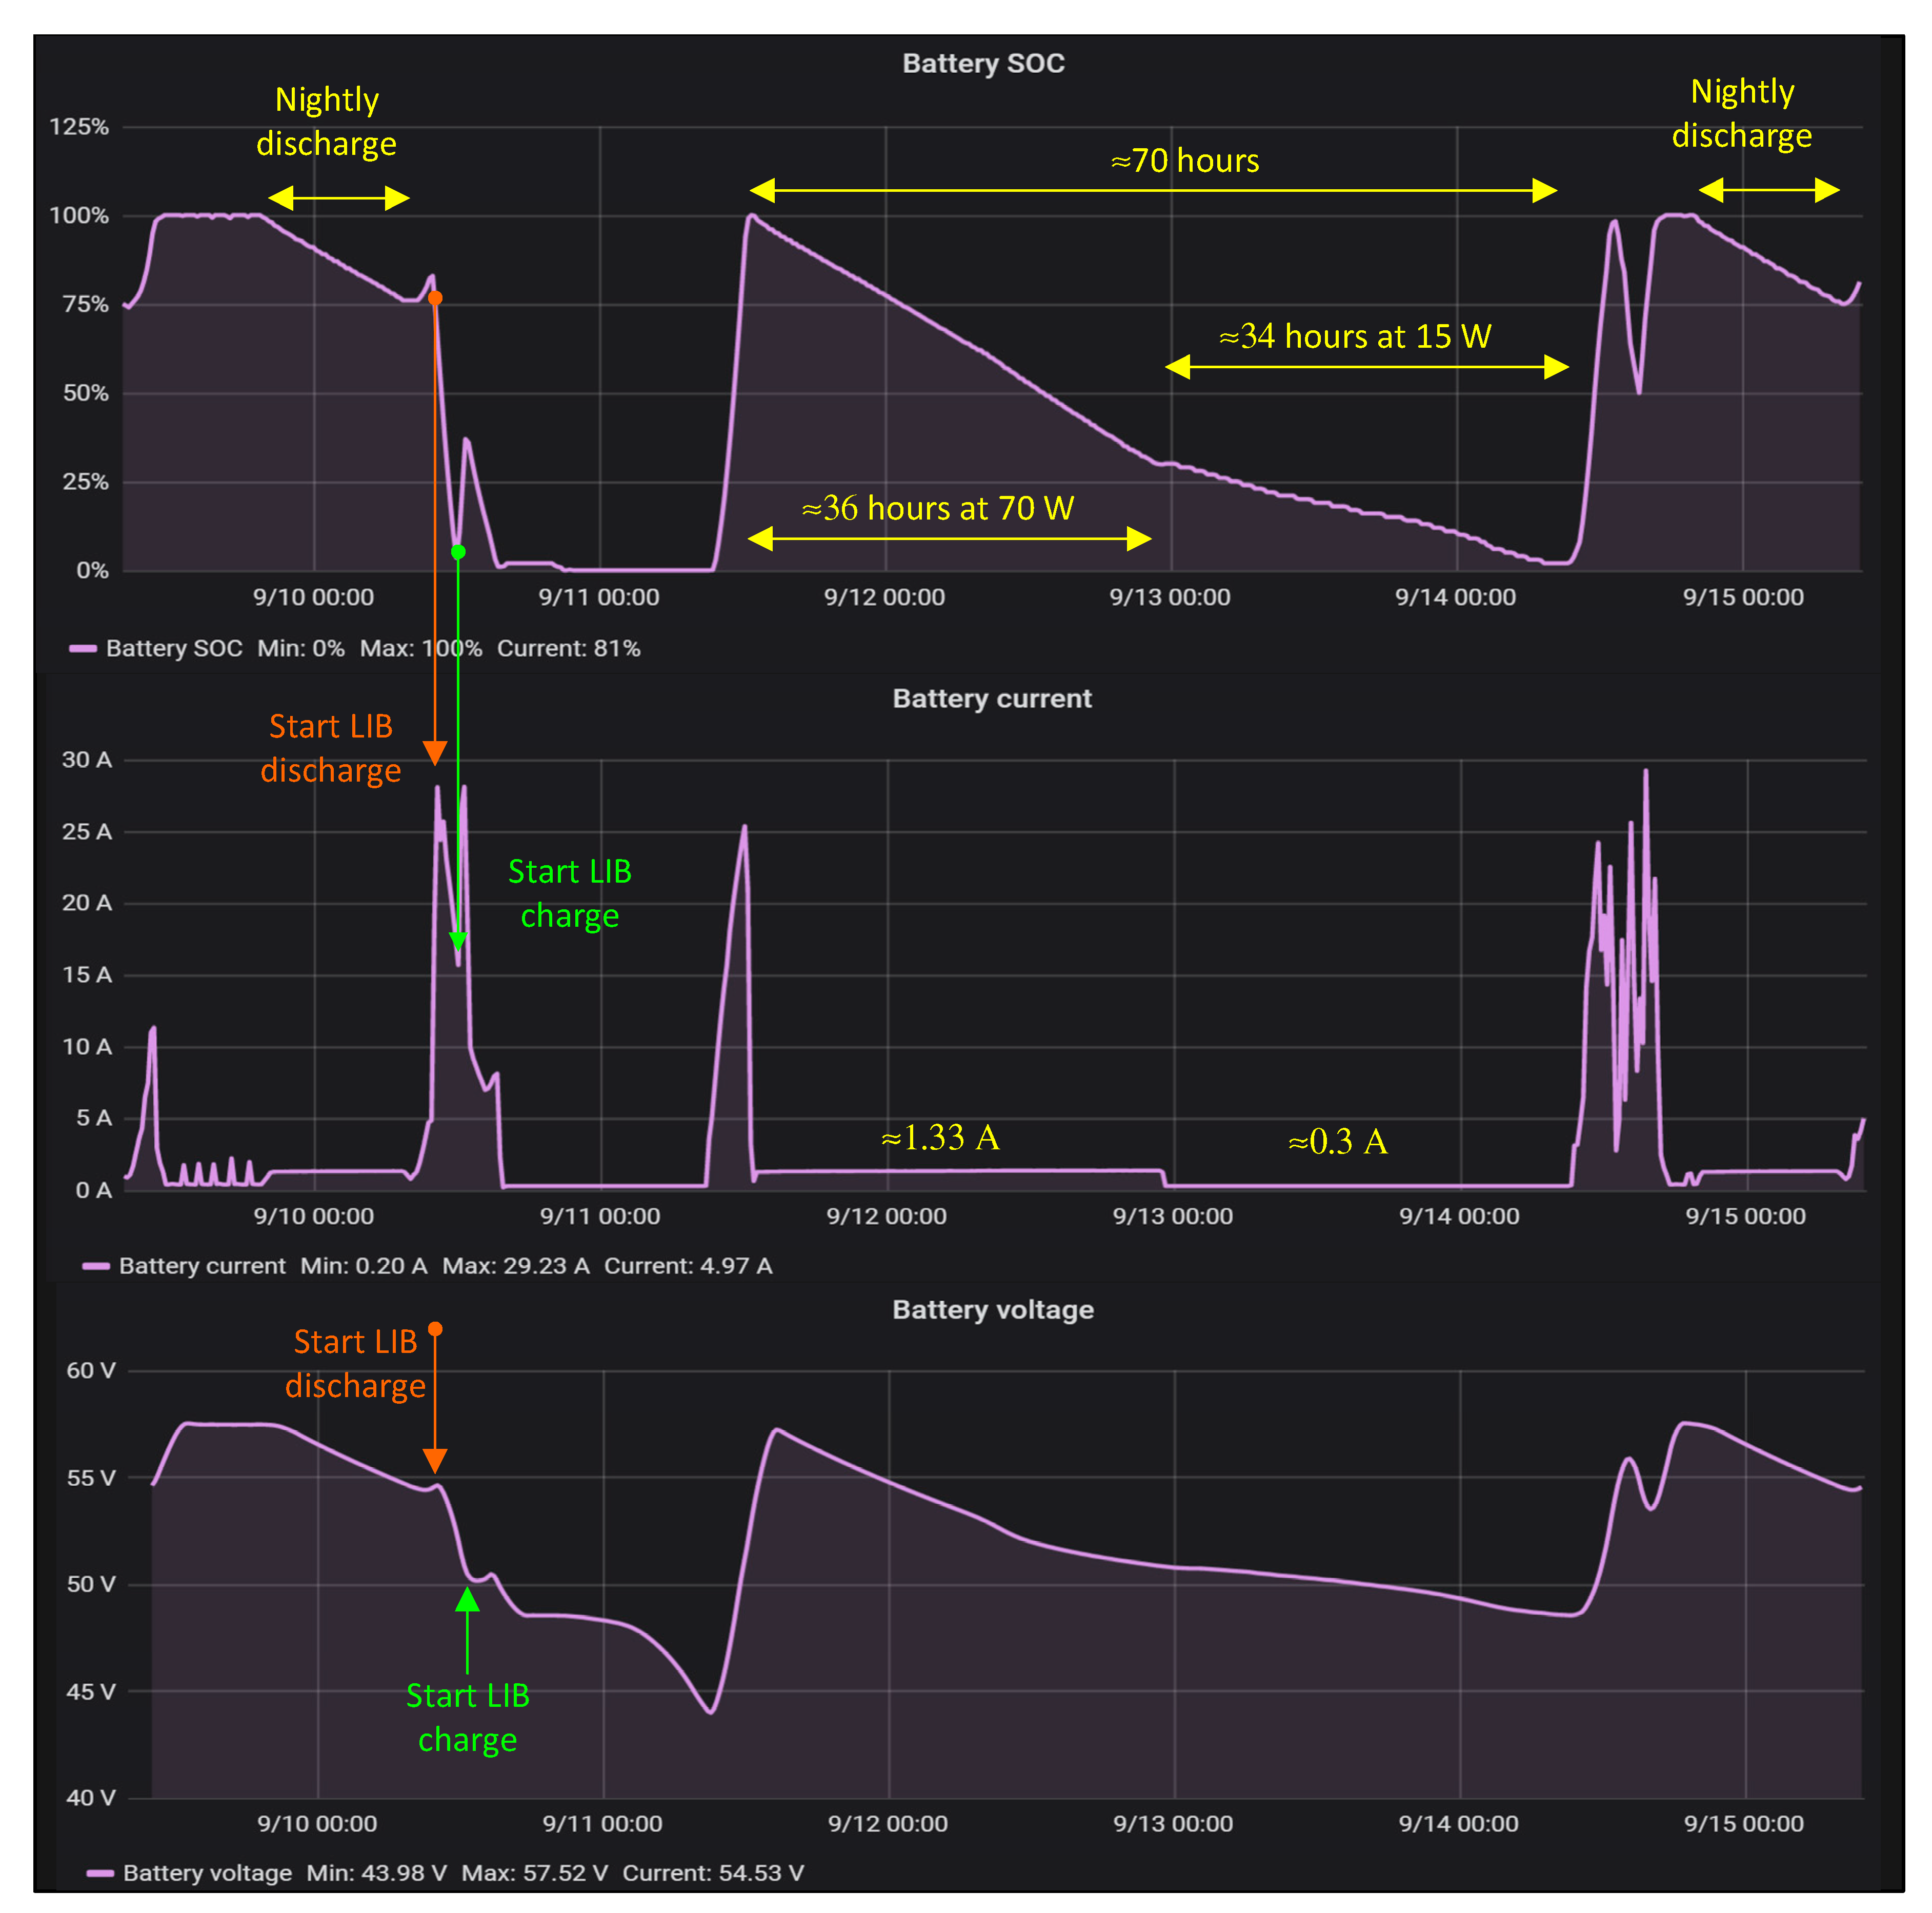
  • High standby consumption of the hybrid inverter occurs during nights in off-grid mode.
  • Unclear SOC management is implemented in the hybrid inverter.
  • Current in the battery provided in the Modbus-RTU protocol is given without sign.
Although the datum of the standby self-consumption of the hybrid inverter in the datasheet is smaller than 13 W [48], measurements made in the installations show that the real value is around 70 W. This situation was identified for the nights in which PV energy is unavailable and there are no loads connected to the hybrid inverter. Figure 15 shows the results of an SOC test performed during several days in which the PV field was connected to the hybrid inverter to recharge the battery only during some intervals. The nightly battery current that is represented in the middle plot in Figure 15 is fairly constant at around 1.33 A for a voltage in the battery in the range of 50 to 55 V. This consumption produces a nightly discharge of the battery that reduces the SOC by around 25% every night. SOC management in a LIB is a very important issue due to the direct effect of this parameter on the lifespan of an LIB, along with the aim to avoid physical damage to the battery [62,63]. The SOC curve in Figure 15 shows the nightly discharge, and the tests developed show how the management of the battery is not carried out correctly as deep discharges were allowed, which should have been limited to values of SOC = 20% by the inverter. A change in the slope of the SOC is seen from values of 30%, reducing the speed of discharge as the current decreases from 1.33 to about 0.3 A, although the discharge continues until reaching values of SOC = 0%.
It seems that the SOC values could correspond to the available SOC in the LIB because a real SOC of 0% should produce irreversible damage in the LIB. The BMS of the LIB should have disconnected the battery after reaching a minimum safety level to ensure that the LIB will be in a good SOH after a new recharging process, like that applied in the first hours of 9/11.
When the plot of the current and the SOC in the LIB were compared (start LIB discharge and start LIB charge arrows included in Figure 15), it was observed that the LIB current data are unsigned. This means that the battery performance analysis cannot be performed with the data provided by the hybrid inverter and the LIB. For future studies about LIB performance, a current sensor with signed data must be connected to the RS485 bus.
One of the advantages provided by the proposed monitoring system is the option of choosing the presentation interval of the data acquired (from values of 5 s). PV monitoring systems in commercial PV plants provide data with common granularities in the range of minutes (5, 10, 15, or 30 min) or one hour. Data acquisitions with sampling times on the scale of seconds depend on the number of devices connected on the RS485 bus. The GUI implemented in Grafana and the data exporter software available in the server calculate the average value of the recorded data depending on the selected granularity. This characteristic is extremely important when carrying out R&D&I work in the various fields associated with this PVWPS+LIB installation, e.g., efficiency and performance of the components in the PVWPS+LIB system, studies of storage in LIB, pump tests, comparisons between various pumping techniques, demand peak management, design and development of power electronics converters, artificial intelligence applied in the management of PVWPS+LIB systems, etc. As a demonstration of this feature, Figure 16 shows how the hybrid inverter manages the PV power to charge the LIB when the available PV power is between 70 and 850 W. The power extracted from the PV field for the irradiance values shown in the top plot must be a constant power proportional to the irradiance values, as is shown in the middle plot from 8:20 to 8:52 or after 10:20. In the interval between 8:52 to 10:20, the PV power varies between the correct value, the values at the top, and a base power of 200 W (approx.). This behavior shows that the current regulator of the power converter that manages the battery charge is not working well in the range of available PV powers between 70 and 850 W. Measurements performed with a current clamp show a variable value of the battery current in these cases, and this should be considered during some O&M operations that may take place in a commercial facility.
Based on the results obtained with the monitoring system presented in the previous sections, new experiments are proposed to improve the operation and efficiency of the PVWPS+LIB system: These include tests for new versions of the hybrid inverter and other models from other manufacturers, tests for the behavior of high-voltage LIB batteries, studies on the effect of oversizing the PV peak power, and an analysis of sizing approaches for the selection of the LIB needed in an installation. The main drawbacks of the PVWPS+LIB mode when compared with the DPVWPS are related to the energy losses associated with the hybrid inverter and the LIB charging and discharging processes. The main benefits of the PVWPS+LIB mode with respect to the DPVWPS are the following:
  • The system demonstrates perfect tracking of the MPP of the PV field for all levels of irradiance, without the irradiance threshold common in DPVWPS schemes.
  • The system prevents pump stops due to the passage of clouds that cause sudden changes in irradiance. The LIB is charged with excess energy due to increased irradiance caused by cloud reflections, and this is discharged following the arrival of cloud shadows over the PV field.
  • The pump operates at its nominal rated values, where efficiency in the electrical to mechanical conversion is maximum.
The design of the photovoltaic field is made more flexible by allowing a greater number of configurations of the photovoltaic field due to the extended input range of the hybrid inverter with respect to that of the VSD. A greater oversizing of the PV field is applicable in the PVWPS+LIB scheme if a greater LIB energy capacity is used. In this way, the total number of pumping hours at nominal rated conditions in the pump is increased.

5. Conclusions

PV monitoring systems play an important role in the current development of PV systems. Although monitoring systems are mainly used to monitor and evaluate the performance of PV plants, they are also used to facilitate O&M works or analyze the performance of new developments built during R&D projects. The monitoring system presented in this work is applied to a small-scale prototype of an autonomous solar water pumping system intended for the constant supply of water without use of fossil fuels. A LIB was used to store the surplus energy that is provided to the loads when the sun is not shining. Results obtained with the different modes of operation of the facility demonstrated the features of the proposed quasi-real-time PV monitoring system, where robustness, reliability, and low sampling times represent the most important aspects.
Commercial devices were used in the data acquisition stage, connecting all the devices through a Modbus-RTU protocol over an RS485 bus. A description of the main components of the PVWPS+LIB facility was performed, including the variables acquired by the monitoring system and the sensors used.
In the data gateway stage, a Raspberry Pi was used as a low-cost server for wireless communication, collecting data from all the slaves connected to the RS485 bus managed by the UWP3. The Raspberry Pi sent the data to a DB server with a sampling rate that can be chosen for the implemented system in a minimum of five seconds, although this value may vary if many slaves are connected on the RS485 bus. A PM2 free open-source process manager was included in the Raspberry Pi to launch the execution of the PV monitoring application.
The data processing stage used InfluxDB as open-source database storage and Grafana as open-source data visualization software. A data exporter program enabled authorized users to select and copy the data stored in InfluxDB, creating Excel or *.csv files with the variables selected by the user, with a defined time interval and the desired data granularity.
Some experimental results were included for several of the modes that can be configured in the PV facility, i.e., a grid-connected PV system, a direct PV water pumping system, and a PV water pumping system with a LIB. A preliminary analysis of the recorded data enabled identifying some of the drawbacks of this direct PV water pumping mode, such as energy losses due to the threshold irradiance level for starting the water pump, or the clipping of the PV power when the nominal power value of the VSD is reached. The main benefits of the PVWPS+LIB operating mode were detailed, although some problems were identified after the analysis of the first experimental results.
Regarding other monitoring systems, the option to select the presentation interval of the acquired data from values of five seconds enables using the proposed monitoring system in R&D projects in fields such as renewable energies, battery energy storage, smart grid, power electronic converters, and energy efficiency installations. The results presented in the article demonstrate how the monitoring system is useful for R&D engineers, service technicians for O&M activities, and financial managers (owners, investors, and bankers, etc.).

Author Contributions

Conceptualization, F.J.G.-S., S.O.-G., A.E.-A., S.S.-C.; methodology, F.J.G.-S., S.O.-G., A.E.-A.; software, F.J.G.-S., S.O.-G., A.E.-A., C.I.M.-M.; validation, F.J.G.-S., S.O.-G., A.E.-A., C.I.M.-M., P.G.-A.; formal analysis, P.G.-A., I.B.-P., C.I.M.-M., M.G., S.S.-C.; investigation, P.G.-A., I.B.-P., C.I.M.-M., M.G., S.S.-C.; resources, F.J.G.-S., P.G.-A., I.B.-P., S.S.-C.; data curation, F.J.G.-S., A.E.-A., P.G.-A.; writing—original draft preparation, S.S.-C., C.I.M.-M.; writing—review and editing, S.O.-G., M.G.; visualization, M.G., S.S.-C.; supervision, F.J.G.-S., S.O.-G., P.G.-A.; project administration, S.O.-G.; funding acquisition, S.O.-G., P.G.-A., I.B.-P., S.S.-C. All authors have read and agreed to the published version of the manuscript.

Funding

This research was funded by Universitat Politècnica de València (UPV; Program ADSIDEO-cooperation 2017, project titled “Characterization of sustainable systems for the pumping of water for human consumption in developing regions and/or refugee camps in Kenya through the implementation of isolated photovoltaic systems with new generation lithium-ion batteries”).

Acknowledgments

We thank the Vice Chancellor of Infrastructure at the UPV for the financial support that has enabled the electrical installation of the project to be completed. We also thank the Goodwe company for the donation of a hybrid inverter, even though they were aware that the inverter would be used in extreme conditions for which it was not designed. The project could not have started without this contribution, and we would not have acquired the knowledge that enables us to progress in these humanitarian applications. We thank the Carlos Gavazzi company (monitoring and data acquisition system) for its involvement in the project. Lastly, thank you to Alberto Ibáñez Llario, Global Solar Energy and Water Advisor at the United Nations Agency for Migration for introducing us to the field of humanitarian aid.

Conflicts of Interest

The authors declare no conflict of interest.

Nomenclature

ACAlternate current
ADCAnalog-to-digital converter
AMAir mass
AVAverage
BMSBattery management system
DBDatabase
DCDirect current
DGDistributed generation
DGTDigit
DPVWPSDirect photovoltaic water pumping system
EPCU_outOutput energy of the power converter unit
EPVPV energy
ESSEnergy storage systems
gTemperature coefficient of PMPP (in%/K)
GIGlobal irradiance (in W/m2)
GUIGraphical user interface
IMPPCurrent at the maximum power point
IPCU_outOutput current of the power converter unit
IPVPV current
ISCShort-circuit current
LIBLithium-ion battery
MPPMaximum power point
MPPTMaximum power point tracking
NOCTNormal operating cell temperature
OVOvervoltage
PCPersonal computer
PFPower factor
PMPPPower at the maximum power point
PRPerformance ratio
PPCU_outOutput power of the power converter unit
PPVPV power
PVPhotovoltaic
PVWPSPhotovoltaic water pumping system
PVWPS+LIBPhotovoltaic water pumping system with storage in a lithium-ion battery
QFlow rate
RDGReading
RERenewable energies
RTemTerminal resistance for the RS485 bus
SOCState of charge
SOHState of health
STCStandard test conditions (AM 1.5, Tcell = 25 ºC, and 1000 W/m2)
TambAmbient temperature (ºC)
TcellPV cell temperature (ºC)
TDHTotal dynamic head
TwWater temperature
VMPPVoltage at maximum power point
VOCOpen circuit voltage
VPCU_outOutput voltage of the power converter unit
VPVPV voltage
VSDVariable speed drive
WPSWater pumping system
ηinvInverter efficiency

References

  1. United Nations—Department of Economic and Social Affairs. Sustainable Development Goals. Available online: https://sustainabledevelopment.un.org/sdgs (accessed on 23 February 2020).
  2. Luo, X.; Wang, J.; Dooner, M.; Clarke, J. Overview of current development in electrical energy storage technologies and the application potential in power system operation. Appl. Energy 2015, 137, 511–536. [Google Scholar] [CrossRef] [Green Version]
  3. Amirante, R.; Cassone, E.; Distaso, E.; Tamburrano, P. Overview on recent developments in energy storage: Mechanical, electrochemical and hydrogen technologies. Energy Convers. Manag. 2017, 132, 372–387. [Google Scholar] [CrossRef]
  4. Gielen, D.; Boshell, F.; Saygin, D.; Bazilian, M.D.; Wagner, N.; Gorini, R. The role of renewable energy in the global energy transformation. Energy Strateg. Rev. 2019, 24, 38–50. [Google Scholar] [CrossRef]
  5. Hosseinzadeh, N.; Mousavi, A.; Teirab, A.; Varzandeh, S.; Al-Hinai, A. Real-time monitoring and control of a microgrid—Pilot project: Hardware and software. In Proceedings of the 29th Australasian Universities Power Engineering Conference, AUPEC 2019, Nadi, Fiji, 26–29 November 2019; pp. 1–6. [Google Scholar] [CrossRef]
  6. Yap, K.Y.; Sarimuthu, C.R.; Lim, J.M.Y. Virtual inertia-based inverters for mitigating frequency instability in grid-connected renewable energy system: A Review. Appl. Sci. 2019, 9, 5300. [Google Scholar] [CrossRef] [Green Version]
  7. Fan, X.; Liu, B.; Liu, J.; Ding, J.; Han, X.; Deng, Y.; Lv, X.; Xie, Y.; Chen, B.; Hu, W.; et al. Battery Technologies for Grid-Level Large-Scale Electrical Energy Storage. Trans. Tianjin Univ. 2020, 26, 92–103. [Google Scholar] [CrossRef] [Green Version]
  8. Groppi, D.; Pfeifer, A.; Garcia, D.A.; Krajačić, G.; Duić, N. A review on energy storage and demand side management solutions in smart energy islands. Renew. Sustain. Energy Rev. 2021, 135, 1–14. [Google Scholar] [CrossRef]
  9. Chen, T.; Jin, Y.; Lv, H.; Yang, A.; Liu, M.; Chen, B.; Xie, Y.; Chen, Q. Applications of Lithium-Ion Batteries in Grid-Scale Energy Storage Systems. Trans. Tianjin Univ. 2020, 26, 208–217. [Google Scholar] [CrossRef] [Green Version]
  10. Kharseh, M.; Wallbaum, H. How adding a battery to a grid-connected photovoltaic system can increase its economic performance: A comparison of different scenarios. Energies 2019, 12, 30. [Google Scholar] [CrossRef] [Green Version]
  11. Kharrazi, A.; Sreeram, V.; Mishra, Y. Assessment techniques of the impact of grid-tied rooftop photovoltaic generation on the power quality of low voltage distribution network—A review. Renew. Sustain. Energy Rev. 2020, 120, 1–16. [Google Scholar] [CrossRef]
  12. Nikzad, A.; Chahartaghi, M.; Ahmadi, M.H. Technical, economic, and environmental modeling of solar water pump for irrigation of rice in Mazandaran province in Iran: A case study. J. Clean. Prod. 2019, 239, 1–19. [Google Scholar] [CrossRef]
  13. Chandel, S.S.; Nagaraju Naik, M.; Chandel, R. Review of solar photovoltaic water pumping system technology for irrigation and community drinking water supplies. Renew. Sustain. Energy Rev. 2015, 49, 1084–1099. [Google Scholar] [CrossRef]
  14. Sontake, V.C.; Kalamkar, V.R. Solar photovoltaic water pumping system—A comprehensive review. Renew. Sustain. Energy Rev. 2016, 59, 1038–1067. [Google Scholar] [CrossRef]
  15. Chandel, S.S.; Naik, M.N.; Chandel, R. Review of performance studies of direct coupled photovoltaic water pumping systems and case study. Renew. Sustain. Energy Rev. 2017, 76, 163–175. [Google Scholar] [CrossRef]
  16. Aliyu, M.; Hassan, G.; Said, S.A.; Siddiqui, M.U.; Alawami, A.T.; Elamin, I.M. A review of solar-powered water pumping systems. Renew. Sustain. Energy Rev. 2018, 87, 61–76. [Google Scholar] [CrossRef]
  17. Pardo, M.Á.; Manzano, J.; Valdes-Abellan, J.; Cobacho, R. Standalone direct pumping photovoltaic system or energy storage in batteries for supplying irrigation networks. Cost analysis. Sci. Total Environ. 2019, 673, 821–830. [Google Scholar] [CrossRef] [PubMed] [Green Version]
  18. Kaldellis, J.K.; Spyropoulos, G.C.; Kavadias, K.A.; Koronaki, I.P. Experimental validation of autonomous PV-based water pumping system optimum sizing. Renew. Energy 2009, 34, 1106–1113. [Google Scholar] [CrossRef]
  19. Madeti, S.R.; Singh, S.N. Monitoring system for photovoltaic plants: A. review. Renew. Sustain. Energy Rev. 2017, 67, 1180–1207. [Google Scholar] [CrossRef]
  20. Victor, J.L.F.; Jucá, S.C.S.; Pereira, R.I.S.; Carvalho, P.C.M.; Fernández-Ramírez, L.M. IoT monitoring systems applied to photovoltaic generation: The relevance for increasing decentralized plants. Renew. Energy Power Qual. J. 2019, 17, 536–545. [Google Scholar] [CrossRef]
  21. Li, Y.; Lin, P.; Zhou, H.; Chen, Z.; Wu, L.; Cheng, S.; Su, F. On-Line Monitoring System Based on Open Source Platform for Photovoltaic Array. Energy Procedia 2018, 145, 427–433. [Google Scholar] [CrossRef]
  22. Deshmukh, M.K.; Singh, A.B. Online monitoring of roof-mounted stand-alone solar photovoltaic system on residential building. Mater. Today Proc. 2019, 23, 56–61. [Google Scholar] [CrossRef]
  23. Samara, S.; Natsheh, E. Intelligent Real-Time Photovoltaic Panel Monitoring System Using Artificial Neural Networks. IEEE Access 2019, 7, 50287–50299. [Google Scholar] [CrossRef]
  24. Triki-Lahiani, A.; Bennani-Ben Abdelghani, A.; Slama-Belkhodja, I. Fault detection and monitoring systems for photovoltaic installations: A review. Renew. Sustain. Energy Rev. 2018, 82, 2680–2692. [Google Scholar] [CrossRef]
  25. Lazzaretti, A.E.; da Costa, C.H.; Rodrigues, M.P.; Yamada, G.D.; Lexinoski, G.; Moritz, G.L.; Oroski, E.; de Goes, R.E.; Ribeiro Linhares, R.; Stadzisz, P.C.; et al. A monitoring system for online fault detection and classification in photovoltaic plants. Sensors 2020, 20, 4688. [Google Scholar] [CrossRef] [PubMed]
  26. International Electrotechnical Commission. Photovoltaic System Performance Monitoring. Guidelines for Measurement, Data Exchange and Analysis; IEC 61724:1998; International Electrotechnical Commission: Geneva, Switzerland, 1998. [Google Scholar]
  27. International Electrotechnical Commission. Photovoltaic System Performance-Part 1: Monitoring; IEC 61724-1:2017; International Electrotechnical Commission: Geneva, Switzerland, 2017. [Google Scholar]
  28. Livera, A.; Theristis, M.; Makrides, G.; Georghiou, G.E. Recent advances in failure diagnosis techniques based on performance data analysis for grid-connected photovoltaic systems. Renew. Energy 2019, 133, 126–143. [Google Scholar] [CrossRef]
  29. Benghanem, M.; Arab, A.H.; Mukadam, K. Data acquisition system for photovoltaic water pumps. Renew. Energy 1999, 17, 385–396. [Google Scholar] [CrossRef]
  30. Koutroulis, E.; Kalaitzakis, K. Development of an integrated data-acquisition system for renewable energy sources systems monitoring. Renew. Energy 2003, 28, 139–152. [Google Scholar] [CrossRef]
  31. Durusun, M.; Yilmaz, E.N. Design and application of internet based solar pumps and monitoring system. J. Appl. Sci. 2008, 8, 2859–2866. [Google Scholar] [CrossRef]
  32. Mahjoubi, A.; Mechlouch, R.F.; Ben Brahim, A. A low cost wireless data acquisition system for a remote photovoltaic (PV) water pumping system. Energies 2011, 4, 68–89. [Google Scholar] [CrossRef] [Green Version]
  33. Fuentes, M.; Vivar, M.; Burgos, J.M.; Aguilera, J.; Vacas, J.A. Design of an accurate, low-cost autonomous data logger for PV system monitoring using Arduino™ that complies with IEC standards. Sol. Energy Mater. Sol. Cells 2014, 130, 529–543. [Google Scholar] [CrossRef]
  34. Yahyaoui, I.; Segatto, M.E.V. A practical technique for on-line monitoring of a photovoltaic plant connected to a single-phase grid. Energy Convers. Manag. 2017, 132, 198–206. [Google Scholar] [CrossRef]
  35. Rezk, H.; Tyukhov, I.; Al-Dhaifallah, M.; Tikhonov, A. Performance of data acquisition system for monitoring PV system parameters. Meas. J. Int. Meas. Confed. 2017, 104, 204–211. [Google Scholar] [CrossRef]
  36. Azlan Othman, N.; Riduan Zainodin, M.; Anuar, N.; Damanhuri, N.S. Remote Monitoring System Development via Raspberry-Pi for Small Scale Standalone PV Plant. In Proceedings of the 2017 IEEE International Conference on Control System, Computing and Engineering (ICCSCE 2017), Batu Ferringhi, Penang, Malaysia, 24–26 November 2017; pp. 1–6. [Google Scholar]
  37. Li, Y.F.; Lin, P.J.; Zhou, H.F.; Chen, Z.C.; Wu, L.J.; Cheng, S.Y.; Su, F.P. On-line monitoring system of PV array based on internet of things technology. In Proceedings of the IOP Conference Series: Earth and Environmental Science, Kunming, China, 22–25 September 2017; Volume 93, pp. 1–13. [Google Scholar] [CrossRef] [Green Version]
  38. Paredes-Parra, J.M.; Mateo-Aroca, A.; Silvente-Niñirola, G.; Bueso, M.C.; Molina-García, Á. PV module monitoring system based on low-cost solutions: Wireless raspberry application and assessment. Energies 2018, 11, 3051. [Google Scholar] [CrossRef] [Green Version]
  39. Paredes-Parra, J.M.; García-Sánchez, A.J.; Mateo-Aroca, A.; Molina-García, Á. An alternative internet-of-things solution based on LOra for PV power plants: Data monitoring and management. Energies 2019, 12, 881. [Google Scholar] [CrossRef] [Green Version]
  40. Beránek, V.; Olšan, T.; Libra, M.; Poulek, V.; Sedláček, J.; Dang, M.-Q.; Tyukhov, I.I. New monitoring system for photovoltaic power plants’ management. Energies 2018, 11, 2495. [Google Scholar] [CrossRef] [Green Version]
  41. Mellit, A.; Hamied, A.; Lughi, V.; Pavan, A.M. A Low-Cost Monitoring and Fault Detection System for Stand-Alone Photovoltaic Systems Using IoT Technique. Lect. Notes Electr. Eng. 2020, 604, 349–358. [Google Scholar] [CrossRef]
  42. Jiménez-Delgado, E.; Meza, C.; Méndez-Porras, A.; Alfaro-Velasco, J. Data Management Infrastructure from Initiatives on Photovoltaic Solar Energy. Adv. Intell. Syst. Comput. 2019, 918, 113–121. [Google Scholar] [CrossRef]
  43. Da Costa, C.H.; Rodrigues, M.P.; Yamada, G.D.; Rodrigues, G.V.; Jiayu, X.; Moritz, G.L.; Oroski, E.; de Goes, R.E.; Lazzaretti, A.E.; Stadzisz, P.C. A Monitoring and Management System for Medium-Scale Photovoltaic Plants. In Proceedings of the 2019 IEEE PES Innovative Smart Grid Technologies Europe (ISGT-Europe), Bucharest, Romania, 29 September–2 October 2019; pp. 1–6. [Google Scholar]
  44. Rus-Casas, C.; Jiménez-Castillo, G.; Aguilar-Peña, J.D.; Fernández-Carrasco, J.I.; Josémuñoz-Rodríguez, F. Development of a prototype for monitoring photovoltaic self-consumption systems. Electronics 2020, 9, 67. [Google Scholar] [CrossRef] [Green Version]
  45. Advantech. ADAM 4017+ 8-ch Analog Input Module with Modbus 2018. Available online: https://advdownload.advantech.com/productfile/PIS/ADAM-4017+/Product-Datasheet/ADAM-4017+20180910101921.pdf (accessed on 10 December 2020).
  46. Carlo Gavazzi Automation. The Evolution of Photovoltaic Monitoring 2015. Available online: http://www.gavazzi-automation.com/docs/download_area/EOS.pdf (accessed on 27 June 2019).
  47. Carlo Gavazzi Automation. UWP 3.8 Universal Web Platform. Available online: http://www.productselection.net/Pdf/uk/UWP3.0_DS.pdf (accessed on 12 June 2020).
  48. Goodwe. GW3684D-ES Datasheet. Available online: https://en.goodwe.com/Public/Uploads/products/spec/en/ES.pdf (accessed on 6 June 2020).
  49. LG Chem. RESU ESS Battery Datasheet. Available online: https://www.europe-solarstore.com/download/lgchem/LG_Chem_RESU_datasheet.pdf (accessed on 18 May 2020).
  50. Atersa. EasySun Pump. Available online: http://www.atersa.com/en/products-services/water-pump/esp-easysun-pump-powered-by-fuji-electric/ (accessed on 7 June 2020).
  51. Bombas Ideal. Electric Submersible Pumps—S Type Data Sheet. Available online: http://www.bombasideal.com/wp-content/uploads/2018/07/Catalogo-SUM-1078.compressed.pdf (accessed on 14 November 2020).
  52. Carlo Gavazzi. EM210 Energy Analyzer. Available online: https://gavazziautomation.com/images/PIM/DATASHEET/ENG/EM210MID_EN.pdf (accessed on 12 June 2020).
  53. Carlo Gavazzi. CTD-1X Current Transformer Data Sheet. Available online: https://gavazziautomation.com/images/PIM/DATASHEET/ENG/CTD1X_DS_ENG.pdf (accessed on 12 June 2020).
  54. Flomag. Flomag-ICM Data Sheet. Available online: http://www.flomag.cz/images/download/Flomag-ICM_Datasheet_GB_13_en.pdf (accessed on 22 September 2020).
  55. Endress+Hauser. Temperature Sensor Thermophant T TTR35. Available online: https://www.endress.com/en/field-instruments-overview/temperature-measurement-thermometers-transmitters/Hygienic-temperature-switch-TTR35 (accessed on 16 May 2020).
  56. T.C. Thermocouple T-Type Datasheet. Available online: https://www.tc.co.uk/ (accessed on 14 November 2020).
  57. Endress+Hauser. Temperature Transmitter for Thermocouples—iTEMP TC TMT128—Data Sheet. Available online: https://portal.endress.com/wa001/dla/5000223/2570/000/02/ti096ren_1008.pdf (accessed on 2 November 2020).
  58. Labom. Pressure Transmitter CB3010. Available online: https://www.labom.com/en/downloads/technical-information/data-sheets.html (accessed on 10 September 2020).
  59. Nuova Fima. Pressure Transmitter ST 18. Available online: https://www.nuovafima.com/en/prodotti/st-18-en/ (accessed on 15 July 2020).
  60. Ali, A.S.; Coté, C.; Heidarinejad, M.; Stephens, B. Elemental: An open-source wireless hardware and software platform for building energy and indoor environmental monitoring and control. Sensors 2019, 19, 4017. [Google Scholar] [CrossRef] [Green Version]
  61. Pieš, M.; Hájovský, R.; Velička, J. Wireless measuring system for monitoring the condition of devices designed to protect line structures. Sensors 2020, 20, 2512. [Google Scholar] [CrossRef]
  62. Rivera-Barrera, J.P.; Muñoz-Galeano, N.; Sarmiento-Maldonado, H.O. Soc estimation for lithium-ion batteries: Review and future challenges. Electronics 2017, 6, 102. [Google Scholar] [CrossRef] [Green Version]
  63. Hannan, M.A.; Lipu, M.S.H.; Hussain, A.; Mohamed, A. A review of lithium-ion battery state of charge estimation and management system in electric vehicle applications: Challenges and recommendations. Renew. Sustain. Energy Rev. 2017, 78, 834–854. [Google Scholar] [CrossRef]
Figure 1. Block diagram of a photovoltaic water pumping system (PVWPS) and the main magnitudes measured by the monitoring system.
Sustainability 12 10651 g001
Figure 2. Parts of a monitoring system.
Sustainability 12 10651 g002
Figure 3. Photovoltaic (PV) installation on the roof terrace. (a) View of the PV field, with the electrical enclosure behind the modules. (b) View of the components included in the electrical enclosure.
Sustainability 12 10651 g003
Figure 4. Devices mounted in the lab: (a) electronic equipment and electrical panel that connects roof and lab parts of the installation; (b) hydraulic sensors and electrical panel.
Sustainability 12 10651 g004
Figure 5. General block diagram of the facility.
Sustainability 12 10651 g005
Figure 6. Block diagram of the devices connected with the RS485 bus in the PVWPS with the Li-ion battery energy storage (PVWPS+LIB) facility.
Sustainability 12 10651 g006
Figure 7. Block diagram of the monitoring system.
Sustainability 12 10651 g007
Figure 8. Flowchart of the program for the data acquisition and storage in the DB.
Sustainability 12 10651 g008
Figure 9. Interaction diagrams using unified modelling language (UML) methodology.
Sustainability 12 10651 g009
Figure 10. Hierarchy of modules in the developed program.
Sustainability 12 10651 g010
Figure 11. Structure of the Slave.js file.
Sustainability 12 10651 g011
Figure 12. Values obtained in the system operating as the grid-connected mode (from 07/10 00:00 to 07/14 23:59).
Sustainability 12 10651 g012
Figure 13. Values obtained in the system operating in the Direct PVWPS (DPVWPS) mode (from 10/02 00:00 to 10/3 23:59).
Sustainability 12 10651 g013
Figure 14. Values obtained in the system operating in the PVWPS+LIB mode (from 09/24 00:00 to 09/25 23:59).
Sustainability 12 10651 g014
Figure 15. Values in the battery from 09/9 08:00 to 09/15 10:00.
Sustainability 12 10651 g015
Figure 16. Example of the problems in the current regulator of the hybrid inverter when the available photovoltaic power is small during the morning of the 6 October (from 08:15 to 10:30).
Sustainability 12 10651 g016
Table 1. Characteristic PV field parameters under STC conditions (1000 W/m2, Tcell = 25 °C, AM 1.5).
Open circuit voltage (VOC)363.2 V
Voltage at maximum power point (VMPP)293.6 V
Short-circuit current (ISC)8.8 A
Current at the maximum power point (IMPP)8.3 A
Power at the maximum power point (PMPP)2440 Wpk
Table 2. Data model used in the program for data acquisition.
Eos ArrayGoodwe Inverter + LG BatteryFuji VSDEM21072 Network Analyzer
GIVoltages: VPV, VBat, Vgrid, VloadInput powerVgrid
TambCurrents: IPV, IBat, Igrid, IloadDC bus voltageIgrid
TcellPowers: PPV, PBat, Pgrid, PloadOutput voltagePgrid, Qgrid, Sgrid,
VPVEnergies: EPV, EBat, Egrid, EloadOutput currentEgrid
IPVFrequencies: fgrid, floadOutput frequencyfgrid
PPVBattery: SOC, SOH, BMS pack temperature, etc.Heatsink temperatureTHD
EPVStatus: meter, BMSWater level sensorsPF
Power module statusError message, BMS error code
Publisher’s Note: MDPI stays neutral with regard to jurisdictional claims in published maps and institutional affiliations.

