Article

Analysis of Window-Opening Patterns and Air Conditioning Usage of Urban Residences in Tropical Southeast Asia

by
Hiroshi Mori
1,2,
Tetsu Kubota
1,*,
I Gusti Ngurah Antaryama
3 and
Sri Nastiti N. Ekasiwi
3
1
Graduate School of Advanced Science and Engineering, Hiroshima University, Higashi-Hiroshima, Hiroshima 739-8529, Japan
2
YKK AP R&D Center, PT. YKK AP Indonesia, Tangerang 15810, Indonesia
3
Faculty of Civil, Planning and Geo Engineering, Institut Teknologi Sepuluh Nopember, Surabaya 60111, Indonesia
*
Author to whom correspondence should be addressed.
Sustainability 2020, 12(24), 10650; https://doi.org/10.3390/su122410650
Submission received: 8 November 2020 / Revised: 12 December 2020 / Accepted: 16 December 2020 / Published: 20 December 2020
(This article belongs to the Section Sustainable Urban and Rural Development)

Abstract

:
Window-opening is one of the most important adaptive behaviours affecting indoor thermal comfort as well as household energy consumption in the tropics. In this study, large-scale surveys were conducted in major cities of Malaysia and Indonesia to extract various typical daily patterns of window-opening, air conditioning (AC) usage and fan usage among occupants in the tropics through a data mining approach based on a cluster analysis. Furthermore, influential factors for window-opening patterns, focusing especially on contextual factors and household attributes, were determined through a logistic regression analysis. As a result, several typical daily patterns of window-opening, AC usage and fan usage were extracted, respectively, even under the same hot-humid climate. It was found that household size, age of respondent, household income and concerns about insects were the most influential factors for daily window-opening patterns. The results of this study will fill the existing knowledge gap in driving factors of occupant behaviour in the tropics in which few studies have been conducted.

1. Introduction

In most cities of Southeast Asia, the daily maximum air temperature often exceeds 30 °C with high humidity of approximately 70–90%. This condition may force occupants to use air conditioners (ACs) to meet their thermal comfort [1]. Nevertheless, there are concerns that the spread of ACs among urban residential buildings in Southeast Asia will contribute to further increase in primary energy consumption and, therefore, drastically increase CO2 emissions in the near future [2]. In general, higher-income households use AC more, and it is expected that the AC ownership rate will increase as household income increases [3]. In fact, the number of ACs in Southeast Asia is expected to skyrocket from approximately 40 million units in 2018 to 350 million in 2040, mostly for the use in residential buildings. The electricity consumption for cooling in the region is projected to increase from approximately 80 TWh in 2018 to around 330 TWh by 2040 [2].
Given the need to achieve sustainable societies, passive design, in particular the application of natural ventilation, is considered a feasible strategy for reducing energy consumption for cooling without sacrificing thermal comfort in the hot and humid climates [4,5]. Several studies were conducted to determine passive cooling techniques in naturally ventilated buildings to achieve indoor thermal comfort and to reduce the energy consumption for cooling in the hot and humid climates of Asia [6,7,8,9]. As indoor air temperature can be close to the skin surface temperature with high humidity in the tropics, cooling with comfort ventilation is crucial [8,10]. Meanwhile, structural cooling with night ventilation was also found to be effective even in the hot-humid climates in a high thermal mass building [3,11]. Hence, it can be seen that window-opening is one of the most important adaptive behaviours affecting indoor thermal comfort as well as household energy consumption in the tropics.
It is important to determine possible factors affecting window-opening behaviour of occupants so that building designers can encourage them to adopt natural ventilation whenever appropriate. Many researchers argued that window-opening behaviour is influenced by various factors that interact in complex ways. For example, Fabi et al. [12], Schweiker et al. [13] and Borgeson and Brager [14] concluded that the possible factors were classified into physical, contextual, psychological, physiological and social factors. Among physical factors, outdoor and indoor air temperature were generally the most influential factors in window-opening behaviour [15,16,17,18]. Additionally, the indoor CO2 concentration level was identified as a key factor [19,20]. For example, the study by Rijal et al. [21] in the UK reported that the highest usage of window-opening was found in summer and lowest was in winter. It was concluded that people are likely to open their windows when indoor and outdoor temperatures are high and tend to close them when the temperatures are low [22]. Similar results were obtained by Rijal et al. [23,24] in Gifu and Kanto region of Japan. It was found that the probability of window-opening in naturally ventilated buildings gradually increases toward summer and decreases after summer along with changes in average temperatures. As a result of logistic regression analysis, they showed that window-opening behaviour is predictable based on indoor or outdoor air temperature.
Despite the fact that most previous studies only consider environmental variables as key influential factors of occupants’ interaction with windows [15,16,25,26,27,28,29], different parameters can influence the control on natural ventilation [30,31]. Cali et al. [32] monitored changes in indoor thermal environment and window-opening behaviour for four years in apartments in Southern Germany. It was found by a logistic regression analysis that the factors affecting window-opening were the time of day and the CO2 concentration, while those affecting window-closing were the average daily outdoor temperature and the time of day. Stazi et al. [33] reviewed previous relevant studies on the factors of adaptive behaviour. They also pointed out that window-opening behaviour in residential buildings is influenced by indoor and outdoor air temperatures and CO2 concentration and is mainly related to occupants’ indoor activities. Andersen [34] found that some people in Danish dwellings opened their windows for ten minutes every day regardless of air temperatures. This implied that the factors affecting window-opening can be not only thermal conditions but also other factors such as cultural factors or daily routine. Brager et al. [35] found that there are differences in occupants’ thermal comfort responses between air-conditioned and naturally ventilated buildings. This is partially because the difference in the building context greatly affects occupants’ expectations regarding the thermal environment.
According to Schweiker et al. [36], the contextual factors included the time of day or arriving/leaving times [19,37,38,39,40,41,42], the previous control state [37], geographical location [43,44], ventilation type [37,44,45], building system and envelope characteristics [42,46], facade orientation [47], dress code [48], season or cloud cover, socioeconomics [49], and occupancy levels [50]. Particularly, in residential buildings, window interaction habits were found to be not time dependent, but rather activity dependent [17]. Nevertheless, Jeong et al. [31] confirmed that occupants’ window opening was time-dependent due to activities such as sleeping, cooking and cleaning. Furthermore, Shi et al. [51] argued that with regard to residential buildings, different residences would have different window opening behaviours under the same environmental condition. This residence-level variety may be attributed to the household features. However, few studies analysed the effect of household features on the residential window-opening behaviour.
Seasonal changes in thermal conditions are almost absent in most parts of the tropical Southeast Asia, except for the precipitation and wind conditions—for example, the monthly average air temperature varies within 2 °C in Jakarta. Hence, window-opening behaviour of an occupant in this region can be uniform throughout the year. In other words, non-temperature variables, including (1) contextual factors such as time of day and building type, (2) household features as well as personal and social factors, and (3) phycological factors such as personal preference, can be more influential for the window-opening in the tropics, although outdoor and indoor air temperatures were found to be the most influential factors in other regions. Therefore, this study examines occupants’ daily average patterns of window-opening and AC usage without considering the seasonal changes in outdoor weather conditions in the tropical Southeast Asia. The present study assumes that there are more influential factors beyond the outdoor and indoor air temperatures in the case of tropics and aims to determine the contextual factors and household attributes influencing the typical daily patterns of window-opening.
Generally, there are three major approaches of collecting occupant-related data for the purpose of researching building occupants, namely in situ, laboratory and survey [52]. The in situ studies, which is the most commonly used approach in the previous studies, involve monitoring occupants in their natural environments (e.g., workplace, home, school, etc.) and typically have a long data collection duration (weeks or years) [52]. However, in contrast to the other approaches, in situ methods often limit the sample size to the number of willing participants in the subject building [52]. O’Brien et al. [53] indicated that the sample size is of great importance to monitor occupant diversity in a population. They suggested that hundreds of occupant samples were more appropriate rather than 10 to 15 samples, which were used in most existing studies [54]. The present study, therefore, adopted large-scale surveys to analyse the above-mentioned personal/household differences in typical window-opening patterns through a data mining approach with a large number of samples (N = 1570). Data mining techniques are powerful methods to extract hidden patterns and knowledge from large datasets and have also been applied to develop occupants’ behaviour models [55,56,57]. Among various data mining techniques, decision tree, Bayesian network, cluster analysis and association rule mining methods are commonly used for prediction and recognition of occupant behaviour patterns. For example, D’Oca and Hong [40] used a cluster analysis to obtain window opening and closing behaviour patterns based on distinct datasets, and association rule mining was then conducted to discover the frequent patterns that concurrently existed.
Several review papers on occupant behaviour have been published in recent years [12,33,36,54,58,59,60,61]. Some of the studies pointed out that there are few studies in the tropical regions. For example, Schweiker et al. [36] reported that all field studies took place in regions where there are discernible heating and cooling seasons, and no studies were undertaken in the tropics or sub-tropics. Du et al. [61] also concluded that previous studies have covered most climate zones, but limited data are available for the hot-humid zone. Meanwhile, Kubota et al. [3] reported through a survey in Malaysia that nearly 80% of the respondents normally opened their windows during daytime from 10 am to 6 pm, but only 10% practiced it at night. According to the results of a study by Arethusa et al. [62] in Indonesian apartments, similarly, 80–90% of the respondents opened their windows during daytime (6:00 to 19:00) and 30–50% closed at night (19:00–6:00). Regarding AC usage, Uno et al. [63] reported that most respondents in Indonesia answered that they use ACs from 21:00 to 6:00 during night-time and from 13:00 to 15:00 during daytime. The results of surveys carried out by Ekasiwi et al. [64] in Indonesia and Malaysia showed that some occupants still open their windows even during the use of ACs. However, the said studies conducted in the tropics only revealed the current average conditions of occupant behaviour and failed to analyse the personal/household differences among samples.
In this study, the large-scale surveys were conducted in major cities of Malaysia and Indonesia during 2004–2016. The main objective of this study is to extract various typical daily patterns of window-opening, AC usage and fan usage among occupants in the tropics through a data mining approach based on a cluster analysis. These behavioural patterns are expected to be diversified to some extent, as they are influenced by other factors than seasonal changes in air temperatures. Furthermore, influential factors for window-opening patterns, focusing especially on contextual factors such as the time of day as well as household attributes, are determined through a logistic regression analysis. The results of this study will fill the existing knowledge gap in driving factors of occupant behaviour in the tropics, and thus provide useful insights for designers to promote natural ventilation for residential buildings. Furthermore, the resultant patterns can be used for thermal simulations and energy simulations as input data representing the occupants’ behaviour.
In this paper, Section 2 describes the methodology in detail. Section 3, Results and Discussion, first shows the results of typical daily patterns of window-opening and those of AC usage and fan usage. Second, we discuss the associations among the above-mentioned adaptive behaviours, followed by the reasons for not opening windows.
2. Methods

2.1. Survey Cities

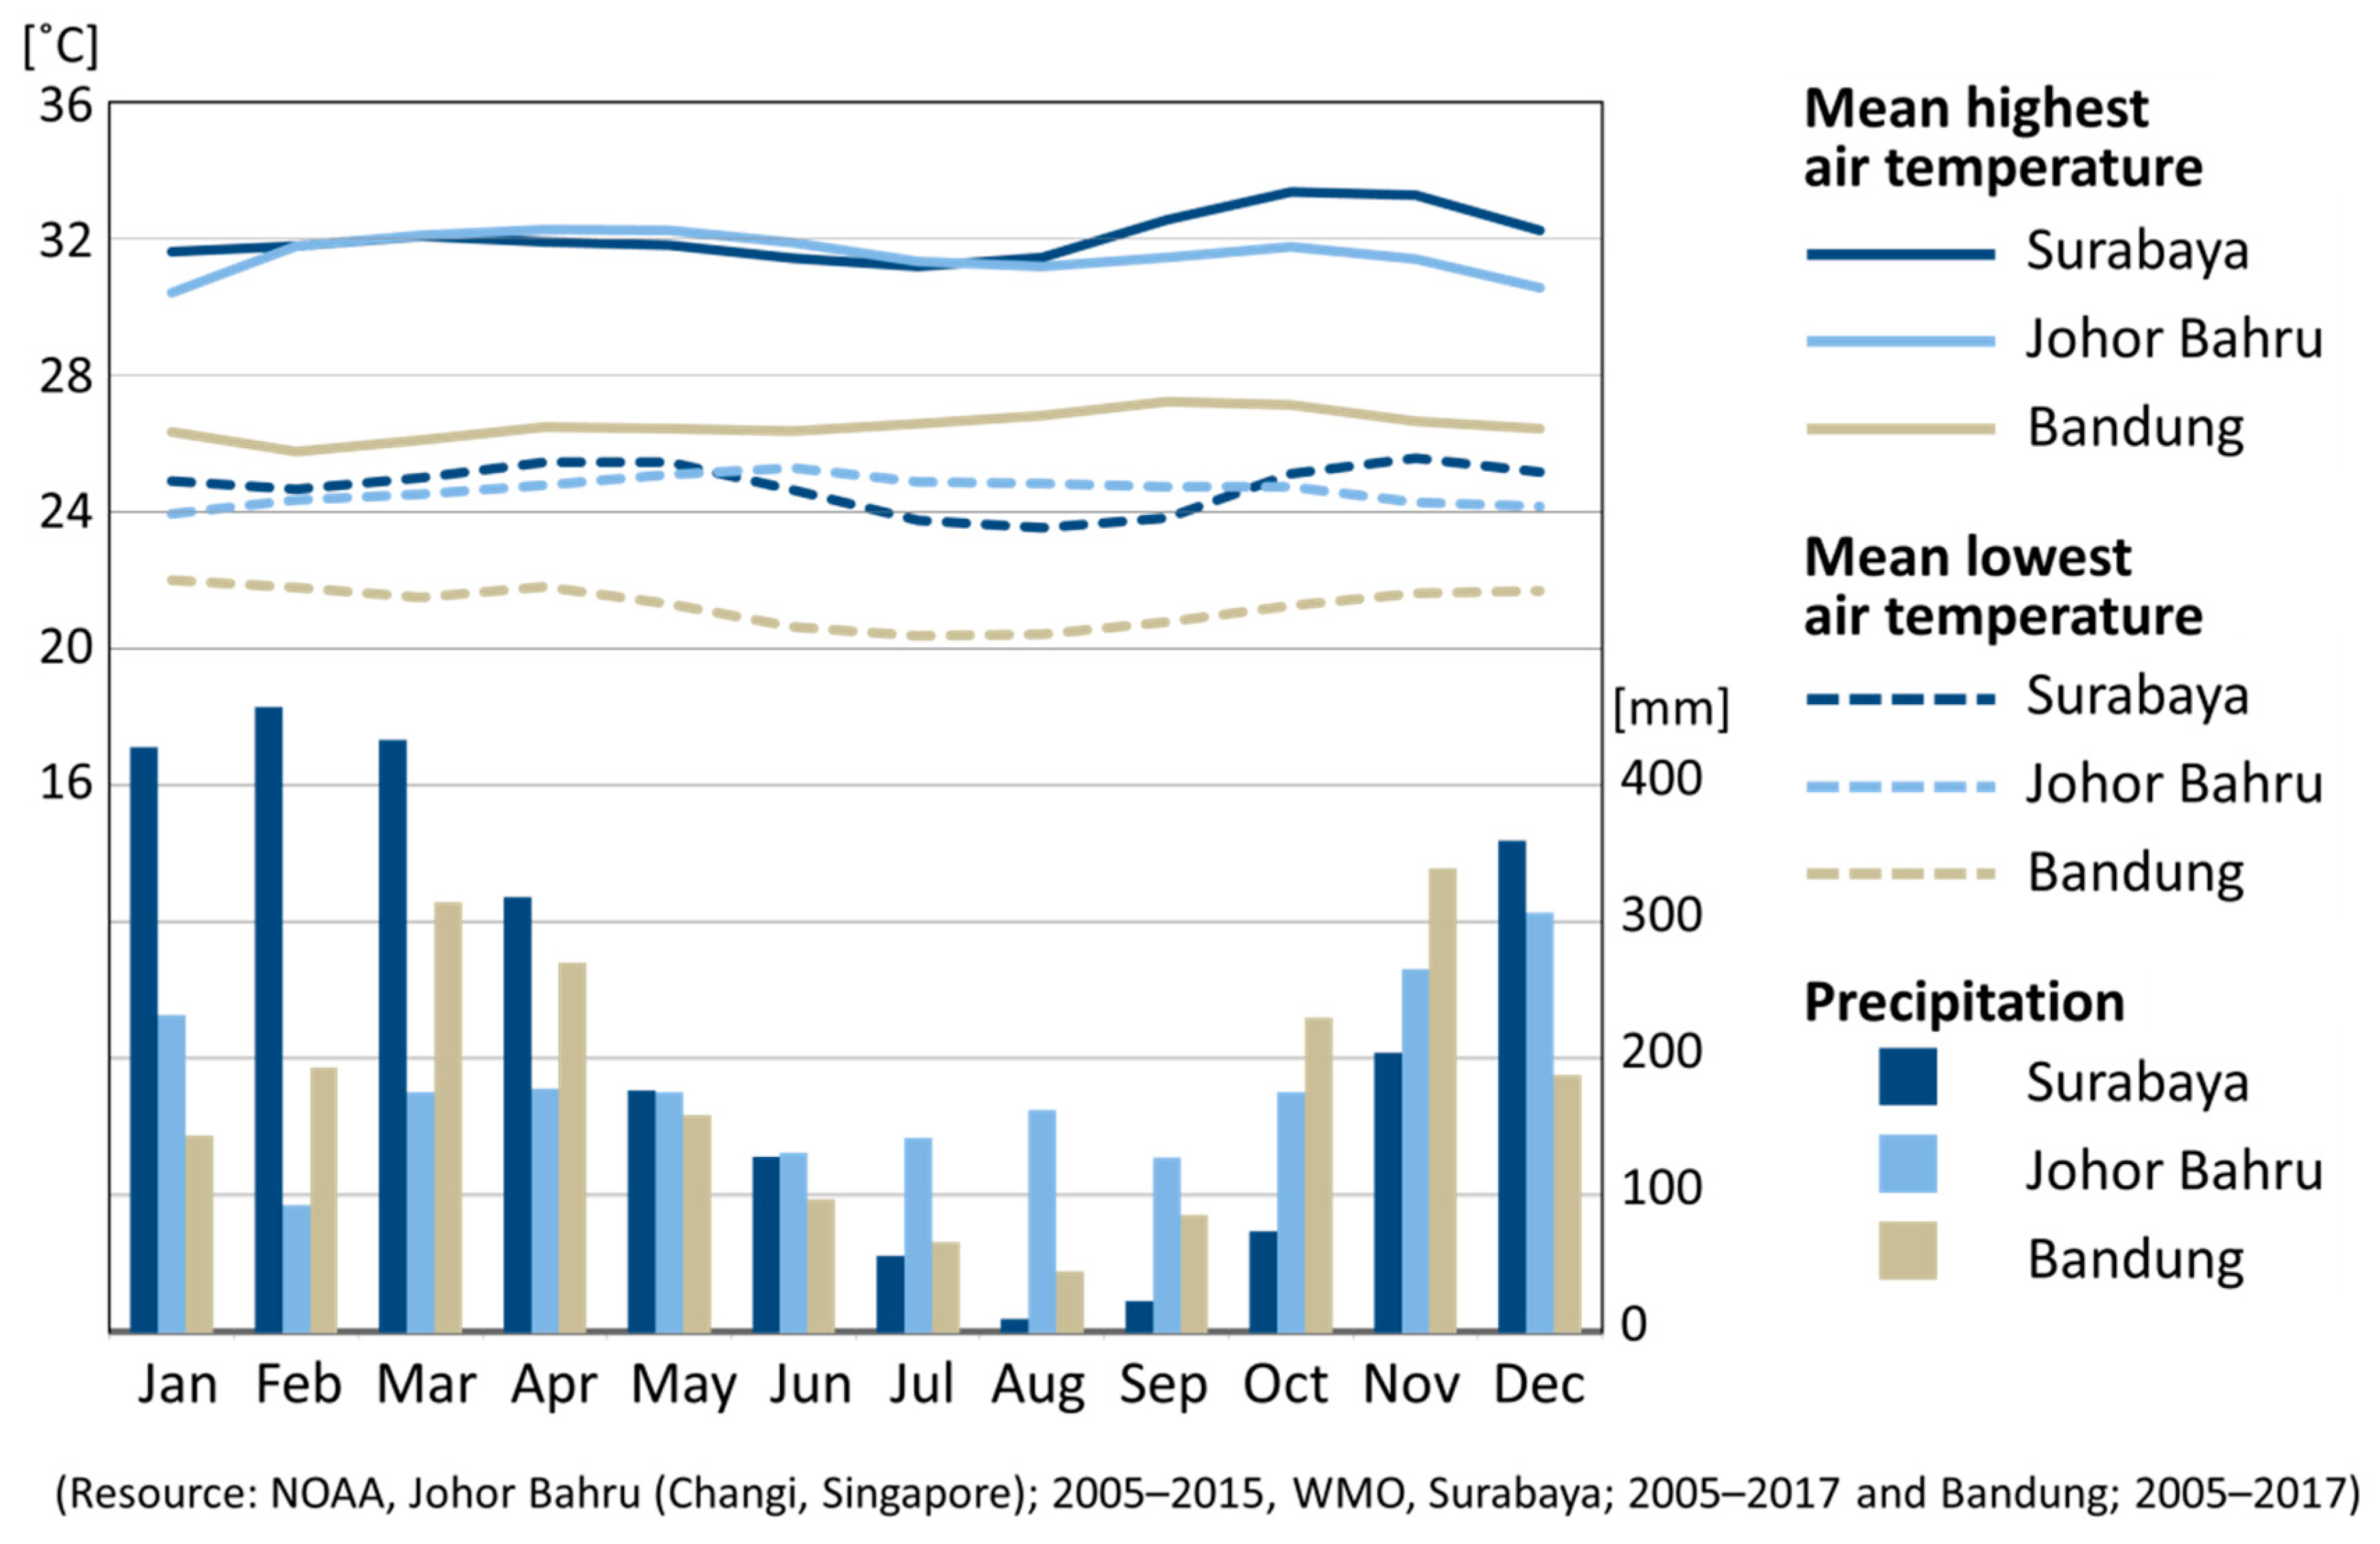
The surveys were conducted in Johor Bahru, Malaysia and in Surabaya and Bandung, Indonesia during 2004–2016. Johor Bahru is the second largest city in Malaysia (N1.27, E103.45) with an average annual temperature of 27.9 °C and the annual rainfall of 2174 mm. Surabaya is the second largest city in Indonesia (S7.16, E112.44) with an average annual temperature of 27.7 °C and the annual precipitation of 2677 mm. Bandung is the third largest city in Indonesia (S6.54, E107.36) located at a relatively high altitude (768 m above sea level) and, therefore, experiences a relatively cool climate unlike the other two cities. The average annual temperature is 23.7 °C, and the annual precipitation is 2141 mm. Bandung is treated in this study in comparison to the other two hot and humid cities. Figure 1 shows the monthly mean highest and lowest air temperatures and precipitation in these three cities during the survey periods. Although there are rainy season and dry season, the temperature is high throughout the year and its annual range is very small, ranging from 26.8–28.7 °C, 27.0–28.8°C and 23.3–24.1°C, respectively. On the other hand, the diurnal ranges between the highest and lowest temperature are generally much larger than the annual ranges, which is a characteristic of the climate in Southeast Asia. In this study, occupants’ average behaviour patterns during the dry season were investigated.

2.2. Surveyed Houses

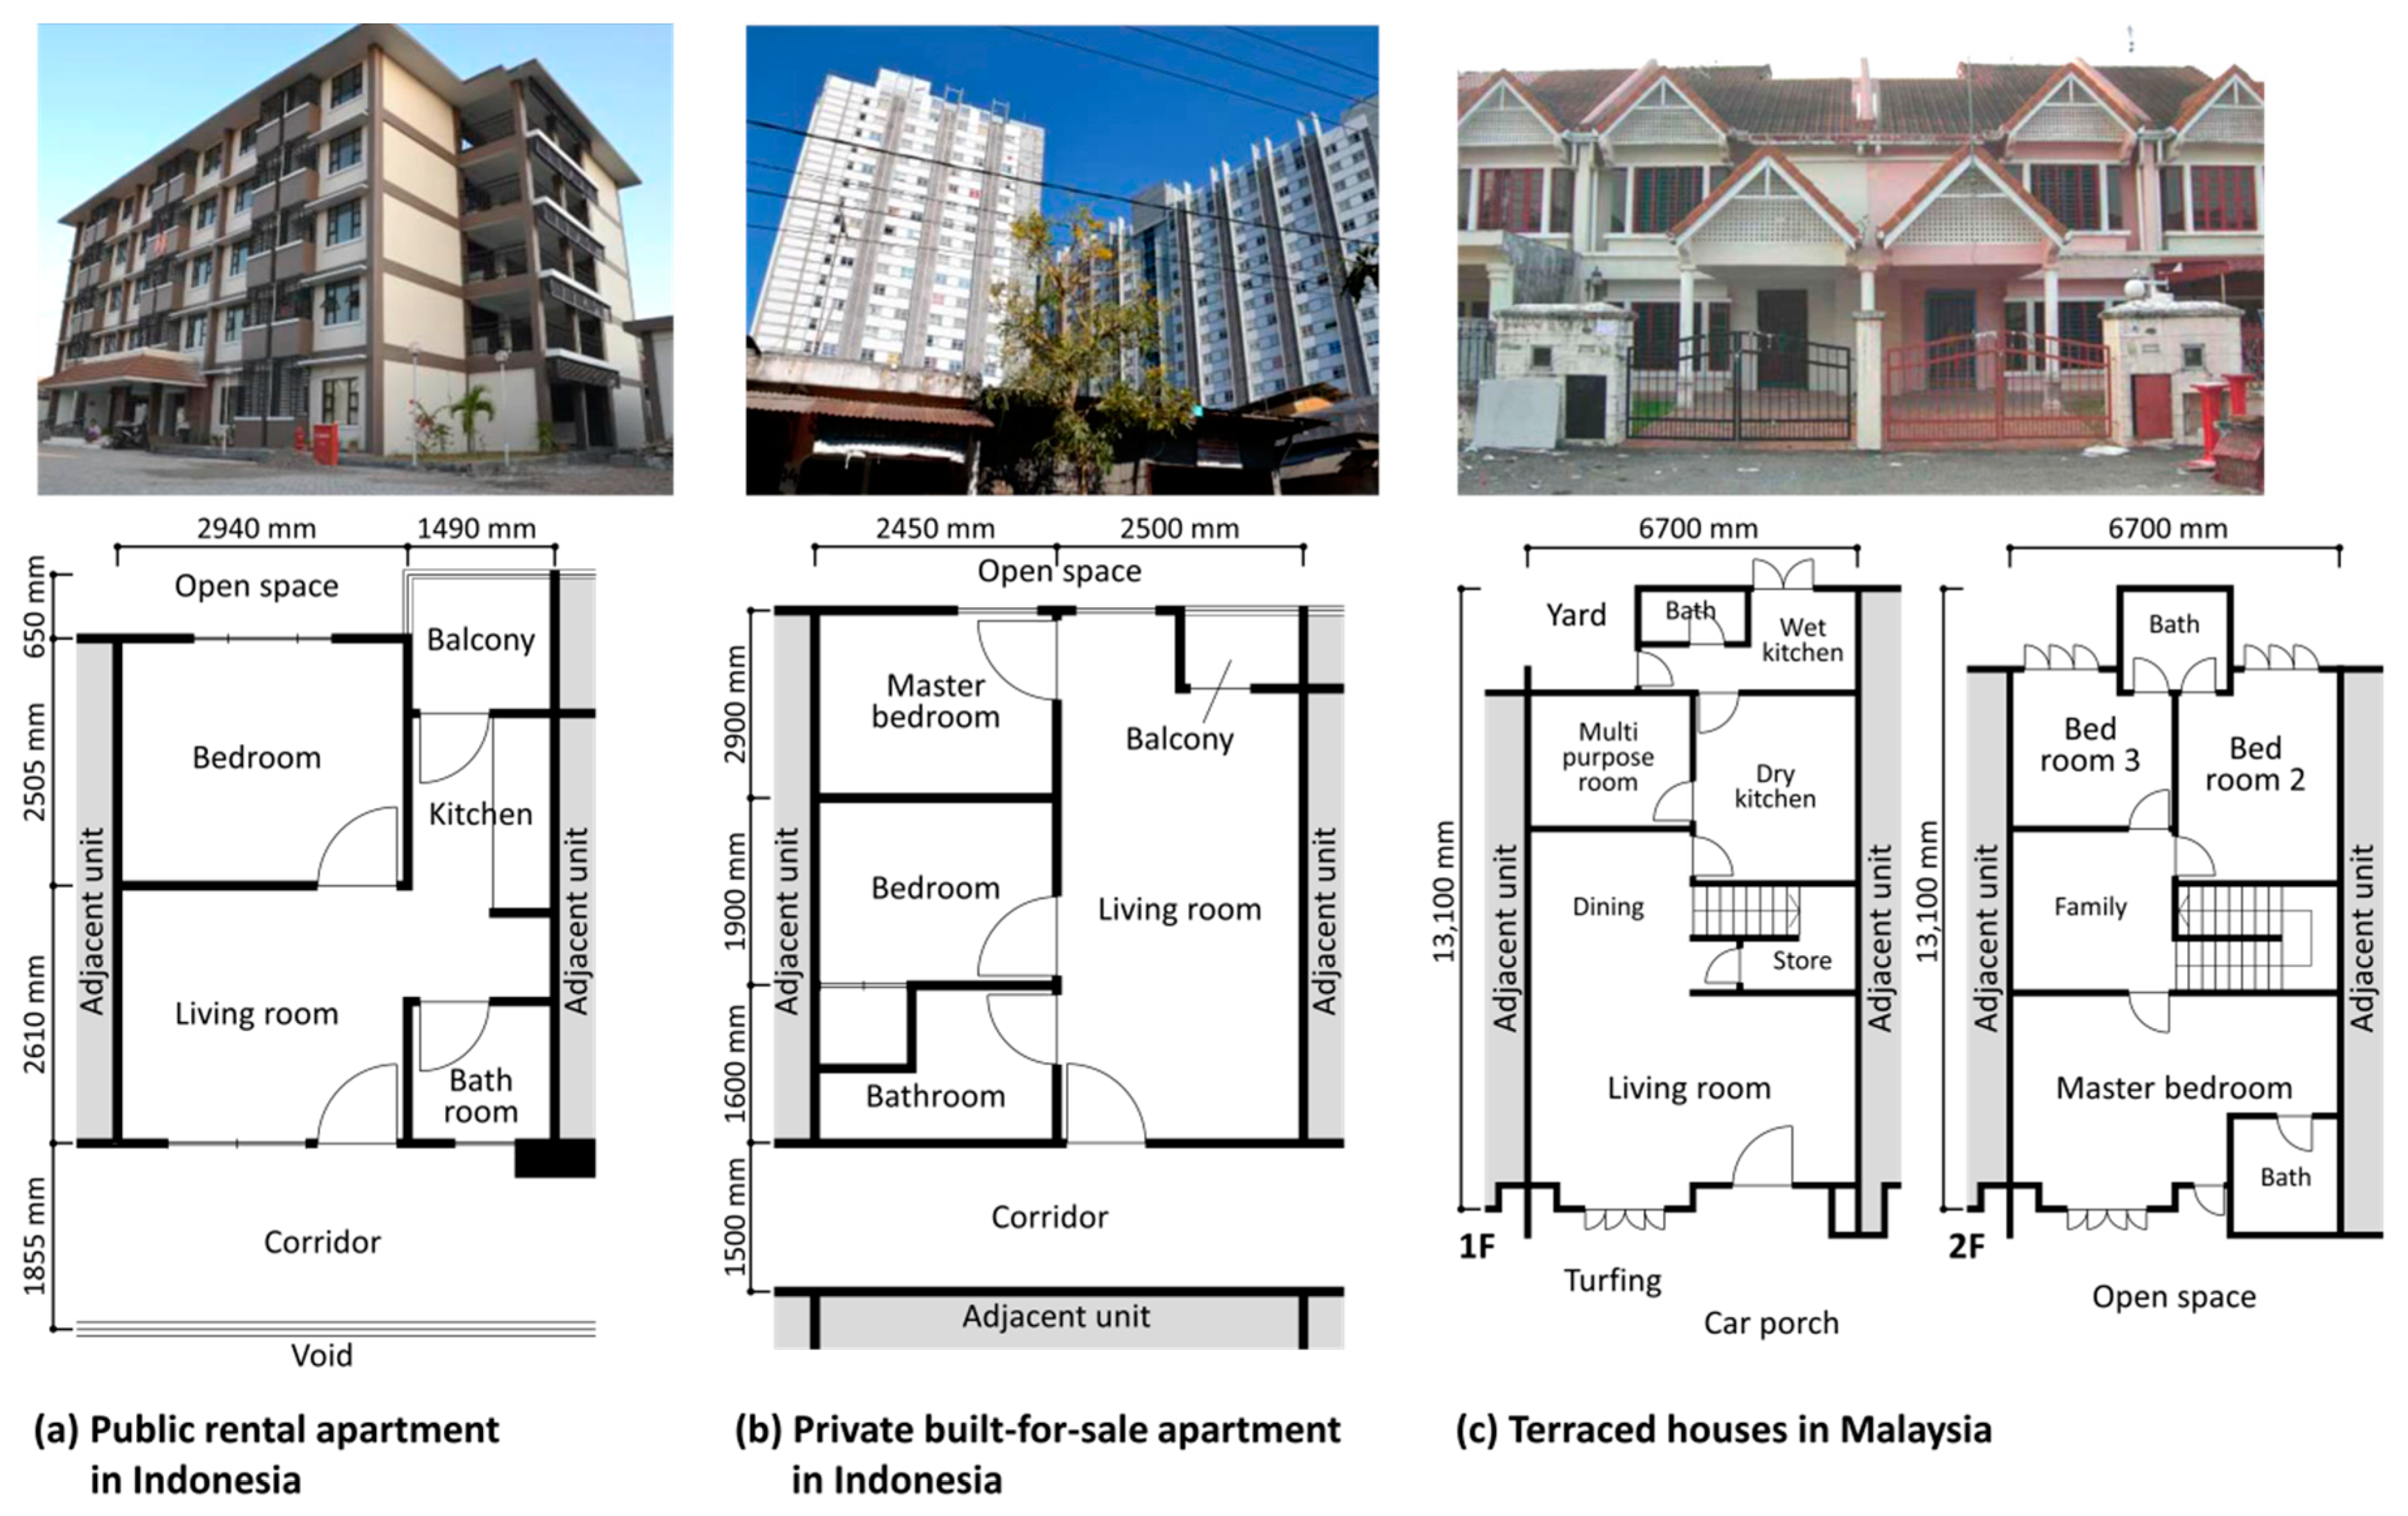
Apartments in Indonesia, apartments and terraced houses in Malaysia were targeted in this study, representing general housing for low- to middle-income earners (Figure 2). The Indonesian government has been implementing a subsidy policy for apartment construction to promote housing supply to low- and middle-income earners. This includes public rental apartments (Figure 2a) and private built-for-sale apartments (Figure 2b). Generally, the former is a 3 to 5 story naturally ventilated building. There are a few room types, including a single room type and a two-bedroom type with a small balcony outside, depending on the construction year. Both types have windows and doors on two sides (i.e., outdoor side and corridor side). In addition, there are ventilation windows with a permanent slit between two fixed glass panes above the openings on both sides. The latter is generally a high-rise building (Figure 2b). There are several floor plans (e.g., single-room type, two-bedroom type, etc.), and these units only have a door on the corridor side without windows and, therefore, single-sided ventilation. Units are placed on both sides of the corridor. Instead, there is a small balcony on the outdoor side, normally used just for placing outdoor units of ACs. There is no ventilation window above the openings on both sides. This means that the private built-for-sale apartments are highly closed and are designed on the premise of using ACs in their units. In Malaysia, the terraced house is the most common type of urban houses (Figure 2c). Each house has windows on the front and back sides of the first and second floors so that the occupants can open the windows on the two sides (i.e., cross ventilation). In this study, a total of 1570 households were randomly chosen from respective cities, comprising 612 from apartments in Surabaya, 299 from apartments in Bandung, 303 from apartments and 356 from terraced houses in Johor Bahru. The surveys were conducted from September to October in 2013 and 2016 in Surabaya, in September 2014 in Bandung, and from September to October 2004 and from April to June 2006 in Johor Bahru, respectively.

2.3. Survey Methods

The surveys were conducted through face-to-face interviews using a questionnaire sheet. All surveys were conducted during the dry season, and the respondents were asked about their usual adaptive behaviour of each household of a day. The open/close state of windows and doors in the living room and bedrooms, and the usage of ACs and fans in every hour (24 h) were interviewed in particular. In the usage analysis, weekdays and weekends were distinguished, and a weighted average was adopted with one week as 5 weekdays and 2 weekends. Only openable windows and doors were considered. If a window or door was opened in one or more places in the living room or bedrooms during that time, it was regarded as open. In addition, household attributes (e.g., household size, household income, etc.) and reasons for not opening windows (multiple-choice question) were included, among others. Furthermore, in the survey of Surabaya in 2016, reasons for opening and closing windows were asked additionally by distinguishing the rooms and the time of day to supplement more specific reasons.

2.4. Sample Profiles

The sample profile of each survey is shown in Table 1. As mentioned above, Bandung is located at a high altitude, so the average annual temperature is approximately 4 °C lower than the other cities. The average household size was 3.4 to 3.6 in Surabaya, 1.9 in Bandung, 4.6 to 5.4 in Johor Bahru, and 3.8 in total. Most respondents were 30 to 40 s, except for the Bandung (30 s and below). The income level here is a ratio obtained by logarithmic conversion after correcting the price difference due to the currency and the survey year by dividing the value in each currency by the exchange rate against the US dollar in 2011. The average household income level was the lowest in Surabaya as 7.6 to 7.9, and the highest in Johor Bahru as 8.8 to 9.4. The AC ownership rate was 0–10.7% in Surabaya, 34.8% in Bandung, and 35.3–65.0% in Johor Bahru. There is a positive correlation between the AC ownership rate and the household income level.

2.5. Analysis Methods

A data mining approach was adopted to extract the hidden typical daily patterns of occupant behaviour under the similar climatic conditions. The total samples of 1570 households were first classified by its climate, before analysing their adaptive behaviour in detail. As background climate is significantly different, we classified the survey cities into the following two attribute groups: the hot and humid cities (Surabaya and Johor Bahru) and the relatively cool city (Bandung). Second, a hierarchical cluster analysis (Euclid square distance, Ward method) was conducted based on the hourly usage data (binary data) for 24 h to further classify the samples into several sub-groups with similar usage patterns. In the cluster analysis, principal component values for 24 h were adopted instead of the raw binary data. For each of the two attribute groups, the number of clusters effective to represent typical behaviour patterns was selected from the results of the cluster analyses. Similarly, cluster analyses were conducted for usage patterns of ACs and fans, respectively. Third, especially for the window-opening patterns, multilevel logistic regression analyses were conducted to identify the influential factors affecting the classified window-opening patterns. We also analysed the associations between the classified window-opening patterns and the household and building attributes obtained through the surveys. We estimated crude odds ratios (ORs) and then adjusted for socio-economic factors, including household size, age of the respondent and household income.

3. Results and Discussion

3.1. Daily Patterns of Window-Opening

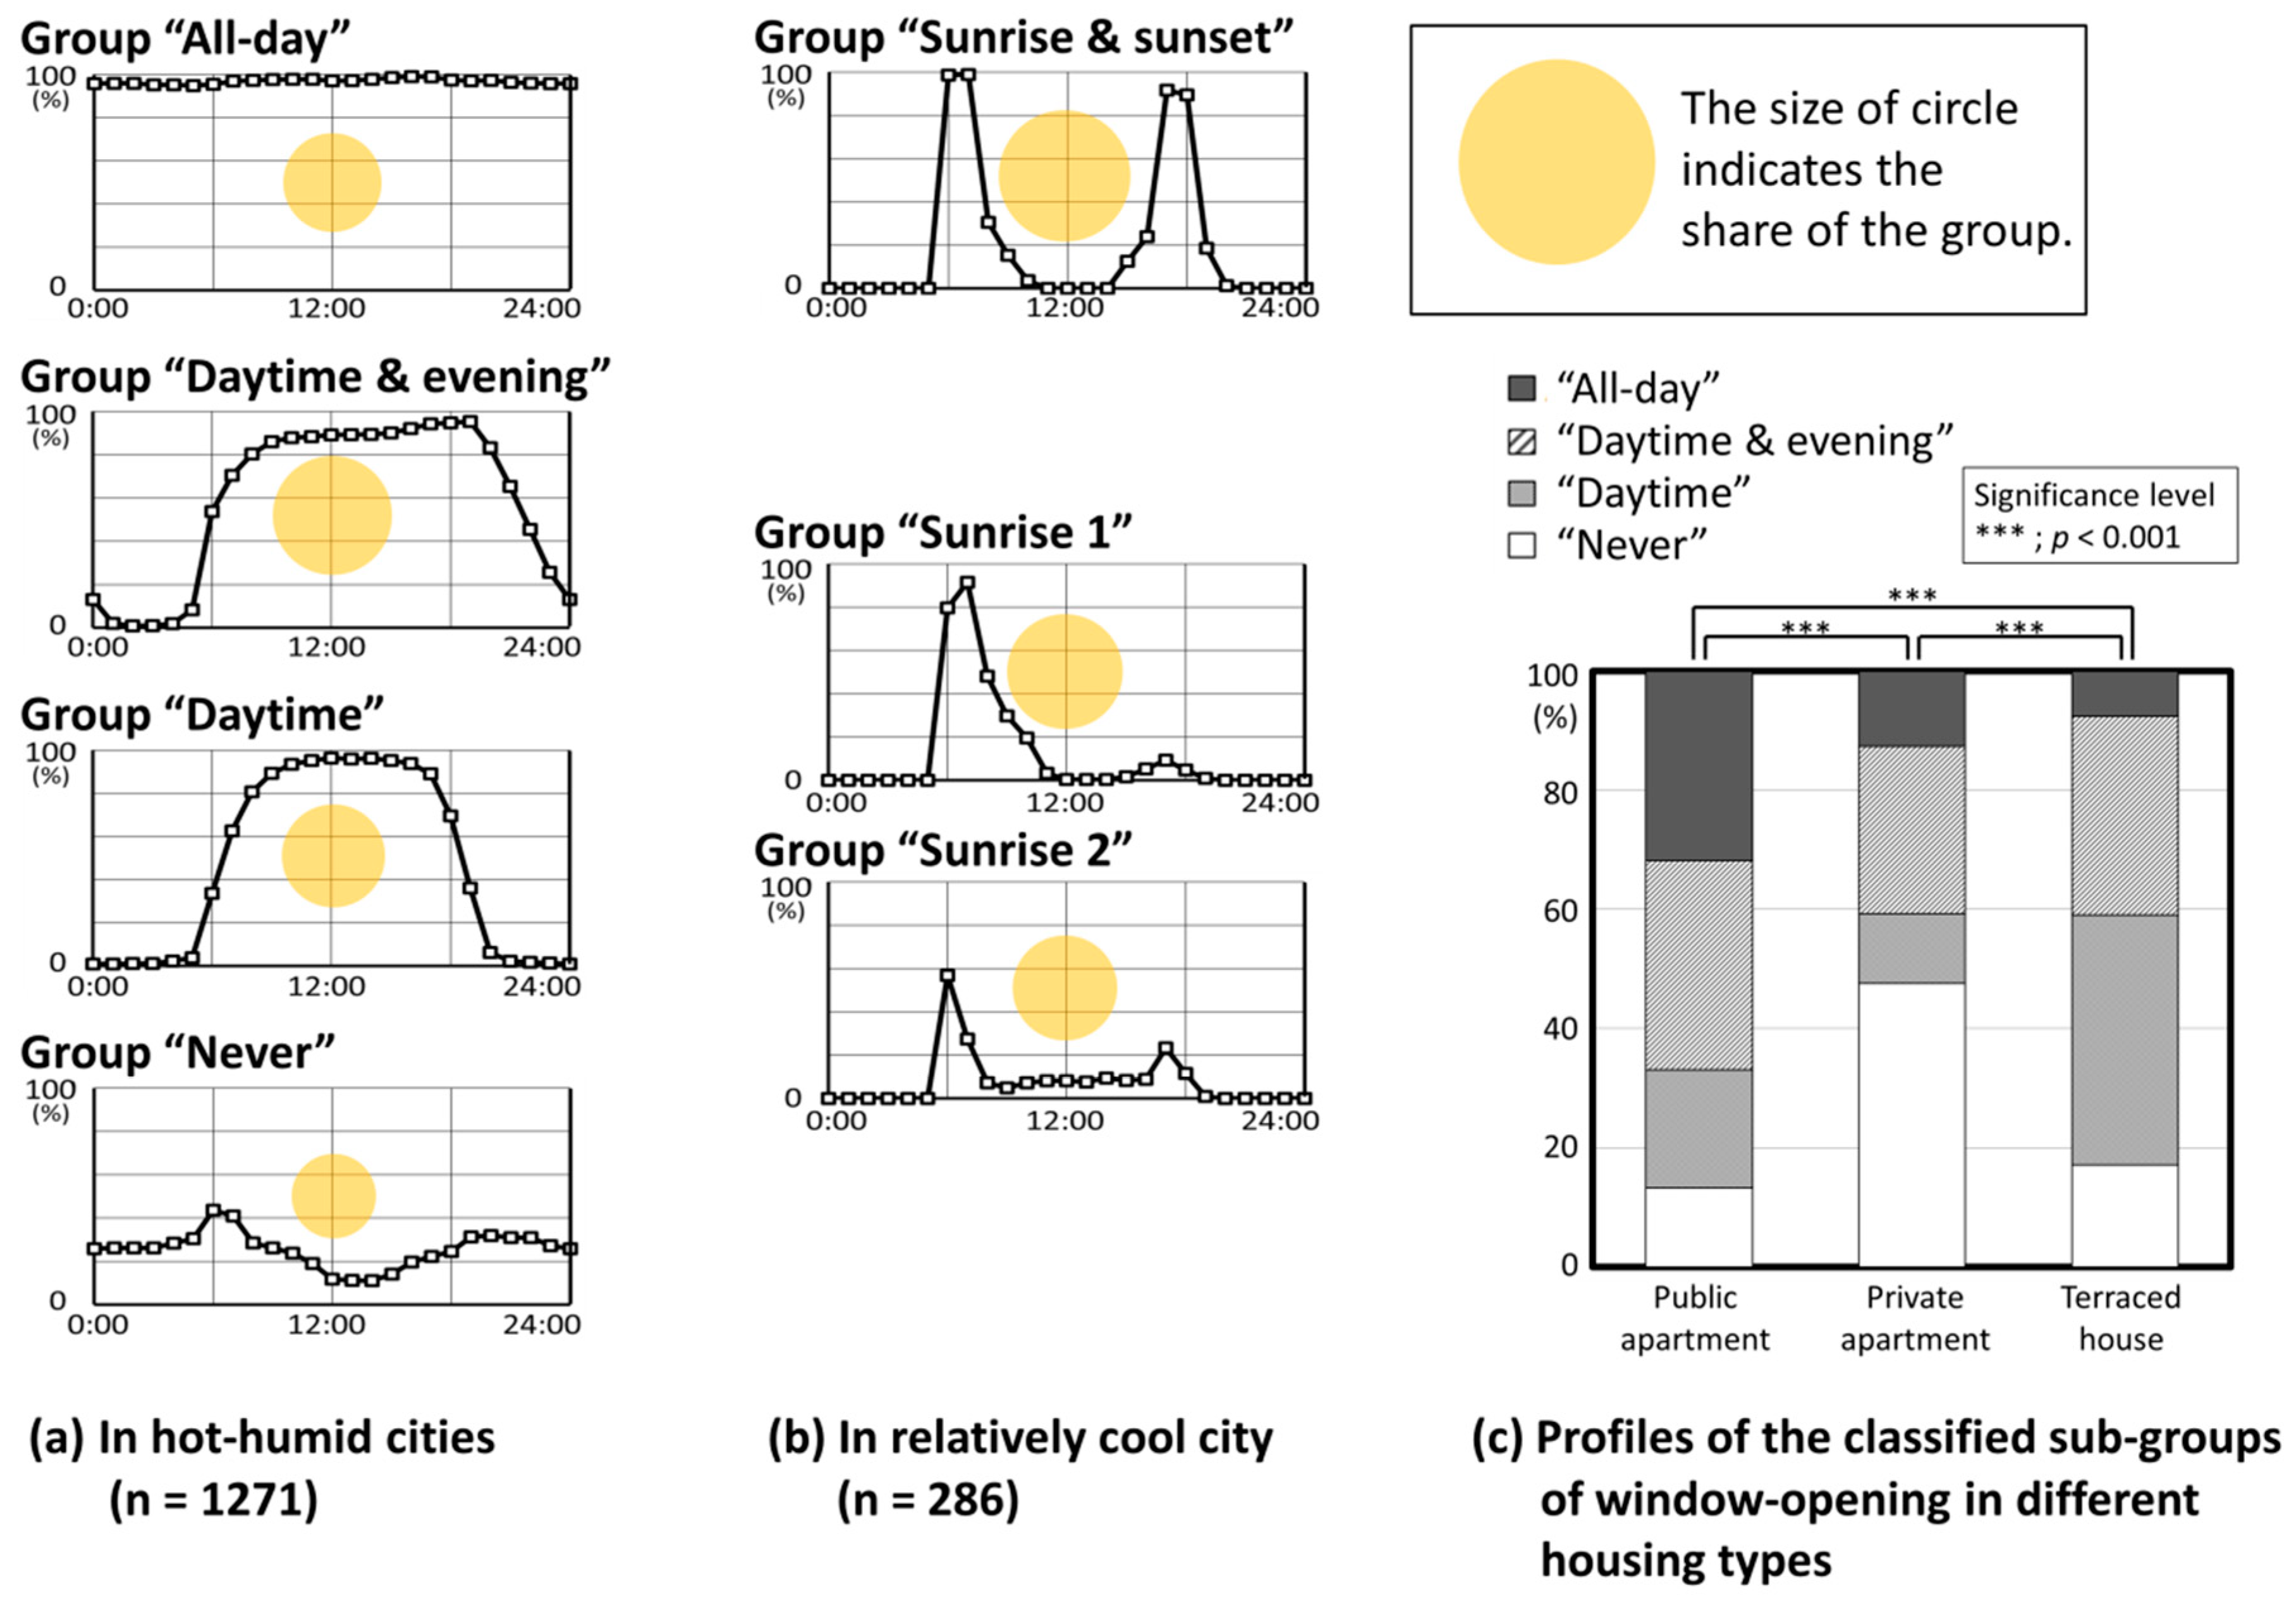
Table 2 and Figure 3 show the results of classification for typical daily patterns of occupants’ window-opening behaviour. As mentioned before, all samples are divided into two attribute groups based on its climate, and then each group is subdivided into several sub-groups through the hierarchical cluster analysis. The line graphs in Figure 3 depict the hourly usage patterns of window-opening of a day. As shown in Figure 3a, for example, the households in the hot and humid cities are classified into four sub-groups, i.e., “all-day”, “daytime and evening”, “daytime” and “never”. In other words, the window-opening behaviour of this attribute can be typified by four patterns. The most frequent group is “daytime and evening” (34.1%), where the respondents open their windows in the morning between 5:00 and 8:00 and close them before sleep time between 20:00 and 1:00 of the next day (they keep windows open during daytime and evening), resulting in the opening period of 14.5 h per day on average. The second most frequent group is “daytime” (25.3%), where they open their windows at the same time as the previous group but close between 18:00 and 20:00 (11.5 h per day). The third group “all-day” (23.5%) keep their windows open for almost 24 h (23.2 h per day). The group “never” (17.2%) tends not to open windows at any time of the day (6.1%). Looking over the overall patterns in the hot and humid cities, three groups except “never” (82.8%) keep their windows open during daytime, while three groups except “all-day” (76.5%) keep their windows closed during night-time. As in previous reports [3,62], it was confirmed that daytime ventilation is the mainstream in the tropics. Nevertheless, unlike the previous studies, the present result shows that at least four typical window-opening patterns can be extracted even under the similar hot-humid climate as shown in Figure 3a. The overall average window-opening duration per day is 15.4 h, which is much longer than that during the non-heating period of Korea (1.8 h/day) [31].
The window-opening patterns in the relatively cool city are significantly different from those in the hot and humid cities (Figure 3b). As shown, the households do not open windows during daytime and night-time. Most of the households open their windows only in the short period once or twice a day, i.e., “sunrise and sunset” and “sunrise”. The groups “sunrise 1” and “sunrise 2”, where the households open their windows shortly between 5:00 to 7:00, account for 31.8% and 26.6%, whereas the group “sunrise and sunset”, where they open windows twice a day approximately between 5:00 to 7:00 and 16:00 to 18:00, accounts for 41.6%. The average window-opening duration per day is 3.0 h, which is significantly shorter than those in the hot and humid cities.
Figure 3c indicates profiles of the classified sub-groups of window-opening in different housing types, i.e., public apartment, private apartment and terraced house (see Figure 2). As shown, there are significant differences among the three housing types. This indicates that the housing type is one of the influential factors for window-opening behaviour.
Table 3 shows the results of logistic regression analyses (odds ratio and 95% confidence interval) for each of the surveyed variables, with the four classified window-opening patterns as dependent variables. Based on the result, it is possible to identify unique household and building features that influence each of the window-opening patterns.
As shown, first, household size (i.e., number of household members) is found to be a key factor. A larger household is more likely to have the “daytime” or “daytime and evening” window-opening pattern, whereas a smaller household tends to have the “never” or “all-day” pattern. This is probably because daily window-opening patterns of the larger households are influenced by the daily activities, such as cooking, cleaning and sleeping, more than the smaller households as discussed in [17,31]. Age of the respondent somewhat distinguishes “daytime” from “daytime and evening”. This is understandable because younger households probably spend a longer time at night and increase the duration of opening windows. Age was reported as a significant factor in some previous studies as well [13]. Interestingly, household income strongly influences the window-opening patterns. As shown, the odds ratio is the highest for “never” (OR: 1.70), followed by “daytime” (1.21), “daytime and evening” (0.94) and “all-day” (0.61). The above order of window-opening patterns corresponds to that of the duration of opening windows per day (see Table 2). The higher the household income is, the shorter the duration of opening windows would be. This is probably indirectly related to the AC ownership. As shown in Table 3, the households that “never” open windows tend to use more AC, while “all-day” households use less. Moreover, the households with “daytime” opening tend to own more ACs than “all-day” households. Accordingly, the electricity bill is also associated with the window-opening behaviour in the sub-group “all-day”. These “all-day” households tend to use less electricity. The association between window-opening and AC usage was discussed in several previous studies such as [65], but there is no study that revealed the household income to be an influential factor for window-opening behaviour.
Second, as discussed before, housing type is found to be an influential factor. Here, the following nominal variable was used for the housing type: 1 = public apartment; 2 = private apartment; 3 = terraced house. The result shows that the terraced house has a higher possibility of “daytime” opening pattern, whereas the households in public apartments tend to have the “all-day” pattern. A previous study [66] also reported that housing type was an influential factor. However, this study further reveals that the difference between the terraced houses and public apartments can be seen in window-opening behaviour during the night-time. This difference is partially attributed to the floor level. As shown in Table 3, the households living on the lower floors tend to have the “daytime” opening patterns, while those who living on the higher floors tend to open even during the night and become the “all-day” pattern.
Third, as discussed before, AC owners are more likely to have the “daytime” pattern and less likely to have the “all-day” pattern. This means that the AC ownership is a factor that prevents occupants from opening windows in the evening and night. This is mainly because the AC owners in the tropics mainly use AC in the evening and night in their bedrooms while closing windows, as reported in [3,6,63,64]. Therefore, AC ownership in the living room has no association with the window-opening behaviour in this study. Meanwhile, fan owners are more likely to have the “daytime” opening pattern. Furthermore, duration of stay at home is also found to be an influential factor. The households with a shorter duration of stay tend to have the “never” opening pattern, whereas those with a longer duration are likely to have the “all-day” pattern.
Fourth, it should be noted that there is no significant association between thermal sensations and the window-opening behaviour. This result supports the original assumption that daily window-opening patterns in the tropics would be determined mainly by the non-temperature factors. Meanwhile, a significant association is found in the wind flow sensation. The households perceiving higher winds tend to open windows more and become the “all-day” opening pattern.
Finally, regarding the reasons for not opening windows, the households with concerns about insects are more likely to have the “daytime” pattern, and less likely to have the “never” and “all-day” patterns. This means that invasion of insects is a concern not during daytime but during the evening and night. Further, the households concerned about security are more likely to have the “all-day” pattern. This is a contradictive result but can be related to the floor level—the households with the “all day” pattern tend to live on the higher floors as described before. Furthermore, rain, privacy and AC are found to be associated with some of the window-opening patterns.
Overall, household size, age of respondent, household income and concerns about insects are found to influence three or more window-opening patterns and thus considered as the most influential factors in this study. In addition, housing type, floor level and AC ownership, respectively, have some influences on the “daytime” and “all-day” opening patterns. These factors can be also important determinants for window-opening in the evening and night indirectly. In particular, insects, security and rain would be key factors required to encourage occupants to open windows at night.

3.2. Daily Patterns of AC Usage

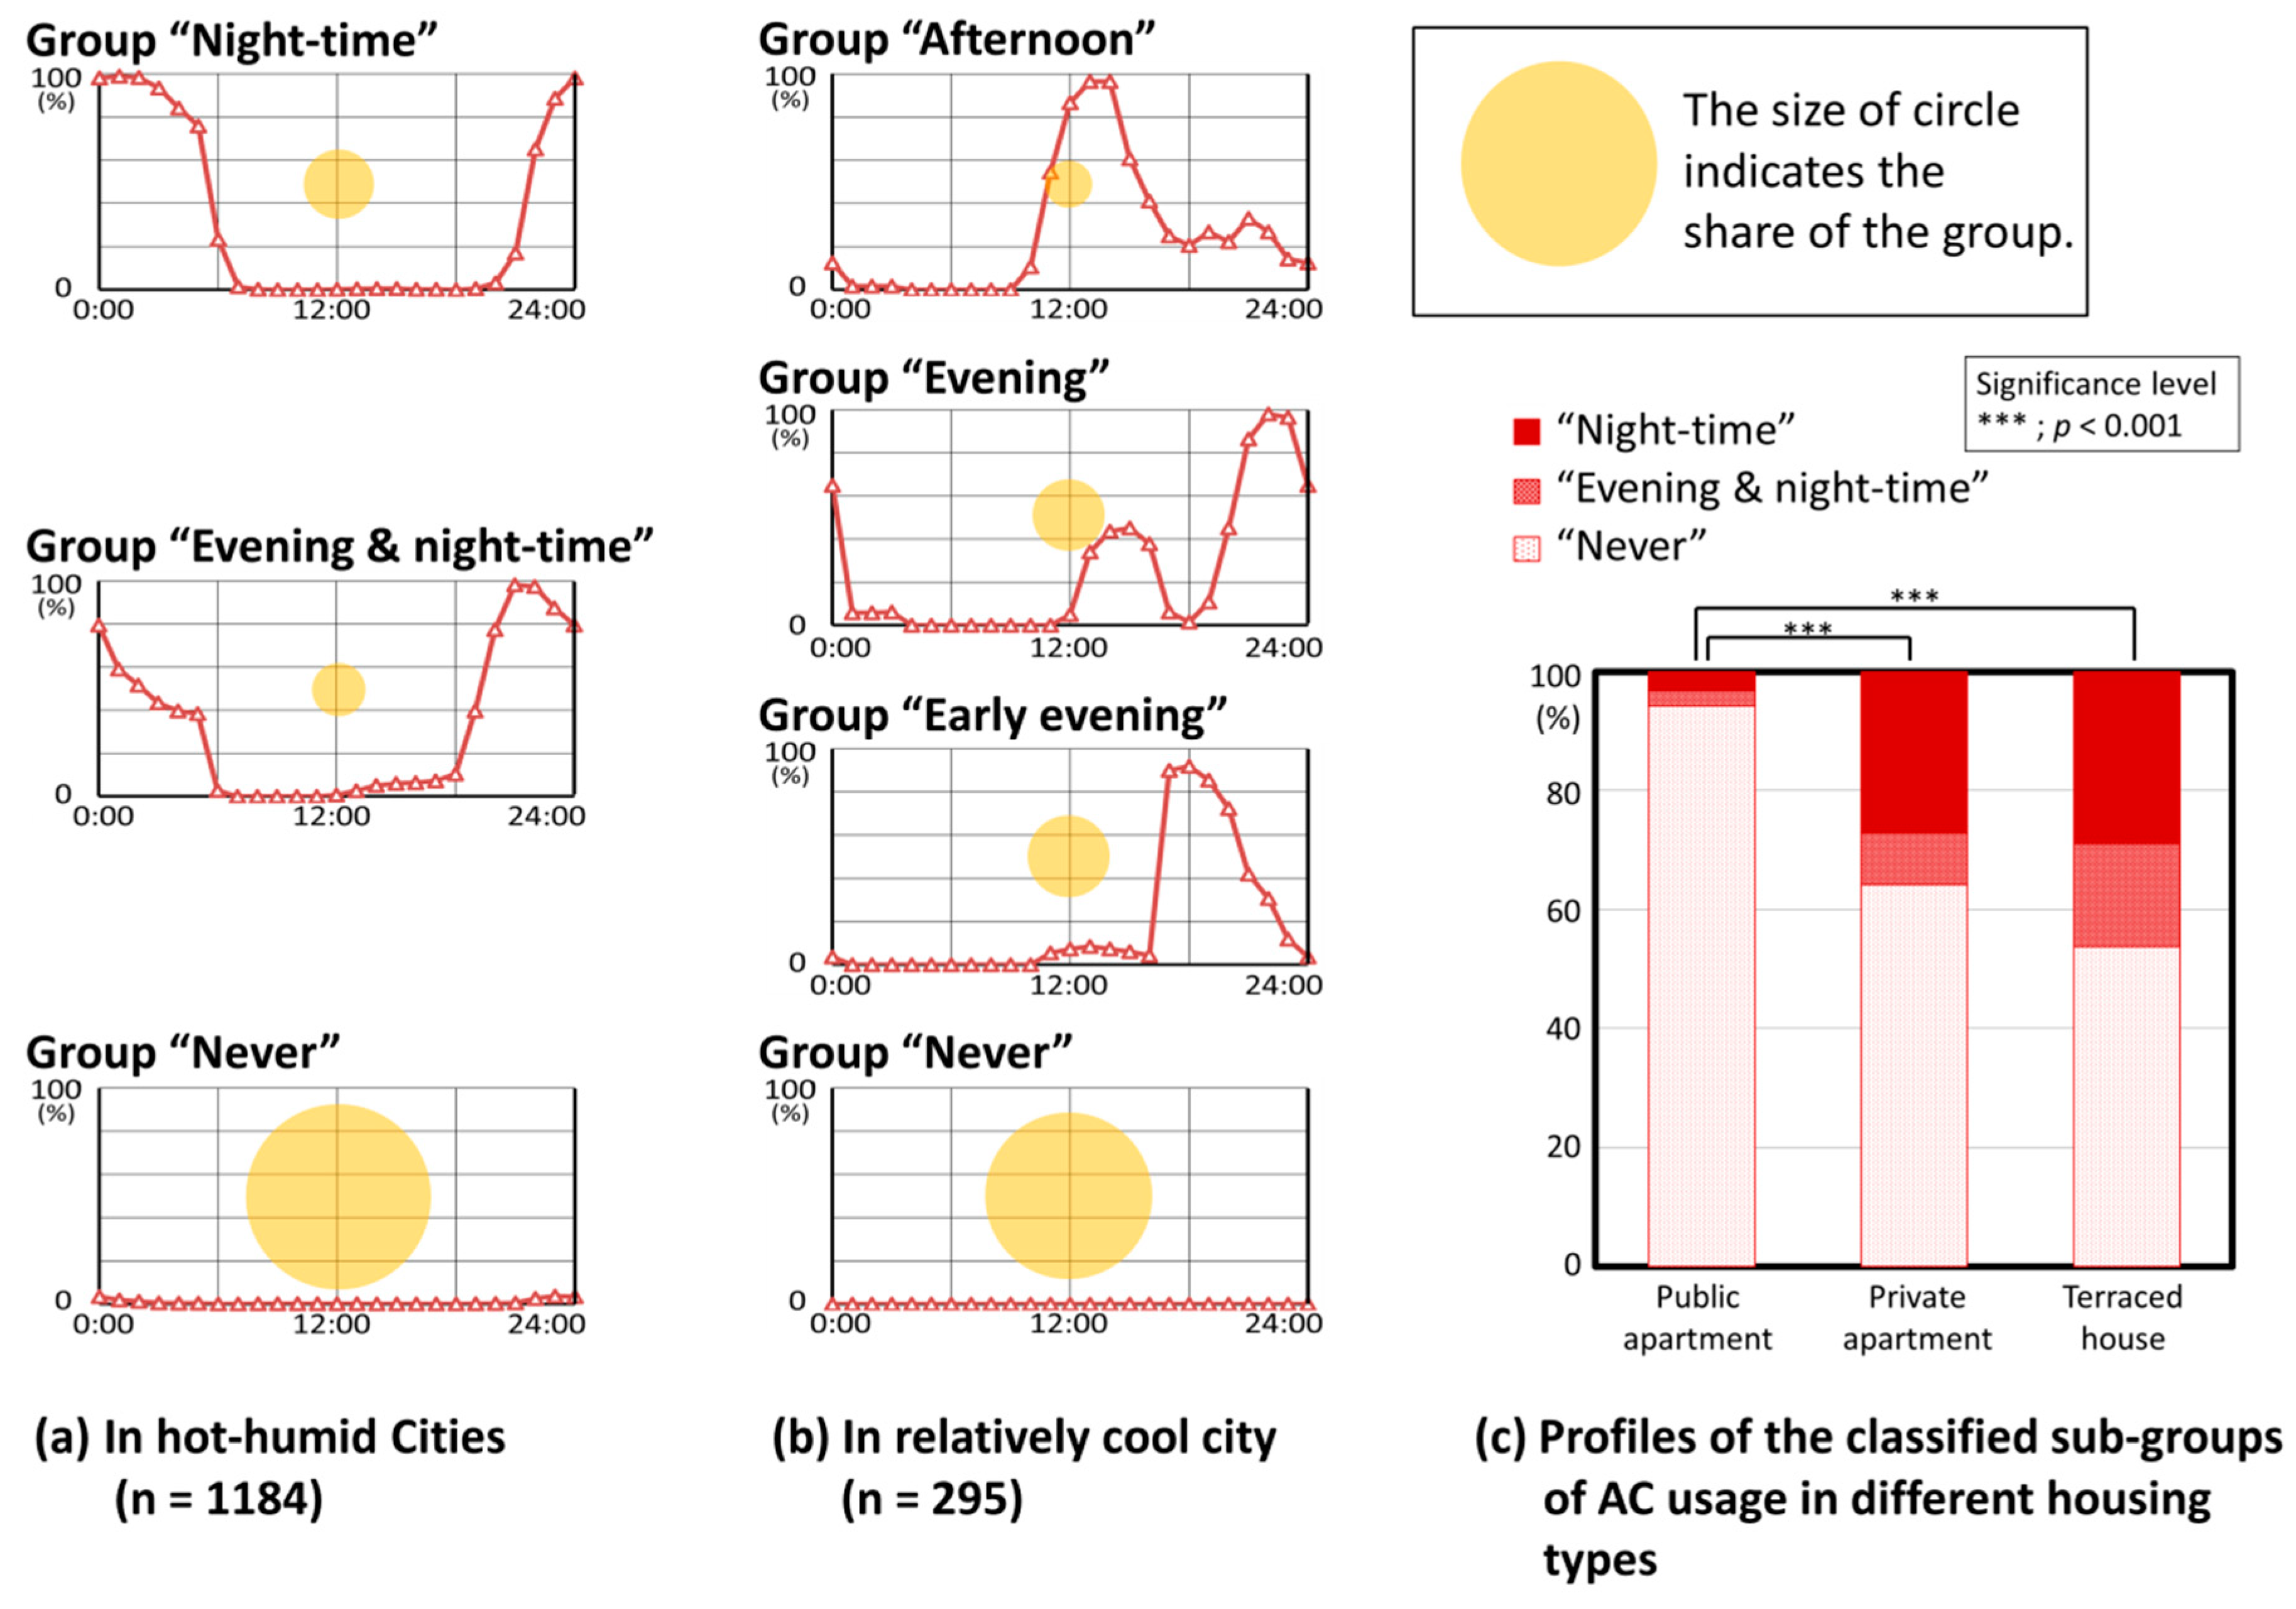
Table 4 and Figure 4 depict the results of classification for typical daily patterns of occupants’ AC usage. Both of households with and without owning AC(s) are included in this analysis. As shown, the usage patterns are significantly different between hot and humid cities and relatively cool city. In the hot and humid cities, the usage patterns are classified into “night-time” (11.5%), where AC is used during sleep time, and “evening and night-time” (6.8%), where AC is used not only during sleep time, but also in the evening (Figure 4a). The average daily usage duration is 7.5 h per day for each group. As discussed in the previous section, it was confirmed that ACs are mainly used in the evening and night. Almost all (94.2%) of the group “never” are made up of AC non-owners. Most AC users are households in the private apartments and the terraced houses (Figure 4c).
By contrast, in the relatively cool city, it can be seen that ACs are used only in the afternoon and evening. The group “early evening”, where the AC usage rate peaks by approximately 60% from 16:00 to 20:00, accounts for 15.9%, followed by “evening”, where the usage peaks from 20:00 to 24:00, accounting for 12.5% (Figure 4b). The third group “afternoon”, where the usage peaks from 11:00 to 15:00, accounts for 5.4%. The average daily usage duration is 4.7 h in “early evening”, 5.9 h in “evening” and 6.3 h in “afternoon”, respectively. The group “never” consists of AC non-owners only. All of the above-mentioned sub-groups similarly do not use ACs during night-time, highlighting a clear difference in AC usage patterns between the hot and humid cities and the relatively cool city.

3.3. Daily Patterns of Fan Usage

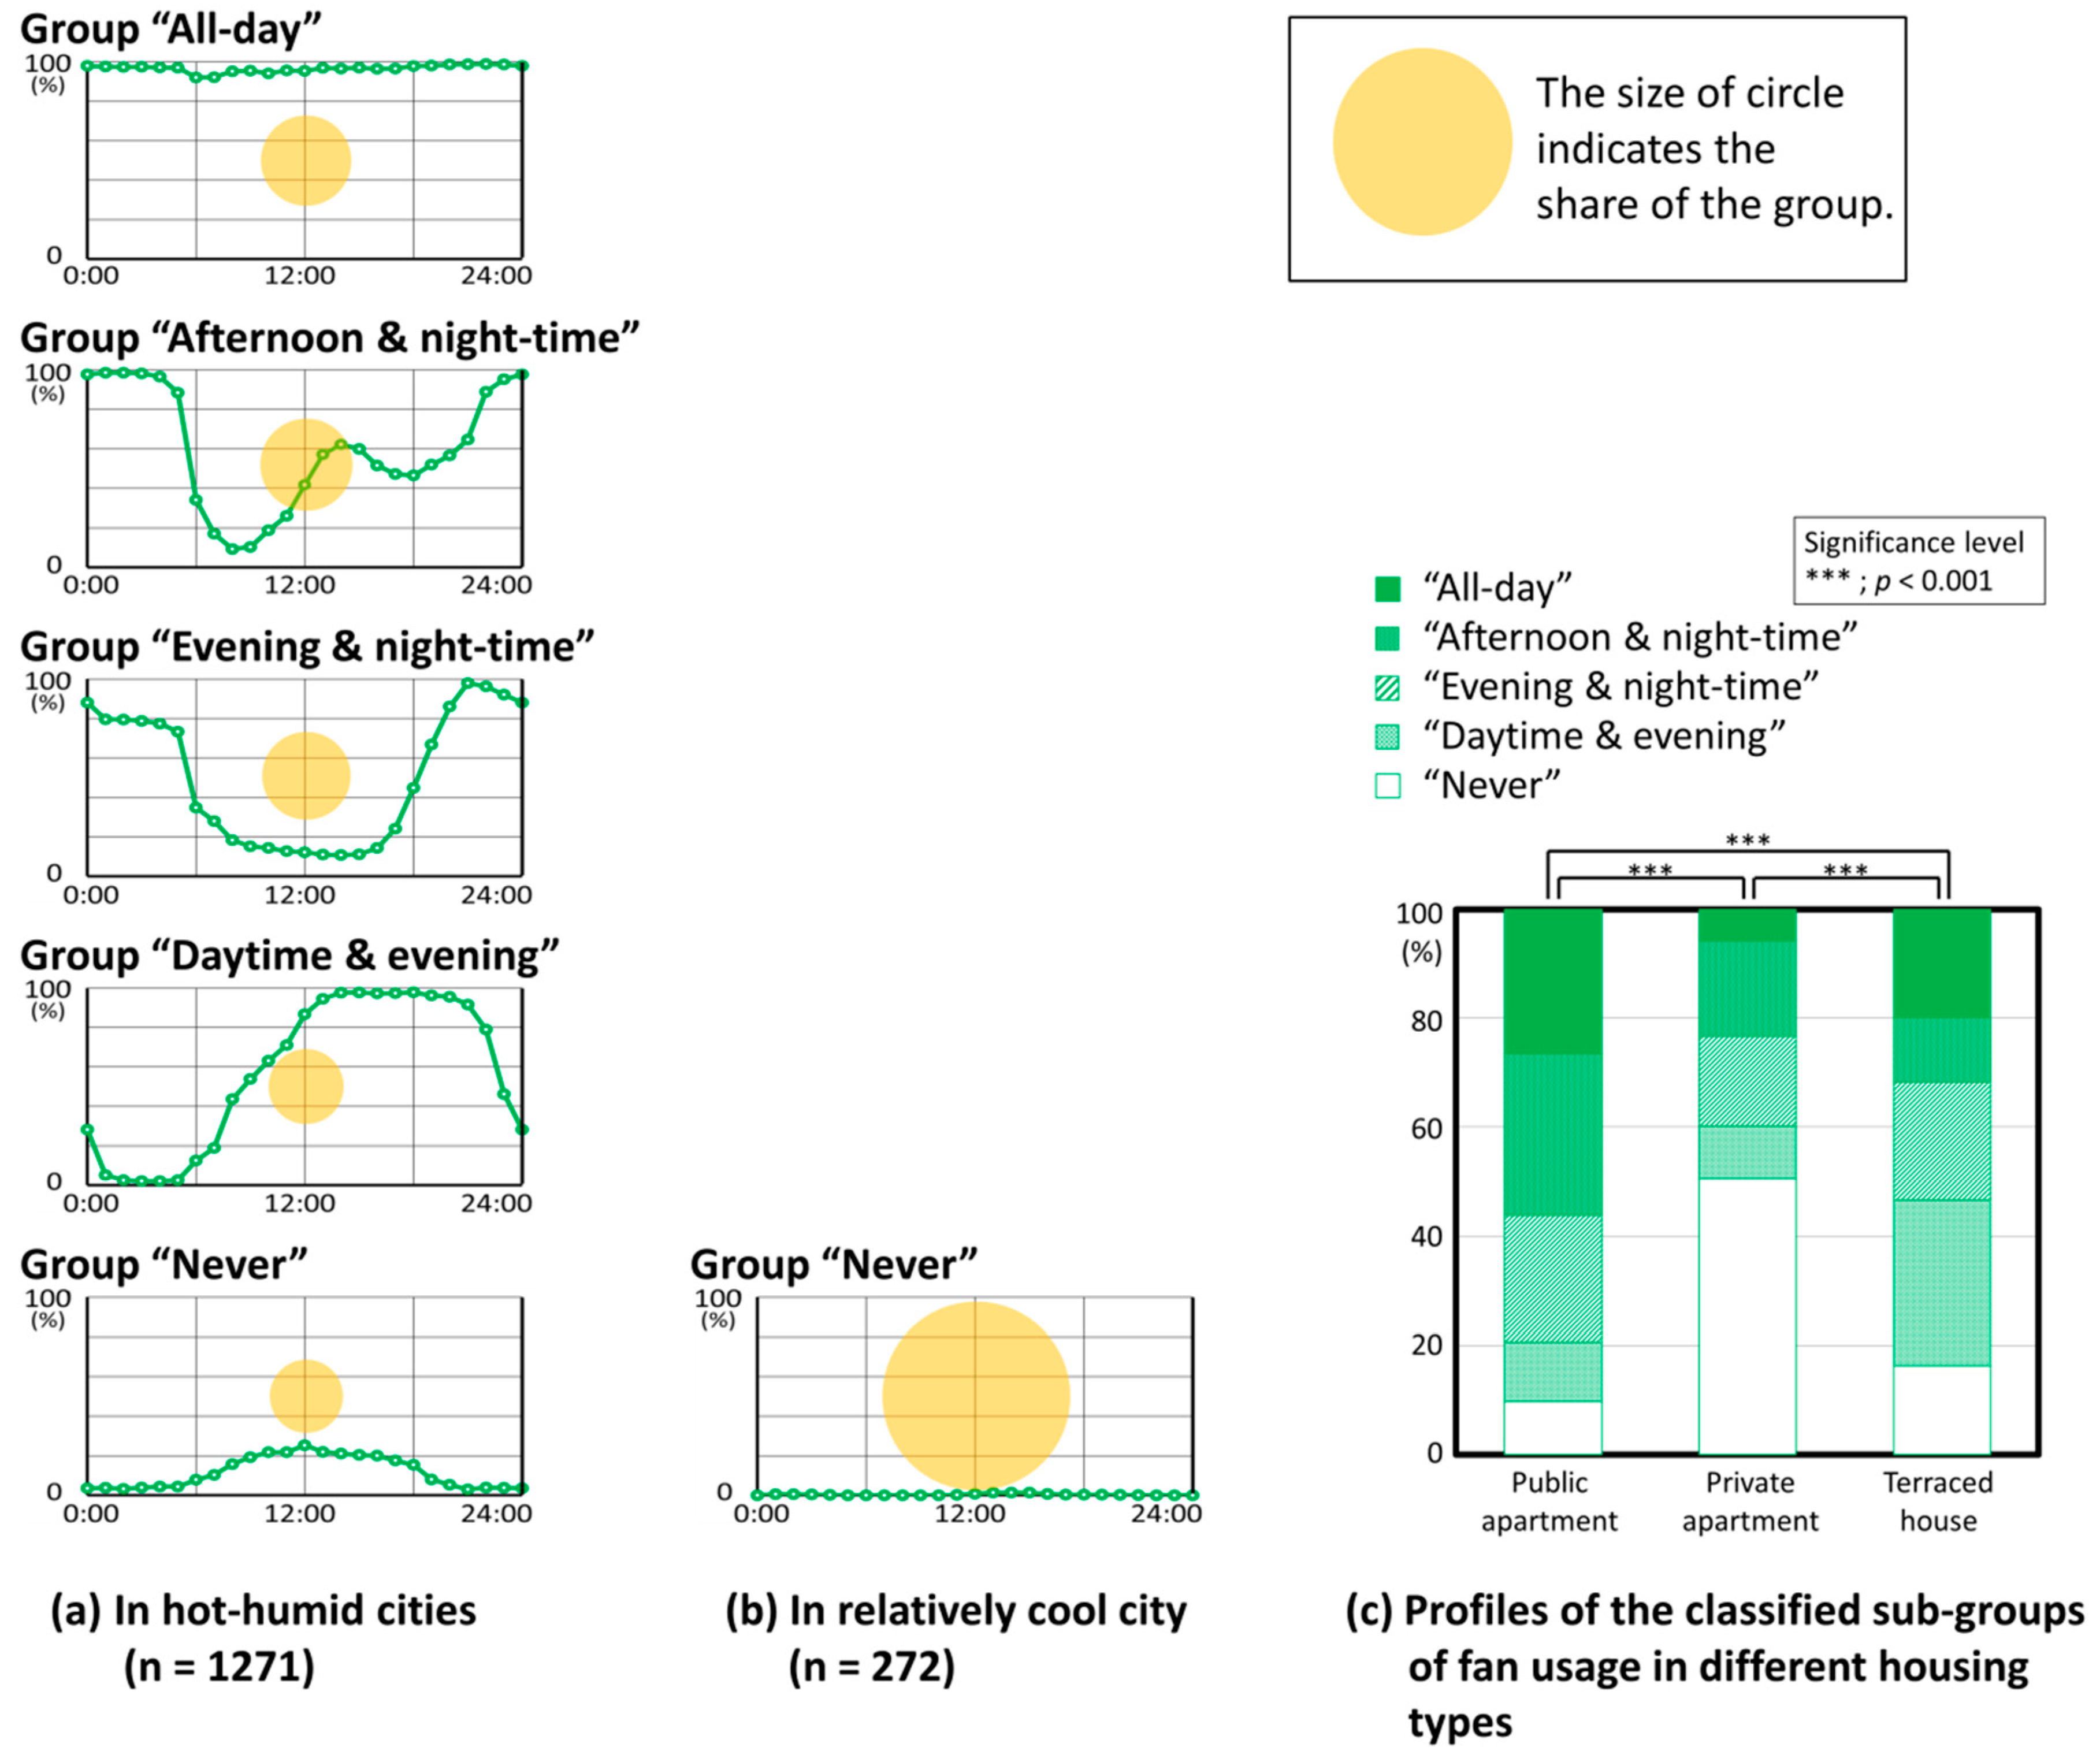
Table 5 and Figure 5 show the results for typical daily patterns of fan usage. As shown, overall, the usage patterns among households in the hot and humid cities are subdivided into five groups (Figure 5a). There is no dominant group with a large share. The most frequent group is “afternoon and night-time” (23.6%), followed by “all-day” (23.1%), “evening and night-time” (22.3%), “daytime and evening” (16.2%) and “never” (14.9%). In “afternoon and night-time” and “evening and night-time”, the fan(s) usage rate is as high as approximately 80% or more during night-time, resulting in the average usage time of 14.2 and 11.7 h, respectively. In “daytime and evening”, the fan(s) are turned on by 8:00 and turned off after 22:00, resulting in 12.8 h. The group “never” includes many non-owners (43.9%), but 8.3% of fan owners in the hot and humid cities do not use them almost at all. Furthermore, as shown in Figure 4c, the fan usage patterns are also influenced by the housing type. The households in private apartments tend to use less fans than the others.
As illustrated in Figure 5b, fan(s) are rarely used in the relatively cool climate, and thus, all households, including 94.1% of non-owners, are categorized as “never” (100%). The result clearly indicates that there is a clear contrast in terms of the fan usage between the hot and humid cities and the relatively cool city. The use of fan(s) is found only in the hot and humid cities.

3.4. Associations Among Daily Patterns of Window-Opening, AC Usage and Fan Usage

In this section, we analyse associations of the three adaptive behaviours, i.e., window-opening, AC usage and fan usage. The hierarchical cluster analysis was conducted using all the combined binary data of the three adaptive behaviours (total 72 variables). As a result, all the households in the hot and humid cities are classified into five sub-groups (Table 6 and Figure 6). Groups A1–A2 show the classified groups of households with owning AC(s), whereas Groups A3-A5 mainly represent those without AC.
As shown, the difference between Groups A1 and A2 is primarily due to a difference of AC usage patterns, namely the difference between the group “night-time” and “evening and night-time” (see Figure 4a). Meanwhile, Groups A3–A5 depict large differences in window-opening behaviour pattern. Group A4 is considered the most frequent group of the households without owning AC (49.3%), where windows are opened during daytime, followed by Group A3 (18.7%), where windows are opened throughout the day. The households in Group A5 (13.8%) do not open their windows much at any time of the day. Comparing Groups A1–A2 and Groups A3–A5, the former groups show relatively lower night-time fan usage rates than daytime, while the latter groups depict relatively higher night-time fan usage rates than daytime. Among the households without owning AC (Groups A3–A5), fan(s) are often used at night.
Table 7 summarizes major patterns of occupants’ adaptive behaviour in the two attribute groups. In the hot and humid cities, the majority of households open their windows during daytime regardless of AC ownership, while using AC(s) during night-time if they own it (otherwise, they use fans instead of AC). In the relatively cool city, most households open their windows twice a day shortly in the morning and the evening. It can be concluded that these adaptive behavioural patterns are different, firstly depending on the climatic conditions such as hot and humid and relatively cool climates. Nevertheless, even in the same climate region, various types of adaptive behaviour patterns can be extracted, especially in the hot and humid climate cities, as shown in Figure 6.

3.5. Reasons for Not Opening Windows

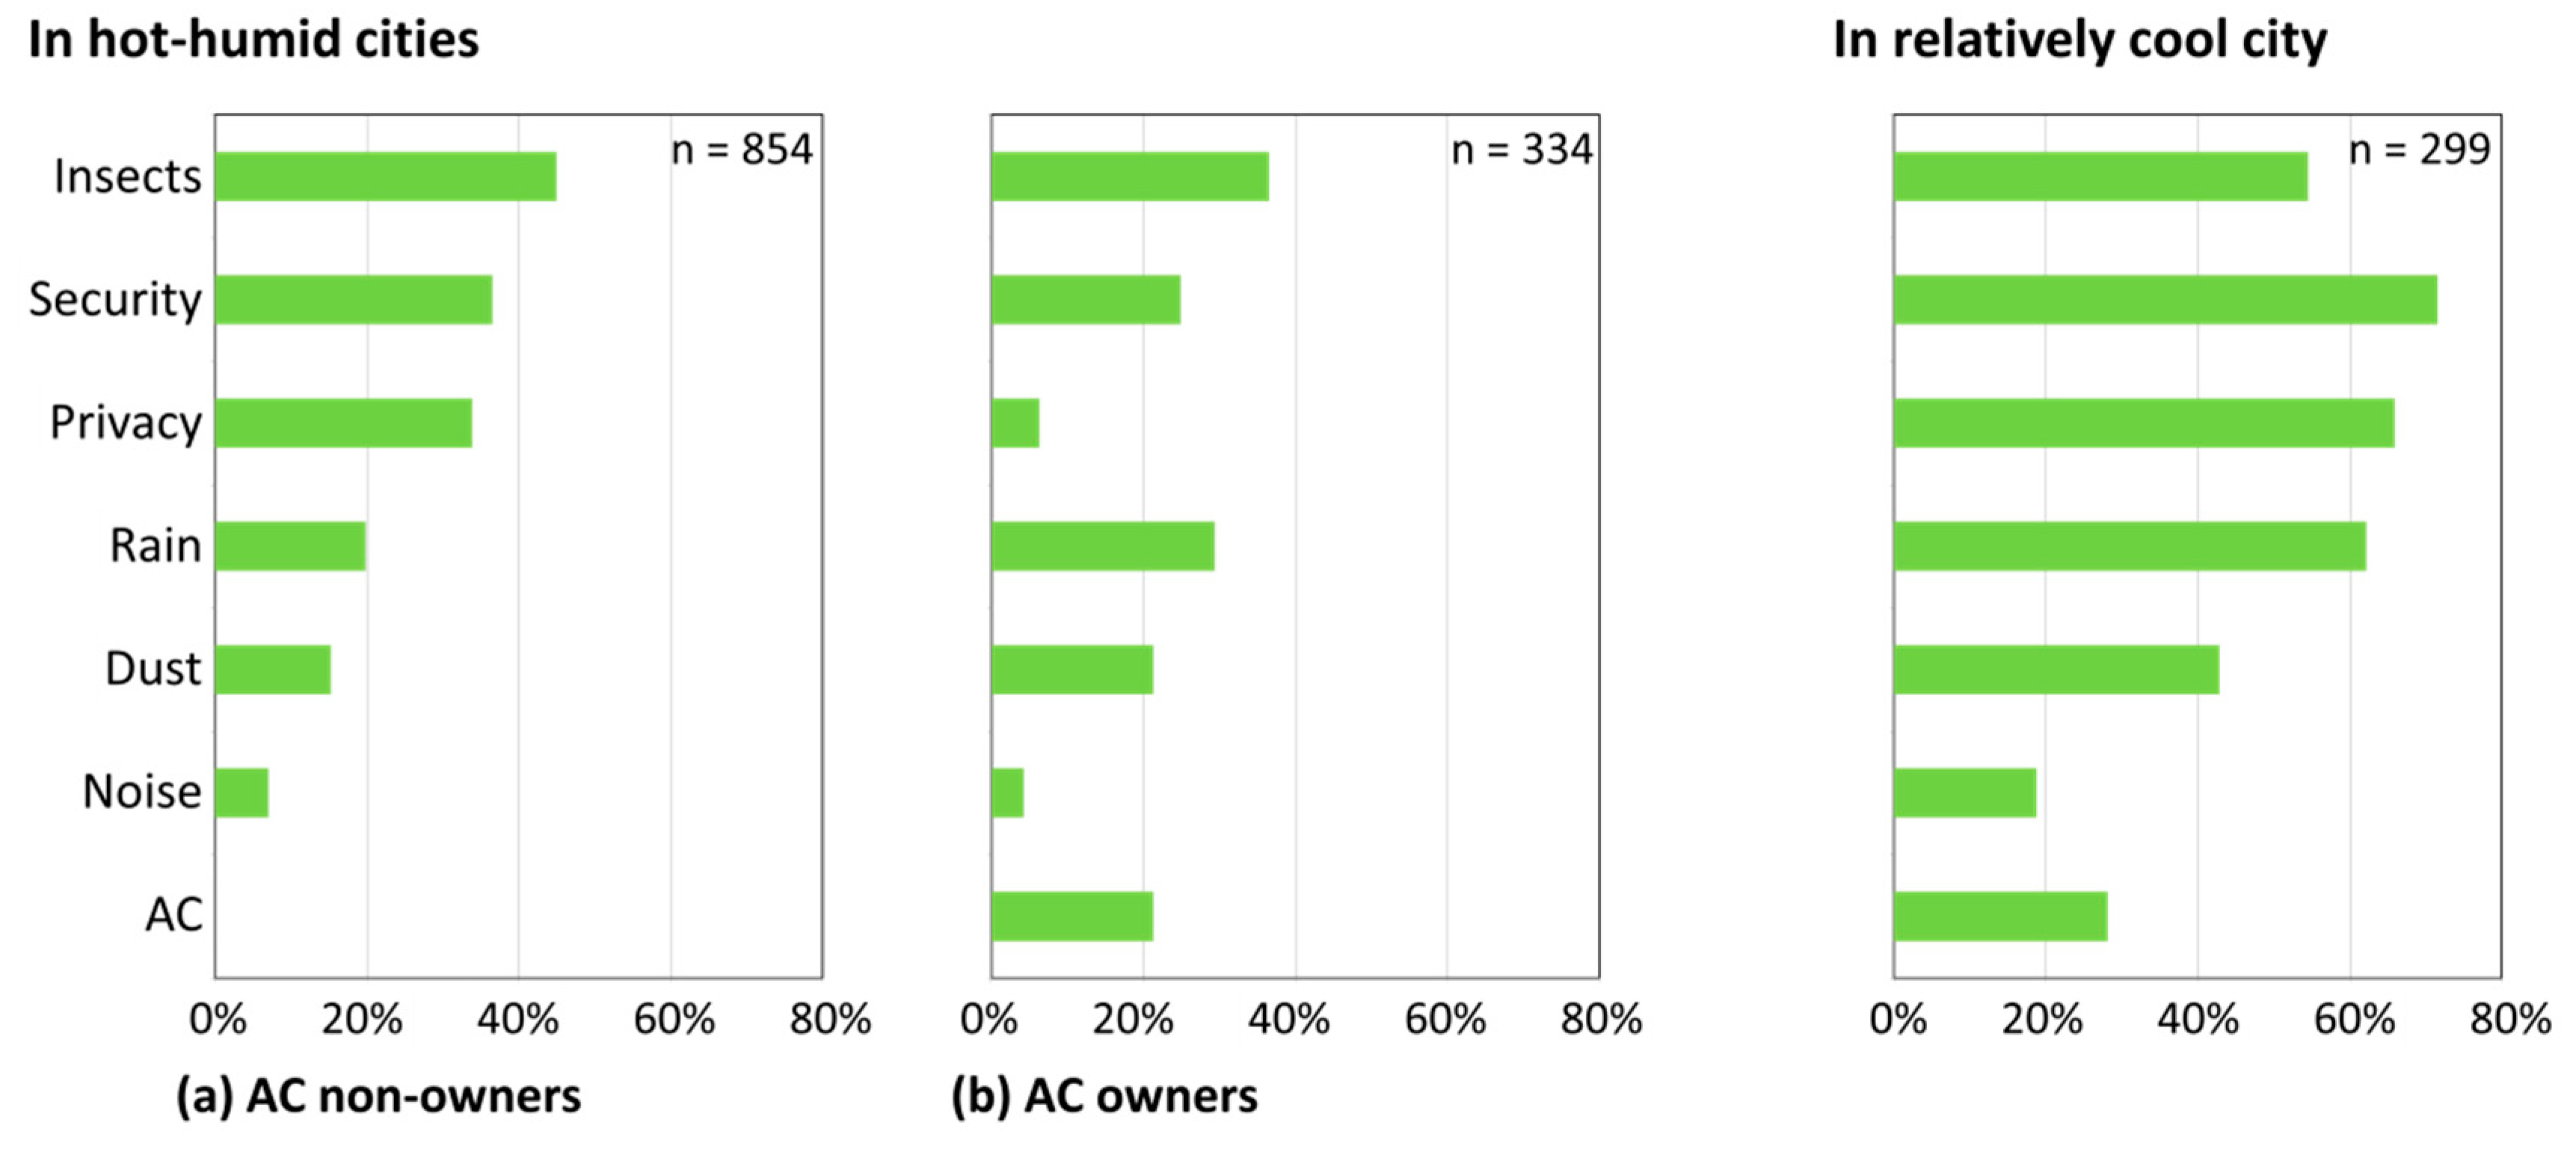
Figure 7 shows the reasons for not opening windows, which were asked in a multiple-choice question. In the hot and humid cities (Figure 7a,b), the households without owning AC answered “insects” (36.0%), “security” (28.6%), “privacy” (30.7%) and so on, whereas the households with AC(s) chose “insects” (33.2%), “rain” (26.6%), “security” (24.1%), etc. As discussed before, the daily patterns of window-opening were similar regardless of AC ownership, i.e., most households open their windows during daytime and close them at night (see Figure 6). Therefore, the above-mentioned major reasons for not opening windows such as “insects” and “security” are considered primarily as reasons for closing windows during night-time.
In the relatively cool city, few households open windows not only during night-time but also daytime (see Figure 6). As shown in Figure 7, the households are more concerned about “security” (71.6%), “privacy” (65.9%), “rain” (62.2%), “insects” (54.5%), etc. Although the frequencies are different between the two attribute groups, the above four major reasons were chosen similarly in the two groups. As these major reasons were considered those for closing windows during night-time, the reasons for not opening windows during daytime in the relatively cool city are found to be not attributed to these major reasons but to the climatic conditions, i.e., relatively cool climate.
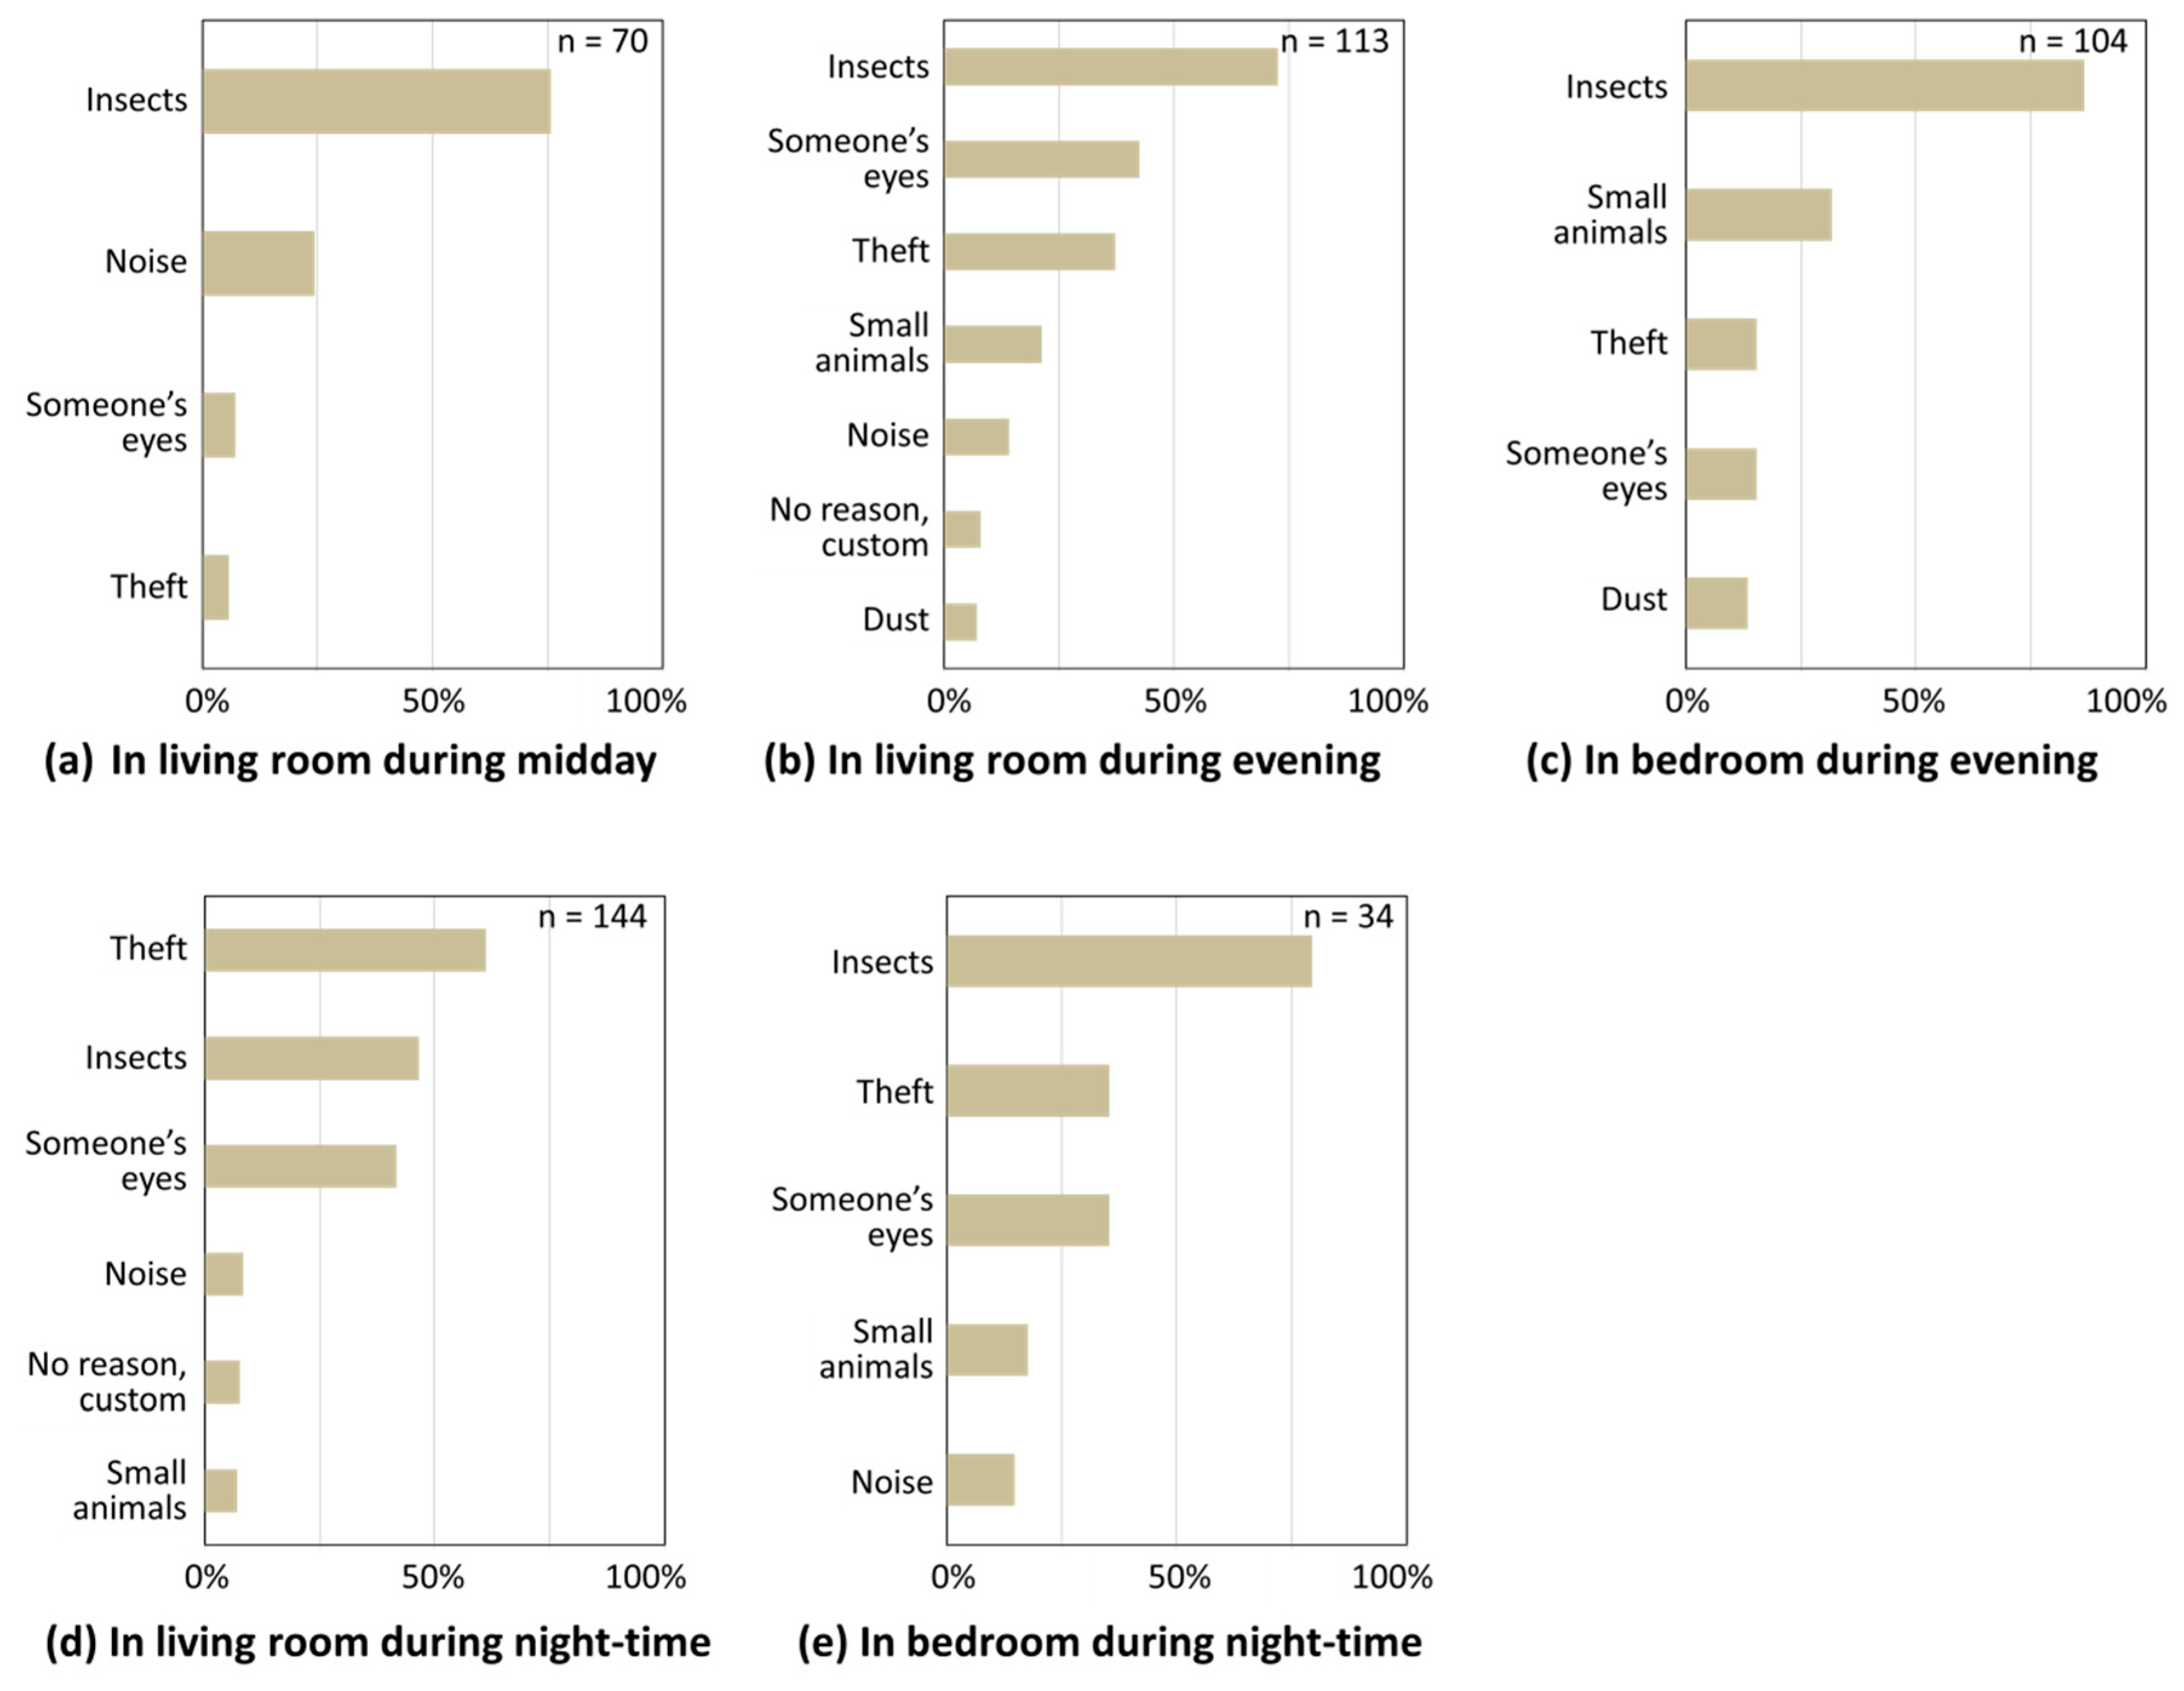
More detailed interviews were conducted in the survey of Surabaya (a hot-humid city) in 2016. Here, the reasons for closing windows among the households without owning AC were asked, distinguishing the time of a day (morning, evening and night-time) and the room (living room and bedroom), respectively (Figure 8). As seen in Figure 6, the daily patterns of window-opening of this attribute group were classified into three groups of A3, A4 and A5, which are full-day ventilation group (A3), daytime ventilation group (A4) and no ventilation group (A5). Hence, the reasons in Figure 8a primarily explain the reasons for closing windows during daytime among Group A5, whereas the reasons in Figure 8b–e explain those during night-time among Group A4. As shown in Figure 8b,c, the most frequent reason for closing windows in the evening is “insects” (72.6% and 86.5%) in both living room and bedroom. “Insects” remains the major reasons for later hours (night-time) in both rooms, while “theft” and “someone’s eyes” were also chosen with high frequencies especially for the living room (Figure 8d,e).
As discussed before, night ventilation is one of the effective passive cooling techniques even in the tropics for achieving indoor thermal comfort [3,6,8,11]. However, as shown here, most of the households in the hot and humid cities do not open their windows during night-time even without owning AC. To ensure the thermal comfort and energy-saving benefits from night ventilation, their current window-opening patterns need to be reconsidered. Eliminating concerns about “insects”, “theft” and “someone’s eyes” that are obstacles in opening windows at night are some of the key issues that need to be addressed in designing openings and windows.

3.6. Duration and Location of AC Usage

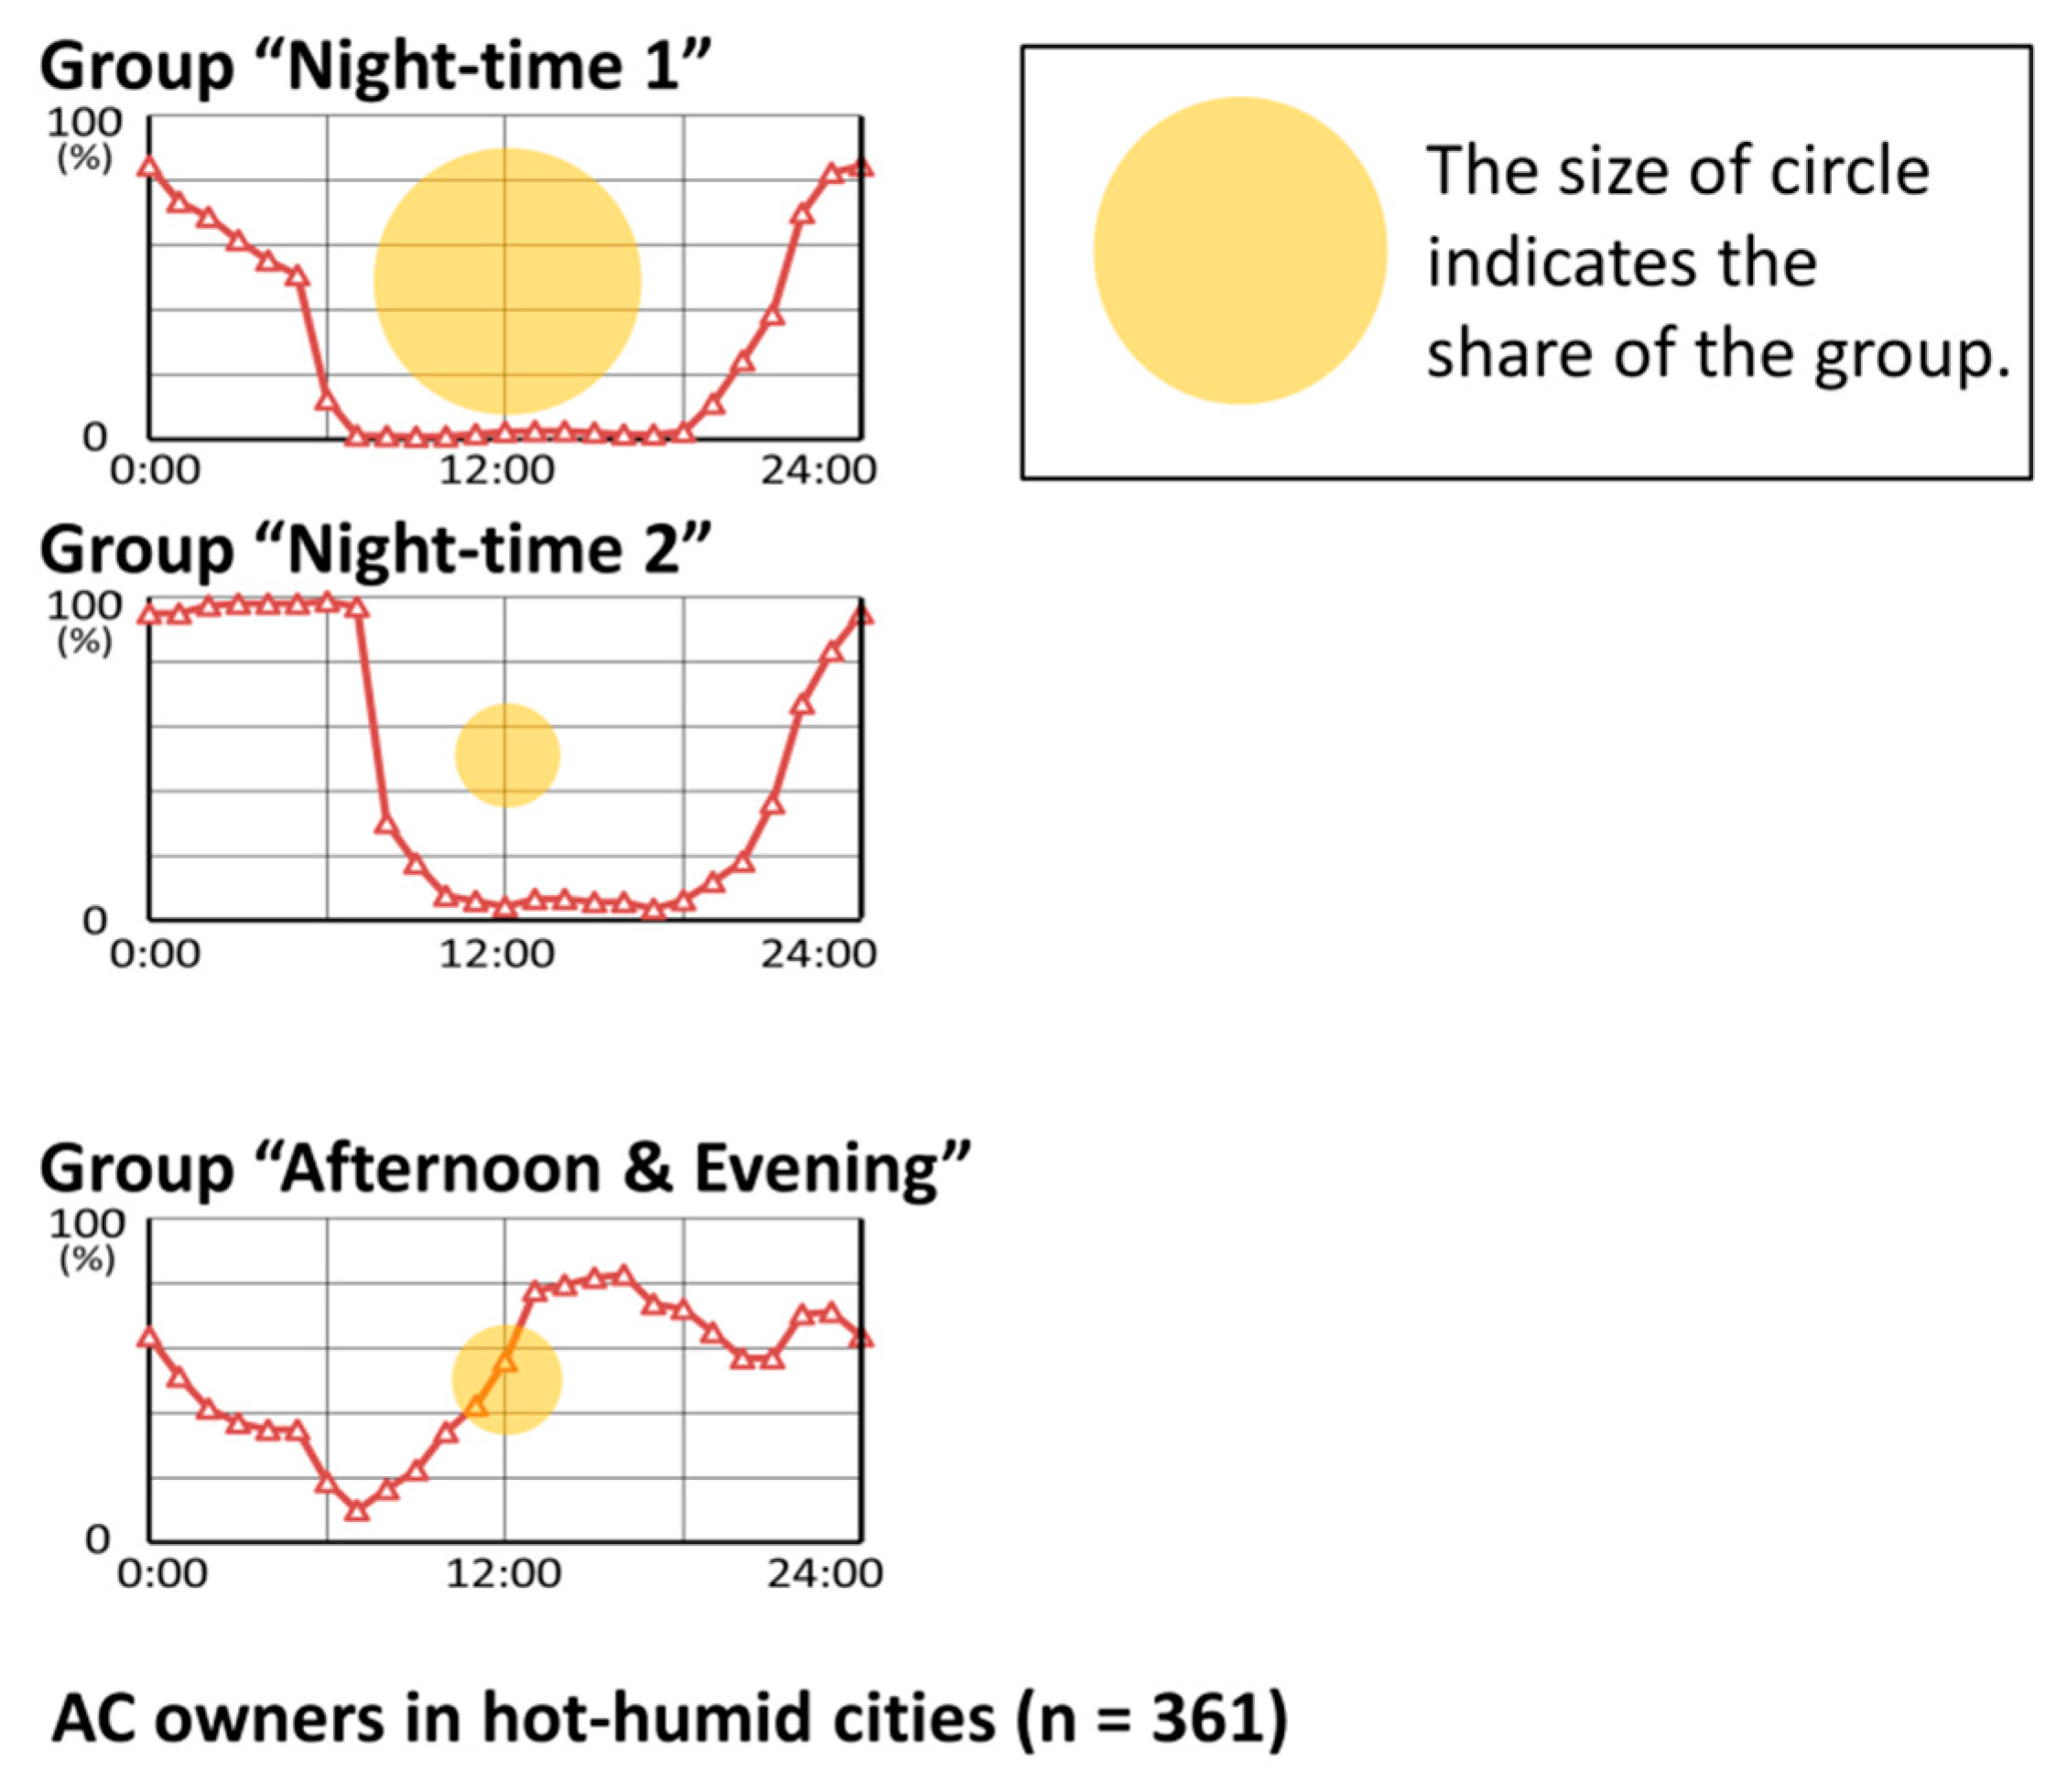
Furthermore, we conducted a hierarchical cluster analysis by using AC usage data of the households with owning ACs in the hot and humid cities (Table 8 and Figure 9). As mentioned before, if we analysed using all household data including AC non-owners, most households in this attribute group were found to use ACs in the evening and night-time (see Figure 4a). However, when AC non-owners are excluded from the analysis, a new usage group “afternoon and evening” emerges, where AC is used from about 12:00 noon to about 24:00 midnight. The average AC usage duration of this group is 12.7 h per day and significantly longer than the overall average of 7.8 h.
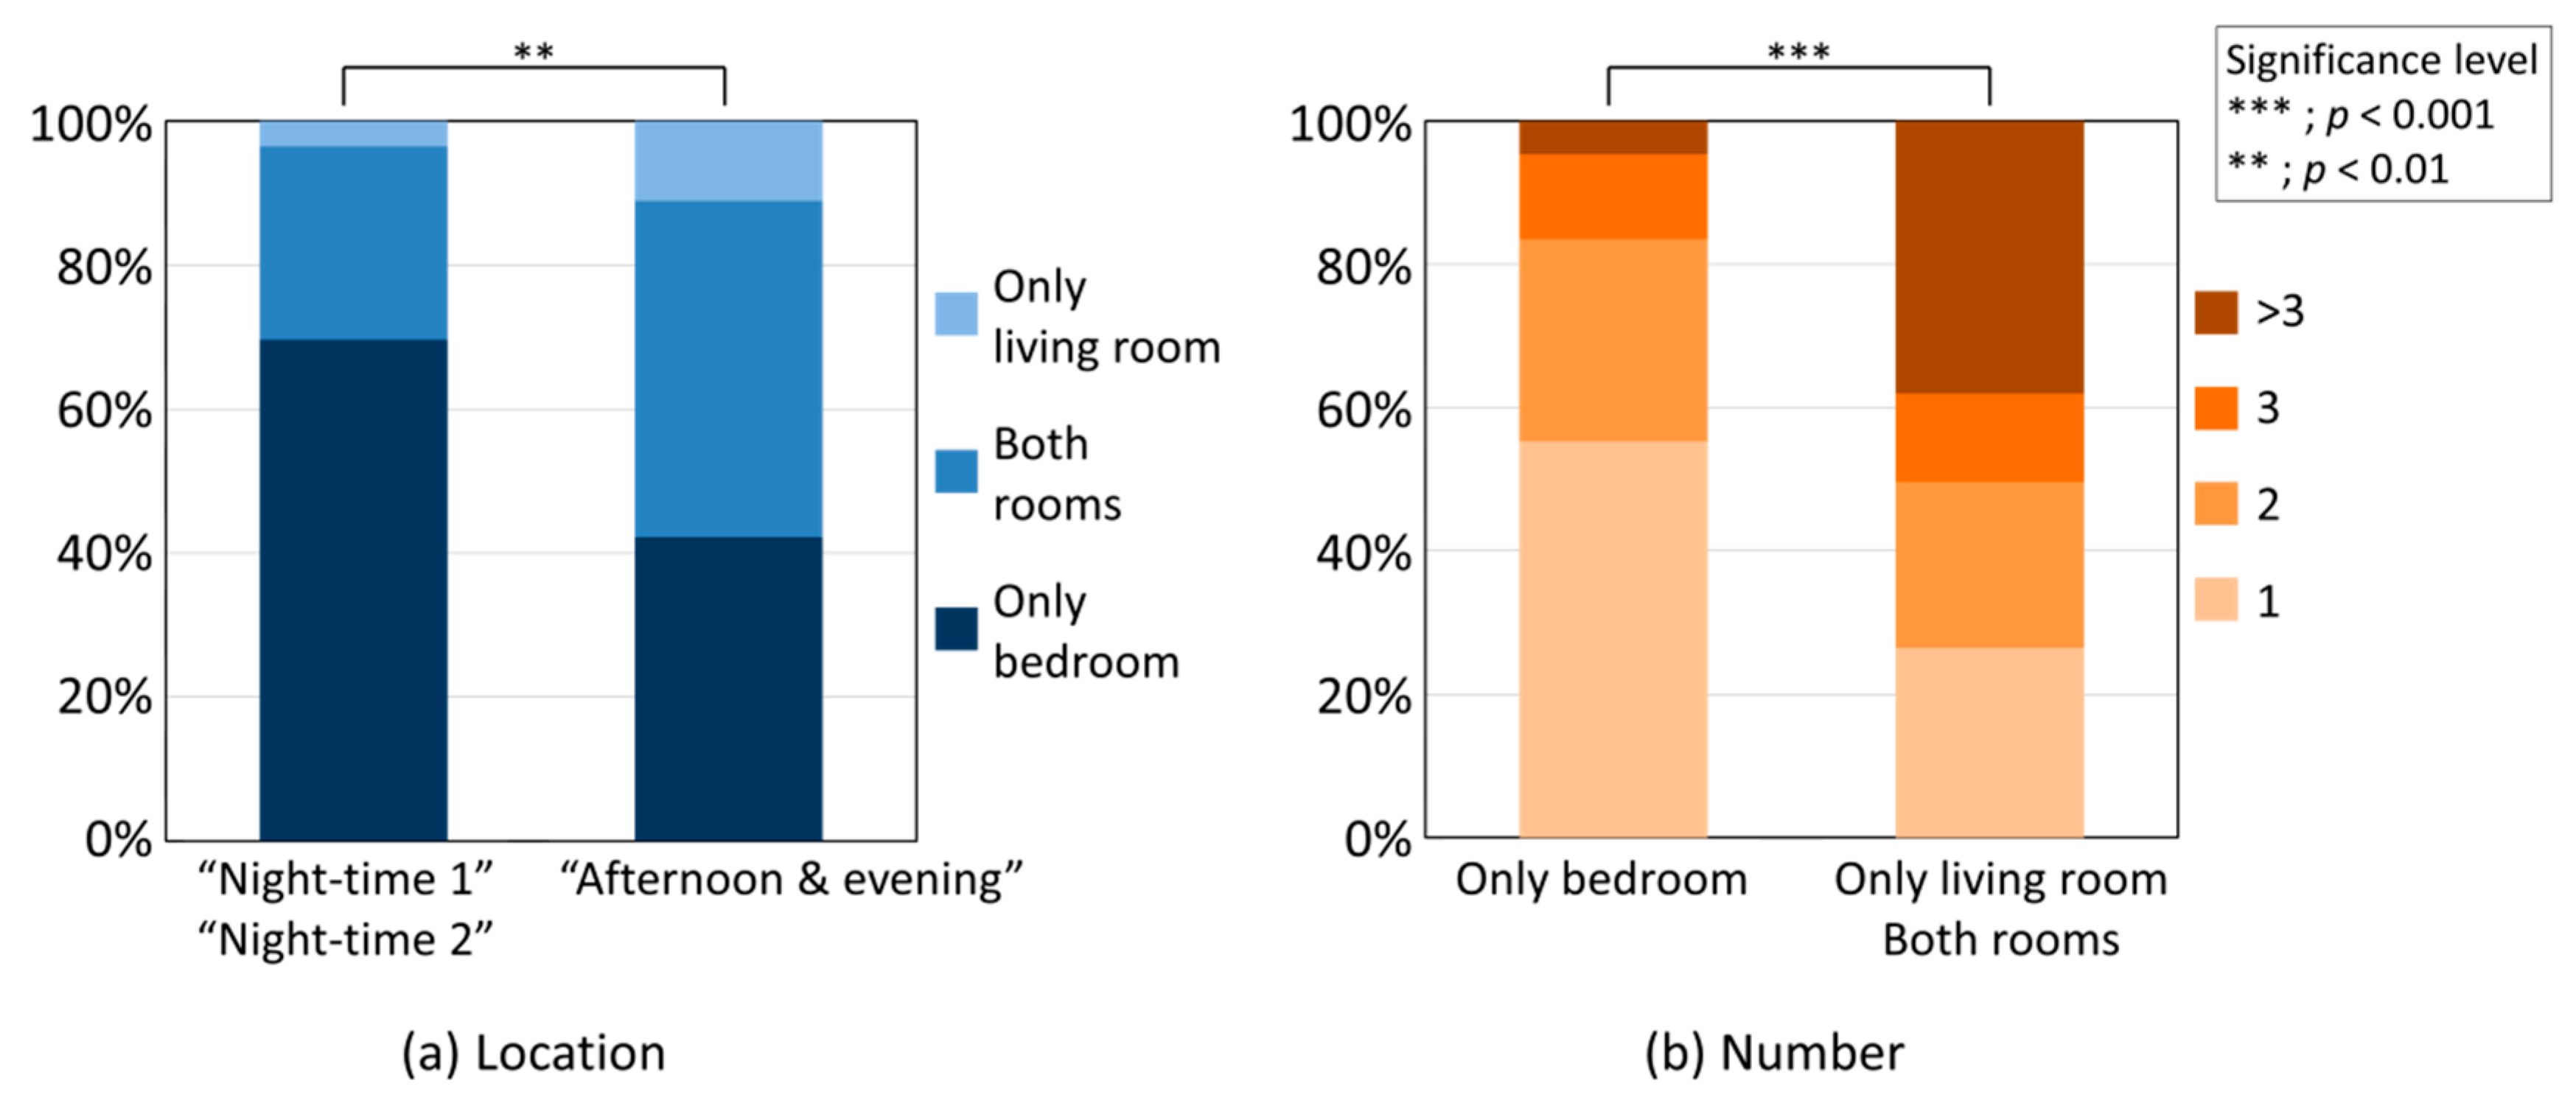
Figure 10a shows the locations of AC installation for the groups “night-time 1” and “night-time 2” (using ACs during night-time), and the group “afternoon and evening” (see Figure 9). As a result of a Pearson’s chi-square test, a significant difference was found between the two groups (χ2 = 14.825, df = 2, p < 0.01). It can be seen that approximately 70% of the households in groups “night-time” install ACs only in their bedrooms, whereas those in the group “afternoon and evening” tend to install AC(s) more in their living rooms (approximately 58%). In other words, the households who have an AC in their living rooms use AC earlier from the afternoon. Figure 10b depicts the total number of AC(s), comparing between the households with AC only in the bedroom and those with ACs only in the living room or both living room and bedrooms (χ2 = 71.479, df = 3, p < 0.001). As shown, more than 55% of the former group own only one unit of AC, while around 74% of the latter group have two or more ACs in their houses. This implies that they tend to install an AC in their bedrooms first and then, install further units in their living rooms additionally.
At present, approximately 87.3% of the households (AC owners) use AC only at night particularly in their bedrooms (7.1 h per day), and the remaining 12.7% use it for a long time from afternoon to night (12.5 h) (see Figure 9). The above result suggests that if the AC ownership continues to rise further along with the increase in household income in the near future, the households are expected to install their AC(s) not only in their bedrooms but also in the living room and thus increase their usage time dramatically.

4. Conclusions

The key findings revealed in this study are as follows:
(1)
Several typical daily patterns of window-opening, AC usage and fan usage were extracted, respectively. Occupants’ window-opening behaviour was influenced by its climatic conditions such as hot and humid and relatively cool climates. Nevertheless, there were various behavioural patterns even in the same hot and humid climate. This indicates that there are factors affecting the window-opening behaviour other than temperature changes. There was no significant association between thermal sensations and the window-opening behaviour in this survey.
(2)
It was found that household size, age of respondent, household income and concerns about insects were the most influential factors for daily window-opening patterns. In addition, housing type, floor level and AC ownership, respectively, affected window-opening behaviour in the evening and night. Concerns about insects, security and rain were associated as obstacles for window-opening behaviour at night.
(3)
Daily patterns of AC use and fan use were different between the hot and humid cities and the relatively cool city. In the former cities, most households used ACs during night-time, whereas AC non-owners used fans instead. In the latter city, AC(s) were mostly used only in the evening without using fan(s).
(4)
Most households without owning AC in the hot and humid cities mainly opened their windows only during daytime. The reasons for closing windows in the evening and night-time included “insects” for both living room and bedrooms. “Theft” and “someone’s eyes” were also chosen as the reasons for living room at night. This result suggested that it is necessary to eliminate these obstacles to promote structural cooling with night ventilation.
(5)
In the hot and humid cities, the households tended to install their AC in their bedrooms first, and then install an additional unit in their living rooms. It was suggested that energy consumption would increase further if AC ownership is increased and used not only in their bedrooms at night but also in the living rooms during daytime in the future.
The above-mentioned results suggest that well-design of household and building features would be able to encourage the occupant adaptive behaviour such as window-opening in the tropics. Based on the results, we propose a strategic housing design that encourages natural ventilation in the living room, while limits the AC use only in the bedrooms. This hybrid cooling strategy is to promote passive cooling techniques especially for their living rooms so that occupants can achieve indoor thermal comfort without relying on excessive use of ACs during daytime. As discussed before, structural cooling with night ventilation can be one of the options to help achieve the thermal comfort during daytime. Therefore, the concerns (e.g., insects and security) that hinder window-opening at night need to be resolved by designing windows and openings. On the other hand, sufficient solar shading and thermal insulation should be adopted especially for the air-conditioned spaces (i.e., bedrooms) to reduce the cooling loads and thus energy consumption for cooling as much as possible.

Author Contributions

Conceptualization, T.K. and H.M.; methodology, T.K. and H.M.; data collection, H.M., T.K. and S.N.N.E.; formal analysis, H.M.; supervision, T.K., I.G.N.A. and S.N.N.E.; writing—original draft preparation, H.M. and T.K.; writing—review and editing, T.K., H.M., I.G.N.A. and S.N.N.E.; visualization, H.M.; project administration, T.K., I.G.N.A. and S.N.N.E.; funding acquisition, T.K. All authors have read and agreed to the published version of the manuscript.

Funding

This research was supported by YKK AP Inc. This research was partially supported by the Science and Technology Research Partnership for Sustainable Development (SATREPS) in collaboration between Japan Science and Technology Agency (JST, JPMJSA1904) and Japan International Cooperation Agency (JICA).

Acknowledgments

Special thanks are extended to the students of Institut Teknologi Sepuluh Nopember and Hiroshima University who helped the field survey and its preparation. We also would like to appreciate Hideyo~Nimiya of Kagoshima University for providing weather data.

Conflicts of Interest

The authors declare no conflict of interest.

References

  1. Santamouris, M. Cooling the Buildings—Past, Present and Future. Energy Build. 2016, 128, 617–638. [Google Scholar] [CrossRef]
  2. International Energy Agency. Southeast Asia Energy Outlook; International Energy Agency: Paris, France, 2019. [Google Scholar]
  3. Kubota, T.; Toe, D.H.C.; Ahmad, S. The Effects of Night Ventilation Technique on Indoor Thermal Environment for Residential Buildings in Hot-Humid Climate of Malaysia. Energy Build. 2009, 41, 829–839. [Google Scholar] [CrossRef]
  4. Prajongsan, P.; Sharples, S. Enhancing Natural Ventilation, Thermal Comfort and Energy Saving in High-Rise Residential Buildings in Bangkok through the Use of Ventilation Shafts. Build. Environ. 2012, 50, 104–113. [Google Scholar] [CrossRef]
  5. Tong, Z.; Chen, Y.; Malkawi, A.; Liu, R.; Freeman, B. Energy Saving Potential of Natural Ventilation in China: The Impact of Ambient Air Pollution. Appl. Energy 2016, 179, 660–668. [Google Scholar] [CrossRef] [Green Version]
  6. Kubota, T.; Zakaria, M.A.; Ahmad, M.H.; Toe, D.H.C. Energy-Saving Experimental House in Hot-Humid Climate of Malaysia. In Sustainable Houses and Living in the Hot-Humid Climate of Asia; Kubota, T., Rijal, H.B., Takaguchi, H., Eds.; Springer: Singapore, 2018; pp. 457–471. [Google Scholar]
  7. Uno, T.; Hokoi, S.; Ekasiwi, S.N.N.; Majid, N.H.A. Reduction of Energy Consumption by AC due to Air Tightness and Ventilation Strategy in Residences in Hot and Humid Climates. J. Asian Archit. Build. Eng. 2012, 11, 407–414. [Google Scholar] [CrossRef]
  8. Kitagawa, H.; Asawa, T.; Kubota, T.; Trihamdani, A.R.; Sakurada, K.; Mori, H. Optimization of Window Design for Ventilative Cooling with Radiant Floor Cooling Systems in the Hot and Humid Climate of Indonesia. Build. Environ. 2020, 107483, in press. [Google Scholar] [CrossRef]
  9. Nguyen, A.T.; Reiter, S. An Investigation on Thermal Performance of a Low Cost Apartment in Hot Humid Climate of Danang. Energy Build. 2012, 47, 237–246. [Google Scholar] [CrossRef]
  10. Candido, C.; de Dear, R.J.; Lambert, R.; Bittencourt, L. Air Movement Acceptability Limits and Thermal Comfort in Brazil’s Hot Humid Climate Zone. Build. Environ. 2010, 45, 222–229. [Google Scholar] [CrossRef]
  11. Sorgato, M.J.; Melo, A.P.; Lamberts, R. The Effect of Window Opening Ventilation Control on Residential Building Energy Consumption. Energy Build. 2016, 113, 1–13. [Google Scholar] [CrossRef]
  12. Fabi, V.; Andersen, R.V.; Corgnati, S.; Olesen, B.W. Occupants’ Window Opening Behavior: A Literature Review of Factors Influencing Occupant Behavior and Models. Build. Environ. 2012, 58, 188–198. [Google Scholar] [CrossRef]
  13. Schweiker, M.; Carlucci, S.; Andersen, R.K.; Dong, B.; O’Brien, W. Occupancy and occupants’ actions. In Exploring Occupant Behavior in Buildings; Wagner, A., Dong, B., O’Brien, W., Eds.; Springer: Berlin/Heidelberg, Germany, 2018; pp. 7–38. [Google Scholar]
  14. Borgeson, S.; Brager, G. Occupant Control of Windows: Accounting for Human Behavior in Building Simulation. In CBE Internal Report; Center for the Built Environment: Berkeley, CA, USA, 2008. [Google Scholar]
  15. Yao, M.; Zhao, B. Window Opening Behavior of Occupants in Residential Buildings in Beijing. Build. Environ. 2017, 124, 441–449. [Google Scholar] [CrossRef]
  16. Stazi, F.; Naspi, F.; D’Orazio, M. Modeling Window Status in School Classrooms: Results from a Case Study in Italy. Build. Environ. 2017, 111, 24–32. [Google Scholar] [CrossRef]
  17. Pan, S.; Xionga, Y.; Hana, Y.; Zhang, X.; Xia, L.; Wei, S.; Wu, J.; Han, M. A Study on Influential Factors of Occupant Window-Opening Behavior in an Office Building in China. Build. Environ. 2018, 133, 41–50. [Google Scholar] [CrossRef]
  18. Pan, S.; Han, Y.; Wei, S.; Wei, Y.; Xia, L.; Xie, L.; Kong, X.; Yu, W. A Model Based on Gauss Distribution for Predicting Window Behavior in Building. Build. Environ. 2019, 149, 210–219. [Google Scholar] [CrossRef]
  19. Barthelmes, V.M.; Heo, Y.; Fabi, V.; Corgnati, S.P. Exploration of the Bayesian Network Framework for Modelling Window Control Behavior. Build. Environ. 2017, 126, 318–330. [Google Scholar] [CrossRef]
  20. Fabi, V.; Andersen, R.K.; Corgnati, S. Verification of Stochastic Behavioural Models of Occupants’ Interactions with Windows in Residential Buildings. Build. Environ. 2015, 94 Pt 1, 371–383. [Google Scholar] [CrossRef]
  21. Rijal, H.B.; Tuohy, P.; Humphreys, M.A.; Nicol, J.F.; Samuel, A.; Clarke, J. Using Results from Field Surveys to Predict the Effect of Open Windows on Thermal Comfort and Energy Use in Buildings. Energy Build. 2007, 39, 823–836. [Google Scholar] [CrossRef] [Green Version]
  22. Rijal, H.B.; Humphreys, M.A.; Nicol, J.F. How Do the Occupants Control the Temperature in Mixed-Mode Buildings? Predicting the Use of Passive and Active Controls. In Proceedings of the Windsor Conference 2008, Air Conditioning and the Low Carbon Cooling Challenge, Windsor, UK, 27–29 July 2008. [Google Scholar]
  23. Rijal, H.B.; Honjo, M.; Kobayashi, R.; Nakaya, T. Investigation of Comfort Temperature, Adaptive Model and the Window Opening Behaviour in Japanese Houses. Archit. Sci. Rev. 2013, 56, 54–69. [Google Scholar] [CrossRef]
  24. Rijal, H.B.; Humphreys, M.A.; Nicol, J.F. Development of a Window Opening Algorithm Based on Adaptive Thermal Comfort to Predict Occupant Behavior in Japanese Dwellings. Jpn. Archit. Rev. 2018, 1, 310–321. [Google Scholar] [CrossRef]
  25. Park, J.; Choi, C.S. Modeling Occupant Behavior of the Manual Control of Windows in Residential Buildings. Indoor Air 2019, 29, 242–251. [Google Scholar] [CrossRef]
  26. Shi, Z.; Qian, H.; Zheng, X.; Lv, Z.; Li, Y.; Liu, L.; Nielsen, P.V. Seasonal Variation of Window Opening Behaviors in Two Naturally Ventilated Hospital Wards. Build. Environ. 2018, 130, 85–93. [Google Scholar] [CrossRef] [PubMed]
  27. Zhou, X.; Liu, T.; Shi, X.; Jin, X. Case Study of Window Operating Behavior Patterns in an Open-Plan Office in the Summer. Energy Build. 2018, 165, 15–24. [Google Scholar] [CrossRef]
  28. Kim, A.; Wang, S.; Kim, J.-E.; Reed, D. Indoor/Outdoor Environmental Parameters and Window-Opening Behavior: A Structural Equation Modeling Analysis. Buildings 2019, 9, 94. [Google Scholar] [CrossRef] [Green Version]
  29. Pisello, A.L.; Castaldo, V.L.; Piselli, C.; Fabiani, C.; Cotana, F. How Peers’ Personal Attitudes Affect Indoor Microclimate and Energy Need in an Institutional Building: Results from a Continuous Monitoring Campaign in Summer and Winter Conditions. Energy Build. 2016, 126, 485–497. [Google Scholar] [CrossRef]
  30. Roetzel, A.; Tsangrassoulis, A.; Dietrich, U.; Busching, S. A Review of Occupant Control on Natural Ventilation. Renew. Sustain. Energy Rev. 2010, 14, 1001–1013. [Google Scholar] [CrossRef]
  31. Jeong, B.; Jeong, W.; Park, J.S. Occupant Behavior Regarding the Manual Control of Windows in Residential Buildings. Energy Build. 2016, 127, 206–216. [Google Scholar] [CrossRef]
  32. Cali, D.; Andersen, R.K.; Müller, D.; Olesen, B.W. Analysis of Occupants’ Behavior Related to the Use of Windows in German Households. Build. Environ. 2016, 103, 54–69. [Google Scholar] [CrossRef] [Green Version]
  33. Stazi, F.; Naspi, F.; D’Orazio, M. A Literature Review on Driving Factors and Contextual Events Influencing Occupants’ Behavior in Buildings. Build. Environ. 2017, 118, 46–88. [Google Scholar] [CrossRef]
  34. Andersen, R.V.; Toftum, J.; Andersen, K.K.; Olesen, B.W. Survey of Occupant Behaviour and Control of Indoor Environment in Danish Dwellings. Energy Build. 2009, 41, 11–16. [Google Scholar] [CrossRef]
  35. Brager, G.S.; Dear, R.J. Thermal Adaptation in the Built Environment: A Literature Review. Energy Build. 1998, 27, 83–96. [Google Scholar] [CrossRef] [Green Version]
  36. Schweiker, M.; Ampatzi, E.; Andargie, M.S.; Andersen, R.K.; Azar, E.; Barthelmes, V.M.; Berger, C.; Bourikas, L.; Carlucci, S.; Chinazzo, G.; et al. Review of Multi-Domain Approaches to Indoor Environmental Perception and Behavior. Build. Environ. 2020, 176, 106804. [Google Scholar] [CrossRef]
  37. Yun, G.Y.; Steemers, K. Time-Dependent Occupant Behaviour Models of Window control in Summer. Build. Environ. 2008, 43, 1471–1482. [Google Scholar] [CrossRef]
  38. Markovic, R.; Grintal, E.; Wölki, D.; Frisch, J.; Treeck, C.V. Window Opening Model Using Deep Learning Methods. Build. Environ. 2018, 145, 319–329. [Google Scholar] [CrossRef] [Green Version]
  39. Mahdavi, A.; Mohammadi, A.; Kabir, E.; Lambeva, L. Occupants’ Operation of Lighting and Shading Systems in Office Buildings. J. Build. Perform. Simul. 2008, 1, 57–65. [Google Scholar] [CrossRef]
  40. D’Oca, S.; Hong, T. A Data-Mining Approach to Discover Patterns of Window Opening and Closing Behavior in Offices. Build. Environ. 2014, 82, 726–739. [Google Scholar] [CrossRef] [Green Version]
  41. Haldi, F.; Robinson, D. Adaptive Actions on Shading Devices in Response to Local Visual Stimuli. J. Build. Perform. Simul. 2010, 3, 135–153. [Google Scholar] [CrossRef]
  42. Jones, R.V.; Fuetes, A.; Gregori, E.; Giretti, A. Stochastic Behavioural Models of Occupants’ Main Bedroom Window Operation for UK Residential Buildings. Build. Environ. 2017, 118, 144–158. [Google Scholar] [CrossRef]
  43. Nicol, J.F.; Humphreys, M.A. A Stochastic Approach to Thermal Comfort-Occupant Behavior and Energy Use in Buildings. Build. Environ. 2004, 110, 551–568. [Google Scholar]
  44. Rijal, H.B.; Humphrey, M.A.; Nicol, J.F. Understanding Occupant Behaviour: The Use of Controls in Mixed-Mode Office Buildings. Build. Res. Inf. 2009, 37, 381–396. [Google Scholar] [CrossRef]
  45. Manu, S.; Shukla, Y.; Rawal, R.; Thomas, L.E.; Dear, R.D. Field Studies of Thermal Comfort Across Multiple Climate Zones for the Subcontinent: India Model for Adaptive Comfort (IMAC). Build. Environ. 2016, 98, 55–70. [Google Scholar] [CrossRef] [Green Version]
  46. Madsen, L.V. Materialities Shape Practices and Notions of Comfort in Everyday Life. Build. Res. Inf. 2018, 46, 71–82. [Google Scholar] [CrossRef]
  47. Rea, M.S. Window Blind Occlusion: A Pilot Study. Build. Environ. 1984, 19, 133–137. [Google Scholar] [CrossRef] [Green Version]
  48. Haldi, F.; Robinson, D. Modelling Occupants’ Personal Characteristics for Thermal Comfort Prediction. Int. J. Biometeorol. 2011, 55, 681–694. [Google Scholar] [CrossRef] [PubMed]
  49. Hansen, A.R.; Gram-Hanssen, K.; Knudsen, H.N. How Building Design and Technologies Influence Heat-Related Habits. Build. Res. Inf. 2018, 46, 83–98. [Google Scholar] [CrossRef]
  50. Schweiker, M.; Wagner, A. The Effect of Occupancy on Perceived Control, Neutral Temperature, and Behavioral Patterns. Energy Build. 2016, 117, 246–259. [Google Scholar] [CrossRef]
  51. Shi, S.S.; Li, H.J.; Ding, X.; Gao, X. Effects of Household Features on Residential Window Opening Behaviors: A Multilevel Logistic Regression Study. Build. Environ. 2019, 170, 106610. [Google Scholar] [CrossRef]
  52. O’Brien, W.; Wagner, A.; Day, J.K. Introduction to Occupant Research Approaches. In Exploring Occupant Behavior in Buildings; Wagner, A., O’Brien, W., Dong, B., Eds.; Springer: Singapore, 2018; pp. 107–127. [Google Scholar]
  53. O’Brien, W.; Gunay, H.B.; Tahmasebi, F.; Mahdavi, A. A Preliminary Study of Representing the Inter-Occupant Diversity in Occupant Modelling. J. Build. Perform. Simul. 2017, 10, 509–526. [Google Scholar] [CrossRef] [Green Version]
  54. Li, J.; Yu, Z.; Haghighat, F.; Zhang, G.Q. Development and Improvement of Occupant Behavior Models towards Realistic Building Performance Simulation: A Review. Sustain. Cities Soc. 2019, 101685. [Google Scholar] [CrossRef]
  55. Yu, Z.; Haghighat, F.; Fung, B.C.M.; Yoshino, H. A Decision Tree Method for Building Energy Demand Modeling. Energy Build. 2010, 42, 1637–1646. [Google Scholar] [CrossRef] [Green Version]
  56. Yu, Z.; Haghighat, F.; Fung, B.C.M.; Morofsky, E.; Yoshino, H. A Methodology for Identifying and Improving Occupant Behavior in Residential Buildings. Energy 2011, 36, 6596–6608. [Google Scholar] [CrossRef] [Green Version]
  57. Yu, Z.; Haghighat, F.; Fung, B.C.M. Advances and Challenges in Building Engineering and Data Mining Applications for Energy-Efficient Communities. Sustain. Cities Soc. 2016, 25, 33–38. [Google Scholar] [CrossRef] [Green Version]
  58. Carlucci, S.; Simone, M.D.; Firth, S.K.; Kjærgaard, B.K.; Markovic, R.; Rahaman, M.S.; Annaqeeb, M.K.; Biandrate, S.; Das, A.; Dziedzic, J.W.; et al. Modeling Occupant Behavior in Buildings. Build. Environ. 2020, 174, 106768. [Google Scholar] [CrossRef]
  59. Dai, X.; Liu, D.; Zhang, X. A Review of Studies Applying Machine Learning Models to Predict Occupancy and Window-Opening Behaviours in Smart Buildings. Energy Build. 2020, 223, 110159. [Google Scholar] [CrossRef]
  60. Day, J.K.; McIlvennie, C.; Brackley, C.; Tarantini, M.; Piselli, C.; Hahn, J.; O’Brien, W.; Rajus, V.S.; De Simone, M.; Kjærgaard, M.B.; et al. A Review of Select Human-Building Interfaces and Their Relationship to Human Behavior, Energy Use and Occupant Comfort. Build. Environ. 2020, 178, 106920. [Google Scholar] [CrossRef]
  61. Du, J.; Pan, W.; Yu, C. In-Situ Monitoring of Occupant Behavior in Residential Buildings: A Timely Review. Energy Build. 2020, 212, 109811. [Google Scholar] [CrossRef]
  62. Arethusa, M.T.; Kubota, T.; Nugroho, A.M.; Antaryama, I.G.N.; Ekasiwi, S.N.N.; Uno, T. A Field Survey of Window-Opening Behavior and Thermal Conditions in Apartments of Surabaya, Indonesia. Intercult. Underst. 2014, 4, 17–25. [Google Scholar]
  63. Uno, T.; Hokoi, S.; Ekasiwi, S.N.N. Survey on Thermal Environment in Residences in Surabaya, Indonesia: Use of Air Conditioner. J. Asian Archit. Build. Eng. 2003, 2, 15–21. [Google Scholar] [CrossRef]
  64. Ekasiwi, S.N.N.; Majid, N.H.A.; Hokoi, S.; Oka, D.; Takagi, N.; Uno, T. Field Survey of Air Conditioners Temperature Settings in Hot, Humid Climates, Part 1: Questionnaire Results on Use of Air Conditioners in Houses during Sleep. J. Asian Archit. Build. Eng. 2013, 12, 141–148. [Google Scholar] [CrossRef] [Green Version]
  65. Yun, G.Y.; Steemers, K. Behavioural, Physical and Socio-Economic Factors in Household Cooling Energy Consumption. Appl. Energy 2011, 88, 2191–2200. [Google Scholar] [CrossRef]
  66. Johnson, T.; Long, T. Determining the Frequency of Open Windows in Residences: A Pilot Study in Durham, North Carolina during Varying Temperature Conditions. J. Expo. Anal. Environ. Epidemiol. 2005, 15, 329–349. [Google Scholar] [CrossRef]
Figure 1. Climatic conditions in survey cities.
Sustainability 12 10650 g001
Figure 2. Exterior views and unit floor plans.
Sustainability 12 10650 g002
Figure 3. Daily patterns of window-opening for each sub-group.
Sustainability 12 10650 g003
Figure 4. Daily patterns of AC usage for each sub-group.
Sustainability 12 10650 g004
Figure 5. Daily patterns of fan usage for each sub-group.
Sustainability 12 10650 g005
Figure 6. Daily patterns of AC use, window-opening and fan use for each sub-group.
Sustainability 12 10650 g006
Figure 7. Reasons for not opening windows.
Sustainability 12 10650 g007
Figure 8. Reasons for closing windows.
Sustainability 12 10650 g008
Figure 9. Daily patterns of AC usage for each sub-group.
Sustainability 12 10650 g009
Figure 10. Location and number of ACs.
Sustainability 12 10650 g010
Table 1. Brief profile of respondents.
TotalSurvey 1Survey 2Survey 3Survey 4Survey 5
Sample size1570356303347265299
Survey city-Johor BahruJohor BahruSurabayaSurabayaBandung
Mean daily air temp. (°C)-27.927.927.727.723.7
Mean daily relative humidity (%)-82.282.276.576.575.2
Survey period-Sep.–Oct. 2004Apr.–Jun. 2006Sep.–Oct. 2013Sep.–Oct. 2016Sep. 2014
Household attributes
Average household size3.85.44.63.43.61.9
Average age of respondent41.845.040.739.741.6N/A
Age of respondent (%)
≤3022.68.313.822.018.351.2
31–4031.424.237.734.628.832.4
41–5029.741.637.725.231.312.0
51–6011.619.89.311.314.22.7
≥604.76.21.46.97.51.7
Median household income ratio 18.59.48.87.67.98.3–9.0
Building attributes
Housing type; (a) apartment842023830926530
Housing type; (b) apartment372065380269
Housing type; (c) terraced house3563560000
Floor number-N/A4.63.53.3N/A
Unit floor size (m2)-N/AN/A19.525.531.8
Ownership
AC ownership (%)29.661.035.310.70.0 234.8
AC in bedroom (%)24.358.432.03.40.0 219.7
AC in living room (%)12.616.611.20.60.0 233.4
AC quantity (unit)0.61.40.70.10.0 20.5
Fan ownership (%)91.597.792.485.689.8N/A
Duration
Window-opening (h)12.311.713.714.218.93.8
AC usage (h)2.24.62.61.20.0 21.9
1 Converted by the exchange rate (Source: The World Bank, Indicators). 2 This survey (Surabaya in 2016) was conducted only for low-cost apartments, in which AC was not used.
Table 2. Profiles of groups classified by window-opening patterns.
ClimateGroupnShare (%)Window-Opening (h)
Hot-humidAll-day29923.523.2
Daytime and evening43334.114.5
Daytime32125.311.5
Never21817.26.1
Total1271100.015.4
Relatively coolSunrise and sunset11941.64.8
Sunrise 19131.82.9
Sunrise 27626.61.9
Total286100.03.4
Table 3. Adjusted 1 odds ratios 2 with 95% confidence intervals of surveyed variables for the classified window-opening patterns.
Surveyed VariablesClassified Window-Opening Patterns
NeverDaytimeDaytime and EveningAll-Day
Household attributes
Household size0.75 (0.67–0.84) ***1.13 (1.04–1.22) **1.12 (1.04–1.21) **0.89 (0.81–0.98) *
Age of respondent0.98 (0.96–1.00) **1.03 (1.01–1.04) ***0.99 (0.98–1.00) *1.01 (0.99–1.02)
Household income ratio1.70 (1.41–2.05) ***1.21 (1.05–1.41) *0.94 (0.83–1.08)0.61 (0.52–0.71) ***
Electricity bills ratio1.00 (0.74–1.34)1.23 (0.95–1.59)1.09 (0.86–1.37)0.69 (0.52–0.92) *
Household income divided by electricity bills1.17 (0.08–16.24)6.34 (0.67–59.73)1.94 (0.27–14.14)0.05 (0.00–0.47) **
Building attributes
Housing type1.07 (0.85–1.34)1.63 (1.35–1.97) ***0.96 (0.81–1.15)0.47 (0.36–0.60) ***
Age of building0.91 (0.63–1.33)0.76 (0.55–1.06)1.09 (0.83–1.42)1.13 (0.85–1.50)
Floor level0.94 (0.83–1.08)0.86 (0.76–0.98) *1.03 (0.93–1.14)1.12 (1.00–1.24) *
Unit size0.97 (0.92–1.02)0.96 (0.92–1.00)0.98 (0.95–1.02)1.05 (1.01–1.08) **
Ownership
AC ownership1.45 (0.96–2.18)1.45 (1.03–2.04) *0.99 (0.72–1.37)0.40 (0.26–0.63) ***
AC in bedroom1.41 (0.92–2.17)1.43 (1.01–2.03) *0.93 (0.66–1.30)0.45 (0.29–0.72) **
AC in living room1.15 (0.63–2.08)1.23 (0.75–2.02)1.03 (0.63–1.68)0.45 (0.50–1.01)
AC quantity1.13 (0.97–1.32)1.09 (0.96–1.24)0.96 (0.84–1.09)0.74 (0.60–0.91) **
Fan ownership0.67 (0.37–1.20)2.11 (1.03–4.34) *1.16 (0.69–1.93)0.76 (0.45–1.28)
Duration
AC usage1.07 (1.03–1.12) **1.03 (1.00–1.07)0.98 (0.94–1.01)0.89 (0.84–0.94) ***
Fan usage0.98 (0.96–1.01)1.02 (0.99–1.04)0.99 (0.98–1.01)1.00 (0.98–1.02)
Stay in house0.91 (0.88–0.94) ***1.02 (0.99–1.04)1.02 (0.99–1.05)1.03 (1.00–1.07) *
Sensations 3
Thermal (daytime)1.01 (0.86–1.18)0.94 (0.82–1.08)1.03 (0.92–1.15)1.01 (0.91–1.12)
Thermal (night-time)1.00 (0.85–1.16)0.98 (0.85–1.13)1.08 (0.96–1.21)0.95 (0.85–1.06)
Wind flow (daytime)0.87 (0.74–1.03)0.99 (0.86–1.14)0.94 (0.83–1.07)1.30 (1.09–1.54) *
General comfort (daytime)1.05 (0.87–1.27)0.82 (0.70–0.95) *1.08 (0.93–1.25)1.13 (0.94–1.37)
Reasons for not opening windows
Insects0.61 (0.4–0.88) **2.09 (1.57–2.77) ***0.91 (0.71–1.18)0.72 (0.54–0.97) *
Security0.92 (0.63–1.33)0.93 (0.68–1.27)0.78 (0.59–1.03)1.53 (1.13–2.06) **
Rain0.64 (0.41–0.97) *0.96 (0.68–1.34)1.72 (1.27–2.61) ***0.69 (0.47–1.01)
Privacy0.82 (0.54–1.26)0.56 (0.39–0.83) **1.26 (0.93–1.70)1.32 (0.96–1.81)
Dust1.33 (0.89–2.01)0.93 (0.63–1.35)0.91 (0.65–1.27)0.99 (0.67–1.45)
AC2.21 (1.23–3.99) **0.69 (0.37–1.30)0.84 (0.47–1.48)0.62 (0.27–1.41)
Noise0.91 (0.42–1.96)0.85 (0.42–1.73)1.03 (0.59–1.80)1.11 (0.63–1.96)
1 Adjusted for household size, age of respondent and household income ratio; 2 significance levels are ***: p < 0.001, **: p < 0.01, *: p < 0.05; 3 sensations in the living room.
Table 4. Profiles of groups classified by AC usage.
ClimateGroupnShare (%)AC Usage (h)AC Ownership (%)
Hot-humidNight-time13711.57.5100.0
Evening and night-time816.87.5100.0
Never96681.60.25.8
Total1184100.01.523.1
Relatively coolAfternoon165.46.3100.0
Evening3712.55.9100.0
Early evening4715.94.7100.0
Never19566.10.00.0
Total295100.01.833.9
Table 5. Profiles of sub-groups classified by fan usage.
ClimateGroupnShare (%)Fan Usage (h)Fan Ownership (%)
Hot-humidAll-day29323.123.298.0
Afternoon and night-time30023.614.296.3
Evening and night-time28322.311.796.8
Daytime and evening20616.213.899.5
Never18914.92.956.1
Total1271100.014.091.3
Relatively coolNever272100.00.15.9
Total272100.00.15.9
Table 6. Profiles of groups classified by AC usage, window-opening and fan usage.
ClimateGroupnShare (%)AC Usage (h)AC Ownership (%)Window-Opening (h)Fan Usage (h)Fan Ownership (%)
Hot-humidA114912.28.3100.011.711.884.6
A2766.28.2100.010.711.789.5
A322918.70.11.722.712.794.3
A460449.30.38.814.214.393.4
A516813.81.220.26.811.987.5
Total1226100.01.825.814.213.291.4
Relatively cool297100.01.935.03.70.413.8
Table 7. Major patterns of occupants’ adaptive behaviour.
AttributesDaytimeNight-Time
Hot-humid cityWith ACsDaytime ventilationAC use
Without ACsDaytime ventilationFan use
Relatively cool cityWith ACsWindow-opening in morning and evening
AC use in the evening
-
Without ACsWindow-opening in morning and evening-
Table 8. Profiles of groups classified by AC usage (only AC owners).
Climate.GroupnShare (%)AC Usage (h)AC Ownership (%)
Hot-humidNight-time 127275.36.5100.0
Night-time 24311.910.9100.0
Afternoon and evening4612.712.5100.0
Total361100.07.8100.0
Publisher’s Note: MDPI stays neutral with regard to jurisdictional claims in published maps and institutional affiliations.