Article

Linear Discriminant Analysis-Based Dynamic Indoor Localization Using Bluetooth Low Energy (BLE)

1
Department of Computer Sciences, National University of Modern Languages-NUML, Islamabad 44000, Pakistan
2
Department of Computer Science, Comsats University, Islamabad 44000, Pakistan
3
Faculty of Computer Science, Canadian Institute for Cybersecurity, University of New Brunswick, Fredericton, NB E3B 5A3, Canada
4
Industrial Engineering Department, College of Engineering, King Saud University, P.O. Box 800, Riyadh 11421, Saudi Arabia
*
Author to whom correspondence should be addressed.
Sustainability 2020, 12(24), 10627; https://doi.org/10.3390/su122410627
Submission received: 2 October 2020 / Revised: 26 November 2020 / Accepted: 27 November 2020 / Published: 19 December 2020
(This article belongs to the Special Issue Role of AI, Big Data, and Blockchain in IoT Devices)

Abstract

:
Due to recent advances in wireless gadgets and mobile computing, the location-based services have attracted the attention of computing and telecommunication industries to launch location-based fast and accurate localization systems for tracking, monitoring and navigation. Traditional lateration-based techniques have limitations, such as localization error, and modeling of distance estimates from received signals. Fingerprinting based tracking solutions are also environment dependent. On the other side, machine learning-based techniques are currently attracting industries for developing tracking applications. In this paper we have modeled a machine learning method known as Linear Discriminant Analysis (LDA) for real time dynamic object localization. The experimental results are based on real time trajectories, which validated the effectiveness of our proposed system in terms of accuracy compared to naive Bayes, k-nearest neighbors, a support vector machine and a decision tree.

1. Introduction

Due to the latest advancements in wireless technology, demands for location-based mobile applications, and hardware solutions for tracking and localization have increased. However, for indoor environments, the use of satellite based solutions such as global positioning systems (GPS) is not feasible, because satellite signals are unable to penetrate into buildings, walls, etc. [1,2]. GPS is a standard navigation system designed for outdoor navigation purposes. For indoor environments, there is no standard solution so far to compete with the GPS standard. Therefore, researchers have gradually changed their focus to indoor solutions. For indoor environments, a variety of sensing technologies have been used for localization. These technologies are wireless local area networks (WLAN), Bluetooth, radio frequency identification (RFID), infrared, ultrasound, etc. [3]. Among the available wireless technologies, Bluetooth Low Energy (BLE) is considered as an ideal technology in terms of cost, energy consumption, range and deployment [4]. The word localization generally refers to the actual location identification of an object with reference to some coordinate system or known landmark. Moreover, the localization can be static as well as dynamic. Here, the word static localization means that the target object is stationary, while dynamic or mobile object localization means that the object is moving with a dynamic speed inside an indoor environment. The movement of the target object can be slow, fast and in any direction. The scope of this article is limited to dynamic object localization.
Dynamic localization techniques are broadly classified into received signal strength indicator (RSSI) or distance-based and fingerprinting-based localization techniques. In RSSI or distance-based localization techniques, the signal strength methods acquire RSSI values of the anchor nodes for estimating the distance. The distance estimation is then used in trilateration, MinMax or least square based position estimation techniques to compute the actual location of the user. Various methods, such as particle filters, Kalman filters and extended Kalman filters have been used for object localization using RSSI distance modeling. These techniques require radio propagation modeling to obtain distance estimates from RSSI, which is a challenging task. On the other hand, fingerprinting-based localization techniques do not require modeling of RSSI and radio models for distance estimation. The fingerprinting-based position estimation techniques consist of two steps. In the first step, a radio map is generated using fixed anchor nodes, consisting of RSSI patterns for each grid location. This step is an offline phase of the fingerprinting technique, in which a radio map is developed which consists of RSSI samples from each anchor node. The disadvantage of the fingerprinting-based localization technique is its tedious and time consuming offline phase, which totally depends on the existing physical infrastructure. Any small change in the indoor setup ultimately influences the offline radio map. In the second step, machine learning based algorithm such as k-nearest neighbors (KNN) can be used to match the scanned RSSI patterns with the offline database for location estimation. Beside traditional localization techniques, researchers have also used machine learning based techniques for tracking and navigation purpose as well. In [5], the researchers used two concepts to locate the presence of a user in a room; in the first concept, a metric map of the environment was used to track the movements of people by using device-free-based localization techniques. In the second concept, a supervised machine learning-based technique was used, i.e., principal component analysis (PCA), along with KNN, to find out the presence of people in a room with an accuracy of 99%.
There are also some hybrid solutions that combine distance-based localization techniques with the fingerprinting techniques to improve the position estimation accuracy [6,7]. These methods may improve localization accuracy at one location, but due to fluctuations in transmission power, especially in the case of Bluetooth, accurate position estimation is still a challenging task [8]. In order to address this problem, we propose a method based on linear discriminant analysis (LDA) for the tracking and position estimation of a dynamic object in an indoor environment using the Bluetooth Low Energy modules. LDA has rarely been used for the position estimation problem, and its performance for localization is still undiscovered. To evaluate its performance, we performed real time experiments and compared its performance with other machine learning techniques.
The main contributions of this article are as follows.
  •  Modeling of LDA to predict a user’s current location dynamically based on RSSI patterns in real time indoor environment.
  •  Comparative analysis of LDA with other machine learning techniques, such as naive Bayes, KNN, SVM and the decision tree.
The rest of the paper is structured as follows: Section 2 briefly discusses literature review on existing machine learning localization techniques. Section 3 presents the proposed LDA based system. Section 4 presents the experimental setup and results, and finally, the paper is concluded in Section 5.

2. Literature Review

Object localization techniques can be classified into two broad categories based on distance and position estimation process, i.e., RSSI or distance-based and fingerprinting-based localization techniques. In RSSI-based position estimation techniques, the RSSI patterns are obtained from each fixed anchor node with the help of radio propagation modeling. These patterns are then converted in to distance estimates. In the fingerprinting-based approaches, a radio map is generated and then a pattern-matching algorithm is used to match the RSSI patterns with already-stored RSSI patterns in the training set or database. These two types of traditional localization techniques have some limitations [9]. Their localization accuracy depend on environmental factors and the modeling of RSSI for distance estimation, which is a challenging task. On the other hand, the machine learning-based solutions provide more scalable and cost effective solutions. The scope of this article is limited to the machine learning-based position estimation techniques due to their promising results and applications in the fields of object tracking and localization [4,10]. The following subsection reviews the existing well-known machine learning-based position estimation techniques.

2.1. K-Nearest Neighbor (KNN)

KNN is the most simple and typical machine learning approach and has been extensively used for indoor localization problems based on fingerprinting techniques. For localization systems or indoor positioning applications, which are based on fingerprinting, KNN provides a solution which is highly accurate and computationally less expensive. KNN works in a manner that whenever a static or movable node enters the target region, RSSI patterns of that node are measured. These patterns are compared with other RSSI patterns already stored in a database. Let K denotes the number of nodes to be calculated based on nearest RSSI patterns in the database to the target node. For example, if the value of K is 3, then three nearest neighbors of the target node are identified. Euclidean distance formula is used for comparing the RSSI patterns. KNN is the most popular localization technique used in fingerprinting [11].

2.2. Support Vector Machine (SVM)

SVM is also extensively used in the position and distance estimation problems. Because of its characteristics, it is a popular classification algorithm and has been widely used in image processing, medical disease analysis, audio signal matching and classification, geo-localization etc. Along with these variety of application domains, SVM is also applicable for different localization systems or indoor positioning and localization applications [12]. Compared to KNN, its execution time and complexity is more.

2.3. Decision Tree

Decision Tree is another machine learning algorithm. It is based on hierarchical method. In decision tree, parent nodes, i.e. inner nodes or non-terminal nodes are referred as decision nodes. Whereas, non-parent, terminal or outer nodes denotes classes or features or attributes etc. Basically, in order to estimate the position of any object, decision tree can be an effective and usable approach. Similarly, for indoor positioning or localization systems, decision tree can be used in fingerprinting online phase which is also known as position estimation localization phase, where RSSI patterns of target nodes are compared with stored RSSI patterns of anchor nodes in the database [4,12].

2.4. Naive Bayes

Naive Bayes is yet another popular and simple machine learning algorithm which is fundamentally based on the Bayesian theorem. In case of categorical input data, naive Bayes algorithm is preferable and suitable choice. Naive Bayes can be used in various applications of localization and classification problems. In case of distance and position estimation, it is trained on RSSI samples. In real time localization, the advantage of using naive Bayes approach is simple and fast classification [13].

2.5. Linear Discriminant Analysis (LDA)

LDA is a machine learning approach which is based on finding linear combination between features to classify test samples in distinct classes. Recently, this approach was used for indoor positioning or localization systems in order to obtain superior and higher accuracy. The performance of LDA increases when the data is constructed using independent variables with large data patterns. Although for linear features, this technique is preferable and suitable. But in case of nonlinear pattern of data, it is still undiscovered, whether it performs accurately or not because to the best of our knowledge, the performance of LDA on nonlinear data patterns is yet to be discovered especially in case of position and distance estimations [14].
The next section presents recently developed indoor localization systems based on machine learning approaches only.

2.6. Related Work

In [11], the researchers developed a fingerprinting-based indoor positioning system known as RADAR. Its accuracy is 2 to 3 m in indoor environment. In [15,16], the researchers extended the RADAR system and introduced a probabilistic model based on clustering approach for the indoor setup. The reported accuracy is 2.1 m. In [17], the authors designed a grid based localization technique for a limited indoor environment. As per their experimental results, their reported accuracy was less than 2 m in small scale. In [18], an artificial neural network based localization system have been proposed which consist of particle swam optimization and a gray wold algorithm in order to optimize the training process in neural network with better localization. Similarly in [19], decision tree based localization technique is proposed with 2.1 m position estimation error. They also minimized the computational complexity but on the other-hand, frequent extraction of RSSI measurements by every sensor during its training phase was required. Moreover in [12,20] different machine learning based position estimation techniques have been proposed using Wireless Local Area Networks (WLAN). It is shown that SVM performance in terms of position estimation accuracy is better than other statistical methods. In [21,22], the researchers claim an increase in the localization accuracy by dividing the actual space of the mobile node based on signal features. For each region with respect to RSSI features set, a separate SVM model was trained. This procedure was adopted to minimize the variation in measured RSSI. However this practice is still debatable whether dividing a large region into smaller clusters can minimize variations in measured RSSI. KNN approach based on spearman distance formulation is used to minimize the distance estimation error and to improve position estimation accuracy in [23]. They performed different experiments and concluded with 2.7 m position estimation error. Machine learning based techniques for position estimation have been used in [24], KNN and SVM have been found better compared to others. Recent studies have also explored the deep learning methods for real time position estimation but still more research work is required to investigate its practical implementation in small and large scale infrastructures.

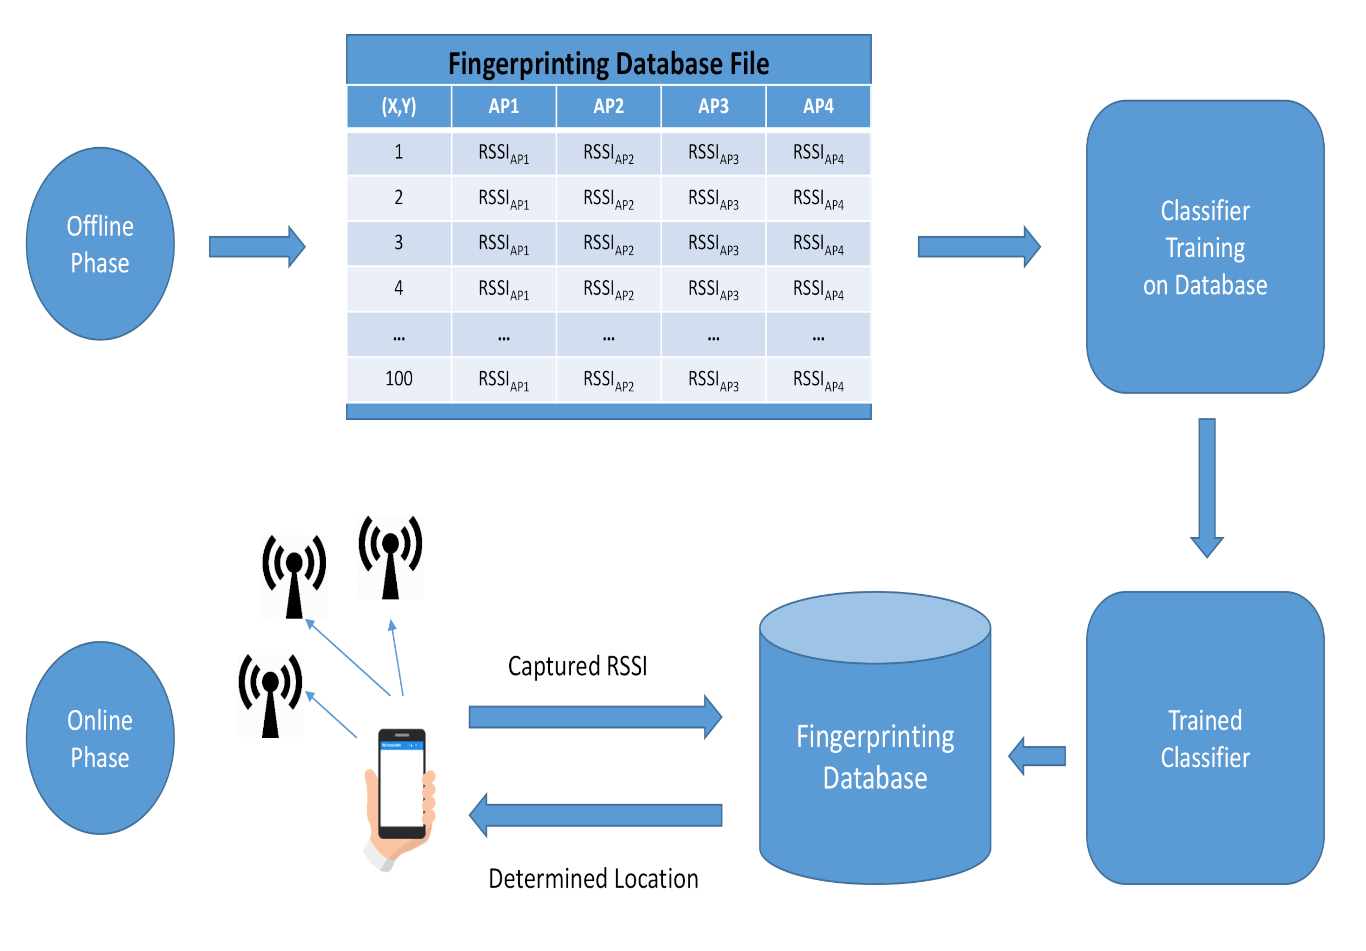
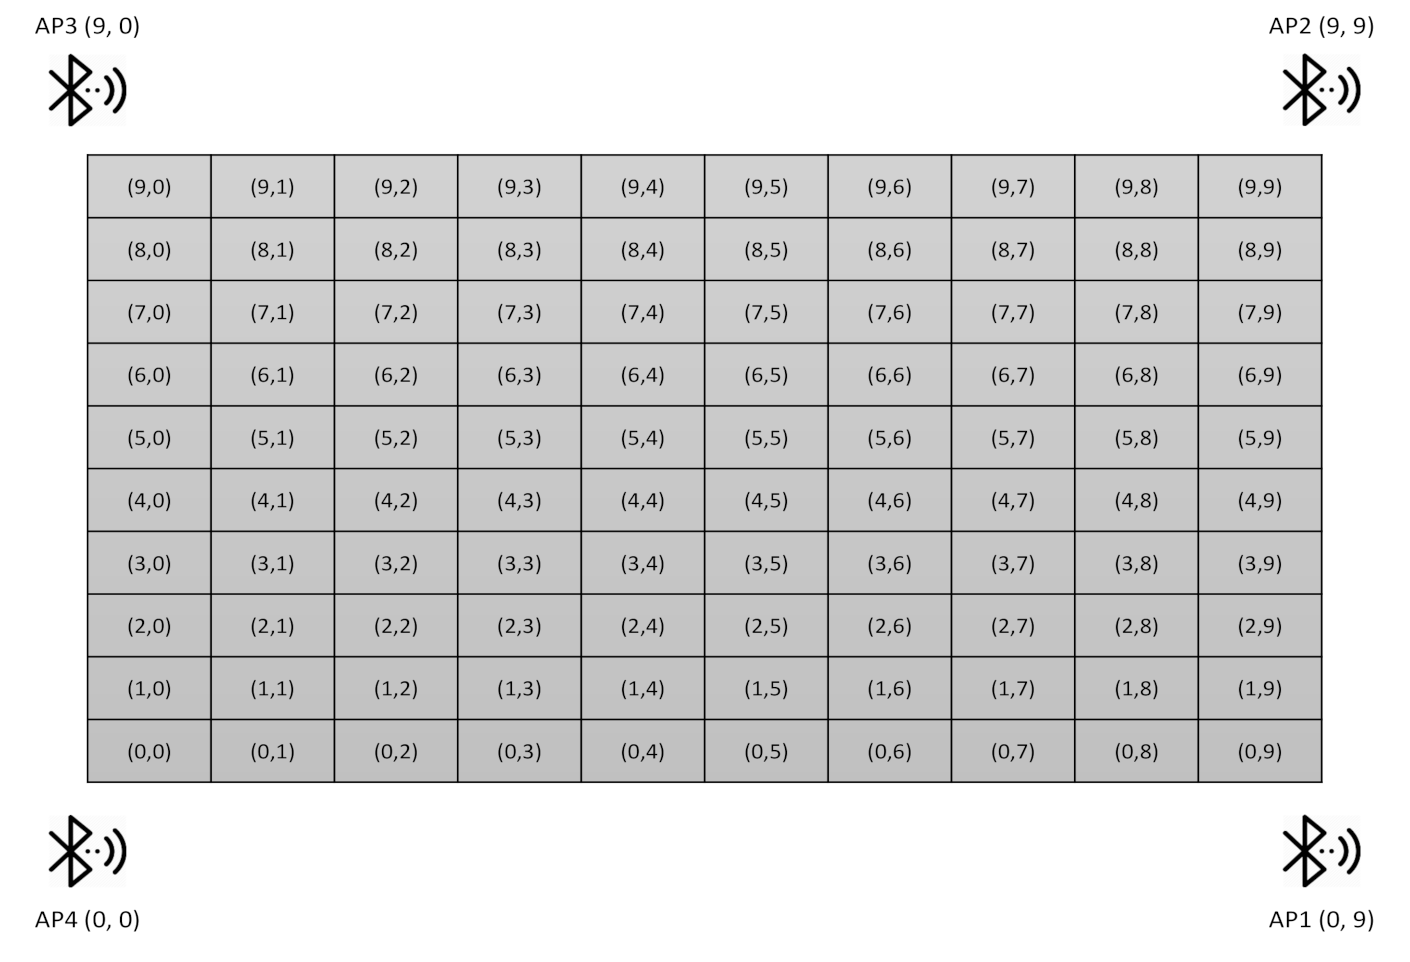
3. Proposed System Model

Our proposed system model is motivated from fingerprinting-based localization system using machine learning approach. The proposed system model consists of two steps. In the first step, a fingerprinting database is constructed, using real time experimental observations in grid like scenario for training LDA as well as other classifiers such as naive Bayes, KNN, SVM and Decision Tree.
The architecture of the proposed LDA model is shown in Figure 1, which consist of real time experimental setup, training and testing of classifiers, for real time localization. We used four Bluetooth enabled smart phones as access points and one Bluetooth enabled smart phone for RSSI measurements. Ten RSSI measurements were observed for each location. These measurements have been used for the training of classifiers. Simulated 1000 RSSI measurements were recorded based on standard deviation of actual 10 measurements observed at each grid location. The recorded RSSI patterns were divided in two parts: 90% of the data was used for training and 10% for testing. The flow chart of the proposed system design is shown in Figure 2.
In the second step, the testing of the proposed method is carried out. For this purpose, real-time experiments were conducted in typical indoor setup inside a computer lab. The size of the lab used is 10 × 10 square meter as depicted in Figure 3. We used five Bluetooth version 4.0 enabled smart phones as access Points (AP) and also as a target node. The experimental setup is motivated from literature studies and based on fingerprinting approach, in which an offline database is developed as shown in Figure 3. To evaluate the performance in real time for dynamic localization, we collected measurements of five different trajectories, which resembles human movement with approximately 1 m/s as depicted in Figure 4. We considered five different trajectories: simple, straight, zig zag, forward, back, and long as well for the validation purposes.

Position Estimation Using Linear Discriminant Analysis

LDA is extensively used as a supervised machine learning technique to find a linear characterization between features to discriminate between two or more object classes. LDA is different from Principal Component Analysis (PCA) and tries to find projections to best discriminate between object classes [25].
Modeling of LDA for real time position estimation problem is implemented as a classification problem, where the access point values are considered as features and location coordinates where they are measured as object classes. For that purpose each location coordinate is assigned a distinct class label to discriminate it from other location coordinates. In our case there are C = 10 × 10 = 100 classes (or class labels). For each class there are N measurements denoted as Y = { y 1 , y 2 , y 3 , . , y N } . Each measurement is m-dimensional, m in our case represents number of access points and contains the RSSI values of these access points for the object class. We denote object classes as C k and k = 1 , 2 , 3 , , C . Let Y k be a matrix that contains all the measurements related to class C k i.e., Y 1 belongs to C 1 and Y 2 belong to C 2 class and so on. We obtain z by projecting the samples y onto a line z = ω T Y where
Y = Y 1 . . . Y C a n d w = ω 1 . . . ω m
where ω represents projection vectors to project Y on z.
To find a good differentiation between the classes, the mean vector of each class in Y and z is computed as:
μ k = 1 N k y C k y
μ ˜ k = 1 N k y C k ω T y
= ω T μ k
Then the distance among projected means is determined as an objective function J ( ω ) . Let μ 1 and μ 2 are means of classes C 1 and C 2 .
J ( ω ) = | ω T ( μ 1 μ 2 ) |
The variability within-class is also known as scatter. For every class, we compute variance as scatter and sum of square differences among the projected samples and their class mean.
s ˜ k 2 = z C k ( z μ ˜ k ) 2
where s ˜ k 2 measures the within-class variability after projecting it on the z-space. Thus s ˜ 1 2 + s ˜ 2 2 measures after projection variability within the two classes, therefore it is known as within-class scatter of the projected samples. Then criterion function can be maximized by making LDA as a linear function w T x as:
J ( w ) = | μ ˜ 1 μ ˜ 2 | 2 s ˜ 1 2 + s ˜ 2 2
To determine the optimum projection w * , J ( w ) is explicitly expressed in term of w. For that purpose scatter matrices are used to express the scatter in multivariate feature space y as:
S k = y C k ( y μ k ) ( y μ k ) T
S w = S 1 + S 2
where S k denotes the class C k covariance matrix, and within-class scatter matrix is denoted by S w . Now, the scatter of the projection z is computed as:
S ˜ k 2 = z C k ( z μ ˜ k ) 2
= ω T S k ω
s ˜ 1 2 + s ˜ 2 2 = ω T S 1 ω + ω T S 2 ω
= S ˜ W
where S ˜ W represents within-class scatter matrix of the projected samples z. Similarly, the difference among the projected means can be expressed as:
( μ ˜ 1 μ ˜ 2 ) 2 = ( ω T μ 1 w T μ 2 ) 2
= S ˜ B
The matrix S B is called the between-class scatter of the original samples/feature vectors, while S ˜ B is the between-class scatter of the projected samples y. Since S B is the outer product of two vectors, its rank is at most one. We can finally express the Fisher criterion in terms of S W and S B as:
J ( w ) = | μ ˜ 1 μ ˜ 2 | 2 s ˜ 1 2 + s ˜ 2 2
= ω T S B ω ω T S W ω
Hence J ( w ) is a measure of the difference between class means (encoded in the between-class scatter matrix) normalized by a measure of the within-class scatter Matrix. To find the maximum of J ( ω ) , we differentiate J ( ω ) w.r.t ω and equate it to zero to get ω * :
ω * = argmax ω J ( ω ) = argmax ω ( ω T S B ω ω T S W ω ) = S W 1 ( μ 1 μ 2 )

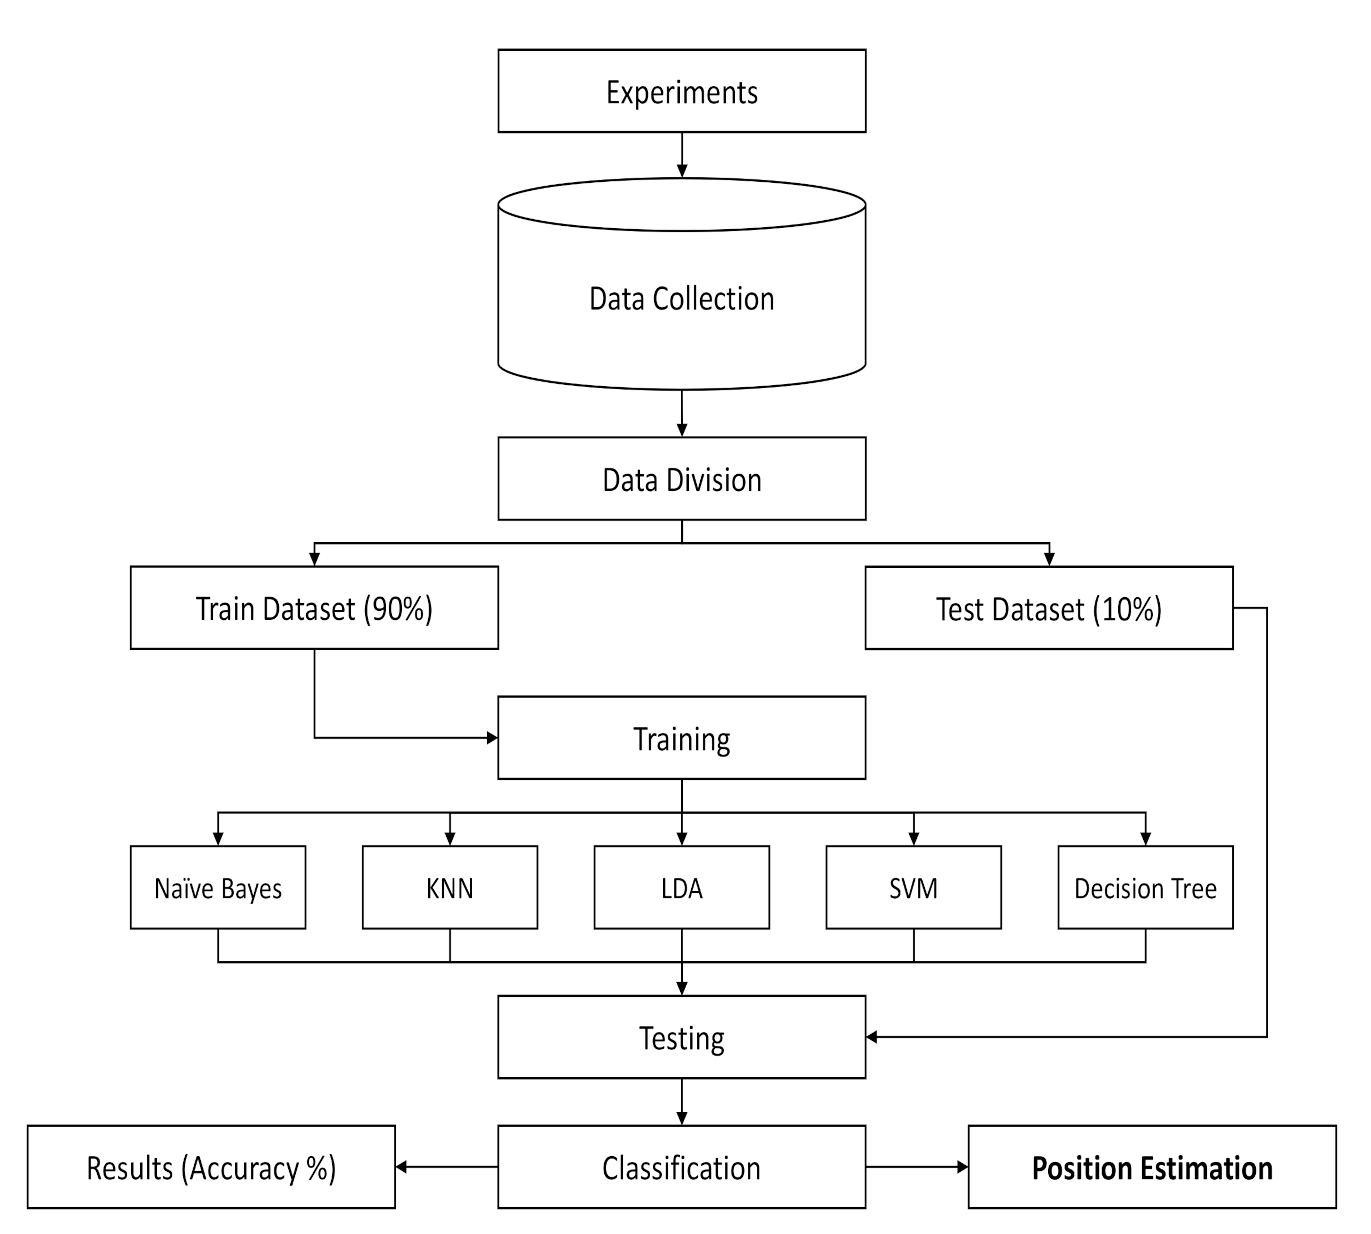
4. Performance Evaluation
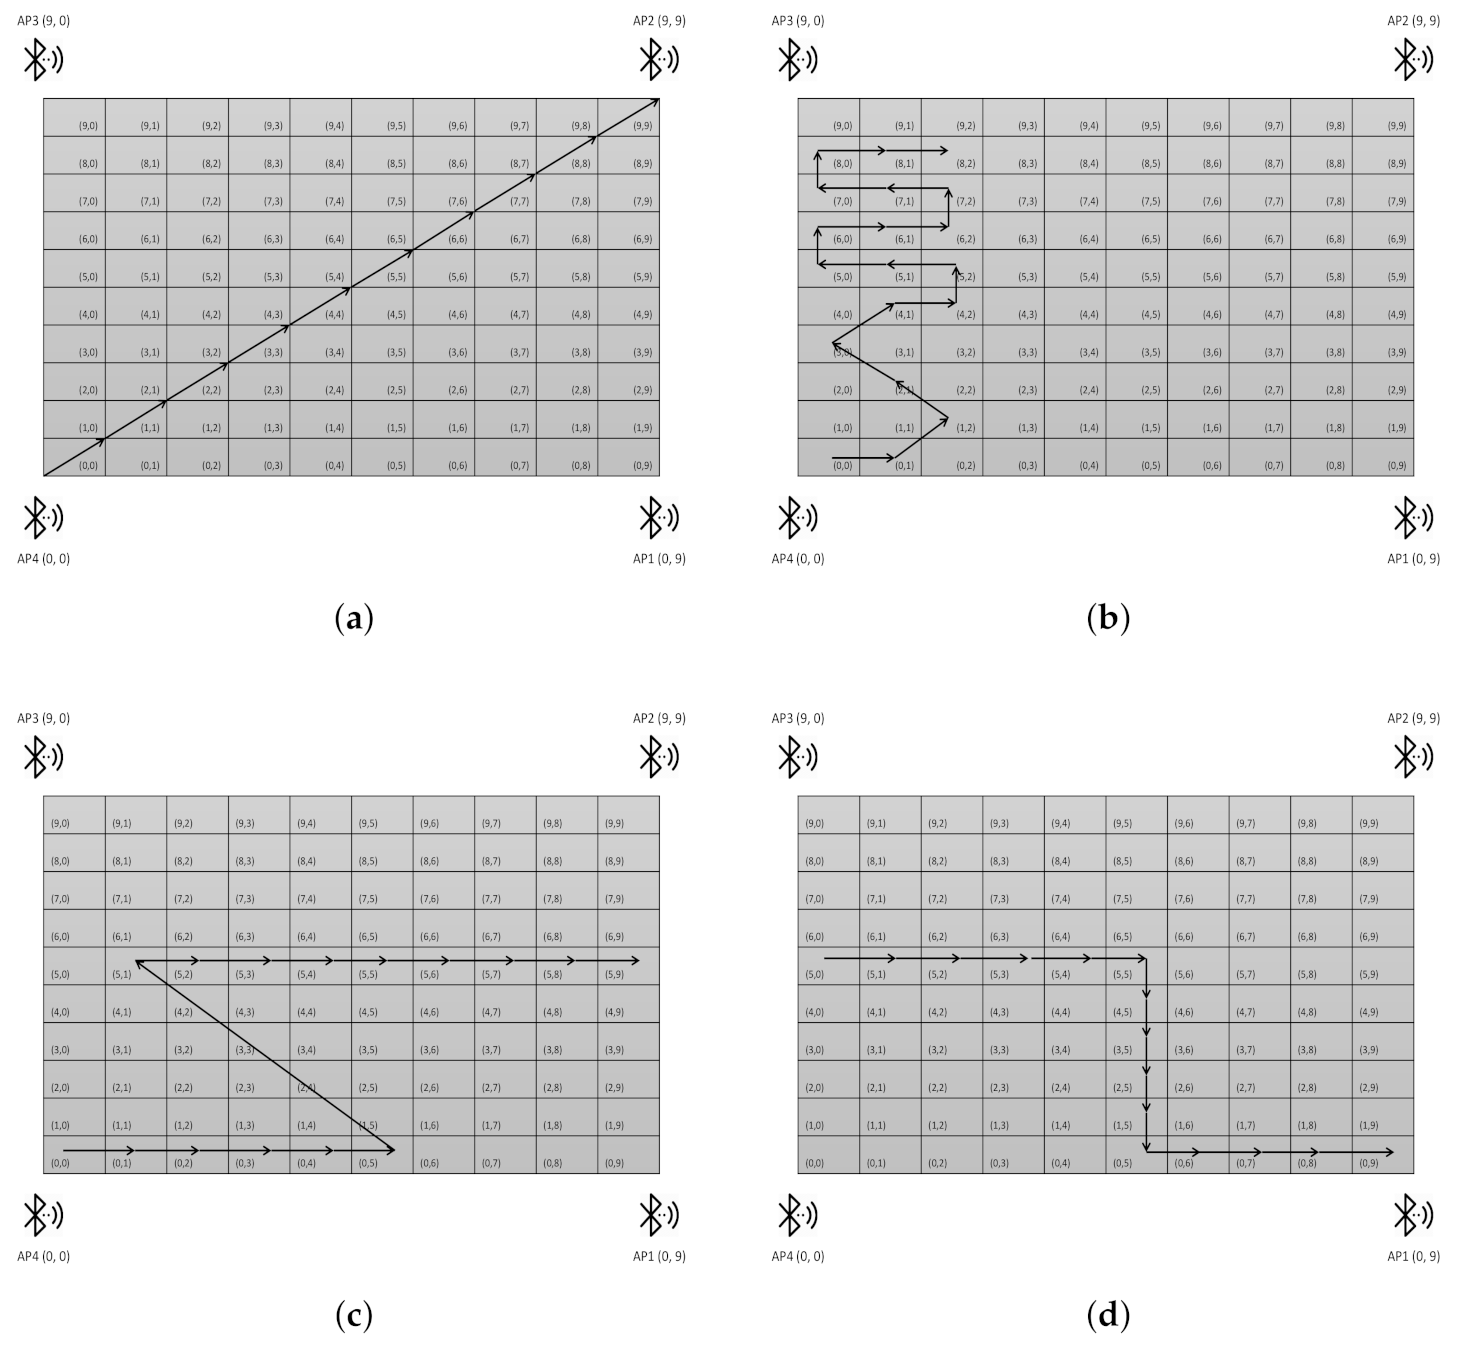
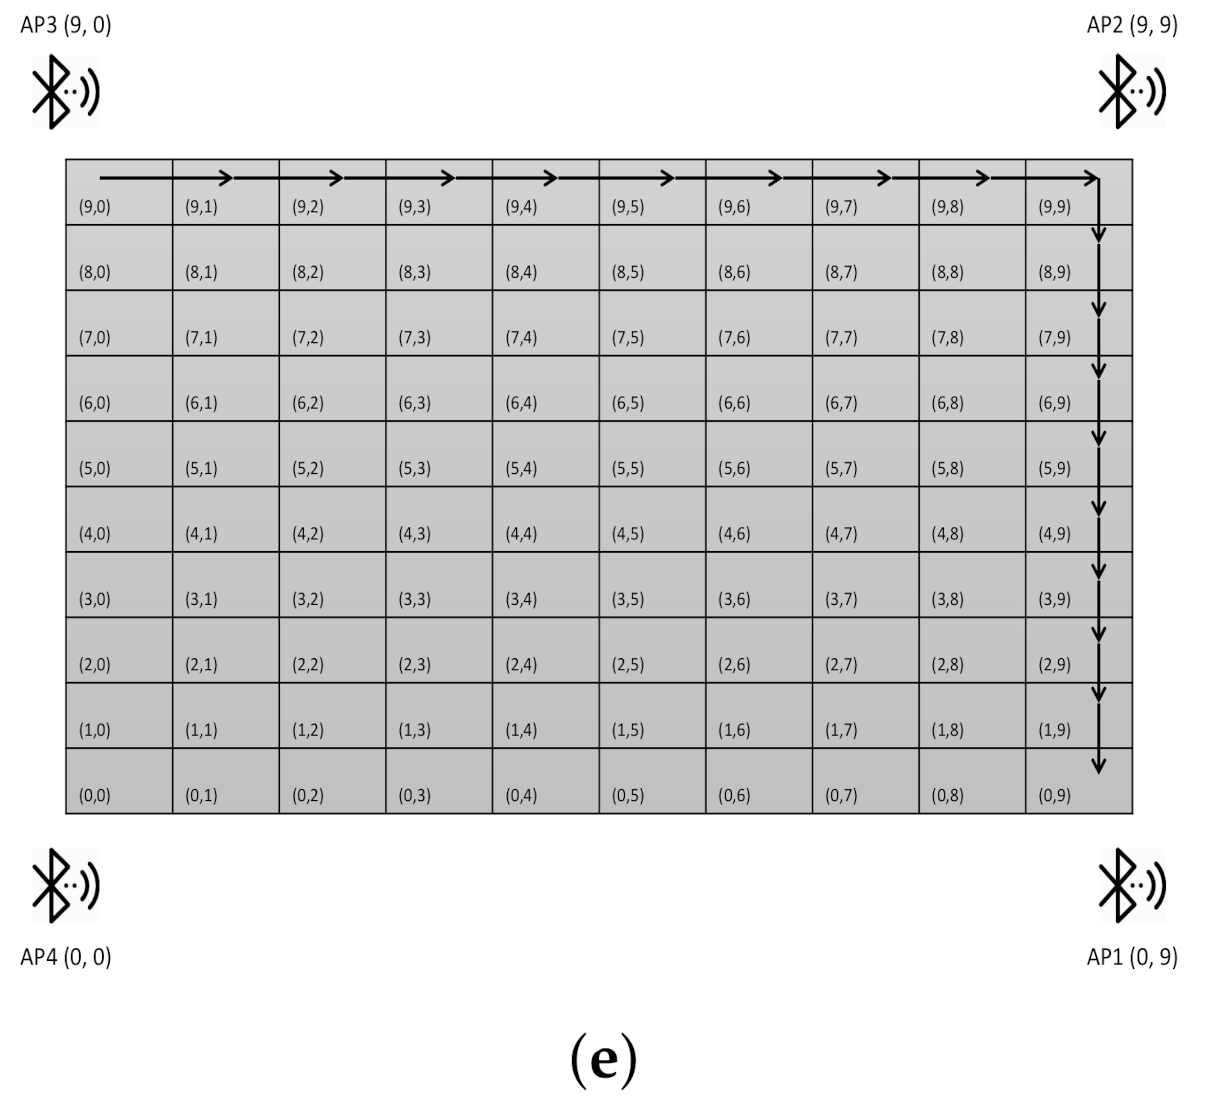
To evaluate the performance of our proposed LDA based real-time position estimation technique in real time scenarios, we have collected RSSI measurements of five different trajectories depicted in Figure 4, which resembles real time object movement inside indoor environment for testing and performance evaluation. The performance metrics used in this study are accuracy, complexity, precision, cost, scalability and robustness. Motivated from relevant studies we used three standard parameters i.e., accuracy, standard deviation and time on execution.

4.1. Trajectories

Here the word trajectories refers to the actual real time movement of the user with Bluetooth enabled smart phone. Figure 4 depicts sample trajectories.

4.2. Testing

To validate the performance of LDA in real time position estimation, the real time location estimation is carried out using five different trajectories as discussed above. LDA is a bit new approach for real time object localization and the researchers used other machine learning techniques i.e., KNN, and SVM. Naive Byees and Decision Tree have also been used but not common as compared to KNN and SVM. Following subsection presents comparative analysis in terms of accuracy.

4.2.1. Comparison of Accuracy between Classifiers

Following Table 1 presents numerical findings of our simulation studies. Mean accuracy of LDA in all the five trajectories is better than naive Bayes, KNN, SVM and Decision Tree.
We have simulated five user movements and collected real time RSSI patterns for testing and validation purposes. Trajectory-1 is a linear movement from one corner of room to another. Due to linear movement, variation in RSSI is less as compared to other patterns, which resulted in a better accuracy. In case of linear movement at constant speed, LDA performance is better than others i.e., 87.1%. Compared to KNN, SVM and decision tree, naive Bayes also produced accurate results i.e., 86.4%. Similarly in case of partial linear movement with constant speed in Trajectory-5, we observed naive Bayes accuracy is almost similar to LDA. The worst performance in terms of accuracy was observed in zig-zag with dynamic user movement in different directions. Experimental results shows that LDA achieves 72.1% accuracy. The main reasons for this optimal performance is the maximum variations in the received signals, frequent direction change and also inconstant speed. On the other hand, if the object is moving slowly with less directional changes, accuracy of all classifiers shows better results compared to the zig-zag movement. Among all classifiers, LDA performance is better in all five trajectories followed by naive Bayes, while as the performance of KNN proved to be the worst in all five trajectories.

4.2.2. Comparison of Execution Time

Execution time is the time taken by each classifier to localize object real-time location. Table 2 depicts analysis of all classifiers based on average execution time. Our observation reveals that KNN estimates object location much faster than other classifiers, The main reason is low complexity computations in KNN method to find the nearest neighbors. In our case we use K = 1 for KNN. But KNN execution time increases exponentially with the increase in the number of training samples. SVM takes least execution time after KNN, the main drawback in SVM is that it is a binary classifier, and it is trained using one-versus-all strategy, which is computationally expensive as compared to other classifiers. SVM identifies support vectors from the training data and then uses only those support vectors to classify the test trajectories, resulting in very low execution time. LDA is on the third number based on execution time. It can be seen that naive Bayes has the highest execution time as it is based on log likelihood to make location estimation decision, which involves computationally expensive operations compared to other classifiers.

4.2.3. Mean Analysis

We have also measured average mean accuracy and standard deviation of all five classifiers as shown in Table 3. Based on our real-time experimental studies on five trajectories, LDA shows supervisor performance by achieving 79.34% accuracy and standard deviation of 4.96 compared to other classifiers. On the other hand, KNN among all classifiers proved to be the worst in terms of real time object localization, but its execution time is less as compared to others.

5. Conclusions

This paper presented a comparative analysis of different machine learning classifiers for real-time object localization and tracking in an indoor environment. The experiments were performed by first collecting RSSI patterns in a dense 10 × 10 indoor environment using Bluetooth enabled smart phones from four access points for training of classifiers. The simulation environment used were of size 10 × 10 square meter. Then RSSI patterns for five different trajectories were collected to test the classifiers. Mean accuracy, execution time and standard deviation were used as performance evaluation metrics. The experimental results show that the proposed LDA based method works best for real-time object localization in terms of mean accuracy compared to all other classifiers; KNN, SVM, Naive Bayes and Decision Tree. The Naive Bayes achieves the second best mean accuracy after LDA. The experimental results show that the execution time of KNN is least for real time object localization compared to all other classifiers. This is due to four dimensional feature vector used in the experiments which contains the RSSI measurement of four access points. With increase in the training data and in the dimensionality of feature vector / access points, the KNN execution time will also increase. This is due to Euclidean distance which KNN uses for classification purposes. SVM achieves the second best execution time as it identifies support vectors during training phase and uses only those support vectors to make object localization decisions. However it is a binary classifier and its training phase is computationally expensive compared to other classifiers. The LDA achieves the third best execution time. The execution time of naive Bayes is highest among all classifiers.

6. Future Work

In future, the performance of LDA for real time object localization can be extended to multi floor and inside a single room for static localization. Also, we aim to extend our work with more experimental results and check its effectiveness with the work of [5]. Besides, the new emerging paradigms such as 5G technology, Fog Computing, Blockchain, etc. [26] can be explored to deploy secure localization in large scale indoor environment.

Author Contributions

Conceptualization: F.S. and S.S.; methodology: S.S. and H.B.; software, S.S.; validation: W.Z.K., S.H. and S.A.; formal analysis, F.S.; investigation, F.S.; resources, A.M.E.-S.; data curation: H.B.; writing—original draft preparation: F.S., and S.S.; writing—review and editing, W.Z.K., S.H., and A.M.E.-S.; visualization: F.S.; supervision: F.S.; project administration: A.M.E.-S.; funding acquisition: A.M.E.-S. All authors have read and agreed to the published version of the manuscript.

Funding

The authors extend their appreciation to King Saud University for funding this work through Researchers supporting project number (RSP-2020/133), King Saud University, Riyadh, Saudi Arabia.

Conflicts of Interest

We have no conflict of interest to declare. Declaration: We are here to declare that, this paper is extracted from Haseeb Bari, MS thesis submitted for partial fulfilment of the requirements of the degree of MSCS at NUML, Islamabad, under the supervision of Fazli Subhan (First Author).

References

  1. Hofmann-Wellenhof, B.; Lichtenegger, H.; Collins, J. Global Positioning System: Theory and Practice; Springer Science & Business Media: Berlin/Heidelberg, Germany, 2012. [Google Scholar]
  2. Misra, P.; Enge, P. Global Positioning System: Signals, Measurements and Performance, 2nd ed.; Ganga-Jamuna Press: Kathmandu, Nepal, 2006; Volume 206. [Google Scholar]
  3. Liu, H.; Darabi, H.; Banerjee, P.; Liu, J. Survey of Wireless Indoor Positioning Techniques and Systems. IEEE Trans. Syst. Man Cybern. Part C 2007, 37, 1067–1080. [Google Scholar] [CrossRef]
  4. Lovón-Melgarejo, J.; Castillo-Cara, M.; Huarcaya-Canal, O.; Orozco-Barbosa, L.; García-Varea, I. Comparative Study of Supervised Learning and Metaheuristic Algorithms for the Development of Bluetooth-Based Indoor Localization Mechanisms. IEEE Access 2019, 7, 26123–26135. [Google Scholar] [CrossRef]
  5. Dijk, T.V. Indoor Localization Using BLE Using Bluetooth Low Energy for Room-Level Localization. Master’s Thesis, Delft University of Technology, Delft, The Netherlands, 2016. [Google Scholar]
  6. Xiong, Z.; Song, Z.; Scalera, A.; Ferrera, E.; Sottile, F.; Brizzi, P.; Tomasi, R.; Spirito, M.A. Hybrid WSN and RFID indoor positioning and tracking system. EURASIP J. Embed. Syst. 2013, 2013, 6. [Google Scholar] [CrossRef] [Green Version]
  7. Nuradha, T.; Gnanarathne, I.; Perera, L.; Denipitiyage, D.; Dias, D. Beacon Placement Algorithm for Hybrid Indoor Positioning with Wi-Fi and Bluetooth Low Energy. In Proceedings of the 2019 Moratuwa Engineering Research Conference (MERCon), Moratuwa, Sri Lanka, 3–5 July 2019; pp. 135–140. [Google Scholar]
  8. Subhan, F.; Ahmed, S.; Haider, S.; Saleem, S.; Khan, A.; Ahmed, S.; Numan, M. Hybrid Indoor Position Estimation using K-NN and MinMax. KSII Trans. Internet Inf. Syst. 2019, 13. [Google Scholar] [CrossRef]
  9. Subhan, F.; Khan, A.; Saleem, S.; Ahmed, S.; Imran, M.; Asghar, Z.; Bangash, J.I. Experimental Analysis of Received Signals Strength in Bluetooth Low Energy (BLE) and its Effect on Distance and Position Estimation. In Transactions on Emerging Telecommunications Technologies; Willey: Hoboken, NJ, USA, 2019; p. e3793. [Google Scholar]
  10. Li, Z.; Xu, K.; Wang, H.; Zhao, Y.; Wang, X.; Shen, M. Machine-Learning-Based Positioning: A Survey and Future Directions. IEEE Netw. 2019, 33, 96–101. [Google Scholar] [CrossRef]
  11. Bahl, P.; Padmanabhan, V.N.; Bahl, V.; Padmanabhan, V. RADAR: An In-Building RF-Based User Location and Tracking System; IEEE: Tel Aviv, Israel, 2000. [Google Scholar]
  12. Brunato, M.; Battiti, R. Statistical learning theory for location fingerprinting in wireless LANs. Comput. Netw. 2005, 47, 825–845. [Google Scholar] [CrossRef] [Green Version]
  13. Farahiyah, D.; Romadhoni, R.M.; Pratomo, S.W. Navie Bayes Classifier for Indoor Positioning using Bluetooth Low Energy. In Proceedings of the 2018 Artificial Intelligence and Cloud Computing Conference, New York, NY, USA, 5 December 2018; pp. 181–185. [Google Scholar]
  14. Mo, Y.; Zhang, Z.; Lu, Y.; Meng, W.; Agha, G. Random forest based coarse locating and kpca feature extraction for indoor positioning system. Math. Probl. Eng. 2014, 2014, 850926. [Google Scholar] [CrossRef] [Green Version]
  15. Youssef, M.A.; Agrawala, A.; Shankar, A.U. WLAN Location Determination via Clustering and Probability Distributions. In Proceedings of the First IEEE International Conference on Pervasive Computing and Communications, Fort Worth, TX, USA, 23–26 March 2003; pp. 143–150. [Google Scholar]
  16. Youssef, M.; Agrawala, A. Handling samples correlation in the horus system. IEEE Infocom 2004, 2, 1023–1031. [Google Scholar]
  17. Roos, T.; Myllymäki, P.; Tirri, H.; Misikangas, P.; Sievänen, J. A probabilistic approach to WLAN user location estimation. Int. J. Wirel. Inf. Netw. 2002, 9, 155–164. [Google Scholar] [CrossRef]
  18. Mehmood, H.; Tripathi, N.K.; Tipdecho, T. Indoor positioning system using artificial neural network. J. Comput. Sci. 2010, 6, 1219. [Google Scholar] [CrossRef] [Green Version]
  19. Yim, J. Introducing a decision tree-based indoor positioning technique. Expert Syst. Appl. 2008, 34, 1296–1302. [Google Scholar] [CrossRef]
  20. Battiti, R.; Brunato, M.; Villani, A. Statistical Learning Theory for Location Fingerprinting in Wireless LANs; Technical Report; University of Trento: Trento, Italy, 2002. [Google Scholar]
  21. Deng, Z.A.; Xu, Y.B.; Wu, D. Indoor positioning in WLAN environment based on support vector regression and space partitioning. Adv. Mater. Res. Trans Tech Publ. 2011, 204, 1599–1602. [Google Scholar] [CrossRef]
  22. Vahidnia, M.H.; Malek, M.R.; Mohammadi, N.; Alesheikh, A.A. A hierarchical signal-space partitioning technique for indoor positioning with WLAN to support location-awareness in mobile map services. Wirel. Pers. Commun. 2013, 69, 689–719. [Google Scholar] [CrossRef]
  23. Xie, Y.; Wang, Y.; Nallanathan, A.; Wang, L. An improved K-nearest-neighbor indoor localization method based on spearman distance. IEEE Signal Process. Lett. 2016, 23, 351–355. [Google Scholar] [CrossRef] [Green Version]
  24. Wang, X.; Gao, L.; Mao, S.; Pandey, S. CSI-based fingerprinting for indoor localization: A deep learning approach. IEEE Trans. Veh. Technol. 2016, 66, 763–776. [Google Scholar] [CrossRef] [Green Version]
  25. Mika, S.; Ratsch, G.; Weston, J.; Scholkopf, B.; Mullers, K.R. Fisher Discriminant Analysis with Kernels. In Proceedings of the Neural Networks for Signal Processing IX: Proceedings of the 1999 IEEE Signal Processing Society Workshop (cat. no. 98th8468), Madison, WI, USA, 25–25 August 1999; pp. 41–48. [Google Scholar]
  26. Gill, S.S.; Tuli, S.; Xu, M.; Singh, I.; Singh, K.V.; Lindsay, D.; Tuli, S.; Smirnova, D.; Singh, M.; Jain, U.; et al. Transformative effects of IoT, Blockchain and Artificial Intelligence on cloud computing: Evolution, vision, trends and open challenges. Internet Things 2019, 8, 100118. [Google Scholar] [CrossRef] [Green Version]
Figure 1. Proposed System Architecture.
Sustainability 12 10627 g001
Figure 2. Flow Chart of The Proposed System Design.
Sustainability 12 10627 g002
Figure 3. Experimental setup for the proposed system.
Sustainability 12 10627 g003
Figure 4. Five different trajectories are used as test trajectories for performance evaluation. (a) Linear movement trajectory, (b) Zig-zag trajectory, (c) Forward-backwards trajectory, (d) Linear and non linear movement trajectory, (e) Partial linear movement with constant speed trajectory.
Sustainability 12 10627 g004aSustainability 12 10627 g004b
Table 1. Comparative analysis based on Accuracy.
ClassifiersTrajectory 1Trajectory 2Trajectory 3Trajectory 4Trajectory 5
Naive Bayes86.469.277.277.981.2
KNN, N = 183.860.371.269.065.9
SVM83.566.776.973.081.8
Decision Tree82.964.173.267.071.5
LDA87.172.177.378.581.7
Table 2. Comparative analysis based on execution time in milli-seconds.
ClassifiersTrajectory 1Trajectory 2Trajectory 3Trajectory 4Trajectory 5
Naive Bayes118.00131.00117.00117.00121.00
KNN, N = 10.050.050.050.050.05
SVM1.241.271.261.221.46
Decision Tree14.1314.6114.5014.4915.52
LDA9.309.279.169.279.60
Table 3. Comparison based on mean accuracy % and standard deviation.
ClassifiersMean Accuracy %Mean Standard Deviation
Naive Bayes78.385.62
KNN, N=170.047.79
SVM76.386.09
Decision Tree71.746.44
LDA79.344.96
Publisher’s Note: MDPI stays neutral with regard to jurisdictional claims in published maps and institutional affiliations.

