Article

Farm-Scale Biofuel Crop Adoption and Its Effects on In-Basin Water Balance

1
Faculty of Civil Engineering, Czech Technical University in Prague, 16000 Prague, Czech Republic
2
Department of Ecosystem Science and Management, Texas A&M University, College Station, TX 77843, USA
*
Author to whom correspondence should be addressed.
Sustainability 2020, 12(24), 10596; https://doi.org/10.3390/su122410596
Submission received: 30 November 2020 / Revised: 14 December 2020 / Accepted: 16 December 2020 / Published: 18 December 2020

Abstract

:
In the face of future climate change, Europe has encouraged the adoption of biofuel crops by its farmers. Such land-use changes can have significant impacts on the water balance and hydrological behavior of a system. While the heavy pesticide use associated with biofuel crops has been extensively studied, the water balance impacts of these crops have been far less studied. We conducted scenario analyses using the Soil and Water Assessment Tool (SWAT) to determine the effects of farm-scale biofuel crop adoption (rapeseed) on a basin’s water balance. We found that rapeseed adoption does not support the goal of developing a sustainable agricultural landscape in the Czech Republic. The adoption of rapeseed also had disproportionate effects on a basin’s water balance depending on its location in the basin. Additionally, discharge (especially surface runoff ratios), evapotranspiration, and available soil water content display significant shifts in the rapeseed adoption scenarios.

1. Introduction

Over the last several decades, land-use change and its impacts locally (physical soil quality) and regionally (basin hydrology and water balance) have been extensively studied [1,2,3,4,5,6,7,8]. Depending on the motivation, managers can make decisions concerning land-use changes that have big impacts on the hydrology of a system. Decisions to develop land, to deforest, to afforest, and to expand agriculture all have varying effects on water yield, soil storage capacity, surface runoff, and evapotranspiration in a basin [9]. While land-use changes from forests or pastures to cropland (and vice versa) have been extensively studied, fewer hydrological studies performed examine such effects based solely on crop changes [10,11,12,13,14].
Between efforts outlined by the EU’s biofuel directive (2003), the Kyoto Protocol (2005), the Paris Agreement (2016), and other EU directives (Renewable Energy (2009), Fuel Quality (2009), etc.) [15,16,17,18], the EU incentivizes the production of crops utilized for biofuels to reduce greenhouse gas (GHG) emissions. Such crop changes can have significant impacts on agricultural landscape processes and the water balance in a basin. Across crops, there are innumerable parameter changes that can affect the water processes in a system, including rooting zone depth, USLE C-factor (Universal Soil Loss Equation Cover-factor), canopy height, stomatal conductance, leaf area index (LAI), and many more [19]. Numerous previous studies have shown that each crop has distinctive water requirement patterns throughout a growing season and that crop selection can have significant impacts that vary based on local climatic conditions [20,21,22]. Even the water requirements for crops that are appropriate for the same climate can have significantly different water footprints and thus is something for a manager to consider when making the switch from a food crop to a biofuel crop, especially in the face of future climate change [23].
Intensive storm events are becoming increasingly frequent in Central Europe according to the Intergovernmental Panel on Climate Change (IPCC) [24]; however, inappropriate soil, water, and landscape management has decreased the water retention capacity of the landscape in the Czech Republic. In the Czech Republic, many small streams run dry during the summer while flash floods are becoming more common. Hence, Zelenakova et al. suggested restoring local water circulation within the landscape [25]. The two main objectives for the restoration of the water cycle in the landscape are (i) the restoration of drainage patterns with natural hydromorphology and (ii) the improvement of the water retention capacity across the landscape in the Czech Republic, i.e., water should infiltrate the soil at the same location where it falls as rain. In light of these projected climatic changes, it is more important than ever to predict how a highly agricultural landscape will respond to specific crop changes [24].
Being an intensively agricultural country with nearly 40% of its total land area arable, the Czech Republic benefits greatly from many EU agricultural incentives. The primary crop processed for biofuel production in the EU is rapeseed [26]; according to the Research Institute of Crop Production in the Czech Republic, it is also the most economically important biofuel crop in the Czech Republic [27]. Extreme pesticide use is associated with the production of biofuel crops, and the potential freshwater ecotoxicology impacts (PFEIs) of rapeseed cultivation can be up to 1000× greater per biofuel unit than other biofuel crops [28]. In addition to the water/air/soil contamination risks associated with extreme pesticide use, in the Czech Republic, rapeseed is also planted in a physically unsustainable way. Rapeseed is sown during the rainy season (August), and soil is intentionally compacted and rolled smooth, which can lead to extreme erosion events [29,30]. While previous studies have focused on the negative effects that rapeseed cultivation for biofuel can have on soil processes and water quality [28,29,31], it is the purpose of this study to assess the seasonal shifts in water balance at the farm-scale.
The Soil and Water Assessment Tool (SWAT) is a semi-distributed, semi-physically based, basin-scale hydrologic model [32,33]. SWAT divides a basin into hydrologic response units (HRUs), which are defined by unique combinations of soil types, slope classes, and land-uses. SWAT is the most popular hydrologic model in modern literature because it is open access and highly flexible since it is composed of hundreds of editable parameters [32,34,35]. SWAT has been able to effectively model basins from <1 km2 to basins on the continental scale and can be run on daily, monthly, or yearly timescales [36,37]. Due to its highly flexible nature, it is quite simple to run scenario analyses in SWAT whether they are climate change, land-use/cover change, or a combination [38]. While SWAT has been applied to basins all over the world, it has rarely been applied in the Czech Republic and never to assess the water balance impacts of rapeseed at the farm-scale, which is currently a hotly debated topic in the Czech Republic.
This study investigates the following questions: (i) How does a crop change from winter wheat to rapeseed affect the water balance in a small agricultural basin? (ii) Does the percent area change affect the water balance proportionally? (iii) How are the shifts in water balance affected at the daily, monthly, and seasonal timescales? (iv) How do these changes in water balance align with the goals of restoring local water circulation in a landscape?

2. Materials and Methods

2.1. Study Watershed

The basin selected for this study is the Nucice experimental catchment (“Nucice”); it is a small (0.52 km2) agricultural watershed in the Czech Republic (approximately 30 km from Prague; Figure 1). The basin’s outlet location is 49°57′49.230′′ N, 14°52′13.242′′ E. Nucice has been monitored by the Landscape Water Conservation Department of Czech Technical University in Prague since 2011. The climate in this region is humid continental with an average annual precipitation of approximately 600 mm and an average daily temperature of 7.9 °C [39]. The highest monthly precipitation occurs in June, with an average of 74.1 mm in rainfall, and the lowest occurs in February (18 mm), but the rainy season is typically from May through August. The lowest temperatures occur in January, with an average minimum daily temperature of −0.6 °C, and the highest temperatures occur in August, with an average maximum daily temperature of 19.2 °C.
Nucice is >95% agricultural, and its remaining <5% consists of a narrow riparian zone of brush, the streambed, and a paved single-lane road that bisects the basin horizontally (Figure 2). The soils here are classified as Luvisols and Cambisols that overlay sandstone and siltstone [40]. Based on a nearby geological borehole survey, the depth to the bedrock is estimated to range from 6 m to 20 m. The ground water level measured at the catchment is quite deep, having very rarely risen above the level of the streambed, and recharge is quite low especially during the growing season. The deep water-table suggests that stream discharge and the processes in the shallow part of the soil profile are not significantly influenced by groundwater. Nucice is divided into three fields that are managed by two farmers; the basin is drained by a channeled stream that begins in the upper field as a single tile drain. The average slope of Nucice is 3.9% but ranges from 1% to 12%. The basin is equipped with a meteorological station (measuring precipitation intensity, air temperature, humidity, wind speed, and solar radiation), and stream discharge is measured at the basin’s outlet using an H-flume with a capacity of up to 400 L·s−1.
Fields 1 and 2 are managed by the first farmer (“farmer A”), and field 3 is managed by the second farmer (“farmer B”) (Figure 2c). Fields 1 and 2 have been tilled conservatively since 2000, and field 3 has been tilled conservatively since 2013, with a maximum of 0.18 m of soil disturbance. The farmers in Nucice typically grow the cereal grain winter wheat but occasionally rotate with rapeseed or mustard. It is feasible that the farmers who manage Nucice may shift their primary crops to further benefit from various EU policies that incentivize biofuel crop production.

2.2. SWAT Model Description

SWAT is a very flexible and highly customizable model; it allows for hydrological modeling at varying timesteps from daily to annual. Since Nucice is very flashy and has only been monitored since 2011, a daily timestep was selected for SWAT modeling to determine whether SWAT could model the flashiness of the basin and so that enough data points would be available for calibration and validation. The stream definition was digital elevation model-based (DEM-based), and the extent that most closely reflected the actual channel was selected. The slope classes were defined by every 5% increase in slope, resulting in four classes (0–5%, 5–10%, 10–15%, and >15%; Figure 2b). Hydrologic response units (HRUs) were defined by each unique combination of soil type, slope class, and land-use types with >5% area coverage. The Penman–Monteith method was used for the calculation of potential evapotranspiration (PET) and the SCS (Soil Conservation Service) curve number method was used for the estimation of surface runoff. Generic parameters for a tile drainage system were integrated into the model and later refined during calibration. The model was run from 2014 through 2019, with a one-year warmup period in 2013.

2.3. Input Data

The soil map used was distributed by the State Land Office of the Czech Republic and includes basic soil physical properties (Figure 2a). The slopes in Nucice were divided into 4 classes as defined in SWAT according to the digital elevation model (DEM) (Figure 2b). The DEM was obtained from the fifth generation of the digital relief model of the Czech Republic (DMR5G) and is based on LiDAR (Light Detection and Ranging) surveys with a relative error of 0.18 m. The model point cloud was processed to obtain a 3 m spatial resolution. The DEM was used to delineate the watershed boundaries. The land-use map was composed by digitizing a detailed orthophoto map created during local unmanned aerial vehicle (UAV) surveys conducted by the Department of Landscape Water Conservation at Czech Technical University (Figure 2c and Table 1).
Daily precipitation and temperature data were downloaded from the on-site gauge (Table 1) and compared to data from 6 stations provided by the Climate Forecast System Reanalysis database (CFSR) to verify that the on-site gauge is not significantly different for the overlapping years (2011–2014). The data downloaded from CFSR 1976–2014 was then used as climate generator data that are used to fill in any missing data over the timespan of the SWAT model run.

2.4. SWAT Sensitivity Analysis, Calibration, Validation, and Performance Evaluation

The sensitivity analysis and calibration for the SWAT model of Nucice were conducted using the SUFI2 method in SWAT CUP (Calibration and Uncertainty Programs) 2019 [41]. A global sensitivity analysis was conducted to determine the most sensitive parameters according to model response. After outliers were removed from the observation dataset, the model was calibrated at a daily time step using daily average discharge from 2016–2018 and validated for 2019. Several iterations of over 2000 simulations were executed across 18 parameters (Table 2). The stream discharge during the vegetated seasons of each year (approximately 1 April through 31 October) were used for calibration and validation. The reasons for using only the vegetated seasons for calibration and validation are threefold: (i) when conducting scenario analyses in the Czech Republic, it is most important to assess the effects of land-use shifts during the vegetated season as the Czech Republic is a very agricultural country and water balance shifts will be most relevant during the growing season; (ii) the runoff regime during winter months differs greatly from the rest of the year as the soil is typically saturated and baseflow is common, meaning that a separate calibration/validation procedure would be necessary for winter; and (iii) much of the installed equipment is removed during the winter so it is not damaged by the freeze, making calibration/validation impossible during these periods.
The statistical criteria for model acceptance were based on Nash–Sutcliff efficiency (NSE > 0.4), percent bias (PBIAS < 10%), coefficient of determination (R2 > 0.4), and Kling–Gupta Efficiency (KGE > 0.5).

2.5. Scenario Analysis

Three scenarios in addition to the default conditions were determined based upon individual farmer adoption of rapeseed. The scenarios were defined as such so that the effects of farm-scale biofuel crop adoption could be observed and to determine if adoption area and location in the basin disproportionately affect water balance shifts. The percent area of crop change ranged from 6 to 96 depending on the scenario (Table 3). All crop parameters were kept to the respective crop’s default values outlined by SWAT except for those found in Table 4, which were calculated by local experts in local conditions (including crop strain, growing conditions, and climate) [30]. There are several differences in individual crop parameters and management practices that could result in water balance shifts between winter wheat and rapeseed cultivation. Rapeseed and winter wheat are seeded within a month of each other, but since rapeseed is planted earlier in the year and the soil is compacted to protect the seeds during the rainy season, this may make the soil more vulnerable to erosive events. The minimum USLE C-factors differ greatly between the two crops, and this indicates that rapeseed makes a landscape more susceptible to soil loss (Table 4). Rapeseed and winter wheat have similar rooting zone depths, with averages of 70 and 80 cm and maximums of 130 and 140 cm, respectively. Rapeseed and winter wheat also have similar optimal, minimal, and maximal temperature requirements, but winter wheat requires a higher sum temperature to harvest. Winter wheat has a higher maximum LAI (by +2.0 m2·m−2), indicating a higher rate of transpiration when compared to rapeseed [30].
The basic water balance output components (evapotranspiration (ET), surface runoff (SURQ), subsurface lateral flow (LATQ), available water capacity (SW), and discharge at the outlet (FLOW)) were evaluated across the three crop-change scenarios in addition to the default scenario. The average monthly values from April to October and their respective percent changes from the default scenario were calculated. Paired t-tests between the daily values for the water balance variables ET, SW, and FLOW were conducted to compare each rapeseed adoption scenario to the default scenario. For Scenarios 1 and 2, the values for these parameters were normalized against full rapeseed adoption (Scenario 3) to determine if area adoption had any significant influence on the water balance parameters. Finally, to assess shifts in SURQ and LATQ, the daily contribution ratios were calculated against the default scenario for each rapeseed adoption scenario.

3. Results

3.1. SWAT Model Sensitivity Analysis

According to the global sensitivity analysis, six parameters significantly influenced the modeled discharge flow out of the Nucice experimental basin (Table 5). The first significantly sensitive parameter is related to groundwater processes and local geomorphology. Groundwater delay (GW_DELAY) is the lag time between when water exits the soil profile and when water enters the shallow aquifer. Groundwater delay is dependent upon water table depth and geologic formations. Five of the six sensitive parameters are related to soil water processes. The deep aquifer percolation fraction (RCHRG_DP) is the fraction of percolation that recharges the deep aquifer from the root zone. The groundwater “revap” coefficient (GW_REVAP) is the ratio of water that may move from the shallow aquifer back into the unsaturated zone but is a parameter that is typically more sensitive in basins where the saturated zone is relatively shallow, and the land cover includes deep rooting vegetation. The depth to impervious layer parameter (DEP_IMP) parameter dictates a layer of soil with lower hydraulic conductivity than the layer(s) above it. This parameter facilitates greater subsurface flow in the basin and was included in this model because there is a tile drainage system in the Nucice experimental basin of which very little is known. Soil available water capacity (SOL_AWC) and saturated hydraulic conductivity (SOL_K) are both soil input parameters that dictate the ability of a soil to retain water for plant use and to infiltrate and drain water, respectively.

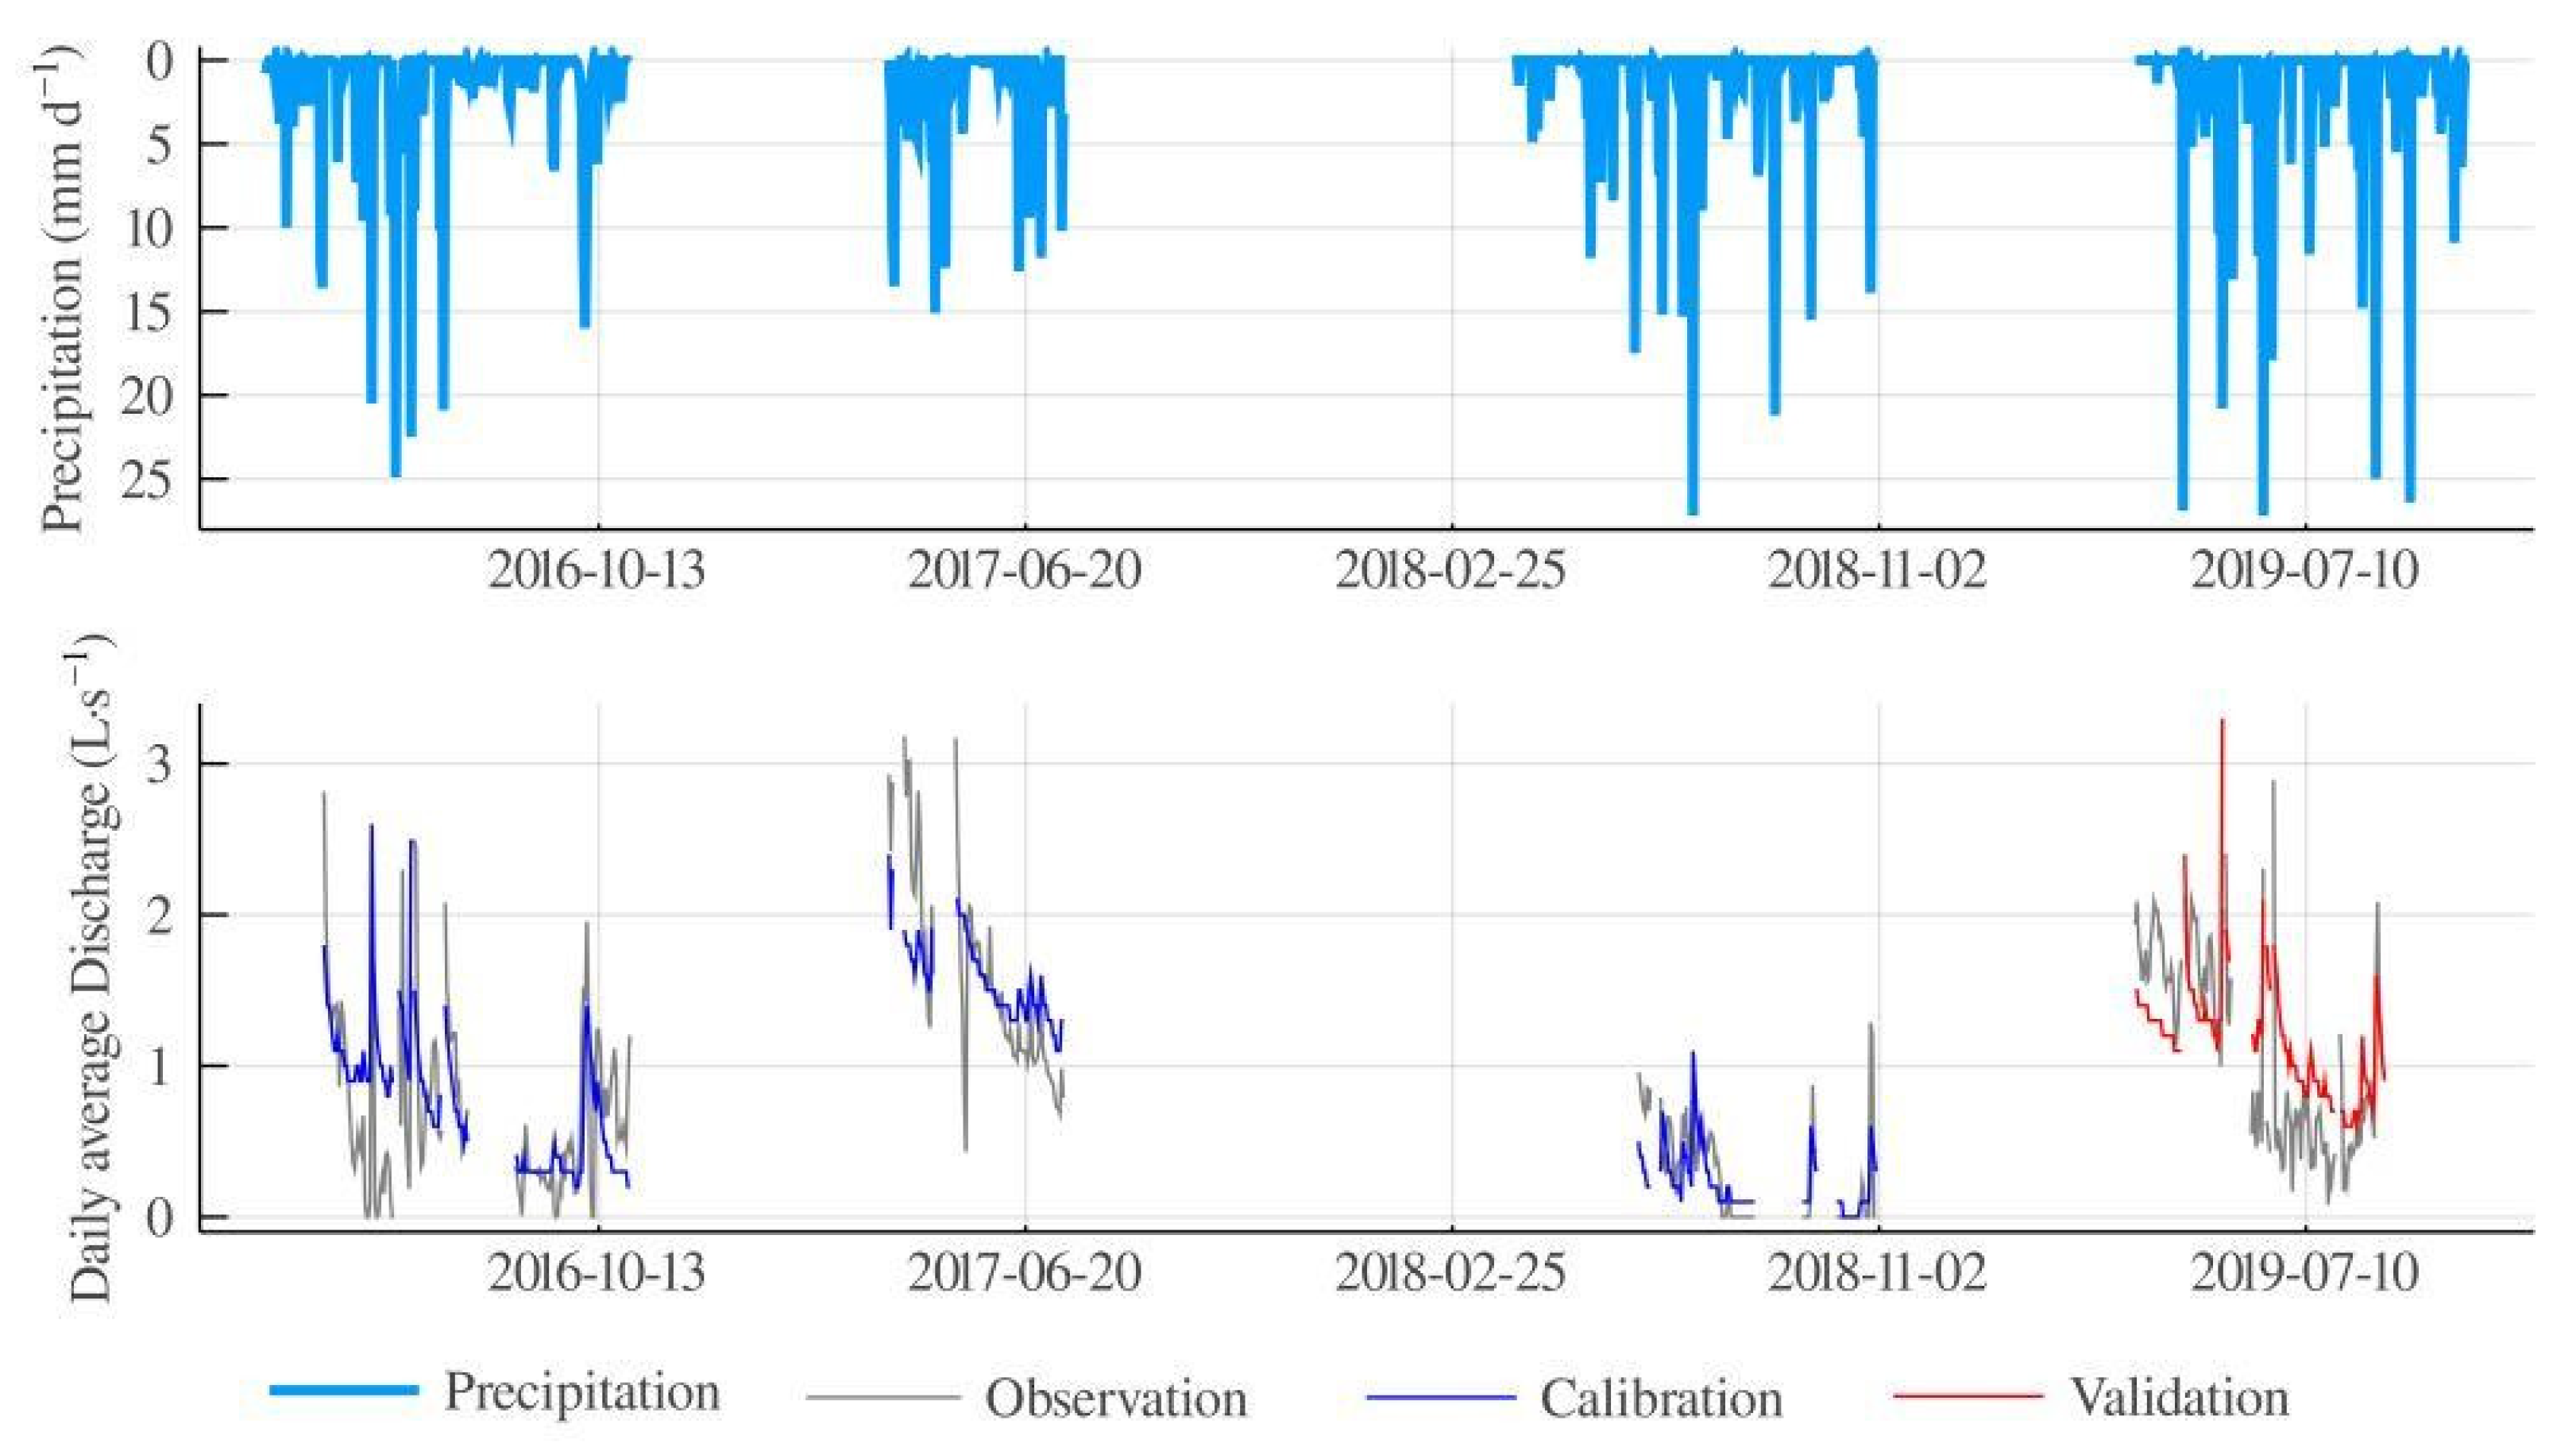
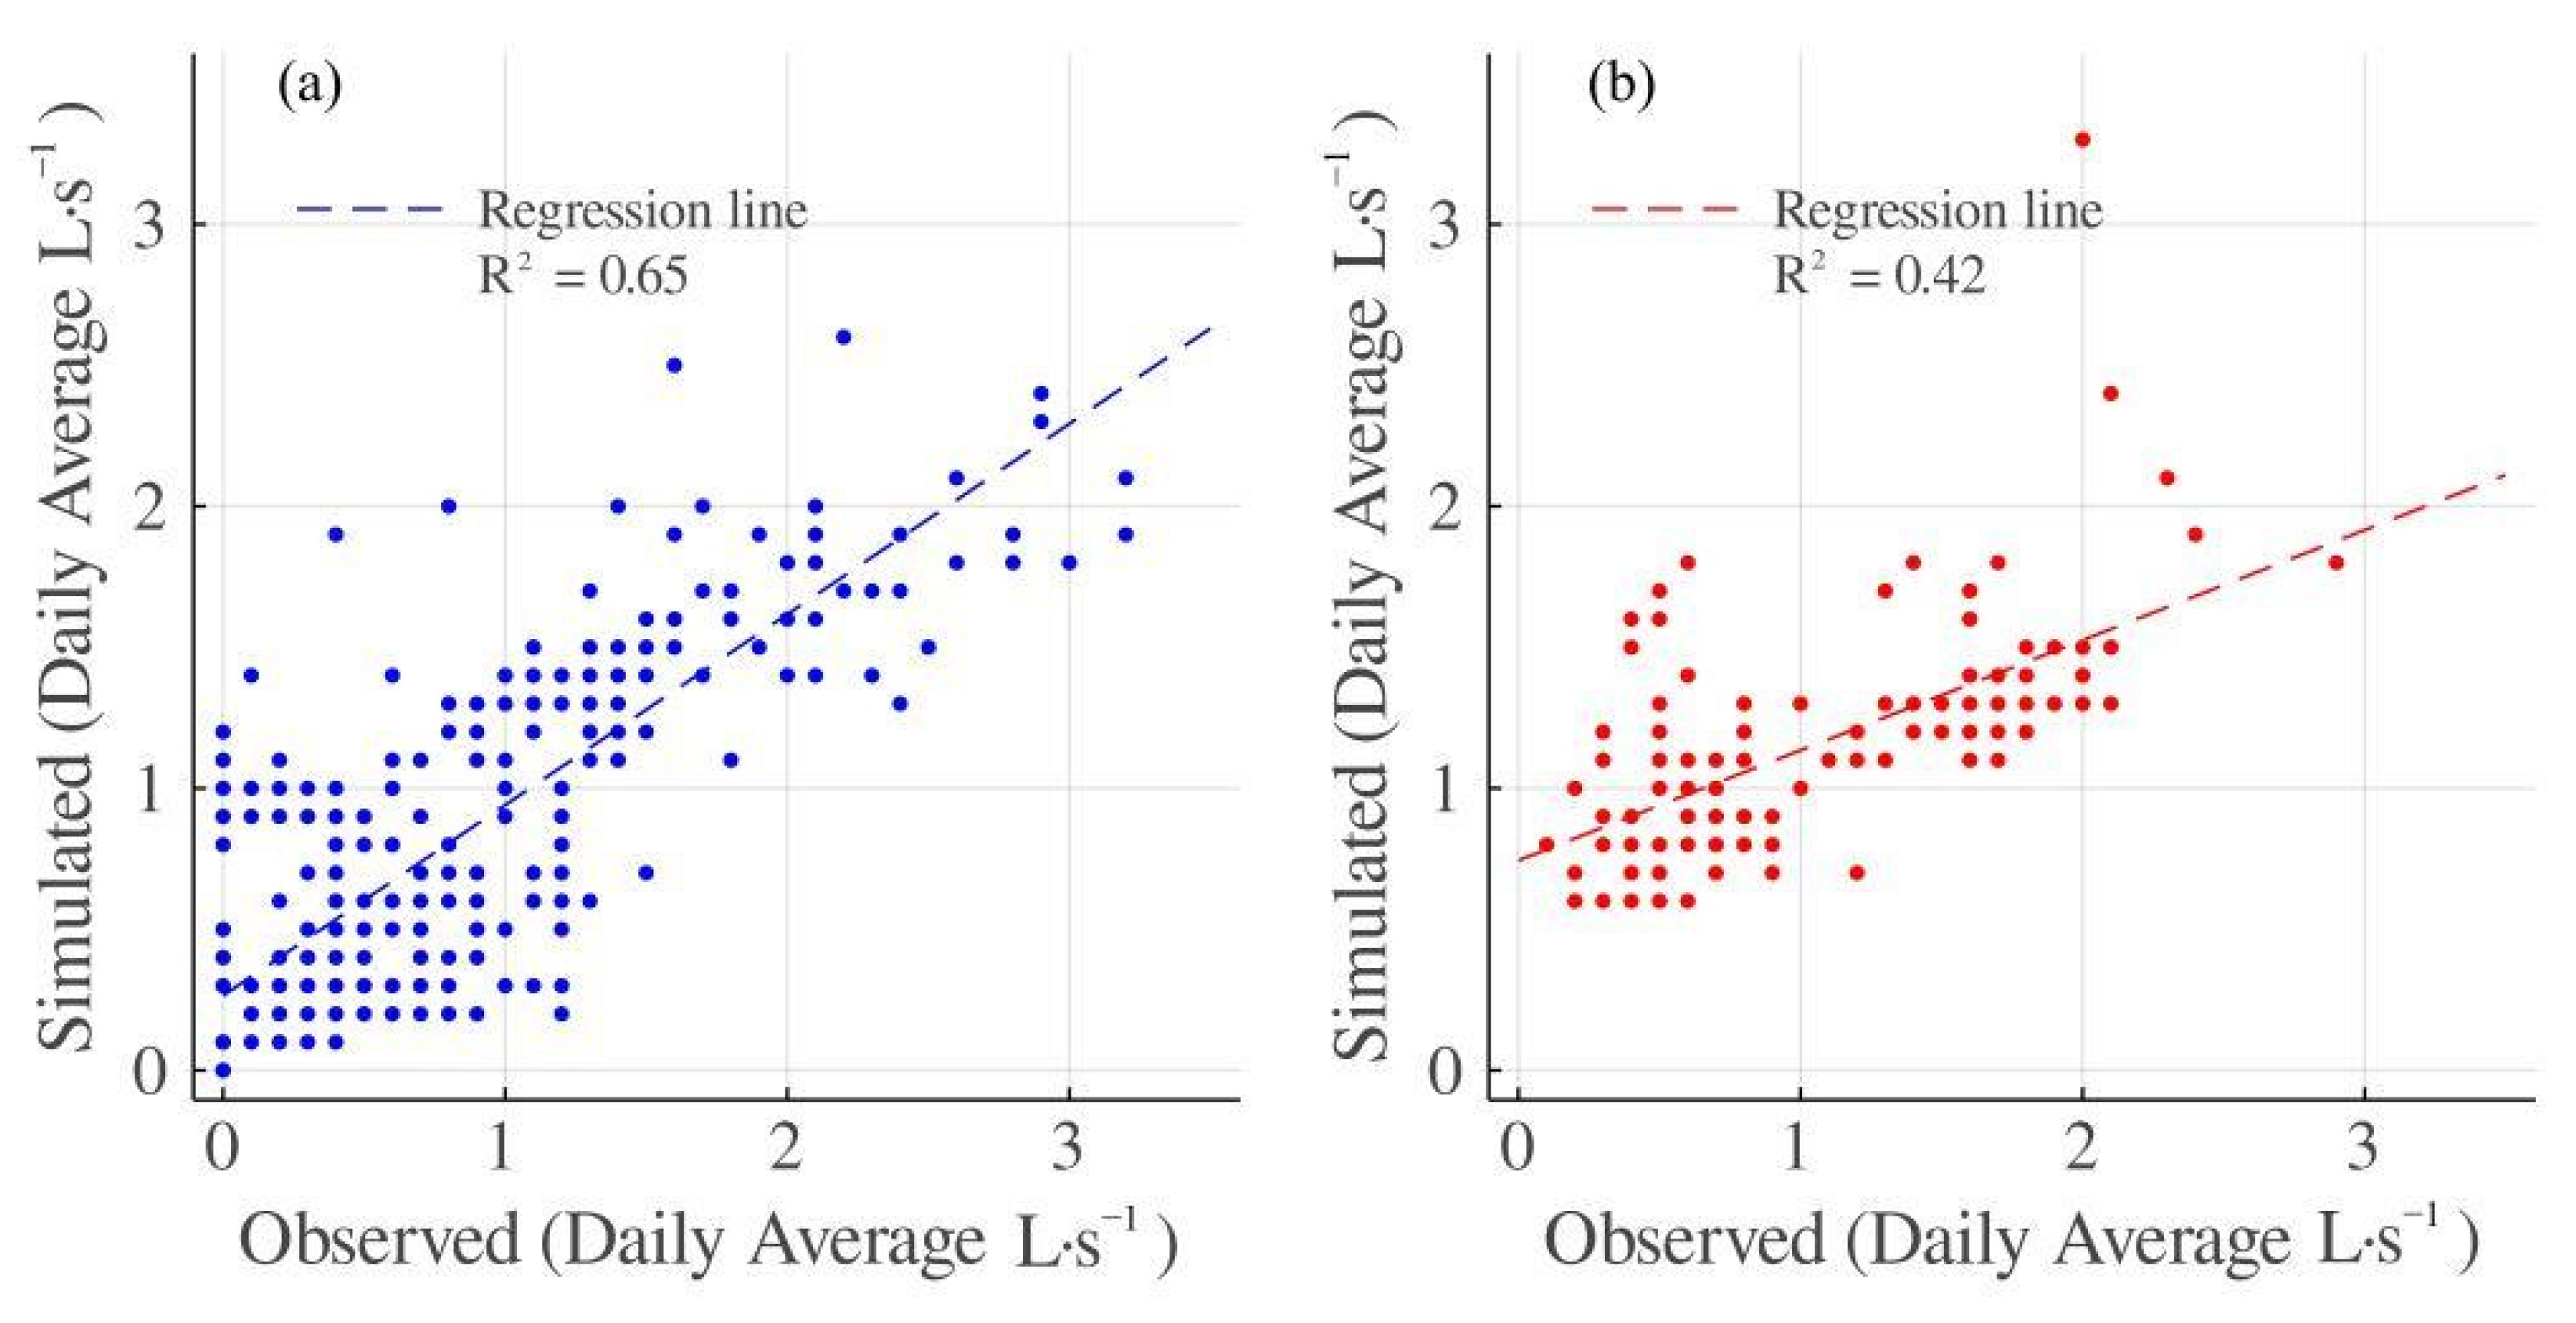
3.2. SWAT Model Calibration and Validation

Successful model calibration and validation was obtained via a semiautomatic calibration method (Table 6). The overall model fit for the calibration period is considered “good” while the fit for the validation period is considered “satisfactory” at a daily timescale [42]. The NSE, PBIAS, R2, and KGE are all considered good for calibration at the daily timescale (Table 6). During the validation period, the PBIAS is considered good and the other indicators are considered satisfactory. Overall, the calibrated and validated model fits are generally good, and the uncertainty reflected in the p-factor (0.55 and 0.71, respectively) and the r-factor (0.22 and 0.12, respectively) are satisfactory (Figure 3).
A correlation between observed and modeled discharges for the calibration and validation periods are presented in Figure 4a,b, respectively, along with a regression line for reference. Paired t-tests comparing modeled to observed discharge values (during both the calibration and validation periods) showed no significant differences (p > 0.05).

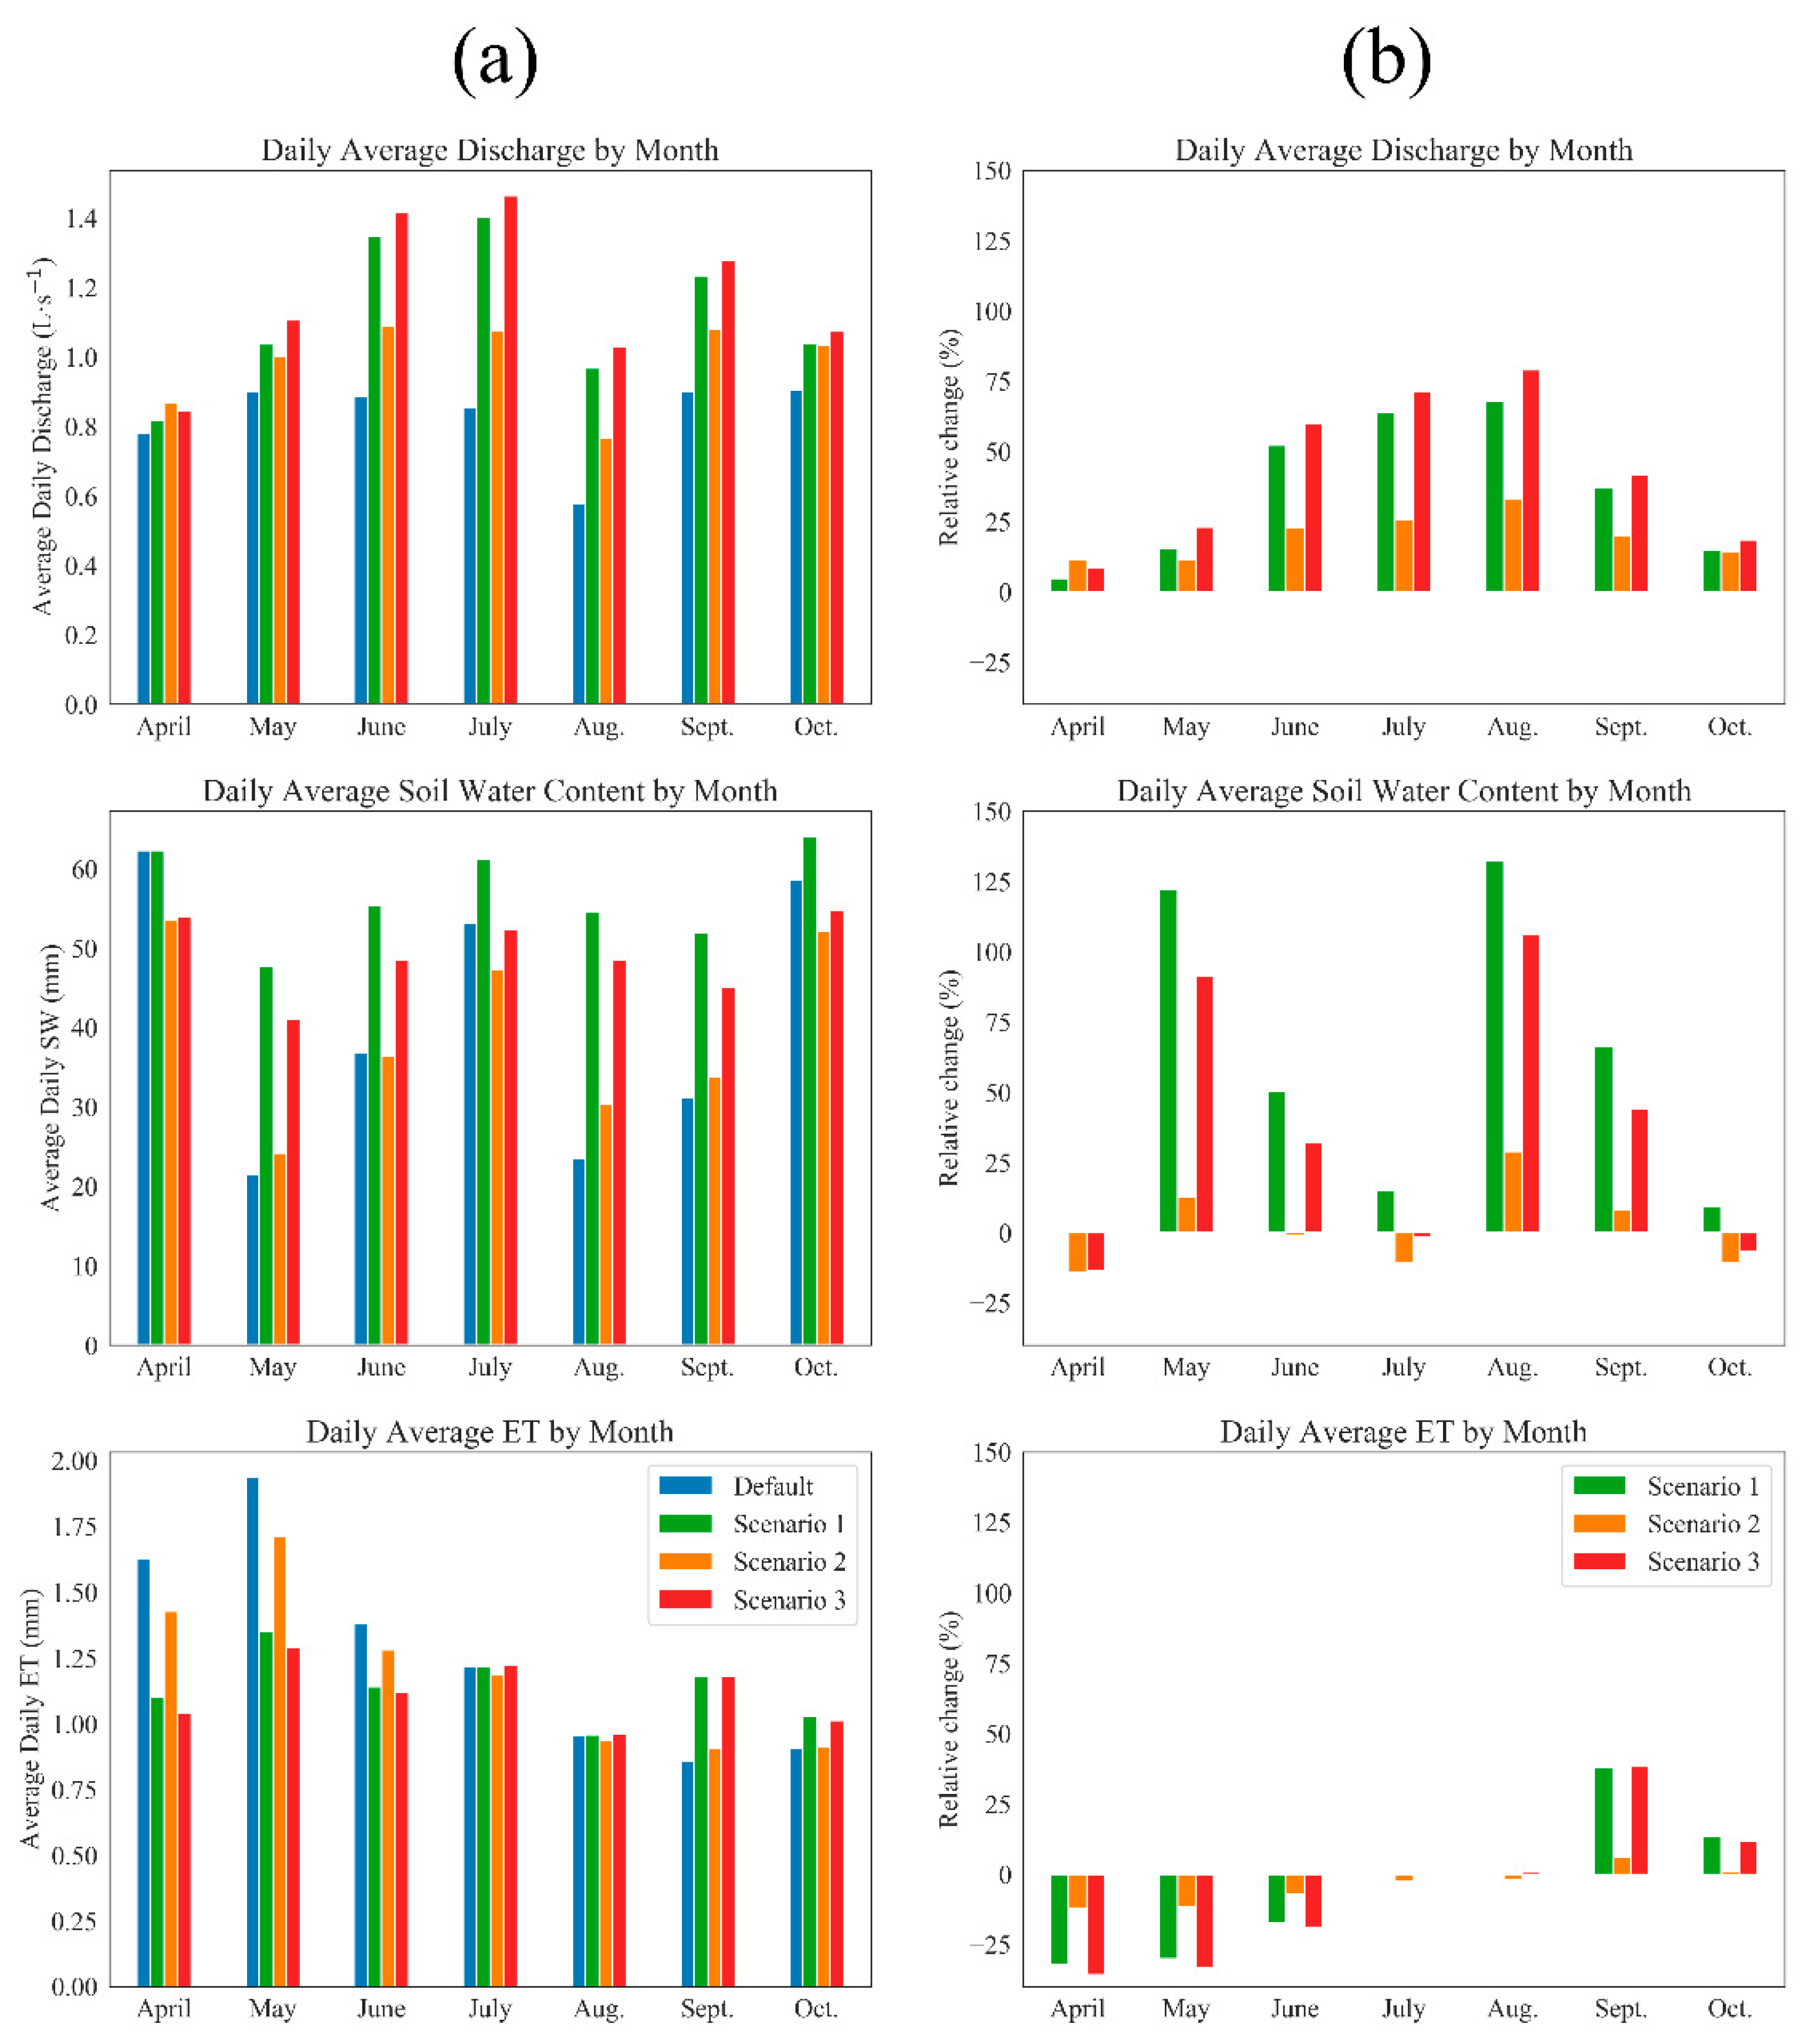
3.3. Crop Change Effects on Water Balance Parameters

The following daily basin water balance parameters were analyzed across crop change scenarios: evapotranspiration (ET), soil water content (SW), and stream discharge at the outlet (FLOW). Two sets of paired t-tests were conducted: firstly, to assess if there were significant basin-wide differences between each scenario and the default and, secondly, based on the percent area adoption in Scenarios 1 and 2 normalized by Scenario 3 (full adoption) and compared to the modeled scenario outputs to determine if percent adoption affected the water balance parameters proportionally. The conducted paired t-tests indicate significant changes in water balance variables across scenarios (Table 7). Evapotranspiration (mm·d−1) is significantly lower in the rapeseed scenarios when compared to the default winter wheat scenario. Stream discharge (average daily L·s−1) is significantly higher in the rapeseed scenarios. Soil water content (average daily mm) is significantly higher in rapeseed Scenario 1 but significantly lower in rapeseed Scenario 2. Once normalized for percent area change from winter wheat to rapeseed, there are significant changes in basin water balance parameters that are likely influenced by slope, soil type, location in the basin, and proximity to stream, indicating a multiplicative rather than additive effect based on area change.
In addition to the lumped daily analysis described above, the daily values were also sorted by month so that patterns throughout the growing season could be observed (Figure 5a). For all three rapeseed scenarios, ET decreased in April, May, and June and ranged from −7.2% to −35.9% but increased in September and October, ranging from +0.9% to +38.3%, when compared to the default scenario (Figure 5b). There does not seem to be significant differences in ET during the months of July and August. The basin’s average soil water content increased from May through October for Scenario 1, ranging from +9.4% to +132.5% when compared to the default scenario (the greatest % increase was observed in August during which the soil water content increased from 23.5 mm to 54.6 mm), but the average soil water content varied greatly for Scenario 2 across the same time period, ranging from −10.9% to +28.9%. In April, July, and October, substantial decreases in soil water content were observed in Scenario 2, ranging from −10.9% to −14.2%, when compared to the default scenario. Across the entire growing season, any adoption of rapeseed resulted in considerable discharge increases ranging from +5.7% to +180.5%. Lateral flow contribution to total water yield does not seem to be affected by rapeseed adoption, whereas surface runoff contribution to total water yield varied across time and percent adoption (Table 8). From April through September, surface runoff increased in rapeseed Scenario 1 from 1.02 to 4.15× the amount modeled in the default scenario, but in October, the surface runoff decreased to 12% of the default scenario. The largest increase in surface runoff in Scenario 2 was observed in June with 1.89× higher values than the default scenario. Since both Scenarios 1 and 2 are subsets of Scenario 3, Scenario 3 was used to determine if crop changes in Scenarios 1 and 2 provided proportional changes to water balance parameters.

4. Discussion

4.1. Hydrological Modeling with SWAT

In any hydrological model, there are four major sources of uncertainty: input data, model structural uncertainty, model parameter uncertainty, and output data uncertainty [43,44]. Although SWAT is one of the most widely used hydrological models in modern literature, it does have some limitations as well as the sources of uncertainty outlined above [44]. Since SWAT is semi-physically based, many inputs are calculated from equations or obtained from global or regional databases which can introduce uncertainty especially at this scale and SWAT is unable to truly represent physical runoff processes such as preferential flow [45,46]. Nucice has been equipped to monitor generalized processes at the basin’s outlet rather than more distributed, basin-wide processes. SWAT is unable to reflect the true flashiness in the observed discharge data. This may be due to some level of uncertainty in the pressure probe at Nucice which produces very “bouncy” discharge readings. The SWAT model of Nucice may also be improved with sub-hourly precipitation along with using the Green and Ampt Equation instead of the SCS curve number method to simulate infiltration, but this is not typically recommended with the current quality of soil data available [47,48,49]. However, overall, the fit of the SWAT model for the Nucice experimental basin ranges from “satisfactory” to “good” depending on model fit parameter selection, which is more than adequate for our scenario analyses, as many other studies have used SWAT to conduct scenario analyses on ungauged basins since relative changes between scenarios are typically of interest [50,51,52].

4.2. Water Balance Response to Crop Changes

The three parameters analyzed in this study that encompass basin water balance are evapotranspiration, soil water content, and stream discharge along with the relative ratios of surface runoff and subsurface lateral flow. Concerning water balance loses, springtime evapotranspiration was much lower in the rapeseed scenarios than the default winter wheat scenario (from −7.2% to −35.9%), but the opposite was true during the autumnal months (+0.9% to +38.3%), which is expected since rapeseed begins its growth cycle in the autumn as winter wheat is just being planted. Although evapotranspiration is typically highest in the default winter wheat scenario, throughout most of the year, this contributes to the goal of local water recycling rather than it being lost to discharge as in the rapeseed scenarios [25]. Daily average discharge was higher (by up to 180.5%) in all rapeseed scenarios when compared to the winter wheat scenarios. In the rapeseed scenarios, a greater proportion of discharge is composed of surface runoff (up to >4× higher); this could be due to a greater degree of interception by winter wheat due to its higher LAI. This higher proportion of surface runoff may lead to more soil erosion events in the summertime [53]. The fields are already more vulnerable to erosion events during summer for two reasons: (i) precipitation patterns (the summer months have higher precipitation rates, and the convective storms are more frequent than during the rest of the year) and (ii) seedbed conditions in the rapeseed fields [54]. Additionally, since increased levels of pesticide use are associated with biofuel crops in general, but especially rapeseed [28], these surface runoff events could lead to much greater pesticide runoff than the winter wheat scenarios, but such is not in the scope of this study. Average daily soil water content is generally much higher in the rapeseed scenarios over the default winter wheat scenario, which may make rapeseed a more appropriate crop in years of longer droughts, especially since the rapeseed scenarios also have generally lower rates of evapotranspiration. Average daily soil water content varies by scenario and is significantly lower than expected in Scenario 2 when normalized for percent area adoption. We expect that this might be due to higher than basin-average slopes and the close proximity to the streambed in field 3, which could also explain the significantly higher than expected total water yield in Scenario 2 [55].

4.3. Implications for Crop Management in the Czech Republic

The main goal of sustainable agricultural management in the Czech Republic is to build a landscape that restores local water circulation [25]. The substantial increases in discharge at Nucice’s outlet resulting from rapeseed adoption do not support this goal. The 400% increase observed in surface runoff also does not support this goal and may contribute to huge soil losses during large rainstorm events in the summertime. There are some disproportionate effects due to the location of adoption within the basin that greatly affect water balance and should be noted by basin managers who may be able to incentivize farmers to make certain management decisions by location and proximity to a basin’s outlet. This manuscript should initiate studies that upscale scenarios related to biofuel crop adoption, which is supported by governmental incentives, and its effects on water balance and water pollution in the Czech Republic.

5. Conclusions

This study shows that the SWAT model can be effectively used in the Czech Republic to determine the effects of crop change scenarios on key water balance parameter shifts and can be of future use to determine how and where governmental policies and subsidies should be applied, especially in the case of biofuel crop adoption. Discharge, soil water content, and surface runoff were all significantly higher when rapeseed was adopted in the basin. The increased discharge and surface runoff indicate a lesser degree of local water cycling than in the default winter wheat scenario and can also indicate higher potential soil losses from the landscape. Evapotranspiration in the winter wheat default scenario was typically higher than the rapeseed scenarios, which reinforces the local water cycle. It is possible that, in future climate change scenarios, rapeseed may be more beneficial in longer drought periods due to lower average transpiration and higher average soil water content than winter wheat scenarios, but further scenario analyses would need to be conducted at a larger scale in the Czech Republic.
We conclude that rapeseed crop adoption does not support the goal of establishing a sustainable agricultural landscape and does not reinforce the local water cycle. The results of this study can be used by local farmers to make decisions regarding their crop rotation and location of planting with respect to the field’s soil and slope properties as well as its proximity to the basin’s outlet. This study suggests that upscaling these modeling efforts in the Czech Republic is important and may be able to help shape public policy and to work as a decision-making tool for watershed managers.

Author Contributions

N.N. and T.D. conceived and designed the study; D.Z. and J.K. provided input data; N.N. developed and ran the SWAT model; N.N. and R.S. calibrated and validated the SWAT model; N.N. and T.L. ran statistical analyses; N.N. wrote the manuscript; N.N. and T.L. made the figures; T.D., T.L., D.Z., and J.K. edited the manuscript. All authors have read and agreed to the published version of the manuscript.

Funding

The presented research has been performed within project H2020 No. 773903 Shui, focused on water scarcity in European and Chinese cropping systems.

Conflicts of Interest

The authors declare no conflict of interest.

References

  1. David, J.S.; Henriques, M.O.; David, T.S.; Tomé, J.; Ledger, D.C. Clearcutting effects on streamflow in coppiced Eucalyptus globulus stands in Portugal. J. Hydrol. 1994, 162, 143–154. [Google Scholar] [CrossRef]
  2. Stednick, J.D. Monitoring the effects of timber harvest on annual water yield. J. Hydrol. 1996, 176, 79–95. [Google Scholar] [CrossRef]
  3. Neary, D.G.; Gottfried, G.J.; Folliott, P.F. Post-Wildfire Watershed Flood Responses. In Proceedings of the 2nd International Wildland Fire Ecology and Fire Management Congress, Orlando, FL, USA, 16–20 November 2003. [Google Scholar]
  4. Bruijnzeel, L.A. Hydrological functions of tropical forests: Not seeing the soil for the trees? Agric. Ecosyst. Environ. 2004, 104, 185–228. [Google Scholar] [CrossRef]
  5. Beck, H.E.; Bruijnzeel, L.A.; van Dijk, A.I.J.M.; McVicar, T.R.; Scatena, F.N.; Schellekens, J. The impact of forest regeneration on streamflow in 12 mesoscale humid tropical catchments. Hydrol. Earth Syst. Sci. 2013, 17, 2613–2635. [Google Scholar] [CrossRef] [Green Version]
  6. Wu, W.; Hall, C.A.S.; Scatena, F.N. Modelling the impact of recent land-cover changes on the stream flows in northeastern Puerto Rico. Hydrol. Process. 2007, 21, 2944–2956. [Google Scholar] [CrossRef]
  7. Bi, H.; Liu, B.; Wu, J.; Yun, L.; Chen, Z.; Cui, Z. Effects of precipitation and landuse on runoff during the past 50 years in a typical watershed in Loess Plateau, China. Int. J. Sediment Res. 2009, 24, 352–364. [Google Scholar] [CrossRef]
  8. Webb, A.A.; Kathuria, A. Response of streamflow to afforestation and thinning at Red Hill, Murray Darling Basin, Australia. J. Hydrol. 2012, 412–413, 133–140. [Google Scholar] [CrossRef]
  9. Zhang, M.; Liu, N.; Harper, R.; Li, Q.; Liu, K.; Wei, X.; Ning, D.; Hou, Y.; Liu, S. A global review on hydrological responses to forest change across multiple spatial scales: Importance of scale, climate, forest type and hydrological regime. J. Hydrol. 2017, 546, 44–59. [Google Scholar] [CrossRef] [Green Version]
  10. Bauer, A.; Black, A.L. Soil Carbon, Nitrogen, and Bulk Density Comparisons in Two Cropland Tillage Systems after 25 Years and in Virgin Grassland. Soil Sci. Soc. Am. J. 1981, 45, 1166–1170. [Google Scholar] [CrossRef]
  11. Franzluebbers, A.J.; Stuedemann, J.A.; Schomberg, H.H.; Wilkinson, S.R. Soil organic C and N pools under long-term pasture management in the Southern Piedmont USA. Soil Biol. Biochem. 2000, 32, 469–478. [Google Scholar] [CrossRef]
  12. Bewket, W.; Stroosnijder, L. Effects of agroecological land use succession on soil properties in Chemoga watershed, Blue Nile basin, Ethiopia. Geoderma 2003, 111, 85–98. [Google Scholar] [CrossRef]
  13. Breuer, L.; Huisman, J.A.; Keller, T.; Frede, H.-G. Impact of a conversion from cropland to grassland on C and N storage and related soil properties: Analysis of a 60-year chronosequence. Geoderma 2006, 133, 6–18. [Google Scholar] [CrossRef]
  14. Bronson, K.F.; Zobeck, T.M.; Chua, T.T.; Acosta-Martinez, V.; van Pelt, R.S.; Booker, J.D. Carbon and Nitrogen Pools of Southern High Plains Cropland and Grassland Soils. Soil Sci. Soc. Am. J. 2004, 68, 1695–1704. [Google Scholar] [CrossRef] [Green Version]
  15. European Commission. Directive 2003/30/EC of the European Parliament and of the Council of 8 May 2003. On the Promotion of the Use of Biofuels or other Renewable Fuels for Transport; European Communities: Luxembourg, 2003. [Google Scholar]
  16. European Commission. Biofuels in the European Union. A Vision for 2030 and Beyond; European Communities: Luxembourg, 2006; ISBN 92-79-01748-9. [Google Scholar]
  17. European Commission. Directive 2009/30/EC of the European Parliament and of the Council of 23 April 2009. Amending Directive 98/70/EC as Regards the Specification of Petrol, Diesel and Gas-Oil and Introducing a Mechanism to Monitor and Reduce Greenhouse Gas Emissions and Amending Council Directive 1999/32/EC as Regards the Specification of Fuel Used by Inland Waterway Vessels and Repealing Directive 93/12/EEC; European Communities: Luxembourg, 2009. [Google Scholar]
  18. European Commission. Directive 2009/28/EC of the European Parliament and of the Council of 23 April 2009. On the Promotion of the Use of Energy from Renewable Sources and Amending and Subsequently Repealing Directives 2001/77/EC and 2003/30/EC; European Communities: Luxembourg, 2009. [Google Scholar]
  19. Kiniry, J.R.; Williams, J.R.; Major, D.J.; Izaurralde, R.C.; Gassman, P.W.; Morrison, M.; Bergentine, R.; Zentner, R.P. EPIC model parameters for cereal, oilseed, and forage crops in the northern Great Plains region. Can. J. Plant Sci. 1995, 75, 679–688. [Google Scholar] [CrossRef]
  20. Siddique, K.H.M.; Regan, K.L.; Tennant, D.; Thomson, B.D. Water use and water use efficiency of cool season grain legumes in low rainfall Mediterranean-type environments. Eur. J. Agron. 2001, 15, 267–280. [Google Scholar] [CrossRef]
  21. Kar, G.; Kumar, A.; Martha, M. Water use efficiency and crop coefficients of dry season oilseed crops. Agric. Water Manag. 2007, 87, 73–82. [Google Scholar] [CrossRef]
  22. Siebert, S.; Döll, P. Quantifying blue and green virtual water contents in global crop production as well as potential production losses without irrigation. J. Hydrol. 2010, 384, 198–217. [Google Scholar] [CrossRef]
  23. Gerbens-Leenes, W.; Hoekstra, A.Y.; van der Meer, T.H. The water footprint of bioenergy. Proc. Natl. Acad. Sci. USA 2009, 106, 10219–10223. [Google Scholar] [CrossRef] [Green Version]
  24. Kovats, R.S.; Valentini, R.; Bouwer, L.M.; Georgopoulou, E.; Jacob, D.; Martin, E.; Rounsevell, M.; Soussana, J.F. Climate Change 2014: Impacts, Adaptation and Vulnerability. Part B: Regional Aspects; Barros, V.R., Field, C.B., Dokken, D.J., Mastrandrea, M.D., Mach, K.J., Bilir, T.E., Chatterjee, M., Ebi, K.L., Estrada, Y.O., Genova, R.C., et al., Eds.; Cambridge University Press: Cambridge, UK; New York, NY, USA, 2014. [Google Scholar]
  25. Zelenakova, M.; Fialová, J.; Negm, A.M. Assessment and Protection of Water Resources in the Czech Republic; Springer: Berlin/Heidelberg, Germany, 2020. [Google Scholar] [CrossRef]
  26. Flach, B.; Lieberz, S.; Bolla, S. Biofuels Annual Report; Global Agricultural Information Network (GAIN) Report NL9022; United States Department of Agriculture (USDA) Foreign Agricultural Service: Washington, DC, USA, 2019.
  27. Ministry of Agriculture of the Czech Republic. We Support Traditions and Rural Development in the Czech Republic; Ministry of Agriculture of the Czech Republic: Prague, Czech Republic, 2018; ISBN 978-80-7434-416-9.
  28. Nordborg, M.; Cederberg, C.; Berndes, G. Modeling potential freshwater ecotoxicity impacts due to pesticide use in biofuel feedstock production: The cases of maize, rapeseed, salix, soybean, sugar cane, and wheat. Environ. Sci. Technol. 2014, 48, 11379–11388. [Google Scholar] [CrossRef] [Green Version]
  29. van Zelm, R.; van der Velde, M.; Balkovic, J.; Čengić, M.; Elshout, P.M.F.; Koellner, T.; Núñez, M.; Obersteiner, M.; Schmid, E.; Huijbregts, M.A.J. Spatially explicit life cycle impact assessment for soil erosion from global crop production. Ecosyst. Serv. 2018, 30, 220–227. [Google Scholar] [CrossRef]
  30. Mistr, M. Determination of Crop and Management Factor Values to Intensify Soil Erosion Control in the Czech Republic; QJ1530181; VUMOP v.v.i.: Prague, Czech Republic, 2019. (In Czech) [Google Scholar]
  31. Cwalina-Ambroziak, B.; Stępień, A.; Kurowski, T.P.; Głosek-Sobieraj, M.; Wiktorski, A. The health status and yield of winter rapeseed (Brassica napus L.) grown in monoculture and in crop rotation under different agricultural production systems. Arch. Agron. Soil Sci. 2016, 62, 1722–1732. [Google Scholar] [CrossRef]
  32. Arnold, J.G.; Srinivasan, R.; Muttiah, R.S.; Williams, J.R. Large Area Hydrologic Modeling and Assessment Part I: Model Development. J. Am. Water Resour. Assoc. 1998, 34, 73–89. [Google Scholar] [CrossRef]
  33. Neitsch, S.L.; Arnold, J.G.; Kiniry, J.R.; Williams, J.R. Soil and Water Assessment Tool Theoretical Documentation; Texas Water Resources Institute: College Station, TX, USA, 2011. [Google Scholar]
  34. Gassman, P.W.; Reyes, M.R.; Green, C.H.; Arnold, J.G. The Soil and Water Assessment Tool: Historical Development, Applications, and Future Research Directions. Trans. ASABE 2007, 50, 1211–1250. [Google Scholar] [CrossRef] [Green Version]
  35. Melaku, N.D.; Renschler, C.S.; Holzmann, H.; Strohmeier, S.; Bayu, W.; Zucca, C.; Ziadat, F.; Klik, A. Prediction of soil and water conservation structure impacts on runoff and erosion processes using SWAT model in the northern Ethiopian highlands. J. Soils Sediments 2018, 18, 1743–1755. [Google Scholar] [CrossRef] [Green Version]
  36. Du, B.; Ji, X.; Harmel, R.D.; Hauck, L.M. Evaluation of a Watershed Model for Estimating Daily Flow Using Limited Flow Measurements. JAWRA J. Am. Water Resour. Assoc. 2009, 45, 475–484. [Google Scholar] [CrossRef]
  37. Brzozowski, J.; Miatkowski, Z.; Śliwiński, D.; Smarzyńska, K.; Śmietanka, M. Application of SWAT model to small agricultural catchment in Poland. J. Water Land Dev. 2011, 15, 719. [Google Scholar] [CrossRef]
  38. Peraza-Castro, M.; Ruiz-Romera, E.; Meaurio, M.; Sauvage, S.; Sánchez-Pérez, J.M. Modelling the impact of climate and land cover change on hydrology and water quality in a forest watershed in the Basque Country (Northern Spain). Ecol. Eng. 2018, 122, 315–326. [Google Scholar] [CrossRef]
  39. Hanel, M.; Mrkvičková, M.; Máca, P.; Vizina, A.; Pech, P. Evaluation of Simple Statistical Downscaling Methods for Monthly Regional Climate Model Simulations with Respect to the Estimated Changes in Runoff in the Czech Republic. Water Resour. Manag. 2013, 27. [Google Scholar] [CrossRef]
  40. Zumr, D.; Dostál, T.; Devátý, J. Identification of prevailing storm runoff generation mechanisms in an intensively cultivated catchment. J. Hydrol. Hydromech. 2015, 63, 246–254. [Google Scholar] [CrossRef] [Green Version]
  41. Arnold, J.G.; Moriasi, D.N.; Gassman, P.W.; Abbaspour, K.C.; White, M.J.; Srinivasan, R.; Santhi, C.; Harmel, R.D.; van Griensven, A.; van Liew, M.W.; et al. SWAT: Model Use, Calibration, and Validation. Trans. ASABE 2012, 55, 1491–1508. [Google Scholar] [CrossRef]
  42. Moriasi, D.N.; Arnold, J.G.; van Liew, M.W.; Bingner, R.L.; Harmel, R.D.; Veith, T.L. Model Evaluation Guidelines for Systematic Quantification of Accuracy in Watershed Simulations. Trans. ASABE 2007, 50, 885–900. [Google Scholar] [CrossRef]
  43. Tuppad, P.; Douglas-Mankin, K.R.; Lee, T.; Srinivasan, R.; Arnold, J.G. Soil and Water Assessment Tool (SWAT) Hydrologic/Water Quality Model: Extended Capability and Wider Adoption. Trans. ASABE 2011, 54, 1677–1684. [Google Scholar] [CrossRef]
  44. Nyeko, M. Hydrologic Modelling of Data Scarce Basin with SWAT Model: Capabilities and Limitations. Water Resour. Manag. 2015, 29, 81–94. [Google Scholar] [CrossRef]
  45. Beven, K. How far can we go in distributed hydrological modelling? Hydrol. Earth Syst. Sci. Discuss. Eur. Geosci. Union 2001, 5, 1–12. [Google Scholar] [CrossRef]
  46. Martínez-Retureta, R.; Aguayo, M.; Stehr, A.; Sauvage, S.; Echeverría, C.; Sánchez-Pérez, J.-M. Effect of Land Use/Cover Change on the Hydrological Response of a Southern Center Basin of Chile. Water 2020, 12, 302. [Google Scholar] [CrossRef] [Green Version]
  47. Geza, M.; McCray, J.E. Effects of soil data resolution on SWAT model stream flow and water quality predictions. J. Environ. Manag. 2008, 88, 393–406. [Google Scholar] [CrossRef]
  48. Daggupati, P.; Douglas-Mankin, K.R.; Sheshukov, A.Y.; Barnes, P.L.; Devlin, D.L. Field-Level Targeting Using SWAT: Mapping Output from HRUs to Fields and Assessing Limitations of GIS Input Data. Trans. ASABE 2011, 54, 501–514. [Google Scholar] [CrossRef]
  49. Chaplot, V. Impact of spatial input data resolution on hydrological and erosion modeling: Recommendations from a global assessment. Phys. Chem. Earth Parts A/B/C 2014, 67–69, 23–35. [Google Scholar] [CrossRef]
  50. Qi, J.; Zhang, X.; Yang, Q.; Srinivasan, R.; Arnold, J.G.; Li, J.; Waldholf, S.T.; Cole, J. SWAT ungauged: Water quality modeling in the Upper Mississippi River Basin. J. Hydrol. 2020, 584, 124601. [Google Scholar] [CrossRef]
  51. Jodar-Abellan, A.; Valdes-Abellan, J.; Pla, C.; Gomariz-Castillo, F. Impact of land use changes on flash flood prediction using a sub-daily SWAT model in five Mediterranean ungauged watersheds (SE Spain). Sci. Total Environ. 2019, 657, 1578–1591. [Google Scholar] [CrossRef]
  52. Qi, J.; Li, S.; Bourque, C.P.-A.; Xing, Z.; Meng, F.-R. Developing a decision support tool for assessing land use change and BMPs in ungauged watersheds based on decision rules provided by SWAT simulation. Hydrol. Earth Syst. Sci. 2018, 22, 3789–3806. [Google Scholar] [CrossRef] [Green Version]
  53. Pitman, J.I. Rainfall interception by bracken in open habitats—Relations between leaf area, canopy storage and drainage rate. J. Hydrol. 1989, 105, 317–334. [Google Scholar] [CrossRef]
  54. Krasa, J.; Dostal, T.; Zumr, D.; Tejkl, A.; Bauer, M. Recent Trends in Crop Rotation in the Czech Republic and Associated Soil Erosion Risks. In Proceedings of the 22nd European Geological Union General Assembly, Vienna, Austria, 4–8 May 2020. [Google Scholar]
  55. Salsabilla, A.; Kusratmoko, E. Assessment of soil erosion risk in Komering watershed, South Sumatera, using SWAT model. AIP Conf. Proc. 2017, 1862. [Google Scholar] [CrossRef] [Green Version]
Figure 1. (a) Map of the Czech Republic with Prague and Nucice (the study watershed) highlighted for reference and (b) a 3 m resolution digital elevation model (DEM) of Nucice and its immediate surroundings along with field IDs, channel, gauging station, and weather station.
Sustainability 12 10596 g001
Figure 2. (a) Soil map, (b) slope map, and (c) land use map (with field IDs) of Nucice.
Sustainability 12 10596 g002
Figure 3. Calibration and validation of daily average flow in Nucice during the growing seasons from 2016–2019.
Sustainability 12 10596 g003
Figure 4. Observed daily average flows versus modeled daily average flows for (a) calibration period and (b) validation period.
Sustainability 12 10596 g004
Figure 5. (a) Average daily water balance parameters across the growing season comparing the default scenario values to those of Scenarios 1–3 and (b) the relative percent change of each parameter in each scenario.
Sustainability 12 10596 g005
Table 1. Input variables used for Soil and Water Assessment Tool (SWAT) modeling.
Input DataDescriptionSource
Meteorological DataExtreme TemperaturesMinimum and maximum daily temperatures
(2011–2019)
On-site:
107 Temperature Probe (Campbell Sci., UK)
PrecipitationTotal daily precipitation (2011–2019)On-site: MR3-01s Tipping Bucket
(Meteo Servis, Czech Republic)
Spatial DataDEMDigital elevation model
(3 m resolution)
LiDAR Survey: Czech Institute of Geodesy and Cartography
Soil TypeSoil map of the Czech Republic 1:5000State Land Office of the Czech Republic
Land UseDigitized from detailed orthophotoUAV Survey: Czech Technical University
Table 2. The parameters used for model calibration in SWAT CUP along with their degree of sensitivity (V: replace, A: absolute, R: relative, and * p < 0.05).
ParameterDefinitionFileMethodMinMax
ESCOSoil evaporation compensation factorbsnV0.50.95
SURLAGSurface runoff lag coefficient (days)bsnV0.00115
ALPHA_BFBase flow recession constant (days)gwV0.0011
RCHRG_DP *Deep aquifer percolation fractiongwV0.0011
GW_DELAY *Delay time for aquifer recharge (days)gwA−4560
GW_REVAP *Groundwater revap coefficientgwV0.020.2
GWQMNThreshold water level in shallow aquifer for base flow (mm)gwA−20002000
OV_NManning’s n value for overland flowhruV0.050.8
DEP_IMP *Depth to impervious layer in soil profile (mm)hruA−15004000
SLSOILSlope length for lateral subsurface flow (m)hruR−0.250.25
CN2Initial SCS curve number for moisture condition IImgtR−0.20.2
DDRAIN_BSNDepth to subsurface drain (mm)mgtA−500500
TDRAIN_BSNTime to drain soil to field capacity (hours)mgtA−4040
GDRAIN_BSNDrain tile lag time (hours)mgtA−4040
CH_N2Manning’s n for main channelrteV0.020.14
SOL_AWC *Available water capacitysolR−0.750.75
SOL_K *Saturated hydraulic conductivity (mm·h−1)solR−0.50.5
CH_K1Effective hydraulic conductivity of channel (mm·h−1)subV0.025150
Table 3. Scenario IDs, crops planted by each farmer, and percent area of basin change from winter what to rapeseed.
Scenario IDFarmer AFarmer BPercent Basin Change
DefaultWinter WheatWinter Wheat0
S1RapeseedWinter Wheat90
S2Winter WheatRapeseed6
S3RapeseedRapeseed96
Table 4. Adjusted crop parameters from default SWAT values.
ParameterWinter Wheat (WWHT)Rapeseed (CANP)
DefaultAdjustedDefaultAdjusted
Max Rooting Depth (m)1.31.40.91.3
Max LAI (m2·m−2)4.05.03.53.0
Min USLE C-Factor0.030.050.200.10
Table 5. Sensitive parameters and their calibrated (adjusted) values. (V: replace, A: absolute, and R: relative).
ParameterMethodCalibration Values
Minimum ValueAdjusted ValueMaximum Value
Groundwater “revap” coefficientV0.020.0860.2
Deep aquifer percolation fractionV0.0010.481
Delay time for aquifer recharge (days)A−45−32.3160
Depth to impervious layer in soil profile (mm)A−15003036.74000
Available water capacity (mm)R−75%−59%+75%
Saturated hydraulic conductivity (mm·h−1)R−50%25%+50%
Table 6. Model performance indicator values for calibration and validation periods of SWAT model.
Model Performance IndicatorCalibration (2016–2018)Validation (2019)
NSE0.650.40
PBIAS−0.3%−6.7%
R20.650.42
KGE0.750.47
p-factor0.550.71
r-factor0.220.12
Table 7. Key basin water balance parameters, their daily average values (2014–2017), and their significance when compared to the default scenarios and when normalized against full rapeseed adoption in Scenario 3 (normal); (** p < 0.001). (ET: evapotranspiration, SW: available soil water content, and FLOW: average daily discharge).
ParameterDefaultScenario 1Scenario 2Scenario 3
ModeledNormalModeledNormalModeled
ET (mm·d−1)1.271.14 **1.41 **1.20 **1.13 **1.12 **
SW (mm)40.9656.72 **48.04 **39.62 **41.43 **49.15 **
FLOW (L·s−1)0.8291.120 **1.088 **0.989 **0.846 **1.129 **
Table 8. Surface runoff ratios for each scenario (S1–S3) when compared to the default scenario: a value closer to 1.0 reflects minimal differences comparing the crop change scenarios to the default scenario. The further the value is from 1.0, the greater the impact due to the respective crop change scenario. (SURQ: surface runoff; LATQ: subsurface lateral flow).
MonthSURQLATQ
S1S2S3S1S2S3
April2.831.342.421.031.011.03
May1.431.021.511.001.000.99
June4.151.894.041.091.031.10
July1.931.121.841.001.000.99
Aug1.141.051.071.021.011.01
Sept1.141.041.071.011.011.01
Oct0.120.840.011.021.011.01
Publisher’s Note: MDPI stays neutral with regard to jurisdictional claims in published maps and institutional affiliations.

